A novel virtual material layer model for predicting natural frequencies of composite bolted joints
Yu YANG, Hui CHENG,*, Bio LIANG, Di ZHAO, Junshn HU,Kifu ZHANG
a School of Mechanical Engineering, Northwestern Polytechnical University, Xi’an 710072, China
b College of Mechanical and Electrical Engineering, Nanjing University of Aeronautics and Astronautics, Nanjing 210016, China
Received 14 February 2020; revised 2 April 2020; accepted 9 May 2020 Available online 24 June 2020
KEYWORDS Composite joints;Fractal theory;Mechanical model;Natural frequency;Virtual material layer
Abstract A novel virtual material layer model based on the fractal theory was proposed to predict the natural frequencies of carbon fiber reinforced plastic composite bolted joints. Rough contact surfaces of composite bolted joints are modeled with this new proposed approach. Numerical and experimental modal analyses were conducted to validate the effectiveness of the proposed model. A good consistence is noted between the numerical and experimental results. To demonstrate the necessity of accurately modeling the rough contact surfaces in the prediction of natural frequencies, virtual material layer model was compared with the widely used traditional model based on the Master-Slave contact algorithm and experiments, respectively. Results show that the proposed model has a better agreement with experiments than the widely used traditional model(the prediction accuracy is raised by 8.77% when the pre-tightening torque is 0.5 N∙m). Real contact area ratio A* of three different virtual material layers were calculated. Value of A* were discussed with dimensionless load P*, fractal dimension D and fractal roughness G. This work provides a new efficient way for accurately modeling the rough contact surfaces and predicting the natural frequencies of composite bolted joints, which can be used to help engineers in the dynamic design of composite materials.
1. Introduction
Composite materials have been widely used in the advanced engineering fields such as aviation industry due to their high strength-to-weight and stiffness-to-weight ratio.1–3The prevailing joint types of composite structures are bolted joints,4riveted joints5and adhesive bonded joints6, among which bolted joints can be readily inspected before assembly and in service. Thus, bolted joints are applied greatly in aviation products.7It is known that interference-fit joints can introduce residual compressive stress around the holes,which can significantly enhance joints’performance.8However,when the composite interference-fit joints are in service, they are tending to be exposed to extreme environments like bending,9vibration,10static fatigue,11impact loading,12thermal environment,13hygrothermal aging,14and seawater aging.15Damages caused by vibration loads may weaken the strength of interferencefit joints and affect the dynamic properties of the structure,which would impair the structure integrity.
With the development of numerical techniques, dynamic properties could be predicted with the aid of commercial finite element software like ABAQUS.16However, the contact surfaces of two composite plates are not completely smooth but rather rough. They cannot be well modelled in the available finite element software where the perfect contact is generally assumed. If microstructure is explicitly considered in the model,the computation time would increase sharply,in particular for large-scale structures. In order to solve these two dilemmas,a new model,which has the virtues of both time saving and precision maintaining, is in demand.
Virtual material layer model, proposed in recent years, has been adopted by many researchers to model the properties of contact rough surface and predict the dynamic properties. It considers the two rough contact surfaces as an isotropic virtual material layer that could be a good representation of the rough contact surfaces.For example,Tian,et al.17developed an analytic model of virtual material hypothesis-based dynamic modeling on fixed joint interface in machine tools to improve the modeling accuracy of whole machine tools. Liao et al.18proposed a virtual gradient material model to model the bolted joint in CNC (Computerized Numerical Control) machine tools. Zhao et al.19developed a nonlinear virtual material model based on surface contact stress to describe the dynamic performance of the bolted assembly. However, the virtual material layer models proposed by these researchers were for metal materials and can’t be applied directly for composite materials.
The virtual material layer model mentioned above is based on the fractal theory.17–19Fractal theory can characterize rough surfaces independent of the resolution and sampling length of the measuring instruments.20Hertz firstly proposed the basic contact theory, which formed the base of the fractal theory. Mujumdar and Bhutan proposed a fractal model (called MB model) of elastic–plastic contact between rough surfaces.21The MB model has been commonly adopted in different contact situations since it was proposed.22–24
In this paper, a novel virtual material layer model based on the fractal theory was proposed to predict the natural frequencies of carbon fiber reinforced plastic (CFRP) composite bolted joints. Rough contact surfaces of the bolted joints were modeled as virtual material layers. Surface profiles were measured to obtain the fractal parameters.Numerical simulation and experimental modal tests were both conducted to validate the model and to verify the necessity of considering the rough contact surfaces. Parameters related to the virtual material model were discussed as well.
2. Virtual material layer model
2.1.Total normal contact load of the virtual material layer based on improved fractal theory
Surfaces of carbon fiber reinforced plastic composite plates are rough at microscale.20Fig.1 shows a scanning electron microscope (SEM) image of asperities on a composite laminate and corresponding equivalent shape of an asperity.It can be found that resins attached to the fibers form the asperities and the shape of a single asperity is an approximate hemi-sphere.
According to the SEM image and available literatures, following assumptions are adopted to simplify the analysis: (1)The surface topography of an un-deformed asperity at its summit is a hemi-sphere with a radius of R25; (2) The coupling effects between normal and shear tractions are negligible25;(3) Force acting on each asperity is proportional to the size of its real contact area. (4) The normal contact load is small and most asperities undergo elastic deformation.
In general, contact of two rough surfaces can be simplified as a rigid plane and a rough surface which containing asperities.26Thus, two contact asperities can be equivalent to a hemi-sphere asperity in contact with a rigid plane (Fig. 2),forming a real contact area a (radius r) and a truncated area a’ (radius r’). It is worth noting that truncated area a’ is cross section of the un-deformed asperity truncated by the rigid plane.
In Fig.2(b),l is the diameter of the truncated area and δ is deformation of a single asperity under normal load p21:

where D and G represent the fractal dimension and fractal roughness, respectively.
As the truncated area is a cycle shape, its area a’ can be computed as:

Substituting Eq.(2)into Eq.(1),then the deformation δ can be obtained:

As the assumption shape of the asperities is a hemi-sphere(Fig. 2(b)), radius expression in MB model could no longer be used to calculate the asperity radius R.Therefore,the asperity radius need to be re-derived. In Fig. 2(b), according to Pythagorean Theorem, R2=(R-δ)2+(l/2)2. Then l2-=8Rδ-4δ2can be derived.Noting that δ ≪R,the quadratic term can be omitted. Thus, l2can be approximated as:

Substituting Eq.(4)into Eq.(2),the truncated area a’can be written as

Therefore, radius of the asperity R can be derived as follows:

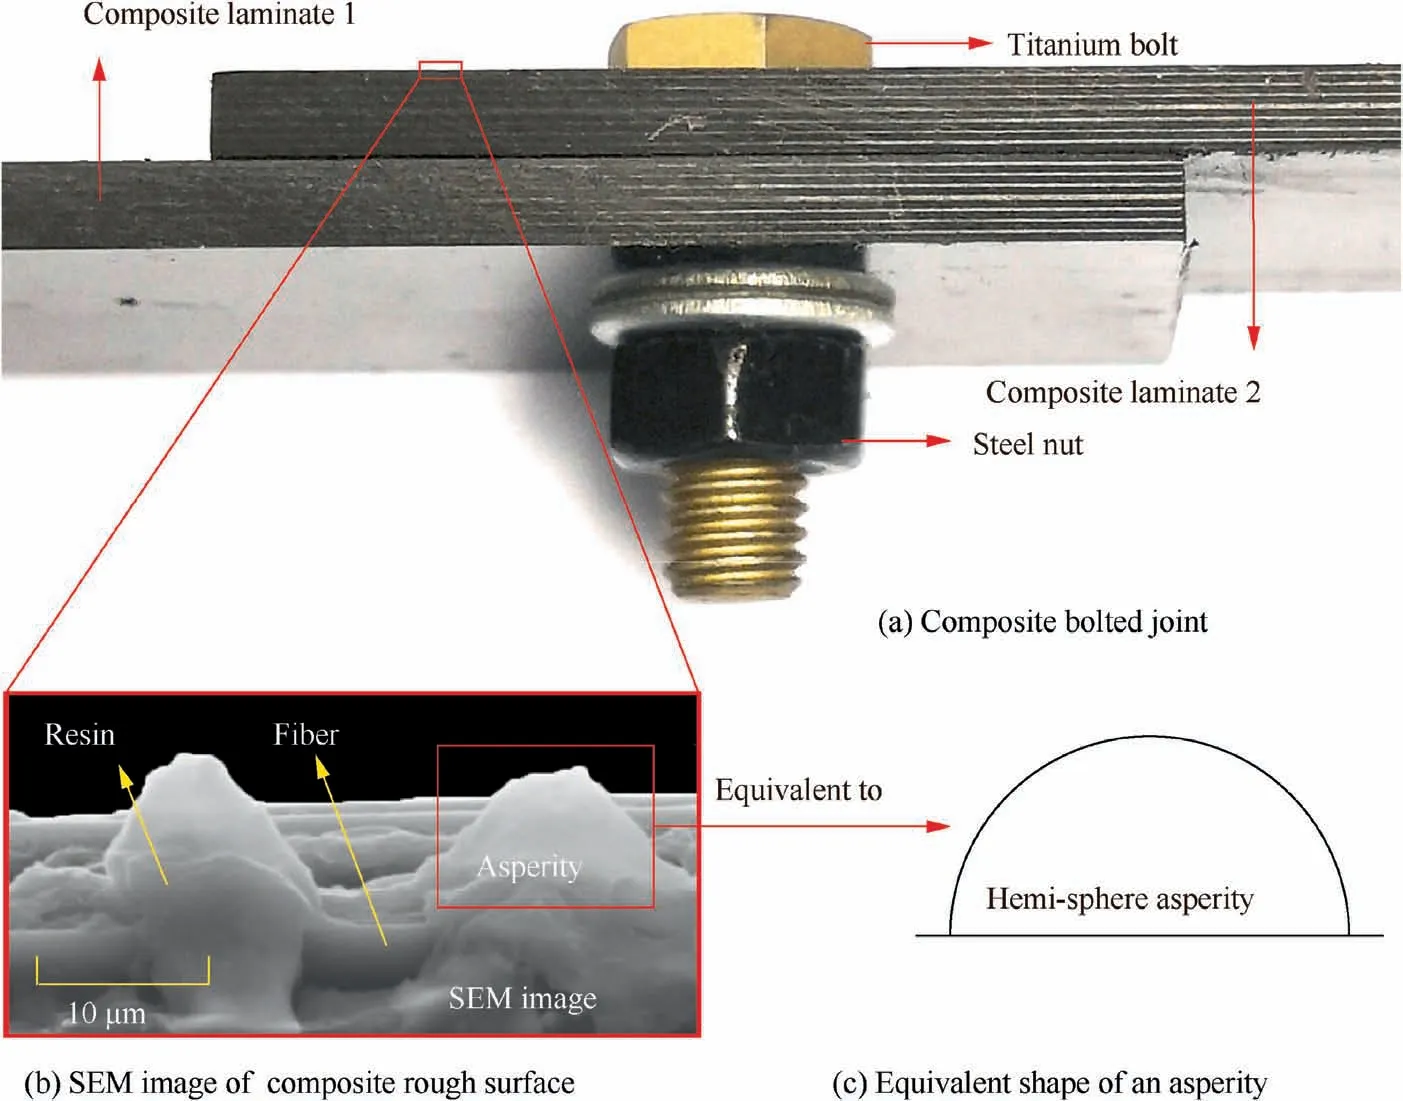
Fig. 1 SEM image of asperities on a rough surface of composite laminate and corresponding equivalent shape of an asperity.
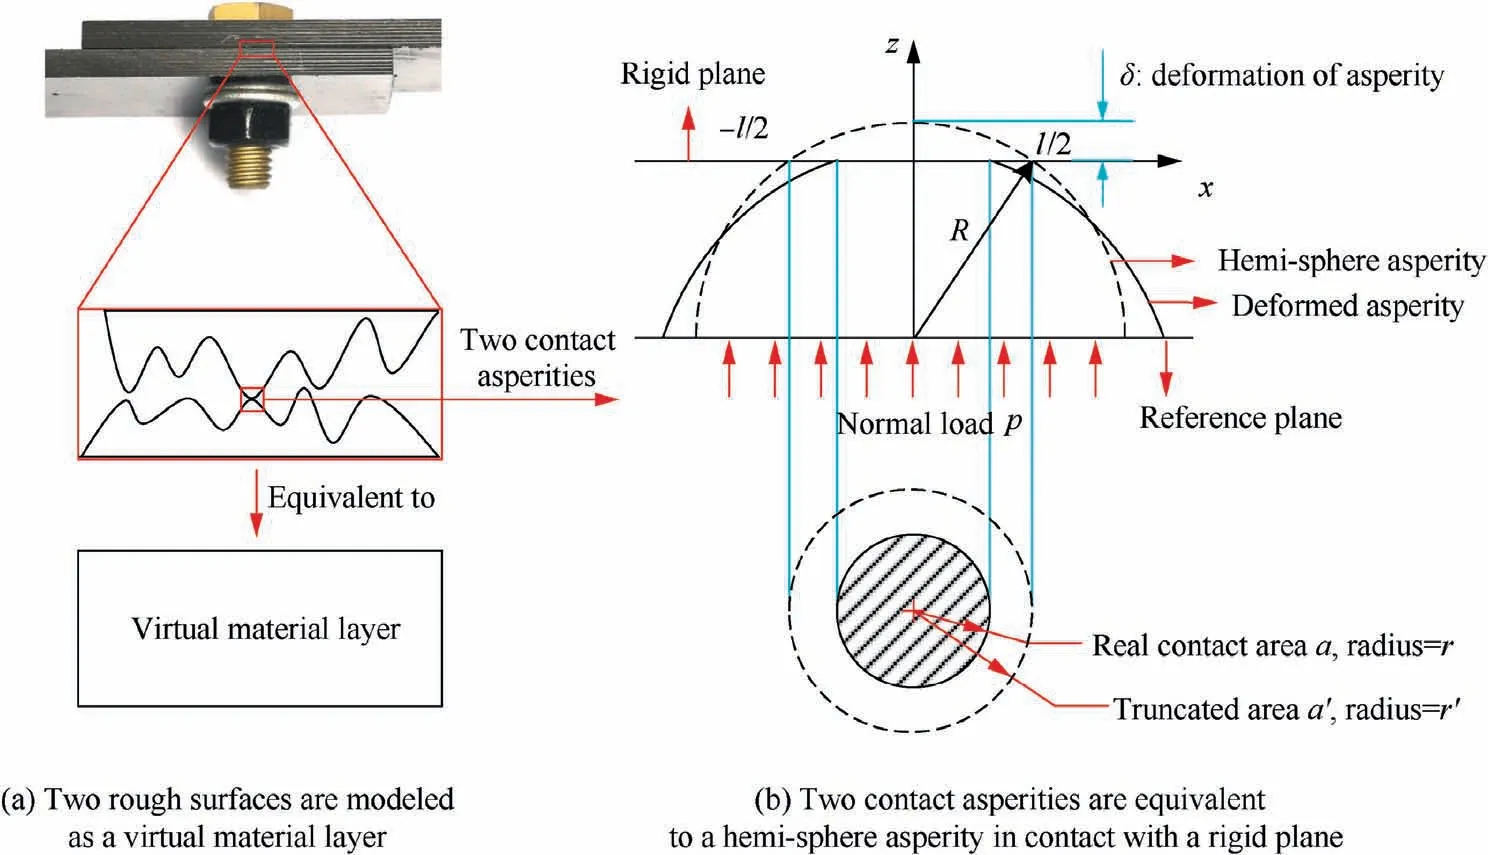
Fig. 2 Virtual material layer and simplification of two contact asperities.
According to Majumdar et al.21critical deformation of a hemisphere is:

where H denotes the hardness of the softer material. E’ is the equivalent modulus and is defined as 1/E′=(1-v2A)/EA+(1-v2B)/EB,25EA, νAand EB, νBare elastic moduli and Poisson’s ratios of rough surface A and B, respectively. By solving Eqs.(3), (6) and (7), critical truncated area a′cis:
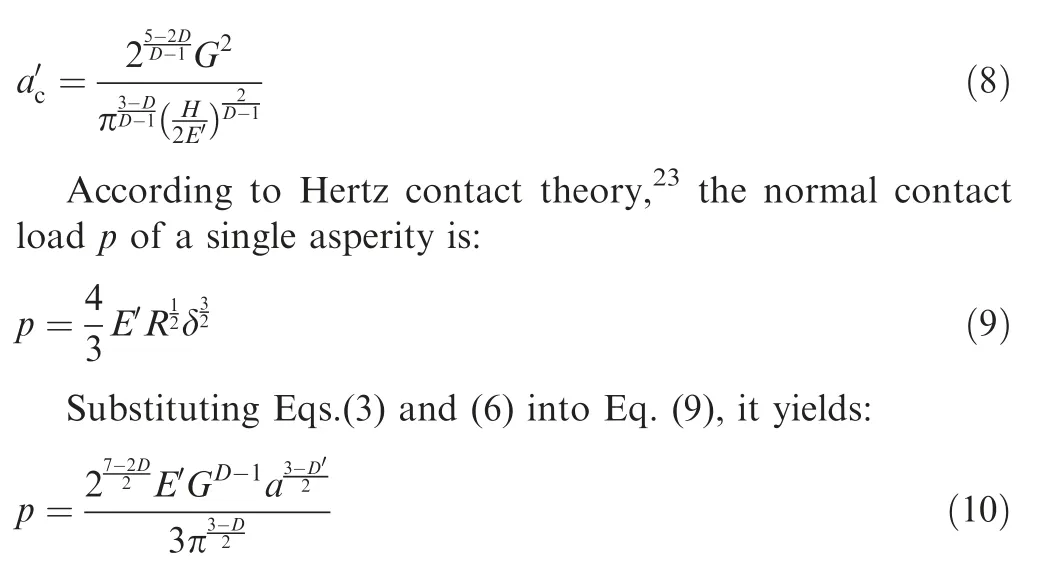
Total normal contact load of the virtual material layer is integral of normal contact load p, which is:
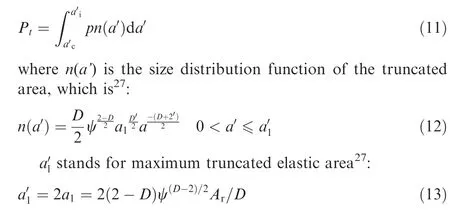
Aris real contact area of the whole contact surface and ψ is a domain extension factor whose value can be calculated by ψ(2-D)/2-(1+ψ-D2)(D–2)/D=2-D/D.27
When D=1.5, power of the integral term a’ in Eq. (11)equals to -1. Thus, there exists a special situation of the final form of Pt:
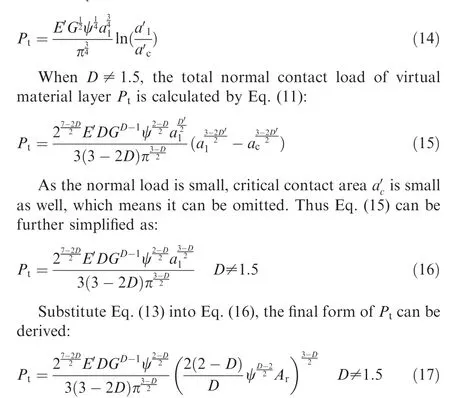
In order to reduce computation complexity and facilitate the analysis, we adopt dimensionless normal load P* as P*=Pt/E’An, dimensionless fractal roughness G* as G*=G/(An)0.5, and real contact area ratio A* as A*=Ar/An,where Anis the nominal contact area of the two rough surfaces. Dimensionless form of Eq. (17) is:

2.2. Material properties of virtual material layer
From the analysis of Section 2.1, the normal elastic contact load p of a single asperity can be calculated. Thus, normal stress of a single asperity can be written as σ=p/a. Strain of a single asperity is ε=δ/R.Then the stress–strain relationship of a single contact asperity can be derived17:

As can be seen from Eq. (19), the stress–strain relationship of a single asperity is nonlinear. By differentiating Eq. (19),elastic modulus of a single asperity is derived:
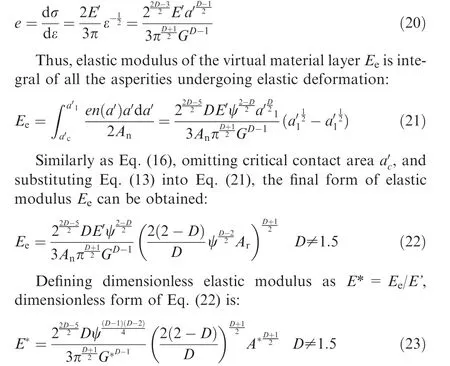
From Eqs. (17) and (22), total normal contact load Ptand elastic modulus of the virtual material layer Eeare related to real contact area of the whole contact surface Ar. Thus, at a giving normal load,through Eqs.(18)and(23),it is convenient to calculate the theoretical value of Arand Ee.
Differencing from metal material, Carbon fiber reinforced plastic material is a kind of anisotropic material. When computing equivalent modulus E’, elastic modulus EAor EBshould not be the engineering constants E2of composite laminate. As resin has poor plasticity, it mainly undergoes elastic deformation. Thus, a feasible solution to revise the EAor EB.is E′A =VsEA/Va,where Vsis nominal volume of sampling space region,and Vais the volume of the asperities in the sampling space region.
With Eqs. (18) and (23), elastic modulus of the virtual material layer can be computed. The Equivalent Poisson’s ratio of the virtual material is computed by parallel rule 1/v=1/vA+vB, where vAand vBare the Poisson’s ratio of the two rough contact surfaces.As virtual material layer is isotropic, shear modulus of the virtual material layer Gscan be calculated by Gs=0.5Ee/(v+1). Asperity height measured is about 15 μm (in Fig. 1). Thus, total thickness of the virtual material layer is set as 30 μm. Density of the virtual material layer is calculated by mixture rule ρ=(ρAVA+ρBVB)/(VA+VB), where ρA, ρBand VA, VBdenote the densities and volumes of two contact plates, respectively.
3. Theoretical calculation and identification of fractal parameters D and G
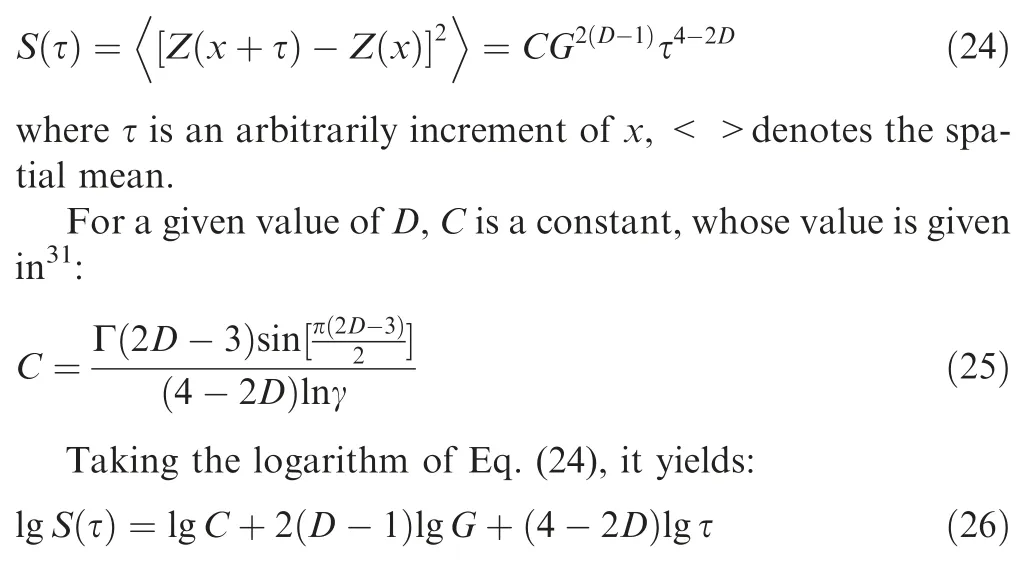
To get the value of fractal parameters D and G in the proposed model,the first thing is to identify whether the surface is fractal or not. There are two methods for computing the value of D and G.One is the prevailing method based on the power spectral density,20,28,29and the other method is called structure function method. Through the structure function method,value of D and G can be calculated without conducting Fourier transform.Therefore,structure function was adopted to calculate D and G in this paper.Definition of the structure function is30:
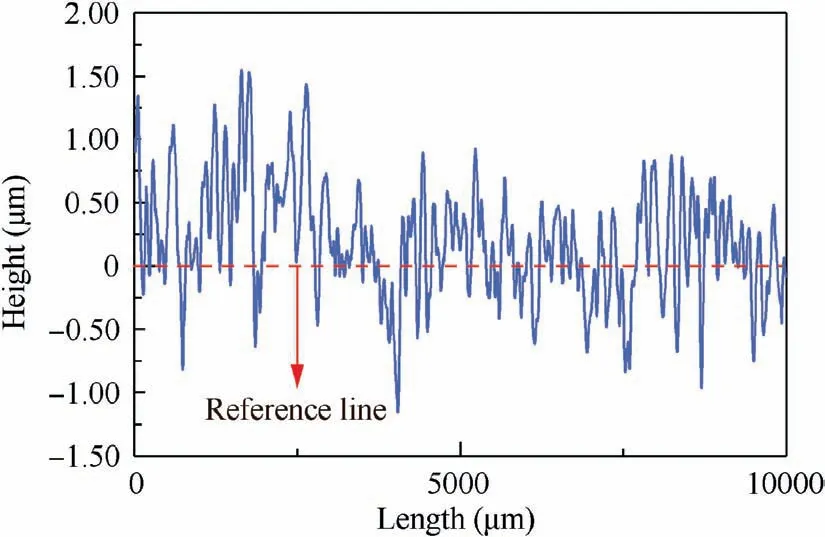
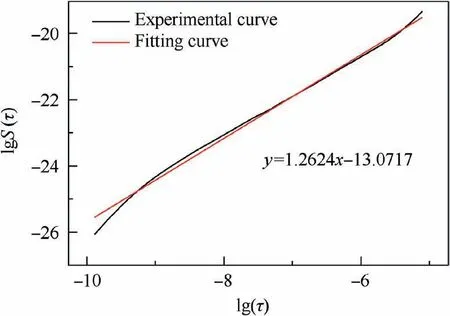
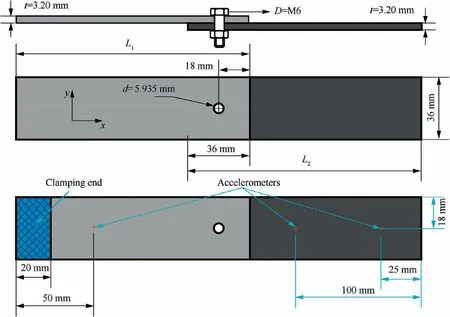
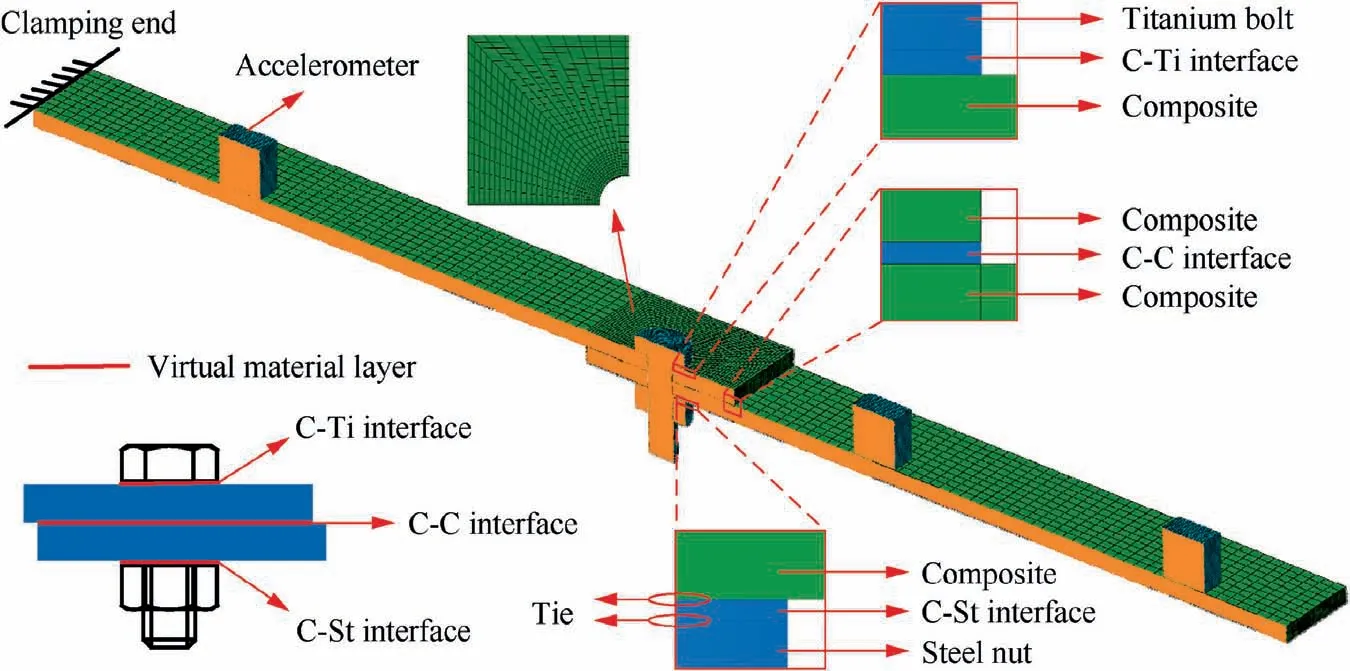
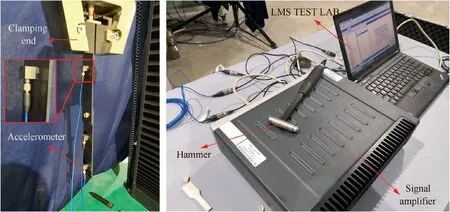
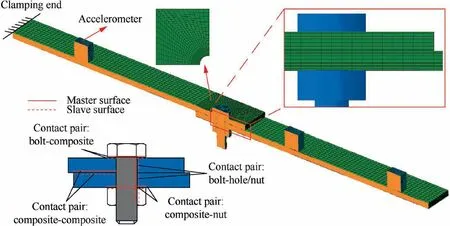
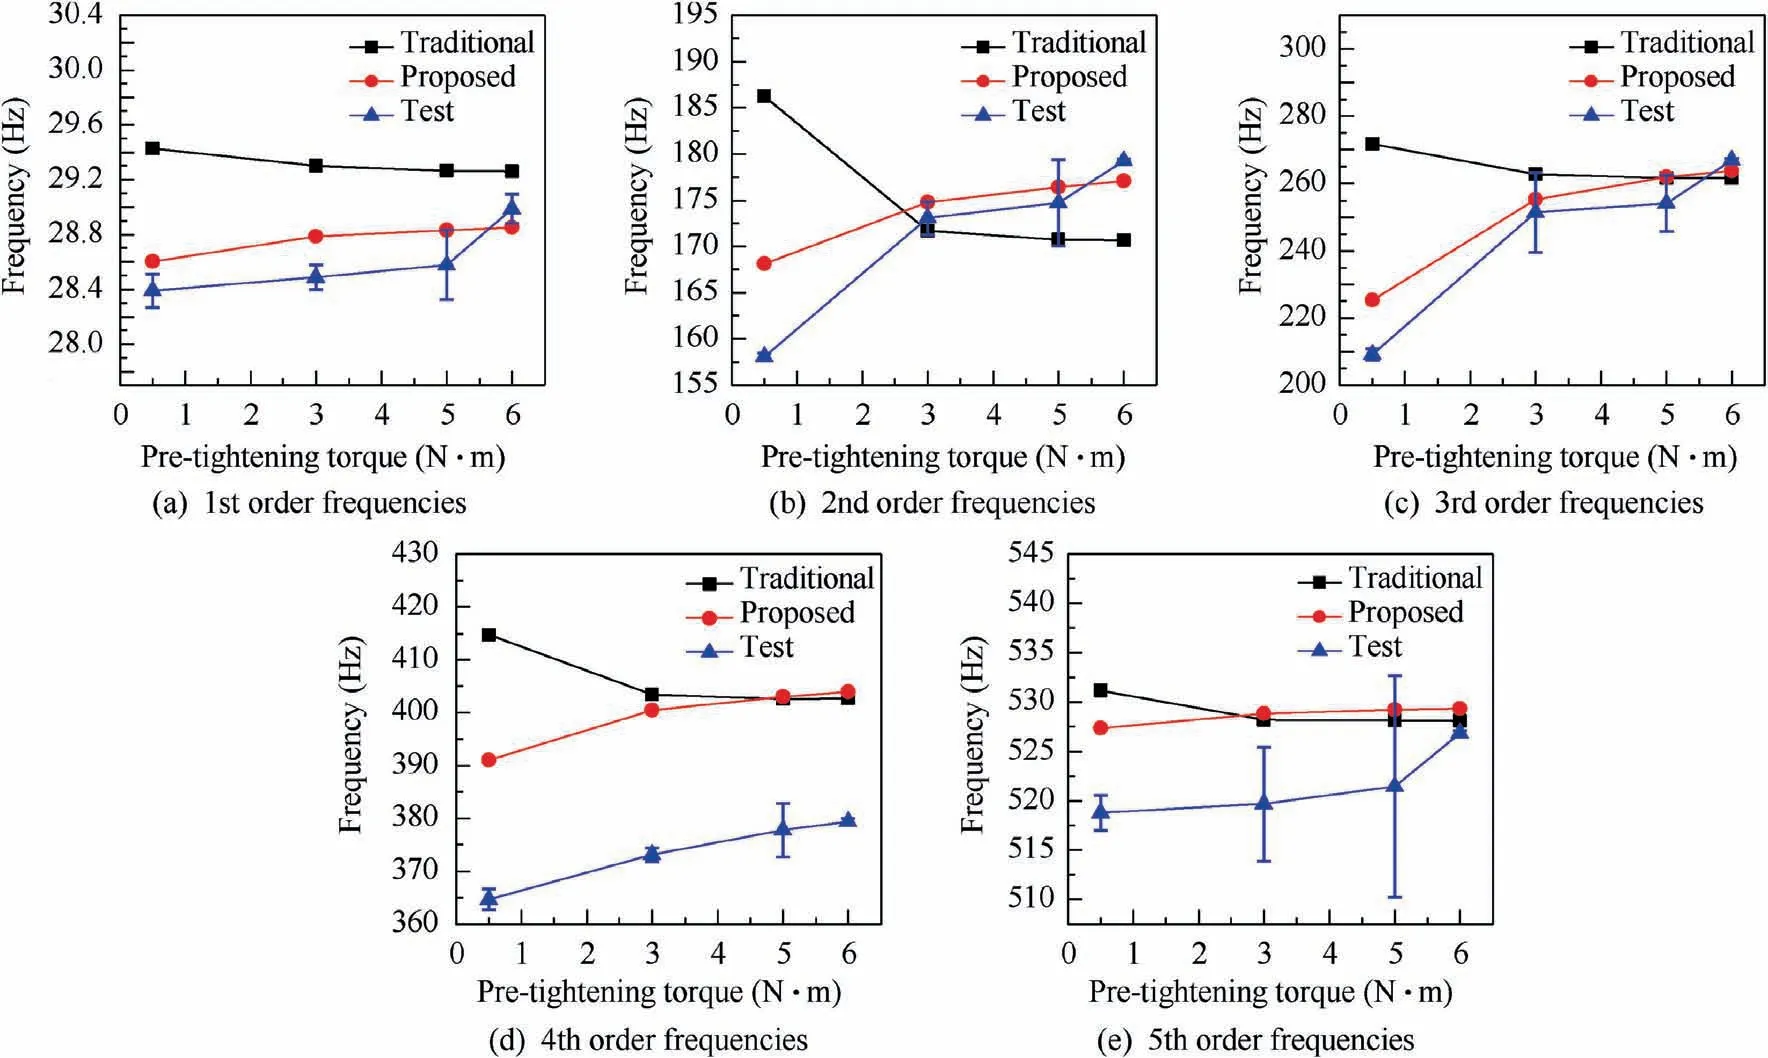
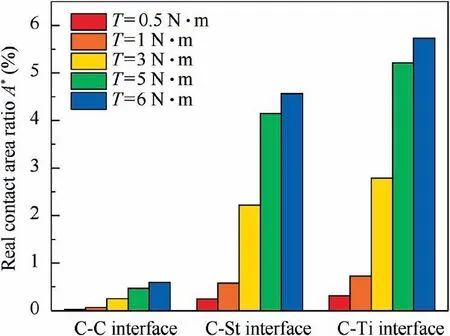
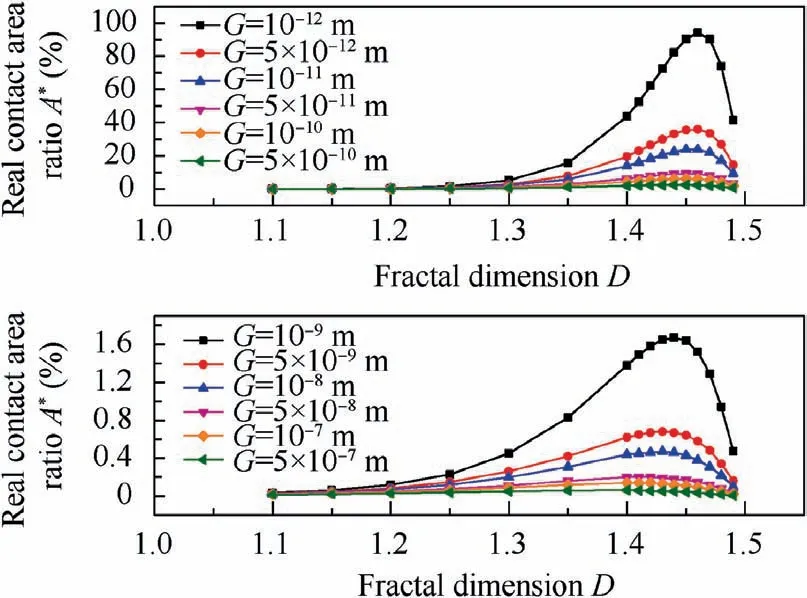
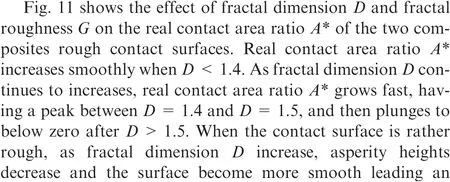
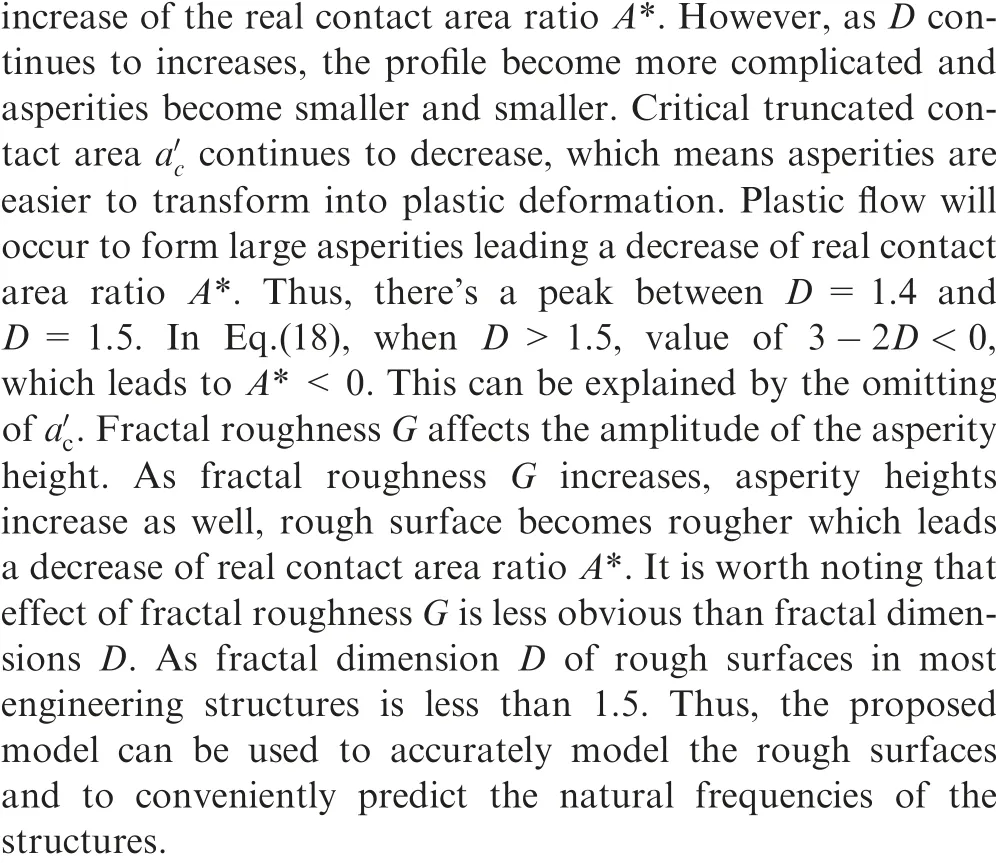
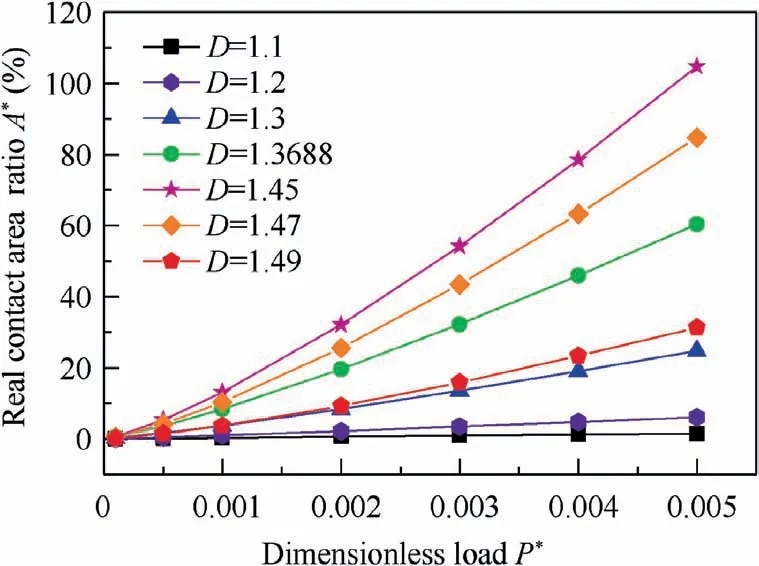
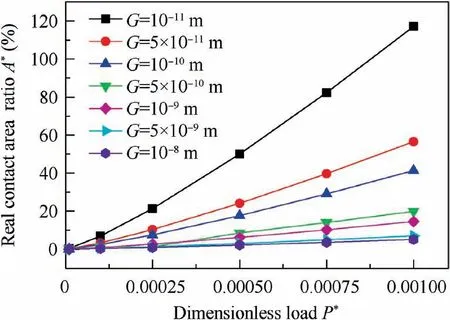
Eq. (26) shows the relationship between lgS(τ) and lg τ is linear. The slope of the straight line is ks. When 0 Fractal parameters D and G were identified through surface profile measurement. A BRUKER Dektak XT stylus profiler was used to measure the surface profile. This stylus profiler enables unmatched repeatability of 4 A˚ (4×10⁻¹⁰m), which could enable the equipment to perform the critical nanometer-level surface measurements. Fig. 3 shows a typical surface profile of a composite laminate used in experiments and relative heights of the sampling points.Scanning length is 10 mm,and the number of sampling points is 10000. As the measuring heights are not continuous,structure function is computed using heights of the sampling points. Sampling interval is Δt, and the number of the sampling points is N.The heights of the sampling points are denoting as Z(xi)=Zi, i=0,1,2,3,......, N. By defining τ=nΔt,n=1,2,3,......,N, the structure function becomes to: Fig. 3 Surface profile of a composite laminate and relative heights of sampling points. Fig.4 Experimental curve and fitting curve of composite surface structure function. Composite laminate surface profile was measured three times, and their average value was taken as the final profile.Fig. 4 shows the experimental curve and fitting curve of composite surface structure function.Black curve is the experimental results calculated through Eq.(27), and red straight line is the fitting curve of the experimental results. The fitting curve is well agreed with the theoretical curve of Eq. (26). From the fitted curve, the fractal parameters were identified as D=1.3688, G=3.4025×10⁻⁹m. In order to verify the model validity, numerical simulations and experiments were both conducted. Fig. 5 shows the geometries and dimensions of the single-lap bolted joint specimens in the experiments. Dimensions of the specimen are referred to ASTM D5961 Standard. In order to obtain a relative low base frequency, length of the laminate L1was modified to 170 mm. To get different values of natural frequencies, L2was set to be 170 mm, 190 mm and 210 mm,respectively. Clamping distance was 20 mm. Overlap distance of all joints was 36 mm, which was equal to the width of the specimen. The total thickness of the composites was 3.2 mm with a thickness of 0.2 mm per ply. Stacking sequence of the laminates was (0/±45/90)2s. Pre-tightening torque was set as 6 N∙m by a torque wrench.The relationship between the preload and the pre-tightening torque was computed by P=T/μbDb,20where μband Dbwere the friction coefficient and bolt nominal diameter,respectively.Interference-fit joint is an effective method to improve the joint stiffness.The interference-fit percentage is defined as I=(Db--d)/d×100%,32where Dband d are diameters of the bolt and the hole,respectively.In this paper,all the bolt diameters were 6 mm and hole diameters were 5.935 mm, forming an interference-fit percentage of 1.1%. Fiber material used in finite element analysis was standard modulus carbon fiber prepreg T700,while matrix material was unsaturated polyester resin 7901. The laminate material properties were provided by the composite company (Guangwei Composites Co, Ltd, China) and are listed in Table 1. Bolts are aerospace grade titanium alloy. Nut and flat washers are Steel. Properties of bolts,15nuts and washers20are given in Table 1 as well. Fig. 5 Geometry and dimensions of single lap bolted joint specimens in experiments. Table 1 Material properties of composites, fasteners and virtual material layers. Fig. 6 Cutting view of finite element model with virtual material layers representing rough contact surfaces. Numerical simulations were conducted in finite element software ABAQUS 6.14/Standard. Fig. 6 presents the cutting view of finite element model with virtual material layers representing the rough contact surfaces. The model consists of two composite laminates, one bolt, one nut and three types of virtual material layers. To simplify the numerical simulations,washers were neglected in finite element model. Contact surfaces and contact properties were replaced by C-Ti virtual material layer (interface between composite laminate and titanium bolt),C–C virtual material layer(interface between composite laminate L1and composite laminate L2) and C-St virtual material layer (interface between composite laminate and steel nut). Constrains between virtual material layers and structure members (composite, bolt and nut) were tie. It is worth noting that the weight of accelerometers should be considered to reduce the error. Properties of the virtual material were calculated by an in-house developed MATLAB code and were presented in Table 1. Modal experiments were carried out by LMS modal analysis system. Fig. 7 shows experimental modal test setup of CFRP single-lap interference-fit bolted joints. The structures were fixed in one end to form a cantilever beam and the clamping distance was 20 mm.Three accelerometers were attached in the composite surfaces to record the response of the acceleration. The beam was excited by an impact hammer. The responses of the accelerometers were analyzed through LMS Test.Lab 14A.Each parameter configuration had two identical joints to reduce the experimental errors. Each joint was test twice and each test was excited five times.The final frequencies were the average of the two joints. Numerical simulation results and experimental results of structures with different length are shown in Table 2. VML is an acronym for the Virtual Material Layer model,representing the simulation results of the proposed model. Test-1 and Test-2 represent the two tests in the experiments. AVG is the abbreviation of the word ‘Average’, which means the average value of Test-1 and Test-2. Error is the difference between the predicted value(VML)and the experimental average value(AVG).The simulation results have a good agreement with the experimental results. The maximum error of the virtual material model is 6.90%,and the minimum error is 0.58%.Average error of the simulation is 3.54%, which is acceptable and reliable. Results obtained from numerical simulations and experiments proved the validity of the proposed model. In Section 4, the proposed model was validated. However, a more important issue is whether the influence of rough contact surfaces is necessary. In this section, the necessity of considering the rough contact surfaces is verified using numerical simulations and experimental tests. From Eqs. (18) and (23),properties of virtual material layer are influenced by preload.Thus, properties of rough contact surfaces can be controlled by setting different preloads. The preload was set to 0.5, 3, 5 and 6 N∙m, respectively. Length of two laminates L1and L2were both 170 mm. Interference-fit percentage were 1.1%and Stacking sequence was (0/±45/90)2s. To compare the differences between virtual material layer model (where rough contact is assumed) and ABAQUS built-in traditional Master-Slave contact algorithm model(where full contact is assumed),two different types of finite element models were established. One is the finite element model proposed in Section 4 with virtual material layers representing the rough contact surfaces,the other is the finite element model without virtual material.Fig.8 shows the cutting view of finite element model without virtual material layers.The model consists of two composite laminates,one bolt and one nut.Washers were neglected as well. Contact conditions are based on Master-slave contact algorithm. There are five contact pairs,namely bolt-to-composite, composite-to-composite,composite-to-nut, bolt-to-hole and bolt-to-nut. Modal experiments were carried out by LMS modal analysis system as well. Due to frequent clamping and fixation of different structures during the experiments, the fixed distance of each time was inconsistent. In order to reduce error, when finished testing one type of parameter configuration, the preload was changed through a torque wrench without disassembly. In each parameter configuration, the modal test was conducted twice. In each test, the joint was excited five times,and averaged the three accelerometers results as its frequency.Final test results are the average of the two tests. Fig. 9 shows the Simulation and experimental results of composite structures for different pre-tightening torque.When the pre-tightening torque is more than 3 N∙m, the difference between the predicted value of the proposed model and the traditional Master-Slave contact algorithm model is relatively small. However, when the pre-tightening torque equals to 0.5 N∙m, the predicted value of Master-Slave contact algorithm model is far away from the proposed model and experiments.For example,the predicted third order frequency value of the proposed model is 225.23 Hz, while the value of the Master-Slave contact algorithm model is 271.73 Hz. The experimental result is 209.16 Hz, which is closer to the proposed model.The change trend of virtual material layer model is consistent with the experiments while the Master-Slave contact algorithm model is inconsistent with experiments. The inaccurate predicted results and the abnormal tendency prove the inaccuracy of Master-Slave contact algorithm model in modal analysis of composite structures and the basic hypothesis of this model is inappropriate when the pre-tightening torque is small. Fig. 7 Experimental modal test setup of CFRP single-lap interference-fit bolted joints. Table 2 Simulation and experimental results of structures for different length. Fig. 8 Cutting view of finite element model without virtual material layers. The total error (in the range of 0.5 N∙m to 6 N∙m) of the proposed model and Master-Slave contact algorithm model are 2.65% and 4.73% respectively, from which the total prediction accuracy is raised by 2.08%. In the range of 0.5 N∙m to 5 N∙m, the prediction accuracy is improved by 3.02%. In the range of 0.5 N∙m to 3 N∙m, the prediction accuracy is improved by 4.75%. When the pre-tightening torque is 0.5 N∙m, the average error of the frequencies predicted by the proposed model and Master-Slave contact algorithm model are 4.73% and 13.50%, respectively. It can be found that the prediction accuracy is raised by 8.77%. What’s more,even when the pre-tightening torque is 0.5 N∙m, error of the proposed model does not exceed 5%.This proves that the stability of the proposed model is better. The comparative results and errors show the effect of rough contact surfaces on the natural frequencies prediction. From Eq. (18), the larger the pre-tightening torque, the more the contact area, which means the contact relationship of the two contact surfaces looks more like perfect contact. As the pre-tightening torque decreases, the contact area of the surfaces decreases and the contact surfaces are increasingly imperfect.From Eq.(22),the decrease of the contact area will result in the decrease of elastic modulus of the virtual material layer,and then result in the decrease of the structure stiffness.From the definition of the natural frequency, decreased stiffness will decrease the natural frequency of the structure. However, the Master-Slave contact algorithm model treats the contact surfaces as perfect surfaces. Thus, as the pre-tightening torque decreases,the prediction accuracy of the Master-Slave contact algorithm model decreases. On the contrary, the proposed model considers the effect of rough contact surfaces, and the prediction results has a better agreement with experiments.The comparative results prove that rough contact surfaces will decrease the natural frequency and are more agree with reality. In this paper, as the pre-tightening torque is more than 3 N∙m, the difference between the proposed model and Master-Slave contact algorithm model decreases. In the proposed model, the increase of pre-tightening torque causes the contact surfaces to be perfect. Thus, in this paper, it is recommended that utilizing the virtual material layer model to conduct the modal analysis when the pre-tightening torque is less than or equal to 3 N∙m.When the pre-tightening toque is more than 3 N∙m, both the virtual material layer model and the Master-Slave contact algorithm model are suitable for conducting the modal analysis of the composite bolted joints. Fig. 9 Simulation and experimental results of structures for different pre-tightening torque. From the above analysis, two conclusions can be drawn.Stability of the virtual material layer model is better than Master-Slave contact algorithm model and in this paper it is necessary to consider the influence of the rough contact surfaces on the natural frequencies prediction of the joints when pre-tightening torque is less than or equal to 3 N∙m. Fig. 10 Real contact area ratios A* of three contact interfaces under different pre-tightening torques. Fig.11 Effect of fractal dimension D and fractal roughness G on real contact area ratios A*. In Sections 4 and 5, the model validation and the necessity of considering the rough contact surfaces were conducted.In this section, the calculation results of the proposed model are further discussed and analyzed. Fig. 10 presents the real contact area ratios A* of three types of virtual material layers. It is worth noting that effect of gravity on the contact area is neglected. When the pre-tightening torque is 0.5 N∙m, A* of C–C interface, C-St interface and C-Ti interface are 0.028%,0.247%and 0.310%,respectively.As the pre-tightening torque increases to 6 N∙m,A*of C–C interface,C-St interface and CTi interface increase to 0.59%,4.56%and 5.73%,respectively.The results fit the traditional contact theory that the real contact area is only a small part of the nominal contact area. Fig. 12 presents the effect of dimensionless load P* and fractal dimension D on the real contact area ratio A* of the two composites rough contact surfaces.As dimensionless load P*increases,real contact area ratio A*increases.This result is in accordance with the traditional friction theory that the real contact area is in positive correlation with the load.At a given dimensionless load, as the fractal dimension D increases, real contact area ratio A* firstly increases then decreases which is consistent with Fig. 11. When D=1.45 and P*=0.005, A*exceeds 100%, which means the real contact area has surpassed the nominal contact area. This is due to the normal load is so large that surfaces have invaded each other or one of the surfaces has been pressed into the other surface. Fig.13 reveals the effect of dimensionless load P*and fractal roughness G on the real contact area ratio A*. As the dimensionless load P* increases, real contact area ratio A*increases which also matches the traditional friction theory.At a given dimensionless load P*, as fractal roughness G decreases, amplitude of the asperity height decreases. The rough surface become more smoothly, leading an increase in the real contact area ratio A*, which also fits Fig. 11. When dimensionless load P*=0.01 and G=10-11m, real contact area ratio A* exceeds 100%. which can be also explained as rough contact surfaces have invaded each other. Fig.12 Effect of dimensionless load P*and fractal dimension D on real contact area ratio A*. Fig.13 Effect of dimensionless load P*and fractal roughness G on the real contact area ratio A*. In this paper, a novel virtual material layer model was established to predict the natural frequencies of composite bolted joints. Material properties of the virtual material layers were theoretically derived.Model validity was conducted and necessity of considering the contact surfaces was verified. Thus, the following conclusions can be drawn: (1) Through the proposed virtual material layer model,total normal contact load of the virtual material layer can be computed based on the improved fractal theory and material properties of virtual material layers can be theoretically calculated. (2) The proposed model is effective to conduct the numerical modal analysis to predict the natural frequencies of CFRP single-lap interference-fit bolted joints. Numerical modal analysis results are in good agreement with experimental results. (3) The proposed model has a better agreement with experiments than the widely used traditional model (the prediction accuracy is raised by 8.77% when the pretightening torque is 0.5 N∙m).It is necessary to consider the influence of the rough contact surfaces on the predicting of natural frequencies of the composite bolted joints when the pre-tightening torque is less than or equal to 3 N∙m. (4) Real contact area ratio A*is in positive correlation with dimensionless load P*.At a given dimensionless normal load P*, as fractal dimension D increases, real contact area ratio A* firstly increases then decreases; as fractal roughness G increases, real contact area ratio A*decreases. Analysis of single-lap bolted joints is the first step to analyze the multi-bolts structure in aeronautical manufacturing.In the future, based on the proposed model, rough contact analysis of multi-bolts joints could be further researched with different bolt configurations. Contact relationships of multibolts joints could be obtained. Moreover, prediction of natural frequencies of multi-bolts joints could be conducted to further verify the necessity of considering the rough contact surfaces. Declaration of Competing Interest The authors declare that they have no known competing financial interests or personal relationships that could have appeared to influence the work reported in this paper. Acknowledgments This work was supported by National Natural Science Foundation of China (grant number 51975472); Intelligent Robotic in Ministry of Science and Technology of the People’s Republic of China (grant number 2017YFB1301703); Shaanxi New Star Plan of Science and Technology (grant number 2019KJXX-063). Moreover, the authors would like to acknowledge the editors and the anonymous referees for their insightful comments.
4. Model validation

5. Demonstration of the necessity of considering the rough contact surfaces

6. Discussion
7. Conclusions
 CHINESE JOURNAL OF AERONAUTICS2021年8期
- CHINESE JOURNAL OF AERONAUTICS的其它文章
- Multi-layered plate finite element models with node-dependent kinematics for smart structures with piezoelectric components
- Modeling bending behavior of shape memory alloy wire-reinforced composites: Semi-analytical model and finite element analysis
- Sequential ensemble optimization based on general surrogate model prediction variance and its application on engine acceleration schedule design
- Transition prediction and sensitivity analysis for a natural laminar flow wing glove flight experiment
- Modeling on mechanical behavior and damage evolution of single-lap bolted composite interference-fit joints under thermal effects
- Experimental and numerical simulation of bird-strike performance of lattice-material-infilled curved plate
