Microstructural evolution and hardness of as-cast Be-Al-Sc-Zr alloy processed by laser surface remelting
Qingdong XU, Yu LUO, Xiangdong LIU, Lei YANG, Shixiong HE, Xin WANG,Wenyuan WANG, Tao SHI, Ruiwen LI, Pengcheng ZHANG
Institute of Materials, China Academy of Engineering Physics, Mianyang 621908, China
KEYWORDS Be-Al alloy;Laser energy input;Laser surface remelting;Hardness;Microstructure
Abstract As-cast beryllium-aluminum (Be-Al) alloy exhibits a coarse microstructure with pore defects due to a large solidification interval, greatly limiting its mechanical properties. In this research, the relationship between laser surface remelting process and microstructure and hardness of as-cast Be-Al-Sc-Zr alloy was established.The experimental results demonstrated that a pore-free refined microstructure of remelted layer was obtained by controlling the parameter of effective laser energy input.The microstructure of as-cast Be-Al-Sc-Zr alloy consisted of equiaxed grains with Al phase forming a continuous frame wrapping Be phase, which was significantly refined in the remelted zone (from 25 μm to 2 μm). The Vickers hardness in the remelted zone (approximately 210 HV)was approximately 3 times that of as-cast Be-Al-Sc-Zr alloy.Analysis of the Vickers hardness and the Be phase size showed a good agreement with a Hall-Petch equation.In addition,transmission electron microscopy (TEM), auger electron spectroscopy (AES) and X-ray diffraction(XRD) analysis evidenced that Sc and Zr elements formed a single blocky phase Be13(Scx,Zr1-x),which was also greatly refined from 8 μm to 1.5 μm in the remelted zone. The results obtained in this study indicate that the laser surface remelting allowed refining the microstructure and further strengthening the Vickers hardness of Be-Al-Sc-Zr alloy.
1. Introduction
Beryllium metal exhibits low density,high specific stiffness and excellent thermal stability, making it especially suitable for aerospace applications.1–3However,beryllium has a high brittleness at room temperature,which ultimately limits its practical applications. Therefore, to avoid the brittleness of beryllium, a Be-Al alloy (generally containing beryllium from 30wt% to 65wt%) is developed.4,5The Be-Al alloy combines the low density, high strength and stiffness of beryllium, with good formability and machinability of aluminum. Furthermore, processing costs and the amount of beryllium resources are reduced,so the Be-Al alloy is more competitive than beryllium in some applications for which performance is not the most prominent requirement. The most common Be-Al alloy is composed of 62wt%beryllium and 38wt%aluminum,which is referred to as AlBeMet 162.6
As a dual-phase composite that has a significant meltingpoint difference between its components, the Be-Al alloy is prone to form defects such as pores and to segregate during the casting process due to the low mutual solid solubility of Be and Al.7Besides, the microstructure of larger Be-Al alloy castings is relatively coarse due to a large solidification interval and slow solidification rate, which limits its mechanical properties. Therefore, in order to solve the problems of loose defects and coarse microstructure, adding alloying elements and/or increasing the cooling rate are always required for practical applications.
The addition of alloying elements is mainly to enhance the strength of cast Be-Al alloy by means of solid solution strengthening or second phase strengthening.Numerous alloying elements, such as Mg8,9,Sc10,Ni11, Cu12,Si13, and Ag14,15have been added into Be-Al-based alloys. Among them, the Be-Al-Sc-Zr alloy is developed, which is mainly to form secondary phase particles to improve its strength.16,17Molchanova investigated the influence of Sc on the microstructure and mechanical properties of Be-Al Alloys.18He found that the strength increases markedly because of the precipitation of Be13Sc but the ductility decreases simultaneously. Yu et al. reported that the addition of Sc and Zr increased the reduced modulus and hardness of cast Be-Al alloys. Their results showed that both Sc and Zr preferentially formed intermetallic compounds(two-phase mixture of Be13Sc and Be13Zr)with Be in the melt.19It should be noted that most of these studies on Be-Al-Sc-Zr alloy samples were studied under normal casting conditions.
Increasing the cooling rate can increase the strength of Be-Al alloy through fine grain strengthening. Mueller et al.investigated the microstructure of aluminum-rich Al-Be alloy powders with different beryllium content, powder size and cooling rate.20David et al. studied the microstructures of rapidly solidified aluminum-rich Al-Be alloys.21However,these studies were focused on the microstructure of low beryllium content (less than 40wt%) of Be-Al alloy under rapid cooling. With the increase of beryllium content and the addition of alloying elements, the study on the microstructure of Be-Al alloy during rapid solidification has been rarely carried out.
Laser surface remelting (LSR)presents very fast heat dissipation during the solidification process, leading to extremely high cooling rates of approximately 105–108K/s.22The microstructures of the rapid solidification process show advantages of refined microstructure, reduced micro-segregation,formation of metastable phases and improved solid solubility.23,24Therefore, LSR has recently been widely performed to modify the microstructure and enhance the surface properties of steels25,26,Al alloys27,28,Mg alloys29,30and so on.To the best of our knowledge, no studies have been performed on high Be content of Be-Al alloys by LSR due to its high laser reflectivity.31
In this work,the cross-sectional morphology and metallurgical quality of single remelted track samples with various process parameters were systematically investigated by optical microscopy (OM). Then, the microstructure of LSRed Be-Al-Sc-Zr and Be-Al alloys are investigated by scanning electron microscopy (SEM), AES, XRD and TEM. Finally, the strengthening mechanism on the hardness of Be-Al alloy was discussed. We have demonstrated that LSR can be used to refine the microstructure of Be-Al alloys and enhance the secondary phase strengthening,and then further evaluate the candidacy of additive manufactured Be-Al alloys using laser rapid solidification process.
2. Experimental
2.1. Materials
Be-Al and Be-Al-Sc-Zr alloy plates were prepared by vacuum induction melting and cut into 40 mm×25 mm×5 mm. The chemical composition of the cast Be-Al and Be-Al-Sc-Zr alloy were listed in Table 1. All the substrates were sandblasted to increase their absorption rate of the laser, cleaned using alcohol to remove surface contaminants, and dried in a vacuum drying oven at 120°C±10°C for 1 h.
2.2. Specimen preparation
The experiments were performed using a laser additive manufacturing system consisting of a semiconductor laser unit with a wavelength of 1030 nm, a six-axis robotic arm and an inert controlled atmosphere glove box (with oxygen content ≤1×10⁻²g/L).The laser spot diameter is approximately 2 mm. Argon gas was used to protect the molten pool from oxidation.
First, laser remelting experiments with a single-track were carried out, and the processing parameters used are listed in Table 2. Observations and measurements of the cross-section morphology of single-track samples were examined by optical metallography (OM, Olympus OLS4000). Second, the LSRed experiment was carried out. The parameters of LSR were as follows: laser power 800 W, scanning speed 2000 mm/min,and overlap ratio 55%. All surface scanning specimens were cut into 10 mm×10 mm×5 mm for microstructural observations and property testing.

Table 1 Chemical composition (wt%) of the cast Be-Al and Be-Al-Sc-Zr alloy substrate.

Table 2 List of processing parameters for single-track remelting of Be-Al-Sc-Zr alloys.
2.3. Microstructure characterization and Vickers hardness measurements
Samples were ground with SiC papers and then polished with diamond suspension. The microstructure of the samples was revealed using an etchant that consisted of 5 mL HNO3,15 mL HF and 85 mL H2O.The resulting microstructures were examined by OM, SEM(FEI Helios Nanolab 600i) and XRD(TDF-3000). The chemical compositions of secondary phases were examined by electron dispersive X-ray spectroscopy(EDXS) and auger electron spectroscopy (AES, PHI 700Xi).Thin foils with a diameter of 3 mm for TEM analysis (TEM,FEI Titan G260-300) equipped with energy disperse spectroscopy (EDS, Oxford Instruments) were ground to ~50 μm and then twin-jet electro polishing with a solution of perchloric acid (20% by volume), butyl cellosolve (25%) and methanol(55%) at -20°C and 40 V.
The XRD data were obtained using monochromatic Cu Ka(λ=1.54056 A˚)radiation produced at 40 kV and 30 mA, and the result was recorded with a scanning range of 2θ from 20°to 90° and with a scanning step size of 0.02°.
The Vickers hardness of the samples was performed using a sclerometer(Wilson VH3100)at an applied load of 200 g and a loading time of 15 s. The microhardness of the phases present in as-cast Be-Al-Sc-Zr alloy was obtained by nano-indentation(TriboIndenter TI-950)with a load of 3 mN using a Berkovich indenter having a tip radius of 150 nm.
3. Results
3.1. Morphologies of molten pool
Fig.1 shows the OM images of the cross-sectional morphology of single-track remelted samples at various laser powers. The remelting process produces a more uniform and smoother molten pool and efficiently reduces the number of pores formed,which is represented by a clear crescent at higher laser powers.There exist two significant regions, namely the molten pool and substrate. In the substrate, the hard Be phase and soft Al phase are clearly separated in polished samples, in which porosity may exist.In contrast,in the molten pool it is difficult to observe the two-phase separation at the current magnification. In addition, there is no obvious defect inside the molten pool at intermediate laser power (2#–3#), while a small amount of residual porosity forms at the bottom of the molten pool at higher laser power (4#–8#).
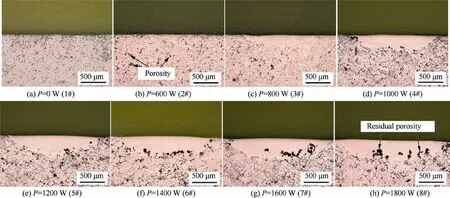
Fig. 1 Cross-sectional morphology of single-track remelted samples with different laser powers (laser power=0–1600 W, scanning speed=2000 mm/min).
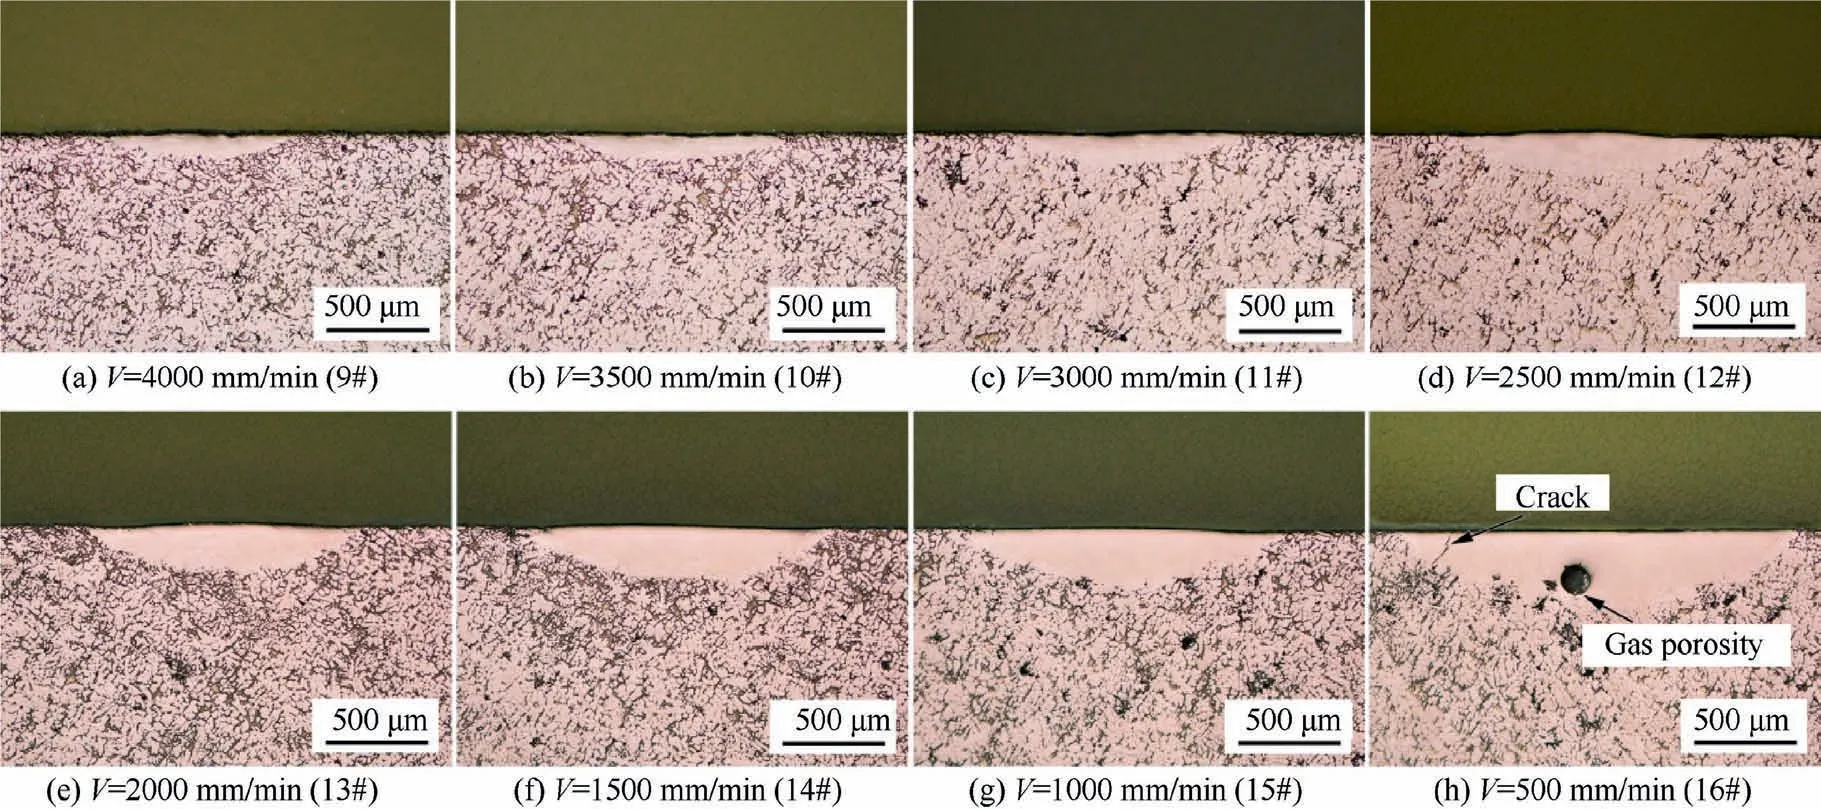
Fig. 2 Cross-sectional morphology of single-track remelted samples with different scanning speeds (laser power=800 W, scanning speed=4000–500 mm/min).
Fig. 2 shows the OM images of the cross-sectional morphology of single-track remelted samples at different laser scanning speeds.Similar to the effect of laser power,there is no significant defect in the molten pool at a higher scanning speed. However, when the scanning speed decreases to 500 mm/min, cracks and circular pore defects appear inside the molten pool.
Two quantities (depth and width) are defined to characterize the size of the cross-section of the molten pool,as shown in Fig.1.Fig.3 shows the measured depth and width of the molten pool under different laser parameters.The depth and width of the molten pool increase rapidly and then increase slowly with increasing laser power;furthermore,the width of the molten pool increases more significantly than the depth of the molten pool. As the scanning speed increases, both the depth and width of the molten pool decrease almost linearly.
Based on the analysis above, the defects inside the molten pool are may originated from the as-cast substrate or introduced by laser remelting process. First, it is a fact that there were some pore defects in the as-cast substrate. The laser remelting process was performed on the surface of alloy to form the molten pool, and then rapidly solidifies. When the depth of the molten pool is shallow, the gas remaining in the original casting pores can escape from the molten pool to form a pore-free remelted layer.When the depth of the molten pool is deep,the residual gas at the bottom of the molten pool is difficult to escape,resulting in some residual porosity form at the bottom of the molten pool, as shown in Fig. 1 (5#–8#). Second, the improper laser remelting process may also introduce new defects, such as cracks and circular pore, as shown in Fig. 2 (16#). Therefore, the defects inside the molten pool are related to the size of the molten pool(depth),while the size of the molten pool is affected by the process parameters.
To analysis the effects of processing parameters on the size of molten pool,the effective laser energy input(Q)is defined as the following32:

where P,v and D are the laser power,laser scanning speed and laser beam diameter, respectively.
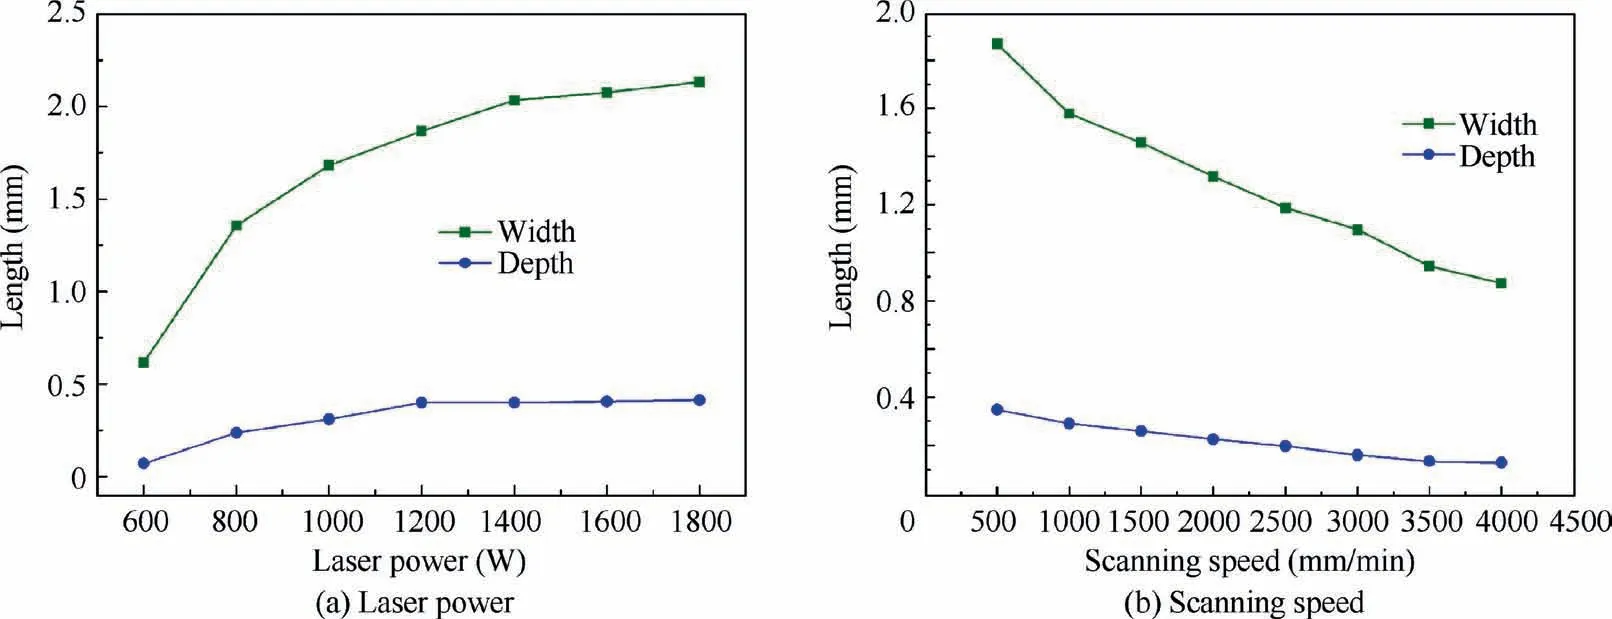
Fig. 3 Influences of laser parameters on the depth and width of molten pool cross-section.
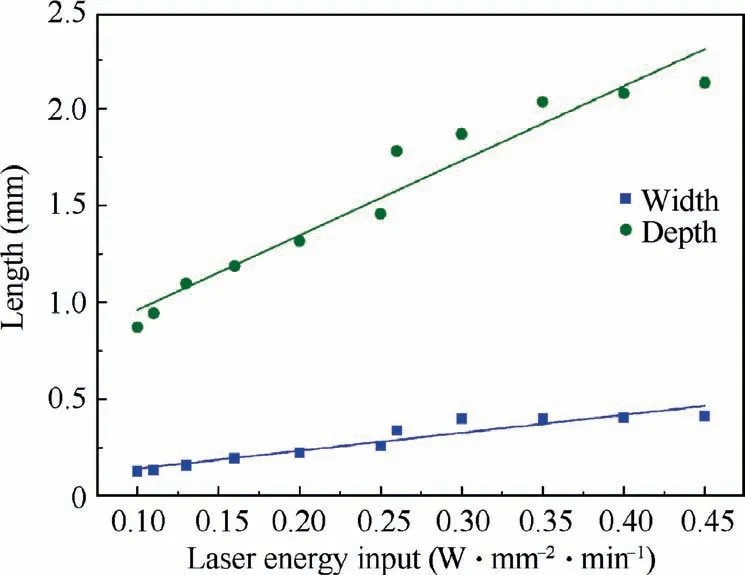
Fig.4 Relationship between size of molten pool and laser energy input.
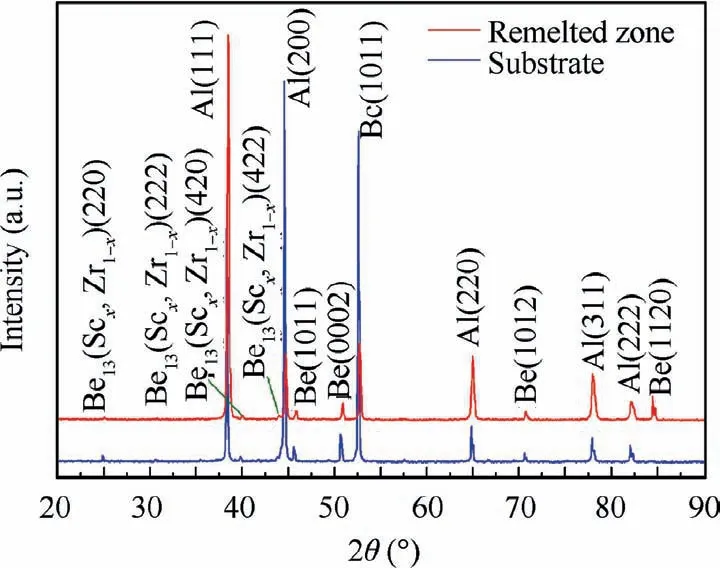
Fig. 5 XRD pattern of as-cast and LSRed Be-Al-Sc-Zr alloy samples.
Fig. 4 shows the relationship between the size of molten pool and laser energy input Q. The depth and width of the molten pool increase linearly with increasing Q. When the Q value is large,which can be due to high laser power,low scanning speed or both, defects such as pores are likely to occur and be enriched. By increasing the Q, as mentioned earlier,the depth of the molten pool gradually increases. Consequently, when the depth of the molten pool increases to a certain level(approximately 0.39 mm),the residual gas at the bottom of the molten pool is difficult to escape and form residual pores. Meanwhile, as the depth of the molten pool increases further, these residual pores gradually increase and enrich at the bottom of the molten pool. Thus, to maximize the molten pool and minimize the occurrence of defects at the same time during laser remelting of the Be-Al-Sc-Zr alloy, laser energy input should be moderate. Therefore, combined with the experimental results, a laser power of 800 W and a scanning speed of 2000 mm/min are adopted for LSR processing in the following paper.
3.2. Microstructural evolution
3.2.1. XRD characterization
Fig.5 shows the XRD pattern of the as-cast and LSRed Be-Al-Sc-Zr alloy samples.It shows that both the as-cast and LSRed samples are mainly composed of the Be phase, Al phase and second phase.The diffraction pattern of the substrate has four broad peaks at 24.96°, 30.65°, 39.88° and 43.86°, corresponding to the middle value between the Be13Sc (PDF Card No.018-0226) and Be13Zr (PDF Card No. 012-0386) diffraction peaks of the (220), (222), (420) and (422) planes, respectively.The second phase in the remelted zone also showed similar results,as shown in Table 3.Thus,the XRD results show that the second phase in both the as-cast and LSRed samples presumably is Be13(Scx,Zr1-x).
3.2.2. Microstructure characterisation
Fig. 6 shows the cross-sectional morphology of the LSRed sample. No pores and cracks are observed in the remelted layer. The interface between the substrate and the remelted layer presents compact metallurgical bonding. The thickness of the remelted layer is approximately 100 μm, and the layer is distributed uniformity. In contrast to typical weld metal,no obvious heat-affected zone exist in LSRed Be-Al-Sc-Zr alloy. Obviously, the remelted layer shows a refined microstructure compared to that of the substrate.
Fig. 7 shows the SEM images of the LSRed sample cross section. There is an obvious difference in the microstructure from the substrate to the remelted zone, as shown in Fig. 7(a). The substrate is a typical as-cast structure, and obviously separated Be and Al phases are clearly observed (Fig. 7(c)).The majority of Be phases present dendritic crystal or cellular morphology. Using a linear intercept method to statistically estimate the size of the cellular Be phases, the average size is approximately 25 μm. Numerous blocky second phase particles (SPs) (marked by black arrows) distributed in the Al or Be matrix are also observed in Fig. 7(d). These SPs are typically in forms of squares, triangles, or polygons with particle sizes of approximately 8 μm. In addition, some unmelted SPs remain in the bottom of the remelted layer,as shown in Fig.7(b).
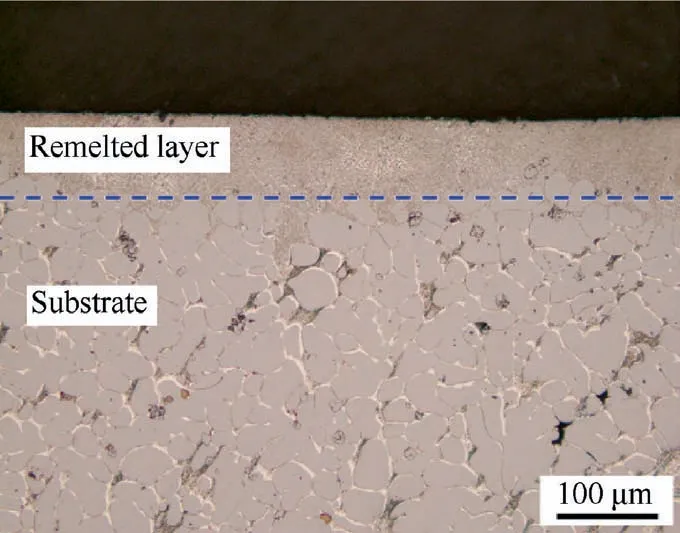
Fig.6 OM micrograph of cross-sectional morphology of LSRed Be-Al-Sc-Zr alloy.

Table 3 2θ values corresponding to diffraction pattern of SPs in substrate and remelted zone of LSRed Be-Al-Sc-Zr alloy samples.
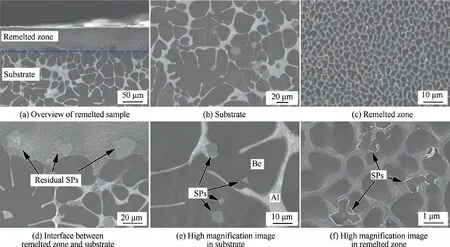
Fig. 7 SEM images of LSRed Be-Al-Sc-Zr sample.
By contrast, the microstructure of the remelted zone consists of a equiaxed grain, in which a white Al phase forms a continuous network structure that wraps around a gray Be phase and is accompanied by finer blocky SPs, as shown in Fig. 7(e). Detailed observation of these SPs (Fig. 7(f) with higher magnification) indicates that they mainly exhibit irregular blocks in the Al phase. In addition, the corners of the blocky SPs in the area of the Be matrix may be lost due to grinding or polishing. Statistics on the average size of the Be phase (approximately 2 μm) and the SPs (approximately 1.5 μm) show that they have been significantly refined by LSR treatment.
Fig. 8 shows SEM image of the substrate and the corresponding elemental mapping of the Al, Sc and Zr elements.The Be element cannot be detected by EDS because of its low atomic number.33EDS mapping revealed that Sc and Zr elements are both rich in the SPs,and the SPs tend to agglomerate together. In addition, almost no Sc and Zr elements can be found in the Be and Al matrix phases. Besides, the similar brightness and position of the Sc and Zr elements in all SPs shows that the SPs have a uniform composition.
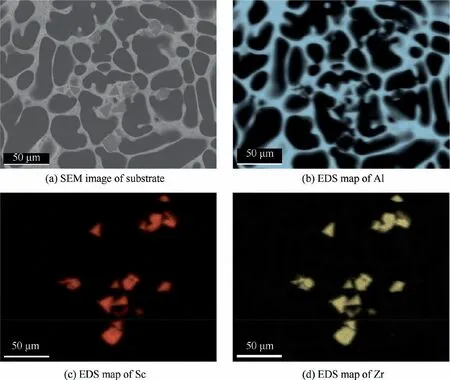
Fig. 8 SEM image of as-cast substrate and corresponding elemental distribution.
Fig. 9 shows SEM image of the remelted zone and the corresponding elemental mapping of Al, Sc and Zr. There is no significant difference between the SPs in the substrate and that in remelted zone. Compared with the substrate, the degree of segregation of Sc and Zr elements in the remelted zone is slightly weak, which is caused by the fact that the SPs do not sufficiently grow during the rapid solidification process.
Since EDS cannot identify whether the SPs contains the Be element,the light element Be was analyzed using AES.Fig.10 shows the AES spectrum of the Be, Al and SP phases in the substrate and remelted zone. Both the SPs of the substrate and remelted zone contain Be, Zr and Sc elements. Thus,SPs are most likely compounds of Be,Sc and Zr.Among them,the chemical composition of the SP phases in the substrate and remelted zone were analyzed at three points with AES, as shown in Table 4. The chemical composition of the SP phases in the substrate and remelted zone are basically the same. The atomic ratio of Sc and Zr elements is approximately 2:1,which consistent with the atomic ratio(approximately 2:1) of Sc and Zr added to the as-casted samples. According to XRD analysis, this phase close to the chemical formula of Be13(Sc2/3,Zr1/3).
Fig. 11 shows the TEM images, selected area electron diffraction (SAED) patterns and EDS results of the blocky SP (approximately 8 μm) and the matrix phase in the as-cast samples. The TEM-EDS results of one selected SP indicate that it contains both Sc and Zr elements. The SAED pattern of the SP and matrix phase show that there are Be13(Scx,Zr1--x) and Al phases, respectively, which is consistent with the XRD and AES results.For the Be13(Scx,Zr1-x)phase,one part of the Sc atom sites is replaced by Zr atoms,similar to the Al3(-Scx,Zr1-x) phase.34,35
Fig. 12 shows the TEM images, SAED patterns and EDS results of the blocky SP(approximately 1.5 μm)in the remelted zone. The square SPs overlap the Be phase and Al phase,which is consistent with morphology observed by SEM. The TEM-EDS results of selected SPs indicate that it contains both Sc and Zr elements.The SAED pattern of SPs shows that they are Be13(Scx,Zr1-x), which is consistent with the observation from the substrate. Besides, the diffracted spots did not split,so the SP was judged to be a single phase (Be13(Scx,Zr1-x)),not a two-phase mixture of Be13Sc and Be13Zr.
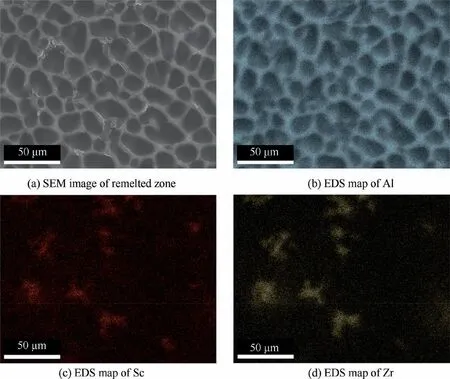
Fig. 9 SEM image of remelted zone and corresponding elemental distribution.

Table 4 AES analysis of SPs in substrate and remelted zone of LSRed samples (at%).
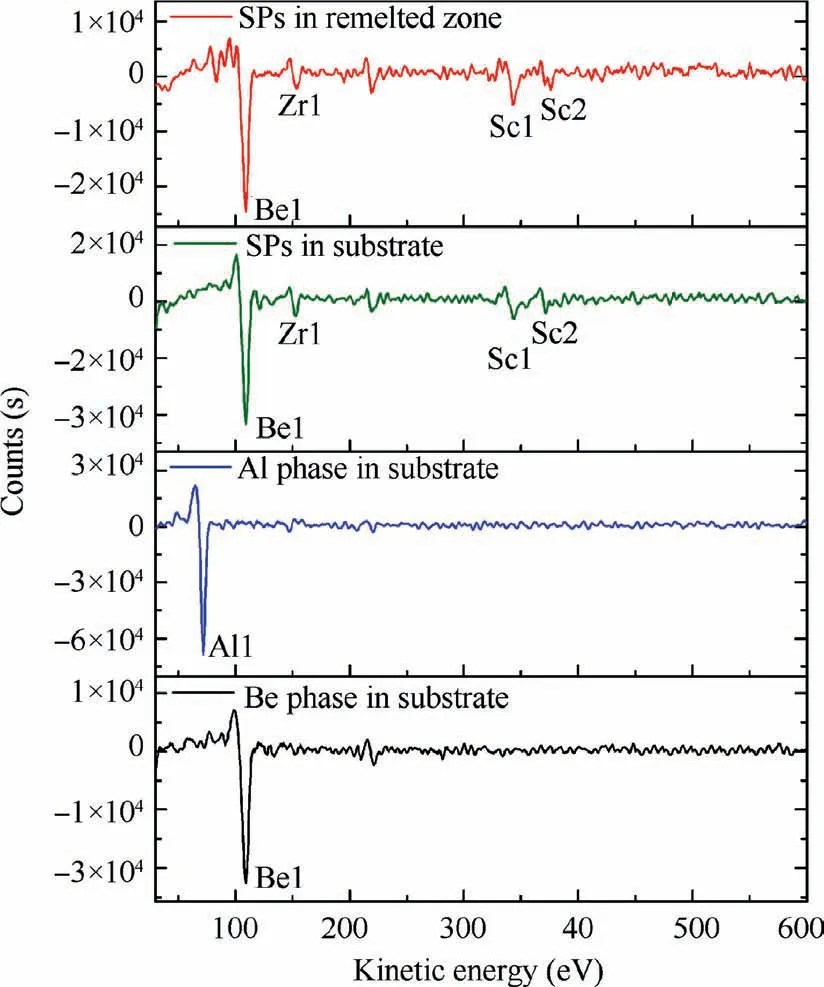
Fig. 10 AES spectrum of different phases in substrate and remelted zone of LSRed sample after sputter cleaning with Ar+ions.
In order to compare the influences of Sc and Zr on the microstructure and hardness of Be-Al alloy,the LSR were also performed on as-cast Be-Al alloy plates. Fig. 13 shows the SEM images of the LSRed Be-Al alloy.The substrate is a typical as-cast structure, and obviously separated Be and Al phases are clearly observed, as shown in Fig. 13b. The microstructure of the remelted zone also exhibits a cellular structure, in which Al phase forms a continuous network structure that wraps around anxiolytic Be phase, as shown in Fig. 13c and d. The average size of the Be phase in the substrate and remelted zone are approximately 25 μm and 2 μm,respectively. These results evidenced that the addition of Sc and Zr does not play a role in refining the microstructure of as-cast Be-Al alloy.
3.3. Vickers hardness
Fig.14 shows the Vickers hardness in the as-cast substrate,the remelted zone of the LSRed Be-Al-Sc-Zr and Be-Al alloy samples. For Be-Al-Sc-Zr alloy, the Vickers hardness in the remelted zone is approximately 210 HV, which is approximately 3 times that of the substrate (approximately 70 HV).For Be-Al alloy, the Vickers hardness in the remelted zone is approximately 100 HV, which is approximately 2.5 times that of the substrate (approximately 40 HV). Furthermore, the Vickers hardness in the remelted zone of Be-Al-Sc-Zr alloy is approximately twice that of Be-Al alloy. Obviously, after LSR treatment and adding Sc and Zr elements, surface hardness is significantly improved due to the refinement of the Be phases and the formation of Be13(Scx,Zr1-x) intermetallic compounds.
4. Discussions
4.1. Thermodynamic analysis
Sc and Zr elements can form intermetallic compounds with Be or Al alone. However, in the Be-Al-Sc-Zr alloy system
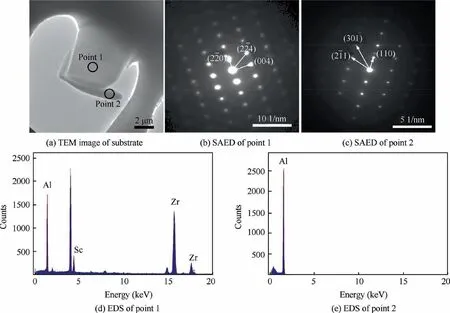
Fig. 11 TEM images of SP in substrate with corresponding SAED patterns and EDS results.
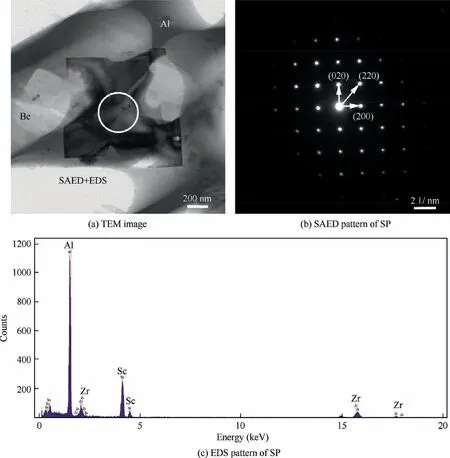
Fig. 12 TEM images of SP in remelted zone with corresponding SAED patterns and EDS results.
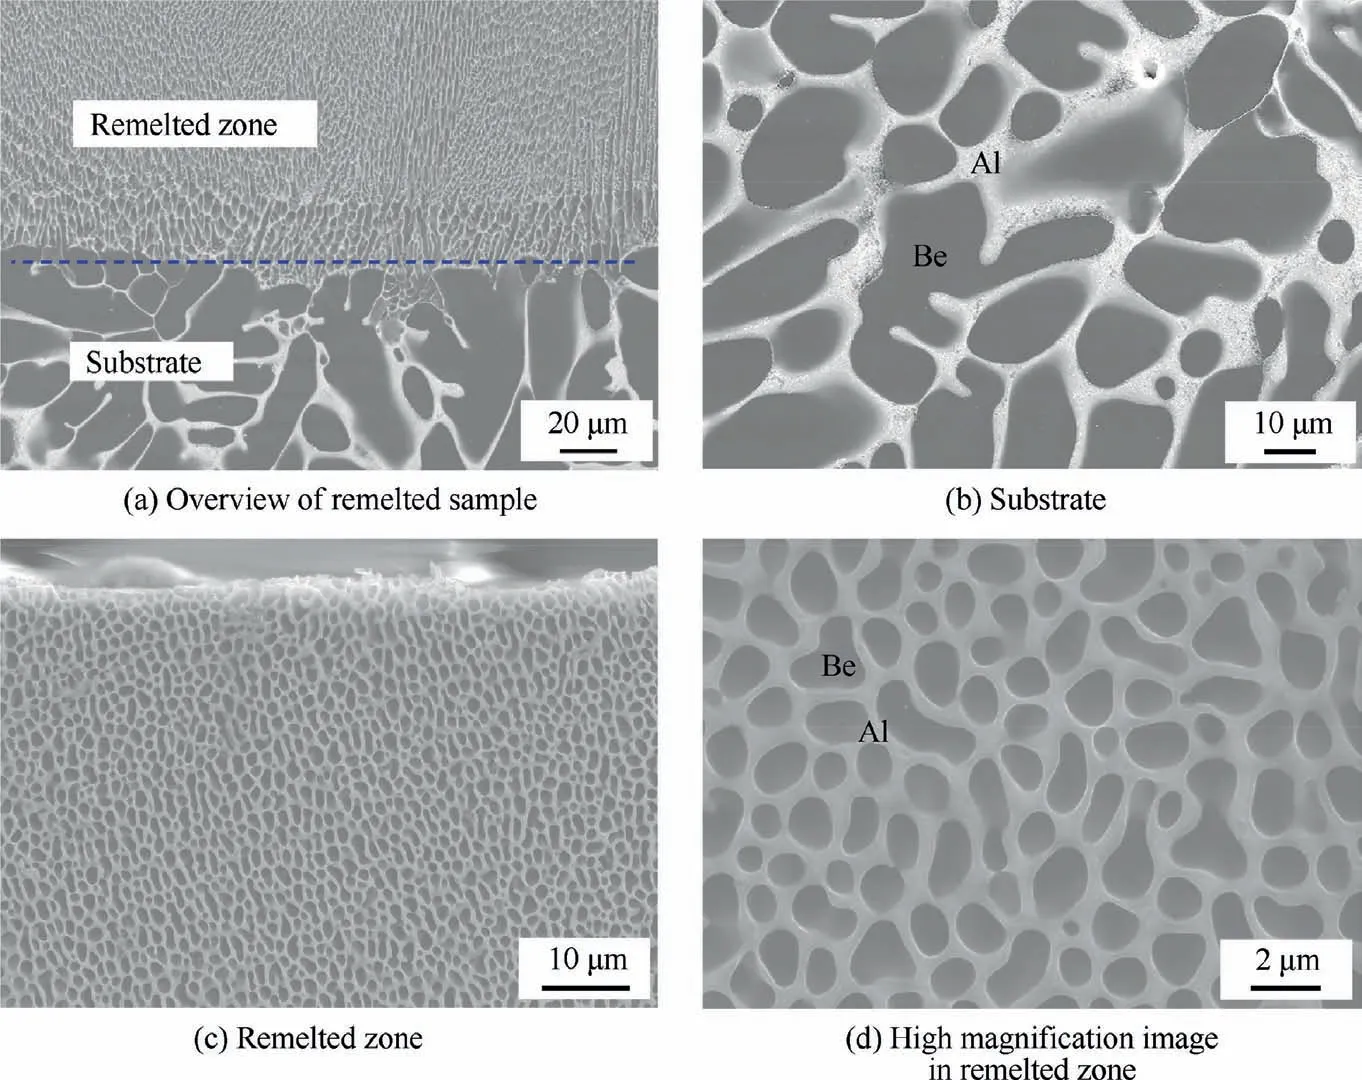
Fig. 13 SEM images of LSRed Be-Al alloy.
involved in this paper,Sc and Zr elements prefer to form intermetallic compounds with Be during the solidification process,which is consistent with the literature.18The solidification thermodynamic behavior of the Be-Al-Sc alloy was analyzed on behalf of the Be-Al-Sc-Zr alloy. It was presumed that Be(l)and Al(l) may have the following reactions with Sc.
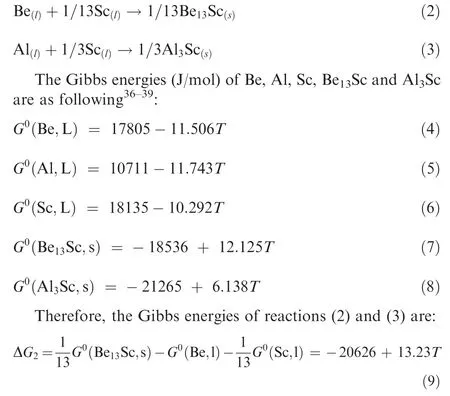
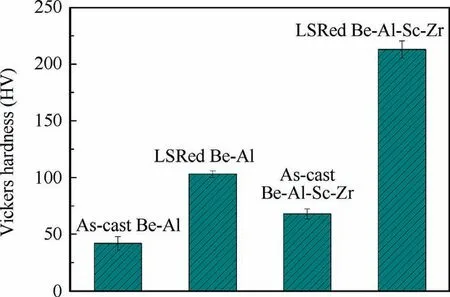
Fig. 14 Vickers hardness values of substrate and remelted zone of LSRed Be-Al-Sc-Zr and Be-Al alloy.
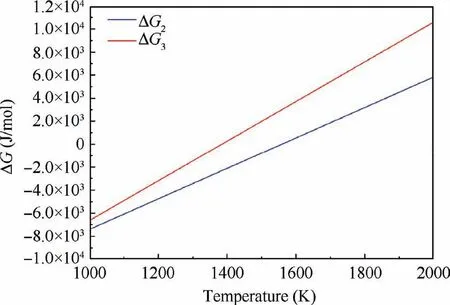
Fig. 15 Changes of Gibbs free energy (ΔG) via temperature for different reactions.

Thus,scandium additions to a Be-Al alloy cause the formation of the intermetallic compound Be13Sc rather than Al3Sc,resulting from the low Gibbs energies of Be13Sc compared to that of Al3Sc, as shown in Fig. 15.
Under a laser procedure, the cast Be-Al-Sc-Zr alloy is rapidly melted and then solidified. In this process, the temperature of the molten pool usually can exceed 1800°C,which can be measured by a color pyrometer equipped on a laser cladding head. The melting point of the intermetallic compound Be13Sc is approximately 1740°C.40Therefore, a small amount of unmelted Be13(Scx,Zr1-x) phase remains at the bottom of the remelted layer due to the low temperature and fast solidification speed around the remelted interface. Moreover, the fine Be13(Scx,Zr1-x)phase in the remelted layer is a new phase that is renucleared and built up.
According to a model by Kurz and Fisher(KF)the primary dendritic spacing λ can be predicted as a function of the temperature gradient GTand solidification rate R, which can be described as41:

Since LSR processing is a rapid solidification process relative to that of a general casting process, it forms a finer structure than that of in as-cast substrate.
4.2. Strengthening mechanism
Since it is difficult to characterize mechanical properties such as yield strength by LSRed Be-Al alloy, we focus on the Vickers hardness for different samples. Several literatures reported42,43the relationship between the Vickers hardness Hv and yield strength σyapproximately follows the form as below:

Therefore,we can preliminary explain the Vickers hardness change law by analyzing different strengthening mechanisms of Be-Al alloy.
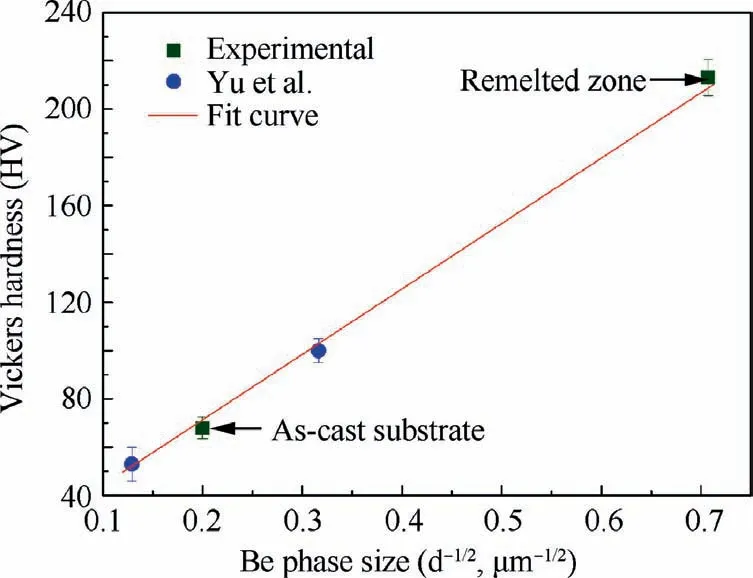
Fig. 16 Vickers hardness values of the substrate and remelted zone of the LSRed Be-Al-Sc-Zr alloy.45
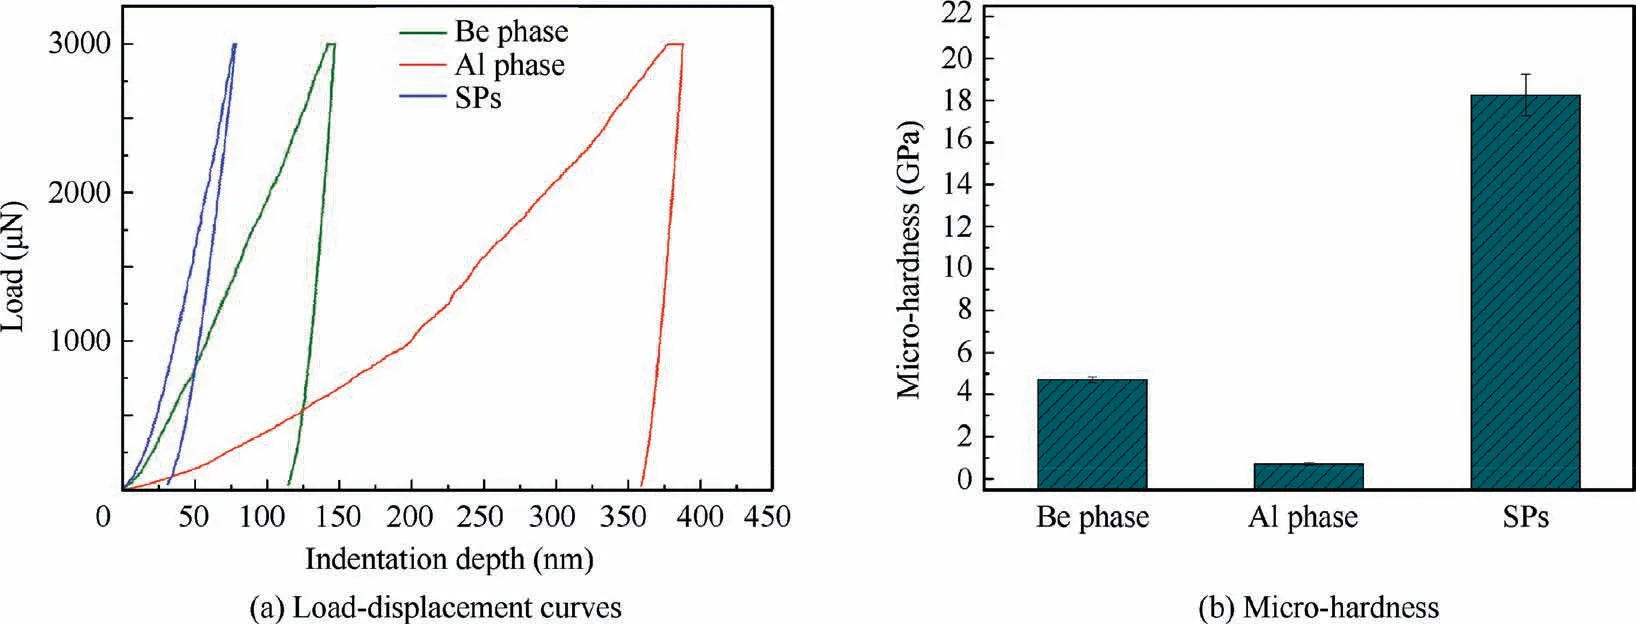
Fig.17 Load-displacement curves and micro-hardness dates derived with Berkovich indenter in Be,Al and SP phases of as-cast Be-Al-Sc-Zr alloy.
4.2.1. Effect of fine-grain strengthening
For polycrystalline materials, the relation between Hv and grain size (d) could be calculated according to the classical Hall-Petch equation44:

where Hv0and kHare material constants.
Fig. 16 reveals that a high Vickers hardness is associated with smaller Be phase sizes45. This means that for the dualphase composite (Be-Al), the relation between the Vickers hardness and Be phase size also conforms to the Hall-Petch equation. By fitting the curve, the following relationship can be obtained:

The results obtained by analyzing the beryllium metal according to the Hall-Petch equation and the results acquired in this paper show similar trends in Vickers hardness.44Furthermore, the value of Hv0obtained for a Be-Al-Sc-Zr alloy is approximately 278 HV μm-1/2, which is high than that of kH(approximately 208 HV μm-1/2) reported for a plasmasintered Be sample.44It should be noted that the effect of the SPs on the hardness of Be-Al alloy are not considered.
4.2.2. Effect of second phase strengthening
For Be-Al alloy, the appearance of the SPs will increase the hardness of composites. Here a rule of mixtures is used to initially consider the effect of the SPs on hardness of Be-Al alloy46, as follows:

where HBe, is the hardness of the Be phase, HSP, is the hardness of the SP, HAl, is the hardness of the Al phase of Be-Al alloy, VBe, is the volume fraction of Be phase, and VSP, is the volume fraction of SP. The nano-indentation technique has been used to measure the micro-hardness properties of Be phase, Al phase and SPs of as-cast Be-Al-Sc-Zr alloy.Fig.17(a)shows the typical load–displacement curves of three independent phases, Be, Al, and SPs, of the as-cast Be-Al-Sc-Zr alloy with a maximum load of 3 mN. The micro-hardness values of Be, Al and SP phases of cast Be-Al-Sc-Zr alloy are approximately 4.7 GPa, 0.7 GPa and 18.3 GPa, respectively,as shown in Fig. 17(b). Therefore, the hardness of the SP is approximately 5 times that of the Be phase and 20 times that of the Al phase. Therefore, the Be phases (volume fraction approximately 70%) are major factors to overall hardness of Be-Al alloys. Besides, the hard phase Be13(Scx,Zr1-x) intermetallic compounds also play a very important role for overall hardness, which depends on its volume fraction.
5. Conclusions
The relationship between microstructure and hardness of ascast Be-Al-Sc-Zr and Be-Al alloys processed by LSR were established, and the strengthening mechanism Be-Al alloy was also discussed. The conclusions were outlined below:
(1) Low laser energy input is beneficial to avoid the forming of pores and cracks, while the size of the molten pool decrease with decreasing laser energy input. The optimized process parameters of a laser power 800 W and a scanning speed of 1500–2000 mm/min are obtained.
(2) The microstructure of the remelted zone consists of Al phase forming a network structure that wraps axiolitic Be phase. Sc and Zr elements form blocky Be13(Scx,Zr1-x) intermetallic compounds, and the atomic ratio of Sc and Zr elements is approximately 2:1.
(3) The size of the Be phase and the Be13(Scx,Zr1-x) intermetallic compound in the substrate as significantly refined from 25 μm and 8 μm, respectively, to 2 μm and 1.5 μm in the remelted zone, respectively.
(4) The Vickers hardness in the remelted zone (approximately 100 HV) is approximately 2.5 times that of cast Be-Al alloy (approximately 40 HV). The relation between the Vickers hardness and the Be phase size conforms to a Hall-Petch relationship. Furthermore,the formation of fine Be13(Scx,Zr1-x) can further significantly increase the Vickers hardness of the remelted zone to 210 HV.
Declaration of Competing Interest
The authors declare that they have no known competing financial interests or personal relationships that could have appeared to influence the work reported in this paper.
Acknowledgement
This study was co-supported by the National Key Technologies R & D Program of China (No. 2016YFB0700404).
 CHINESE JOURNAL OF AERONAUTICS2021年8期
- CHINESE JOURNAL OF AERONAUTICS的其它文章
- A novel virtual material layer model for predicting natural frequencies of composite bolted joints
- Multi-layered plate finite element models with node-dependent kinematics for smart structures with piezoelectric components
- Modeling bending behavior of shape memory alloy wire-reinforced composites: Semi-analytical model and finite element analysis
- Sequential ensemble optimization based on general surrogate model prediction variance and its application on engine acceleration schedule design
- Transition prediction and sensitivity analysis for a natural laminar flow wing glove flight experiment
- Modeling on mechanical behavior and damage evolution of single-lap bolted composite interference-fit joints under thermal effects
