Experimental investigation of thermal effect on cavitation characteristics in a liquid rocket engine turbopump inducer
Chunmin WANG, Le XIANG, Yonghu TAN, Hui CHEN, Kifu XU
a Northwestern Polytechnical University, Xi’an 710072, China
b Xi’an Aerospace Propulsion Institute, Xi’an 710100, China
c Academy of Aerospace Propulsion Technology, Xi’an 710100, China
KEYWORDS Bubble dynamic;Cavitation instability;Inducer;Thermal effect;Visualization experiment
Abstract The objective of this paper is to investigate the effect of water temperature on cavitation characteristics in a turbopump inducer,a series of experiments at different temperatures have been conducted in a newly developed visualization test facility.It is found that higher temperature shows little influence on the non-cavitation performance and breakdown characteristic in the investigated range.The relationship between cavitation development and pressure fluctuation has been discussed in detail. Higher temperature displays a remarkable stabilization effect on the cavitation excited pressure. In particular, the inception cavitation numbers of both the super-synchronous rotating cavitation and synchronous rotating cavitation are decreased at higher temperatures, and the corresponding frequencies are not affected,while the amplitudes are distinctly reduced,and the occurrence range of synchronous rotating cavitation is significantly narrowed. A generalized Rayleigh-Plesset equation has been employed to account for the thermal effect on the bubble development,which may provide a deep insight in understanding the experimental results.Thermal effect is found to act as a remarkable dissipation mechanism to suppress the bubble growth, smooth the collapse.In particular,the excited pressure during collapse is smaller at higher temperatures,which may lead to the stabilization effect of high temperature in this study.
1. Introduction
Inducer is a key component installed upstream of the main pump to improve the cavitation performance of turbopump in Liquid Rocket Engine (LRE). Due to its small blade angle and high solidity,it can operate normally under partial cavitation condition without distinct head deterioration.The cavitation induced flow instabilities may occur at design working condition, and cause intensive vibration of the rotating shaft,or even lead to launch failure.During the development of Chinese new generation large thrust LRE, the rotating cavitation has long been one of the main excitation sources of the high amplitude vibration of turbopump,thus it is essential to obtain a deep understanding about cavitation instabilities for better design of turbopump, and then better reliability of LRE.1
In addition,the propulsion systems of modern LRE tend to use cryogen(liquid oxygen,liquid hydrogen,et al.)as working fluids, for their high specific impulse and environmentally friendly. Due to the specific physical properties, the cavitation characteristic of cryogen is different from that of room temperature water. As the heat transfer during a bubble growth in room temperature water can be ignored,the cavitating process of room temperature water can be considered isothermal.However,the heat transferred from the bulk liquid to the cavity is fairly large for thermal sensitive fluid such as cryogen,Freon, heated water et al.2Then temperature gradient forms between the cavity and the main flow, leading to the lower local temperature inside the cavity. The corresponding physical properties are also affected, producing suppression effect on the further bubble development, which is called thermal effect.Till now,the cavitation thermal effect is not fully understood, and the relationship between thermal effect and cavitation instabilities is still debatable. Thus it is becoming one of the primary focus areas of all turbopump cavitation investigators over the past decades.
Stahl and Stepanoff3suggested the B-factor to estimate the temperature depression based on a simple static heat transfer balance. Ruggeri and Moore4carried out abundant experiments to obtain inducers’ cavitation performance curves using various liquids as working liquid,and developed empirical correlations to quantitatively predict the influence of thermal effect on cavitation performance of inducer. However, the works are limited to the steady macroscopical cavitation performance due to the technical limitation at that time. With the development of technology, more and more advanced experimental methods are introduced to study the inducer cavitation.Franc et al.5estimated the cavity’s temperature depression inside an inducer through visualization experiments using refrigerant R-114 as working fluid. Yoshida et al.6,7investigated the cavitation thermal effect of liquid nitrogen inside a rotating inducer through indirect visualization. Ito et al.8developed a blow-down test facility to perform visualization of cryogenic cavitating flow based on a three-bladed inducer.Kim et al.9investigated cavitation instabilities in a cryogenic pump using both room temperature water and liquid oxygen as working fluid.
The aforementioned works are mostly based on cryogens.However, taking the cost, complexity and safety into account,it is still a challenging task to conduct visualization experiments in a rotating inducer using cryogens as working fluid directly. Many investigators choose heated water as a cryogenic simulant to perform experimental study on cavitation thermal effect,which seems more realizable.Cervone et al.10,11conducted experiments to investigate the effect of water temperature on the cavitation performance of inducers. Ehrlich and Murdock12developed an inducer cavitation visualization test facility using heated water as working fluid, and derived a dimensionless thermal parameter DB to scale the thermal effect.Recently,Kim and Song13measured cavitation thermal effect in a turbopump inducer based on their experimental results at various water temperatures and rotating speeds,and confirmed that increasing temperature would reduce the critical cavitation number below which breakdown occurs.However, according to Cervone’s experimental data based on a 3D NACA0015 hydrofoil,14higher temperature results in a longer and thicker cavity, which is significantly different from the aforementioned thermal effect. Chen et al.15verified this inverse thermal effect through numerical methods. This phenomenon has also been verified by their recent experimental results inside a converging–diverging nozzle using liquid nitrogen as working fluid16.
Although cavitating flow in inducers has been investigated abundantly in the past decades, it is still debatable how the water temperature affects the cavitation dynamics inside a rotating inducer. Inspired by the objective of obtaining deep understanding of the cavitation thermal effect inside a rotating inducer, we performed a series of experiments on a newly developed visualization test facility using heated water as working fluid. The temperature of the working fluid inside the facility can be controlled accurately, thus experiments can be conducted under different thermal effect strength, allowing us to study the influence of thermal effect on both cavitation performance and cavitation instabilities.
2. Theory background
Cavitation is a physical transformation from liquid to vapor,which demands latent heat for phase change.For a single bubble, the Rayleigh-Plesset equation can be used to describe its development.If we take the compressibility into consideration,it can be generalized as:

where R is the bubble radius,ρlis liquid density,C is the sound velocity,which is assumed constant,p0is far field pressure,p is the pressure on the bubble surface. Taking the viscosity, surface tension and partial gas pressure inside the bubble into consideration,assuming that bubble surface is under force balance, we have:2

where TBis the local temperature inside the bubble, pv(TB) is saturated vapor pressure with respect to TB,pg0is the pressure of non condensable gas inside the bubble,R0is the initial bubble radius,S is the surface tension, μlis the dynamic viscosity,χ is thermodynamic constant. Generally, the temperature TBinside the bubble is smaller than the surrounding T∞, pv(TB)is also smaller than pv(T∞). Thus we have:

The other terms of Eqs. (3) are dependent on the external conditions,except for that in square bracket,which is the thermal term, representing the influence of thermal effect. As we see, the thermal effect is closely related to the temperature depression (TB-T∞). Thus to evaluate the thermal effect,the temperature depression should be calculated first.
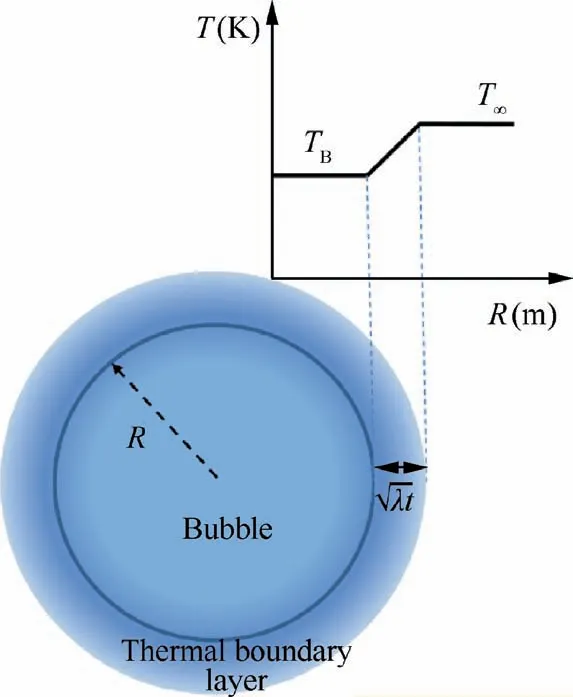
Fig. 1 Heat transfer on bubble surface.
Fig. 1 displays a simple heat transfer model developed by Brennen.2It is assumed that all heat transferred from the bulk liquid are supplied for the phase change, thus a thermal boundary layer and temperature gradient form on the bubble surface. If the thermal boundary layer is thin enough in comparison with the bubble radius,it has the order of(λt)0.5,then a heat transfer balance can be built up according to the Fourier’s law:

where k is heat conductivity coefficient, ρvis vapor density,λ=k/(ρlcp) is thermal diffusivity, cpis specific heat capacity,η is latent heat of evaporation. Then the temperature depression is related to the bubble development:

In the deduction of the thermal term, we obtain an important parameter ∑=ρv2η2/(ρl2cpT∞λ0.5), m⋅s-3/2, which is only dependent on working temperature and the corresponding physical properties, and usually applied to measure the strength of thermal effect. As we see from Eq. (6), thermal effect is stronger with larger ∑.
Fig. 2 displays the calculated ∑versus dimensionless temperature for different liquids, and the typical working temperature for each liquid is also marked in the figure.Tris the triple point temperature,Tcis the critical temperature.As we see,liquid hydrogen shows the strongest thermal effect(∑=1.8×10⁶m⋅s-3/2, T=-251°C), then the liquid nitrogen (∑=8.2×10⁴m⋅s-3/2, T=-190°C) and liquid oxygen(∑=8×10⁴m⋅s-3/2, T=-173°C). The thermal effect of room temperature water is the weakest (∑=6 m⋅s-3/2,T=25°C). In addition, it is clearly revealed that thermal effect is stronger with higher temperatures for each liquid,indicating that the heated water may display similar thermal effect in comparison with that of cryogen.The curves for liquid oxygen and water are nearly overlapped. According to the figure,water at 120°C has the same value as liquid oxygen at-185°C. This is the theoretical basis that heated water can be used as cryogenic simulant.
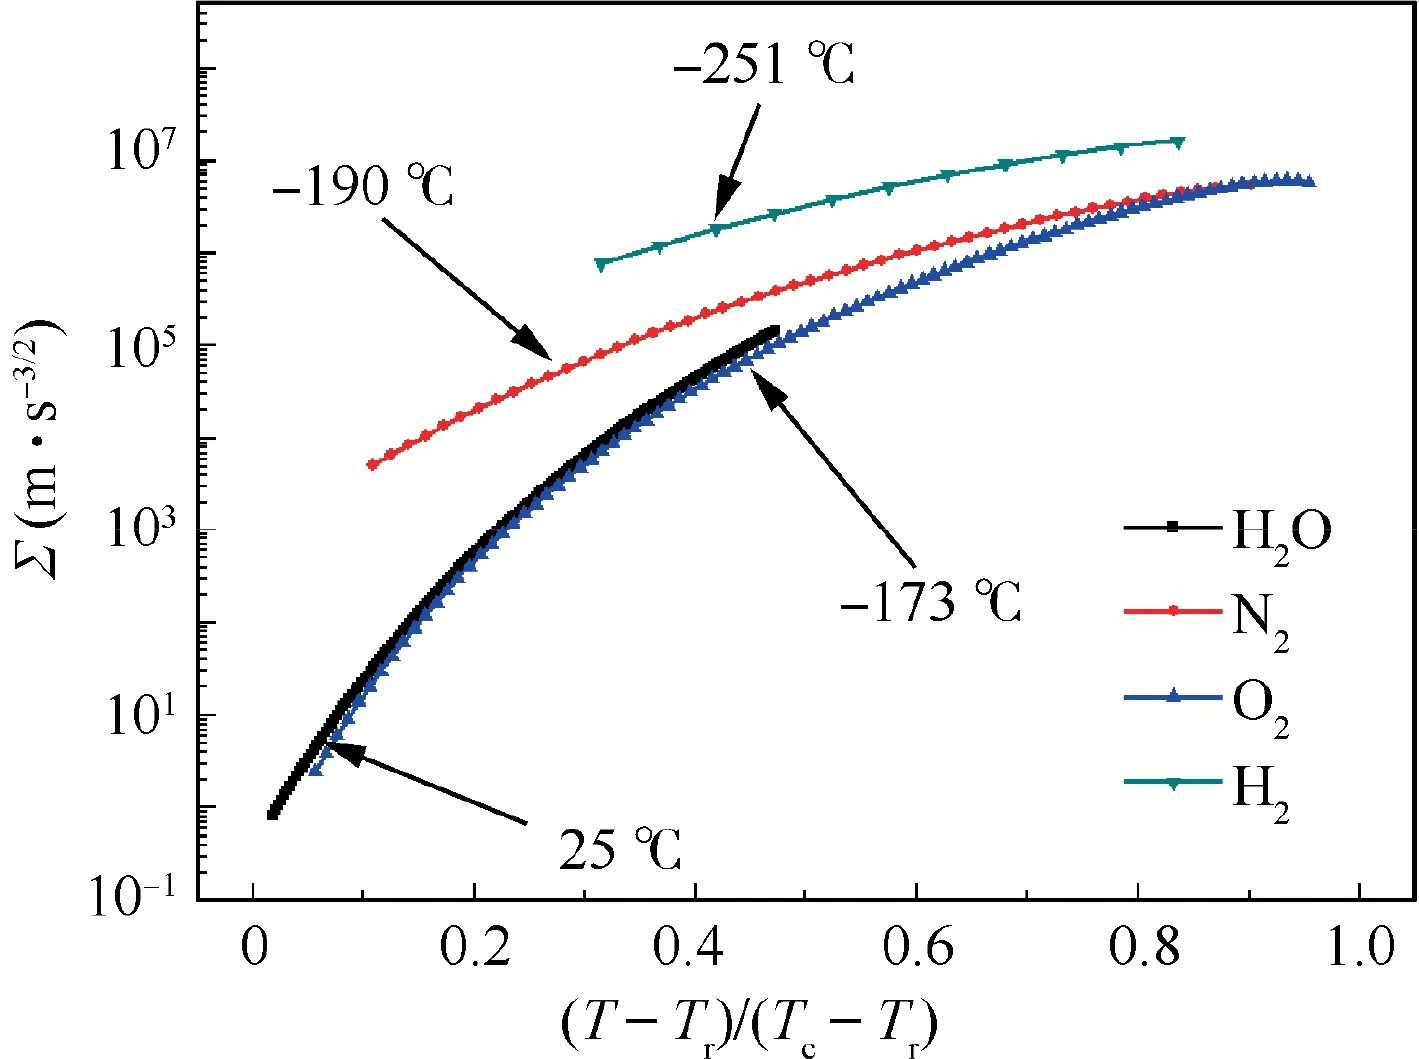
Fig. 2 ∑for different liquids.
3. Experimental facility
The test facility employed in present study is composed of the water tank, the closed recirculation loops, the test section, the valves, the filter et al. A booster pump is located downstream of the test section which can provide the desired volumetric flow rate when choked condition occurs. An additional temperature-control system including the electronic heater,heat exchanger and feedback devices is embedded to provide the desired water temperature. The temperature can be heated maximum to 95°C with accuracy of ±0.5°C. The length of straight pipeline upstream of the test section is about 15D (D is the internal diameter of test section), which can provide a uniform inlet boundary condition. The housing of test section is made of transparent Plexiglas to facilitate visualization of cavitating flow in the inducer. The temperatures are measured by the temperature sensors installed both inside the tank and upstream of the test section (x/D=8.5).
Six dynamic pressure transducers with frequency response 5 kHz are used to collect the unsteady pressure in the blade tip region,and their locations are shown in Fig.3.The measuring range of dynamic pressure transducer is 0–344.7 kPa with uncertainty of ±5%. Two static pressure transducers with uncertainty of 0.075% full scale (1.6 MPa) are installed upstream (x/D=7) and downstream (x/D=-5) of the leading edge of the inducer blade to obtain the static head coefficient. An electromagnetic flow meter with uncertainty of 0.5% full scale (150 L/s) measures the volumetric flow rate in the loop. More detailed information about the test facility can refer to Ref.17.
Fig.4 displays the test piece used in this study,it is a typical high solidity, equal-pitch inducer, which is a scaled model of the product used in a real liquid oxygen turbopump. In our past hydraulic experiments of the prototype,18intensive vibration of the shaft caused by cavitation is observed, thus it is a typical research object to investigate inducer cavitation characteristics. The blade tip angle is 9.6°, solidity of tip is 3.2, and the tip clearance is 1 mm, more detailed design parameters of the inducer can refer to Ref.17.In this study,the movies of cavitating flow inside the inducer are acquired at 5000 frame/s(1024 pixel×800 pixel) by a high-speed camera at exposure times of 1 μs in junction with a high intensity LED lighting system. A synchronizer is applied to link the high-speed camera system and the data acquisition system, thus the cavitation number at which the videos are taken can be controlled accurately.
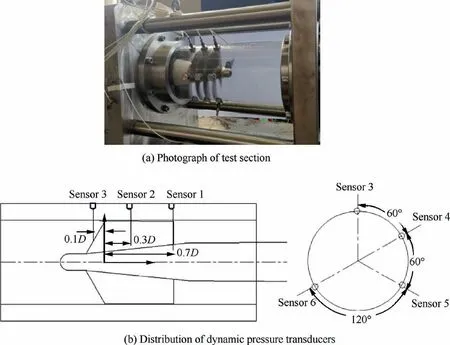
Fig. 3 Test section and distribution of dynamic pressure transducers.
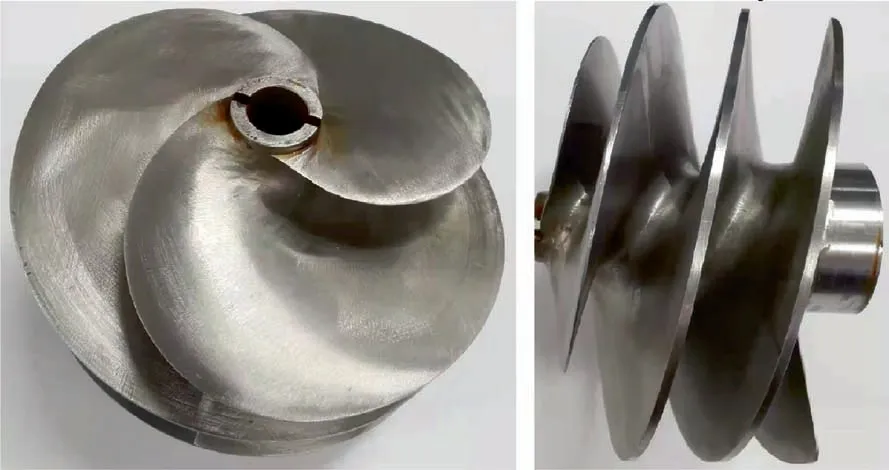
Fig. 4 Model inducer.
4. Results and discussion
4.1. Cavitation performance
For the experimental study of thermal effect,it is important to control the temperatures accurately. Thanks to the reliable temperature-control system in our test facility, the amplitudes of temperature variation are less than 0.5°C during a test.Both non-cavitation and cavitation tests have been carried out under three temperatures, 25, 51 and 71°C. In hydraulic machinery, the dimensionless parameters flow coefficient Φ and head coefficient Ψ are usually utilized to measure the pump performance, the results are displayed in Fig. 5, Ω is the rotational speed. The head coefficients are decreased linearly with increasing flow coefficients, as expected. Note that the room-temperature tests results obtained from different rotational speeds overlapped quite well, which can be attributed to that all the tests were performed at fully-developed turbulent regime(Re=ρlVmD/μl>1×105,Vmis axial velocity)and Reynolds-independent condition was obtained. These results also indicate good repeatability of the facility. The results of high temperatures can also be seen from Fig. 5(a),and little difference can be identified from those of room temperatures, indicating that temperature have little influence on the non-cavitation performance.
The cavitation performance tests were carried out at constant rotating speed and flow coefficient, the suction pressure was decreased continuously from a high value to totally breakdown points. The results obtained at different temperatures are displayed in Fig. 5(b), ΨNCis nocavitation head coefficient, σ is cavitation number, the head coefficients are kept constant at higher cavitation numbers,and they deteriorate rapidly after cavitation number reduces to a critical value. The curves nearly overlapped after totally breakdown for the three temperatures, thus higher temperature shows little influence on the breakdown characteristics in the investigated temperature range. Though thermal effect is stronger with increasing temperatures, the calculated ∑ is 414 m⋅s-3/2for T∞=71°C according to Fig. 2, it is still too weak to impose on the cavitation performance observably.
However, note that the head coefficients decrease about 10% at certain cavitation number (σr), forming a step before totally breakdown. The inception cavitation numbers of the formation of the step are σr=0.064 (T∞=25°C),σr=0.058(T∞=51°C),σr=0.056(T∞=71°C),thus they are decreased with increasing temperatures. Refer to our past investigation1, the formations of the steps are closely related to cavitation instabilities.Thus the results reveal a noteworthy influence of thermal effect on the cavitation instabilities,which will be further clarified in the next section.
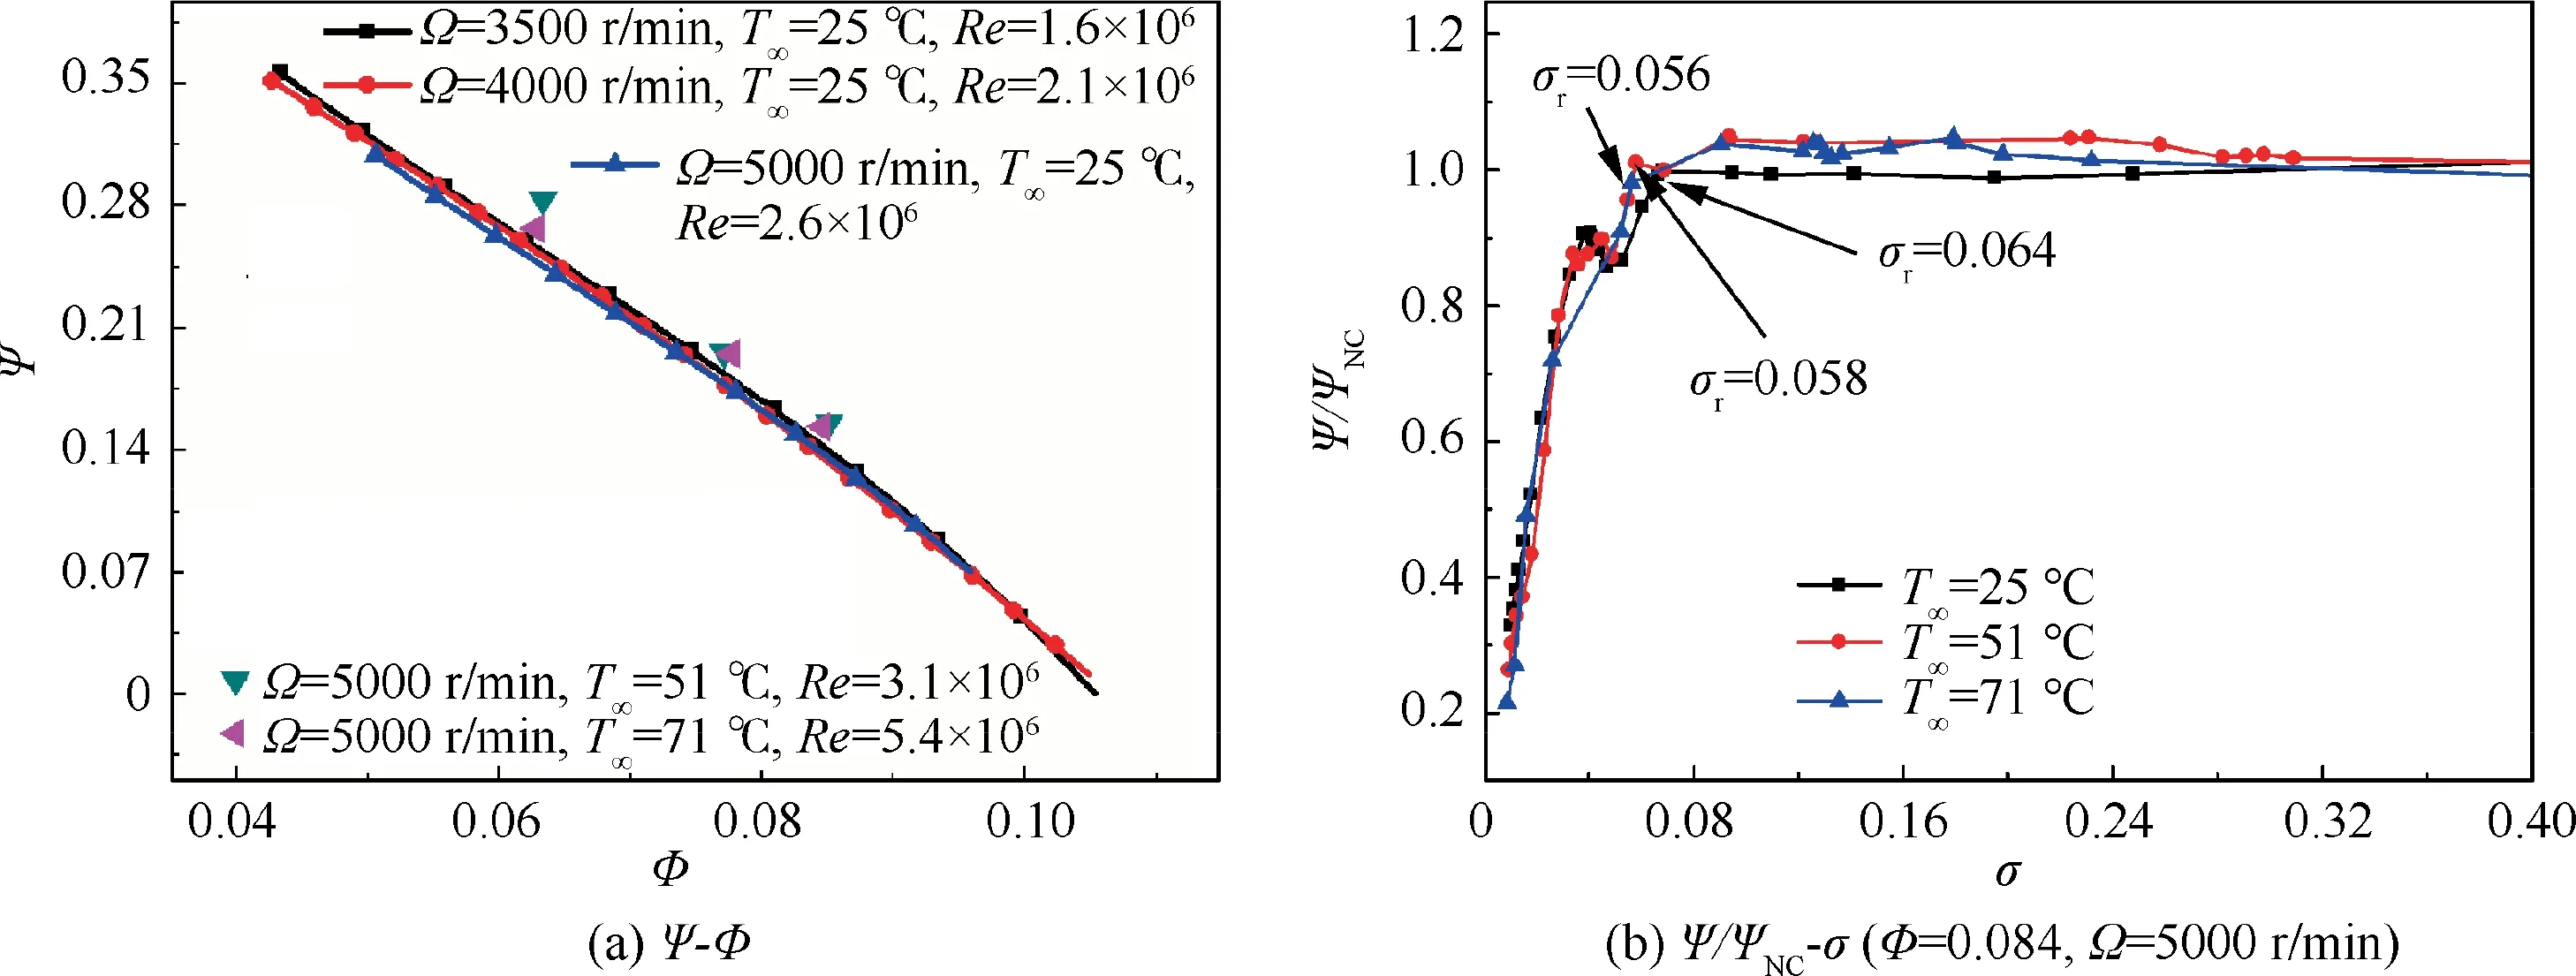
Fig. 5 Non-cavitation and cavitation performance.
4.2. Relationship between cavitation development and pressure fluctuation
To investigate the relationship between cavitation development and pressure fluctuation, we refer to the experimental results for room temperature water. Fig. 6 shows the pressure fluctuation collected from inlet (Sensor 3), middle (Sensor 2)and outlet(Sensor 1).In Fig.6,1 psi=6895 Pa.The three signals reveal different characteristics, indicating that they are closely related to the cavitation development.
At larger cavitation number(σ=0.42,t=41 s),cavitation arises from the core of tip leakage vortex, and the size is too small to affect the measuring points, thus all the three signals are not affected by the leakage flow cavitation, and the amplitudes of the pressure fluctuation are quite stable. With cavitation number decreasing (σ=0.2, t=71 s), the size of cavitation becomes larger, but is still confined within the tip leakage vortex. The trailing edge of cavitation can touch the inlet measuring point, thus the amplitude of inlet signal increases slightly, signals from the other two points are still kept stable. When cavitation number decreasing further(σ=0.13, t=104 s; σ=0.094, t=121 s), the sheet cavitation in the shear layer of leakage flow appears from the corner of the tip and merges with the tip leakage vortex cavitation,forming a quasi-stable triangular cavitation region on each blade,and the inlet measuring point is distinctly affected.Due to the abundant bubble generations and collapses inside the cavitation, local pressure fluctuation amplitude amplifies remarkably. At σ=0.094 (t=121 s), the cavitation area can touch the middle point, thus the amplitude of middle signal increases slightly.
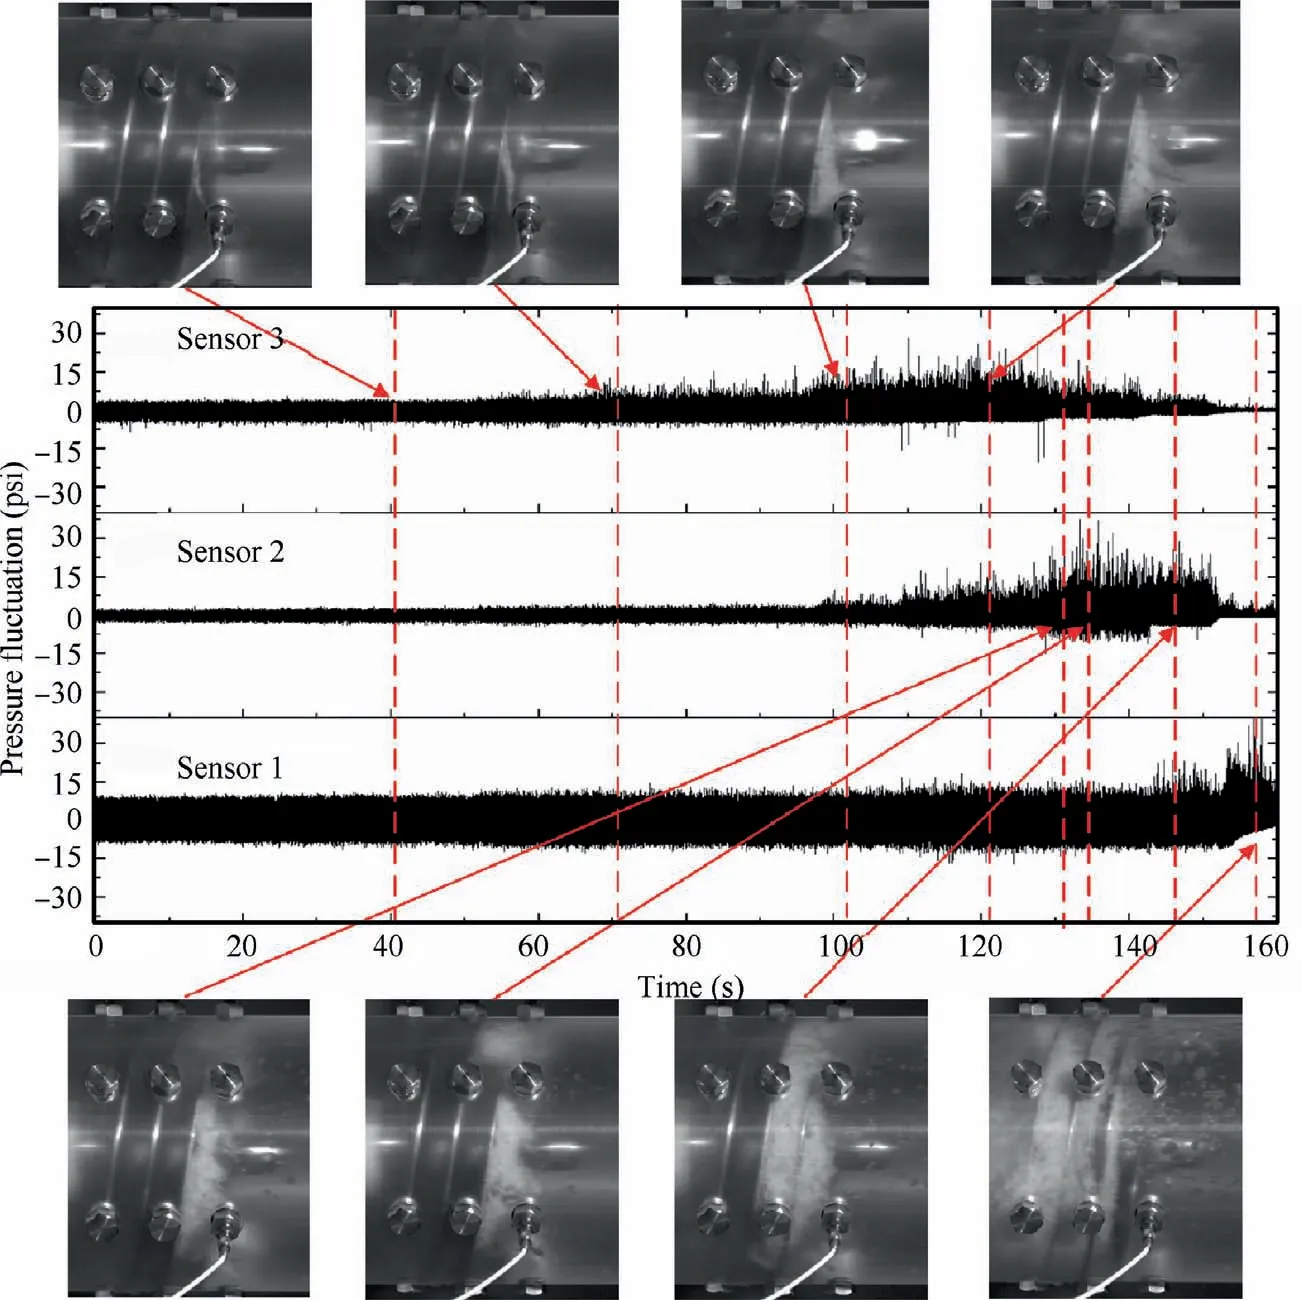
Fig. 6 Pressure fluctuation and cavitation structures (Φ=0.084, T∞=25°C).
With cavitation number decreasing further, two cavitation instabilities occurs according to our past investigation,1Super-Synchronous Rotating Cavitation (SSRC, σ=0.069,t=132 s; σ=0.066, t=136 s) and Synchronous Rotating Cavitation (SRC, σ=0.04, t=145 s). As we see from Fig. 6, the amplitude of inlet signal decreases gradually, while that of middle signal increases at this stage. At σ=0.04(t=145 s), the amplitude of inlet signal becomes much smaller than that of middle signal. The cavitation stretches along the suction surface of blade as cavitation number decreases,when it reaches the blade overlapping region, the cavitation periphery becomes confined by the adjacent blade, instead of fluctuating freely just as the situation at higher cavitation numbers, thus the unsteadiness of cavitation fluctuation is weakened for the inlet measuring point, resulting in that the amplitude of local pressure fluctuation decreases. The middle point is totally affected by the long cavitation, and thus the pressure amplitude amplifies remarkably.
The outlet measuring point is not affected during all the discussed stage, when cavitation reaches the outlet (σ=0.015,t=156 s), the outlet flow angle distribution is changed by the cavitating flow, and the impeller loses pressurizing ability,head breakdown occurs. Meanwhile, the amplitude of outlet signal amplifies distinctly due to cavitation. All the cavitation instabilities vanish, and then the pressure fluctuation amplitudes from inlet and middle become much smaller.
The aforementioned discussion clarifies the influence of cavitation development on the amplitudes of pressure fluctuation, the frequency characteristic will be discussed in this section. Wavelet transform is a useful tool to deal with unsteady experimental data, but it has been rarely applied to analyze the inducer cavitation instabilities, though it is maturely used in compressor field.19Fig.7 displays the wavelet transform results of pressure signals collected from inlet measuring point at four typical cavitation numbers(pdis the pressure pulsation signal). The wavelet base function is Morlet.The upper in the figure is original signal,the middle is wavelet power spectrum, and the bottom is FFT result. To be clearly displayed, the power spectrum is calculated by log-base 2. At larger cavitation number (σ=0.48, t=22 s), the peak frequency is 3f0(f0is rotation frequency), and there are little any other frequency components. At σ=0.09 (t=120 s),the peak frequency is still 3f0, and the amplitude is larger. It’s worthy to note that,the wavelet energies within high frequency range (>3f0) are increased remarkably, which is result of cavitation development. But no higher order frequency component can be identified from FFT result, indicating that the cavitation induced pressure fluctuation can be characterized as disorder manner. The frequency components f0and 2f0can also be identified, but they are intermittent.
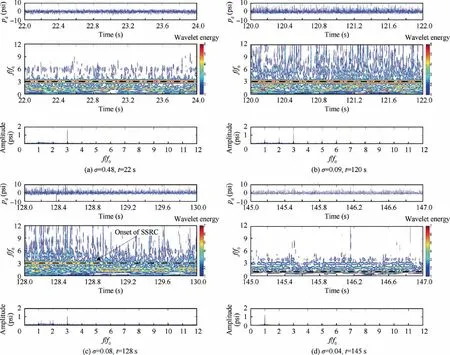
Fig. 7 Wavelet analysis for different cavitation numbers (Φ=0.084, T=25°C, Sensor 3).
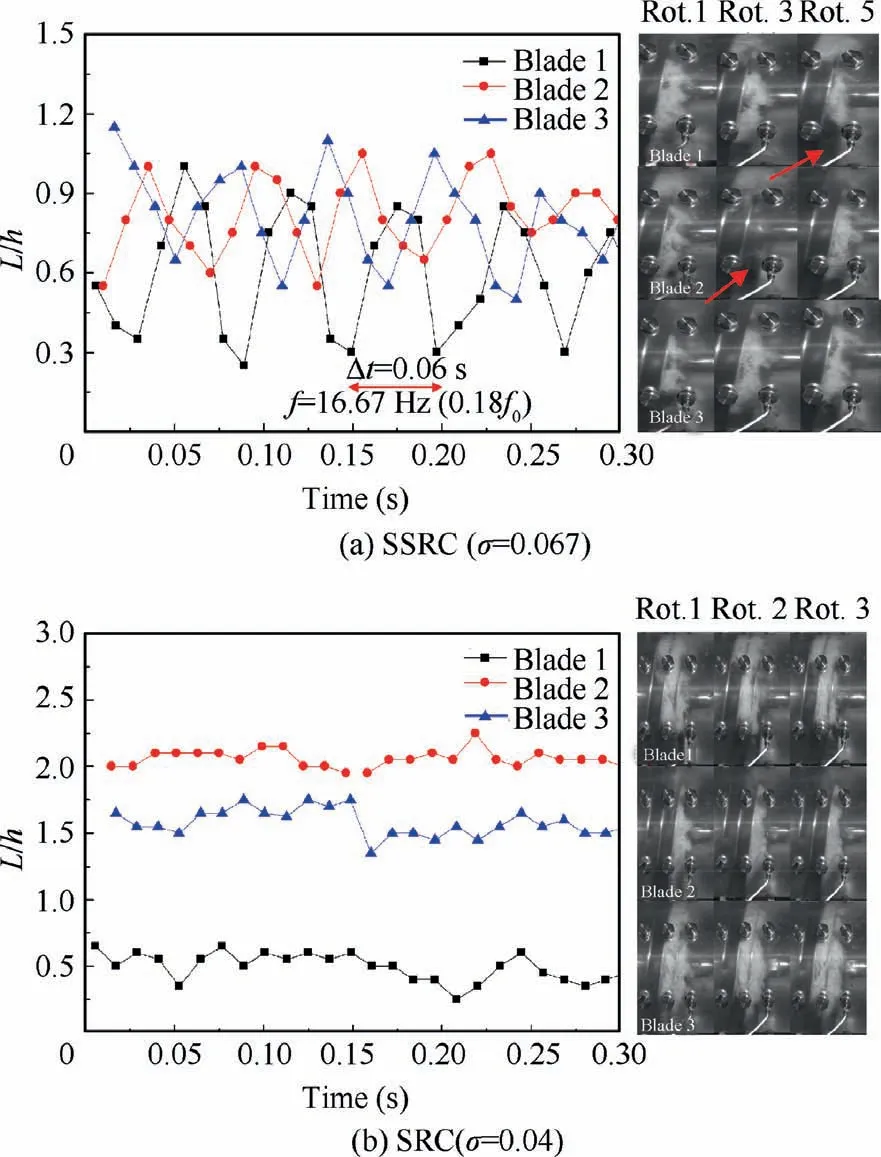
Fig. 8 Dimensionless cavity length variation.
At σ=0.08 (t=128 s), SSRC starts to occur, 1.18f0and the harmonic frequency 1.82f0can be distinctly identified from FFT result. The cavitation length variation is displayed in Fig. 8(a) when SSRC occurs, L is the cavity length, h is the blade spacing.The periodical cavitation fluctuation propagates in the direction ‘‘...Blade 3-Blade 2-Blade 1...”, which is the rotating direction of the impeller.And the frequency of cavitation fluctuation on each blade is 0.18f0,thus the rotational frequency f0should be added from a view of absolute coordinate system, forming the specific frequency 1.18f0. Referring to the wavelet power spectrum,the wavelet energy of 1.18f0becomes larger at 128.85 s, which can be considered as the onset moment of SSRC.This shows the superiority of wavelet transform in comparison with FFT, which cannot determine the exact onset moment of SSRC. In addition, the large wavelet energies spots within high frequency range tend to decrease after the occurrence of SSRC.
At σ=0.04 (t=145 s), SRC occurs, and it dominates the frequency characteristic, f0becomes the main frequency, and its frequency multiplications (2f0and 3f0) can also be identified. Fig. 8(b) displays the cavitation length variation when SRC occurs, cavitation on Blade 2 is the longest, and that on Blade 1 is the shortest, this asymmetry is not propagating in circumferential direction. Note that the large wavelet energies spots within high frequency range vanish totally.
In conclusion, cavitation development magnifies the local pressure fluctuation, and cavitation induced pressure fluctuation acts as disorder manner within high frequency range,instead of forming a stable frequency,thus cavitation development will not change the main frequency components until cavitation instabilities occur. The frequency characteristics are changed when cavitation instabilities occur, and the large wavelet energy spots vanish within high frequency range (see Fig. 7(d)).
4.3. Thermal effect on cavitation characteristics
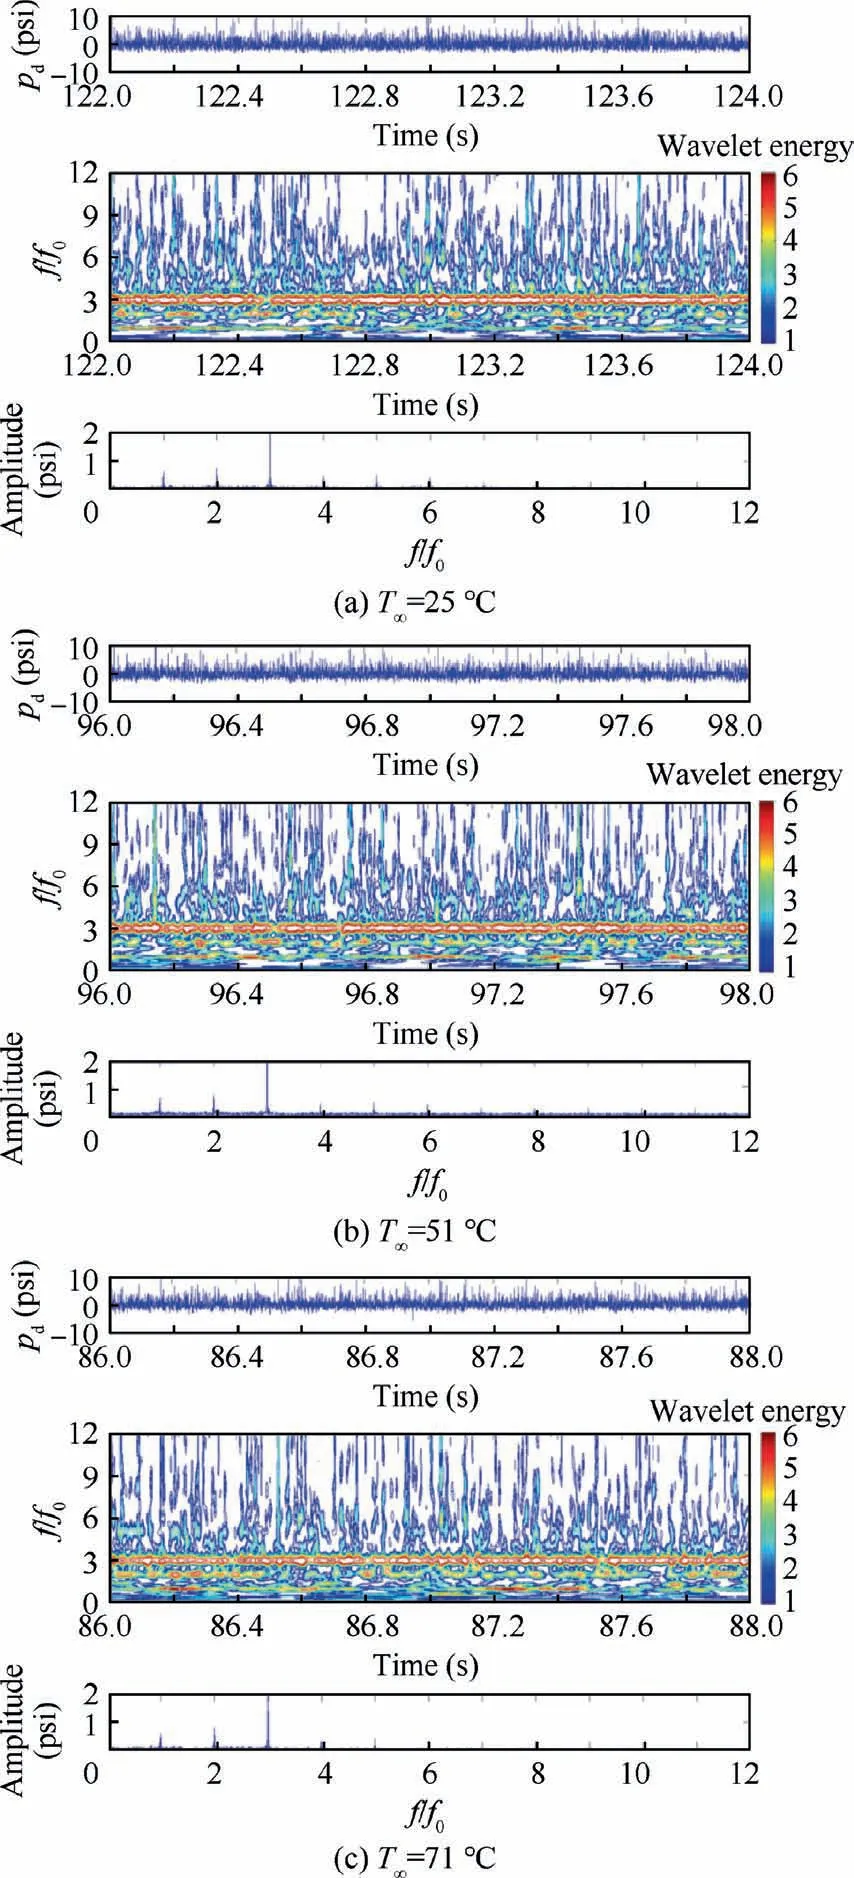
Fig. 9 Wavelet analysis of pressure fluctuation at different temperatures (σ=0.1, Φ=0.084, Sensor 3).
Fig. 9 shows the wavelet transform results at the same cavitation number for different temperatures.As discussed in the last section,the inlet measuring point has been affected at σ=0.1,thus the collected dynamic pressure represents cavitation induced pressure to a certain extent, the comparison of dynamic pressure at different temperatures can reveal the temperature effect on cavitation development.As we see,the dominant frequencies are 3f0for the three temperatures, and harmonic frequencies f0and 2f0can also be identified. The amplitudes are not affected by temperatures. If we focus on the high frequency range, the large wavelet energy spots are related to cavitation as discussed in last section,we can clearly recognize that the large wavelet spots tend to decrease with increasing temperatures, indicating that higher temperature can suppress the cavitation induced pressure.
To further quantitatively analysis the effect of temperature on the pressure fluctuation energy, the root-mean square method is introduced as follows:

where Anis the amplitudes at nth frequency components.
The calculated results are shown in Fig.10,the RMS values are constant at larger cavitation numbers(σ>0.4),as the cavities are too small to affect the measurement points.Note that the results of different temperatures are overlapped,indicating that temperatures have little influence on the non-cavitation pressure fluctuation. When the cavities stretch upstream to the measurement points,the RMS starts to increase.It is notable that RMS is distinctly smaller at higher temperature, verifying the suppression effect of higher temperatures. When cavitation instabilities occur,the amplitudes of pressure fluctuation are decreased remarkably with decreasing cavitation numbers, and the RMS values become overlapped again for the three temperatures.
Fig.11 shows the power spectrum of inlet pressure fluctuation at the three temperatures, as we see, the cavitation instabilities(SSRC and SRC)still exist at higher temperatures,and the propagating speed ratios of SSRC are not affected by the temperatures. However, several differences of the short time fast Fourier transformation results can be recognized. Generally, the amplitudes of the pressure fluctuations seem to decrease with increasing temperatures,verifying a stabilization effect of high temperatures. SSRC and SRC can be clearly identified at T∞=25°C, but they become more obscure at higher temperatures. Note that the amplitudes of cavitation instabilities seem to be more sensitive to temperatures than those of blade passing frequency 3f0.
In addition, higher temperatures also delay the cavitation instabilities.The occurrence ranges of SSRC and SRC are concluded in Fig. 12, higher temperature will distinctly shift the inception cavitation numbers of both SSRC and SRC to lower values,which is in accordance with the experimental results of Kim et al.9Note that the inception cavitation numbers for the occurrence of SRC are σ=0.065 (T∞=25°C), σ=0.06(T∞=51°C) and σ=0.055 (T∞=71°C), which are quite close to the onset cavitation number of the degradation of head coefficient (σr=0.064, 0.058, 0.056, see Fig. 2), indicating that SRC may be responsible for the head performance partial degradation before totally breakdown. In addition,the occurrence range of SRC is remarkably narrowed at higher temperatures,while occurrence range of SSRC seems not to be affected by temperatures.
4.4. Basic bubble dynamics
Although higher temperature shows little influence on the head breakdown characteristic in this study,it displays a remarkable stabilization effect on the cavitation instabilities as discussed above.Trying to figure out the physical source of the stabilization effect of high temperatures, we refer to the Rayleigh-Plesset equation considering thermal effect to explore the effect of temperature on the bubble growth in this section. Combining Eq.(1)with Eq.(2),Eq.(6),we can model the development of a bubble if proper boundary conditions are given.Eq.(1)is solved numerically through four-stage Runge-Kutta scheme in this study. Fig. 13 displays the comparison of predicted and experimental results at room temperature water. The bubble is produced by a ultrasonic pressure signal,20the surrounding pressure is given as p0=101325–1.29×10⁵sin(2πft),f=25 kHz. The initial bubble radius is 6.18 μm. As we see,the growth is fairly smooth, while the collapse is catastrophically, and it is followed by successive rebounds and collapses,which is a typical characteristic of bubble development. The predicted results agree fairly well with the experimental results,20indicating the numerical method utilized here is credible.
The predicted bubble developments at different temperatures are shown in Fig. 14. To make the results comparative,the drive terms for the bubble growth are kept constant,while the cavitation thermal effect is represented by the parameter ∑,which is calculated according to the temperature. In addition,the physical properties such as density, viscosity and surface tension at different temperatures are incorporated in Eq. (1).As we see, little differences can be recognized for the initial growth stage,as the bubble dynamic behavior is inertially controlled.2After a critical time, the influence of temperature becomes prominent, and the bubble growth is thermal controlled. The bubble growth is smoother, the maximum size is smaller, and it occurs earlier at higher temperatures. The collapse behavior seems less intense, and the rebounds attenuate more quickly at higher temperatures,implying that the thermal effect act as a remarkable dissipation mechanism.
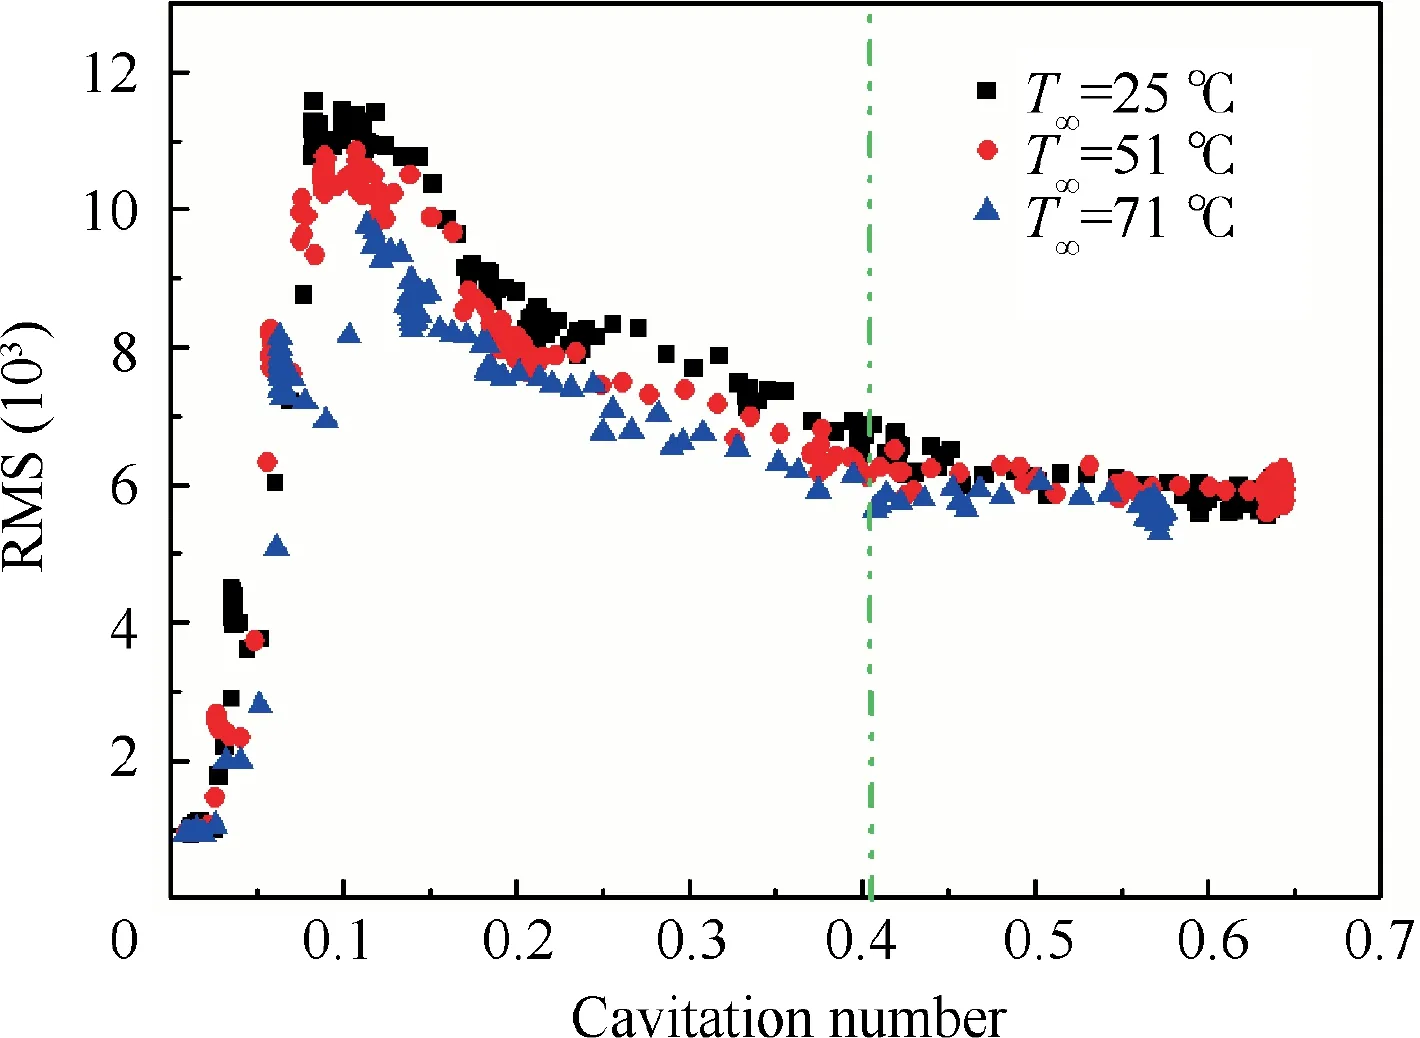
Fig. 10 RMS values at different temperatures (Φ=0.084,Sensor 3).
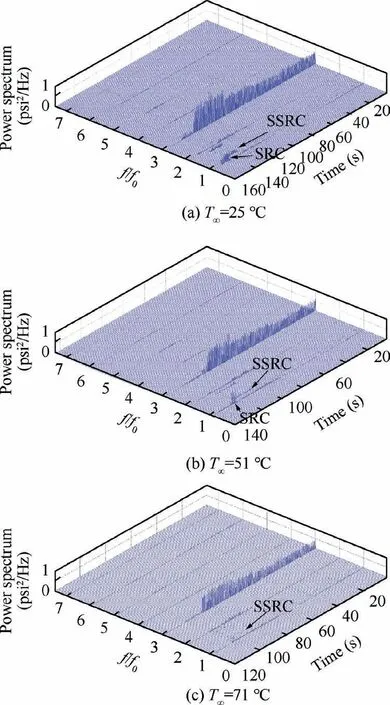
Fig. 11 STFFT results at different temperatures (Φ=0.084,Sensor 3).
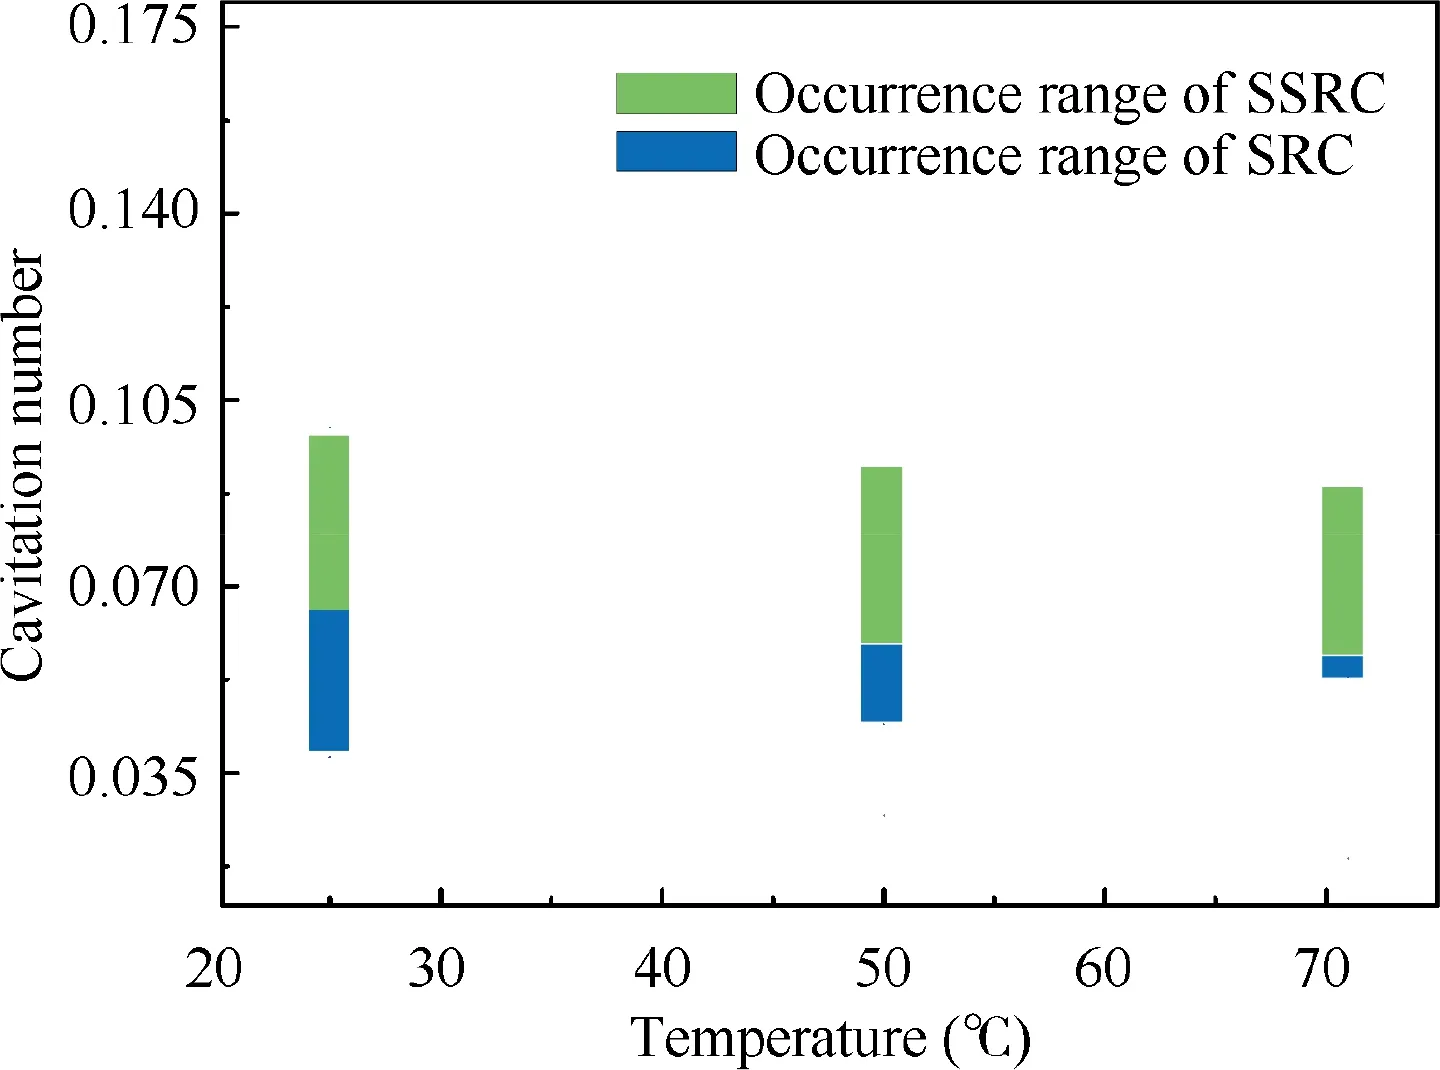
Fig. 12 Occurrence range of cavitation instabilities for different temperatures (Φ=0.084, Sensor 3).
According to Brennen,2the cavitation excited pressure can be related to the second derivative of cavity volume,pb~d2Vc/dt2. We assume that cavity volume is Vc=N⋅4/3⋅(πR3), N is the bubble number which is assumed constant here. Then the excited pressure is related to the second derivative of bubble volume. Fig. 15 displays the calculated second derivative of bubble volume at different temperatures, which represents the cavitation excited pressure. As we see, the pressure peak occurs when the bubble size reduces to minimum which is in accordance with the analysis of Brennen.2It is distinctly recognized that higher temperatures reduce the amplitudes of excited pressure,which may be the physical source of stabilization effect of higher temperatures shown by our experimental results.
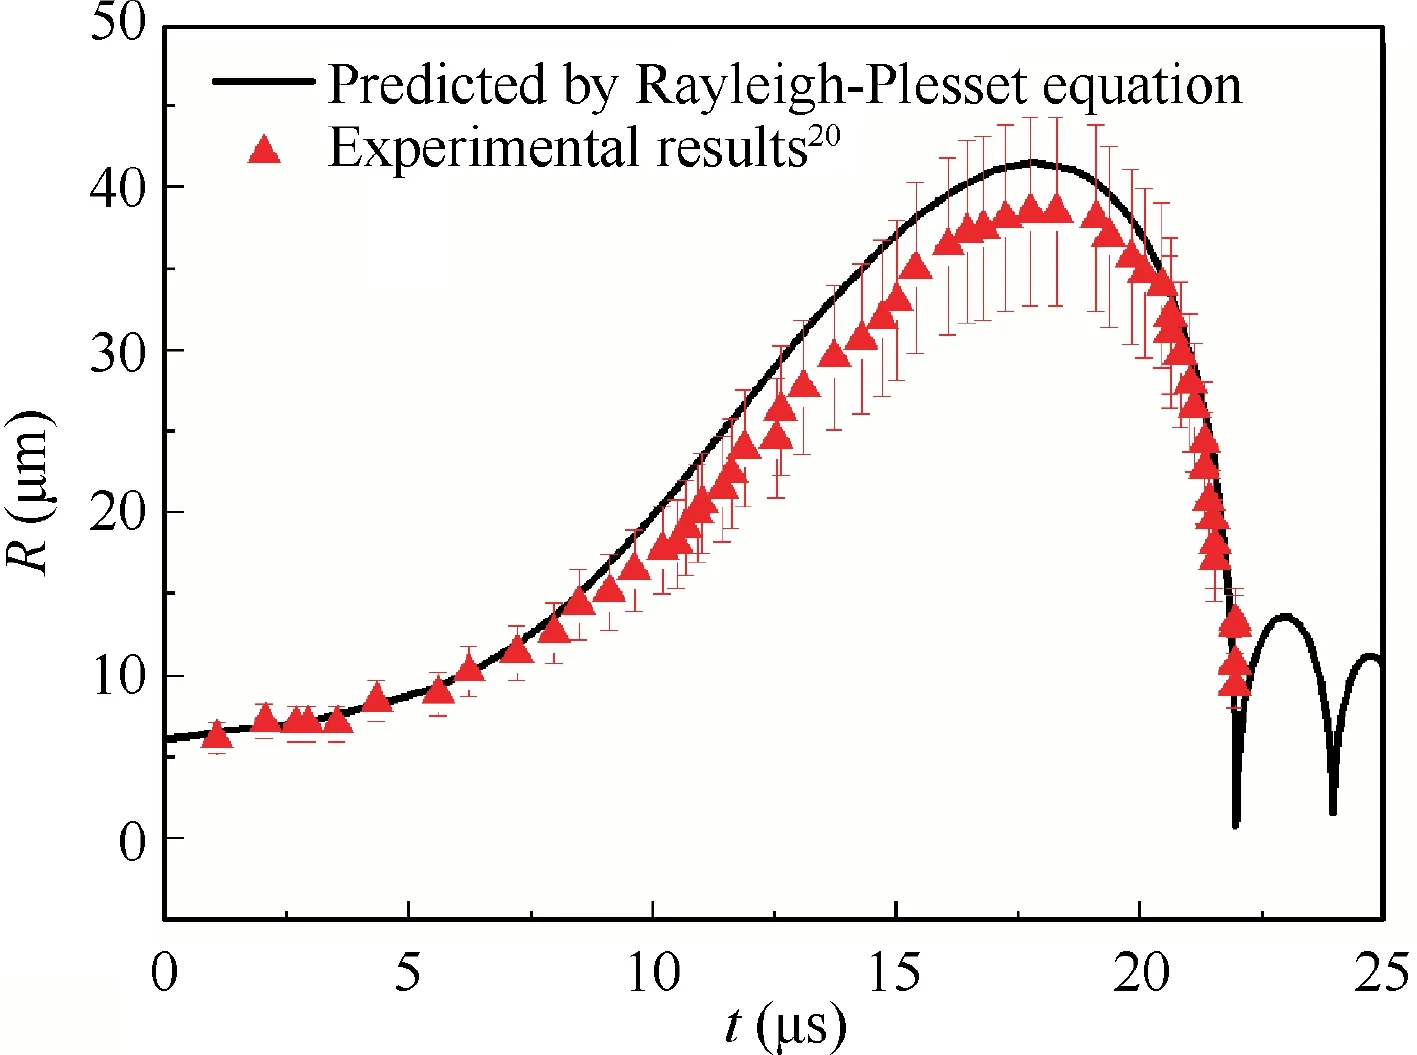
Fig. 13 Comparison of experimental and predicted results.
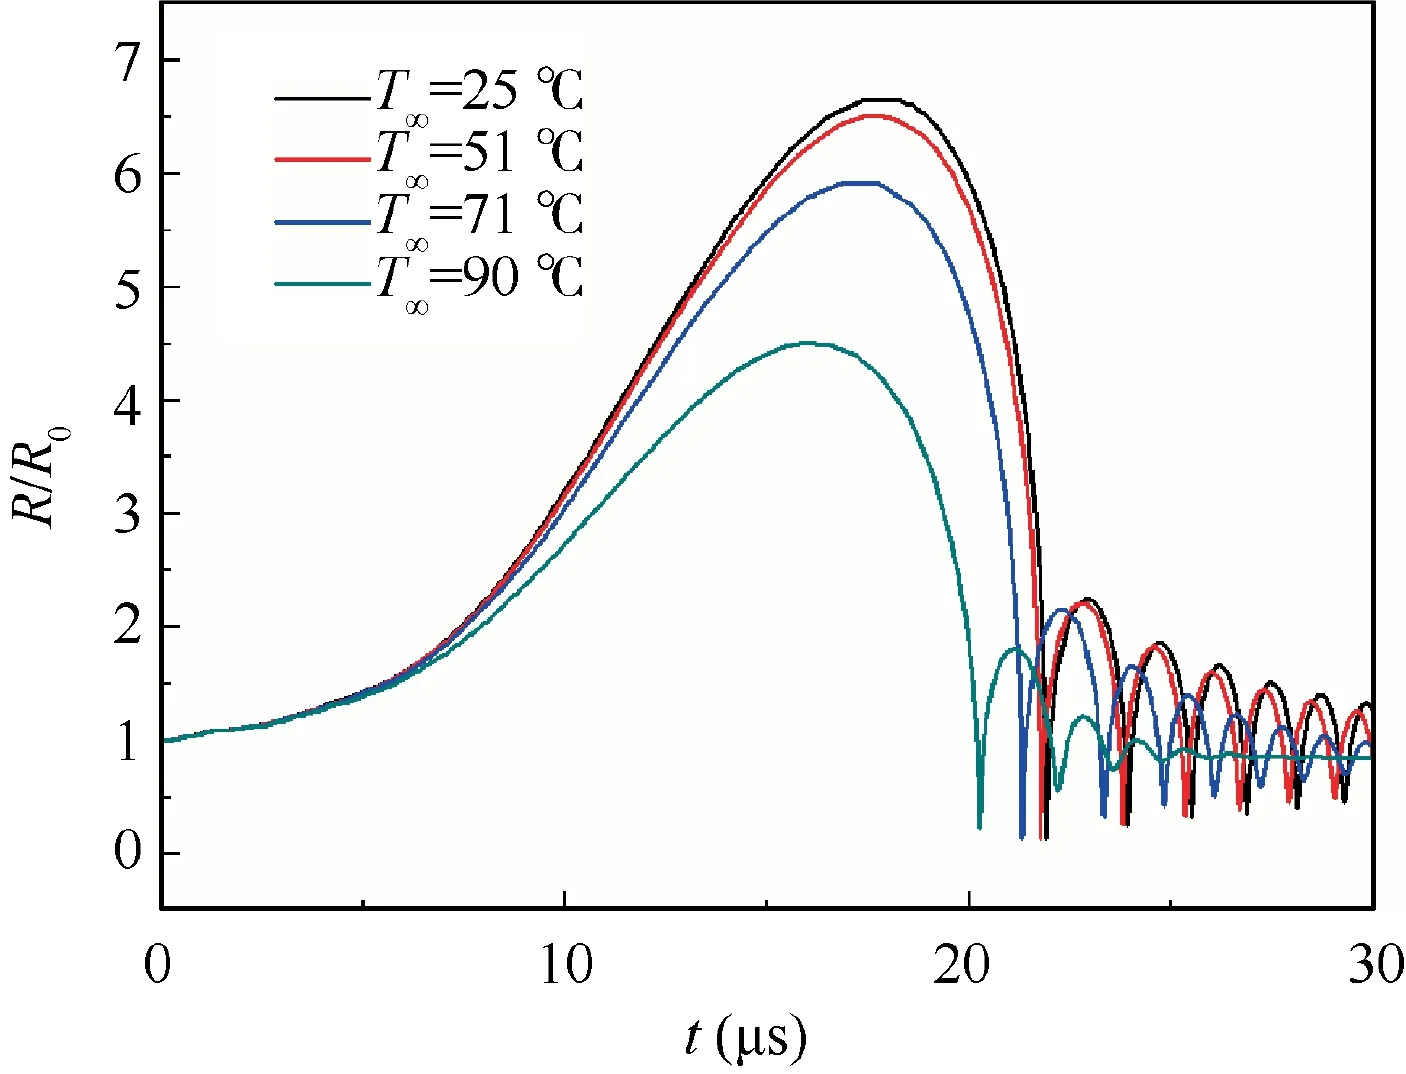
Fig. 14 Bubble development at different temperatures.
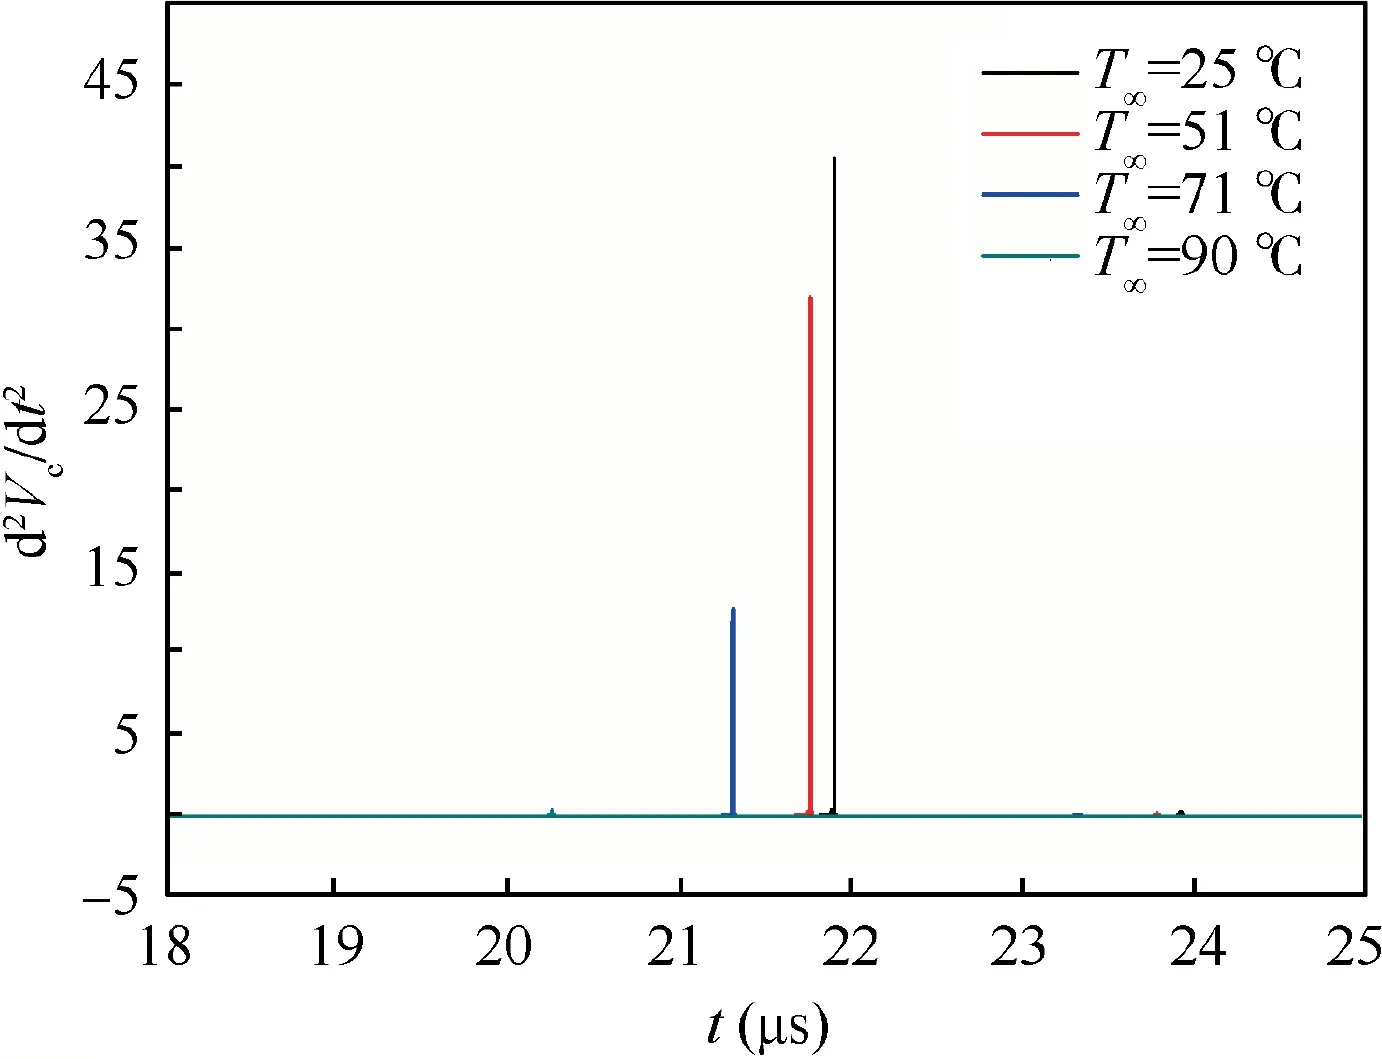
Fig. 15 Time dependent second derivative of bubble volume.
5. Conclusions
To clarify the relationship between thermal effect and cavitation characteristics in a rotating inducer, a series of experiments have been conducted based on a newly developed visualization test facility. The facility is equipped with temperature-control system, high speed camera system et al.to facilitate the experiments under different temperatures. In addition, a simple theoretical analysis based on generalized Rayleigh-Plesset equation has been carried out to help understand our test results. Several conclusions can be drawn as follows:
(1) The non-cavitation performance and head breakdown are not affected by the temperatures in the investigated range, but higher temperature distinctly delays the inception of the head partial degradation which is associated with the cavitation instabilities;
(2) The relationship between cavitation development and pressure fluctuation has been discussed in detail. Wavelet transform has been applied to analyze inducer cavitation instabilities for the first time. Cavitation development magnifies the local pressure fluctuation,but it will not change the main frequency components until cavitation instabilities occur. The frequency characteristics are changed when cavitation instabilities occur.
(3) Higher temperature displays a stabilization effect on cavitation excited pressure. Considering the cavitation instabilities, the inception cavitation numbers of both SSRC and SRC are decreased with increasing temperatures, while the corresponding frequencies are not affected.The occurrence range of SRC is distinctly smaller with increasing temperatures, while that of SSRC seems not to be affected. In addition, the amplitudes of the frequencies associated with SSRC and SRC are distinctly decreased at higher temperatures.
(4) To investigate possible explanation of the stabilization effect of high temperatures on the cavitation development, a modified generalized Rayleigh-Plesset equation has been employed to study the effect of temperatures on the bubble growth. Thermal effect is found to act as a remarkable dissipation mechanism to suppress the bubble growth, smooth the collapse. In particular, the excited pressure during collapse is smaller at higher temperatures, which may lead to the stabilization effect of high temperature in this study.
Declaration of Competing Interest
The authors declare that they have no known competing financial interests or personal relationships that could have appeared to influence the work reported in this paper.
 CHINESE JOURNAL OF AERONAUTICS2021年8期
- CHINESE JOURNAL OF AERONAUTICS的其它文章
- A novel virtual material layer model for predicting natural frequencies of composite bolted joints
- Multi-layered plate finite element models with node-dependent kinematics for smart structures with piezoelectric components
- Modeling bending behavior of shape memory alloy wire-reinforced composites: Semi-analytical model and finite element analysis
- Sequential ensemble optimization based on general surrogate model prediction variance and its application on engine acceleration schedule design
- Transition prediction and sensitivity analysis for a natural laminar flow wing glove flight experiment
- Modeling on mechanical behavior and damage evolution of single-lap bolted composite interference-fit joints under thermal effects
