Integration of high-fidelity model of forward variable area bypass injector into zero-dimensional variable cycle engine model
Fu SONG, Li ZHOU, Zhanxue WANG, Zhifu LIN, Jingwei SHI
Shaanxi Key Laboratory of Internal Aerodynamics in Aero-engine, School of Power and Energy, Northwestern Polytechnical University, Xi’an 710129, China
KEYWORDS Coupling method;Forward variable area bypass injector;High-fidelity model;Multi-scale support vector regression;Variable cycle engine
Abstract Forward Variable Area Bypass Injector (FVABI) is one of key components which contributes to modulate the cycle parameters of Variable Cycle Engine(VCE)under various operation conditions. The modeling method of zero-dimensional FVABI was reviewed and its deficiency was analyzed based on FVABI flow characteristic. In order to improve the accuracy of VCE performance simulation,the high-fidelity modeling method of FVABI was developed based on its working characteristics.Then it was coupled with the zero-dimensional VCE model and the multi-level VCE model was built.The results indicate that the geometric and aerodynamic parameters can affect the interaction between the two airflows and the zero-dimensional FVABI model is too simple to predict the component performance accurately, especially when the FVABI inner bypass is chocked.Based on the performance curves for single bypass mode and the regression model of multi-scale support vector regression for double bypass mode,the high-fidelity model can predict FVABI performance accurately and rapidly. The integration of high-fidelity FVABI model into zerodimensional VCE model can be done by adjusting iterative variables and balance equations. The multi-level model has good convergence and it can predict VCE performance when the FVABI inner bypass is chocked.
1. Introduction
Variable Cycle Engine (VCE) has potential to combine the advantages of higher specific thrust at supersonic cruise condition and lower specific fuel consumption (sfc) at subsonic cruise condition.VCE can also be used to reduce or even eliminate the installed propulsion drag and contribute to reduce the noise pollution problem.VCE is an ideal propulsion device for the next generation affordable mixed mission aircrafts.1,2Several VCE schemes have been developed,3–5and the double bypass VCE is found to be one of the most promising schemes.6A series of key technologies, such as Variable Area Bypass Injector (VABI) and split fan are validated. The Forward VABI (FVABI) allows flexibility in matching the static pressure for mixing of two fan bypass flows.The concept eliminates the full length fan duct and separate nozzle, and results in a reduction in both engine weight and exhaust nozzle complexity. The variable-geometry components make it possible for VCE to modulate the cycle parameters under different operation conditions.
The simulation model of VCE is usually developed based on the model of a mixed flow turbofan engine model and the zero-dimensional FVABI model is established based on the conventional mixer model.7–11The mixer performance is predicted with conservation equations of mass flow rate, energy and momentum and the static pressure balance.12The method is efficient in the engine conceptual design phase.But the zerodimensional FVABI model can only take the effect of the area of inlet and outlet into consideration and it is too simplistic to count the effect of geometrical configuration and various aerodynamic parameters. The zero-dimensional model cannot be used to conduct the optimization of the FVABI flow path13and investigate the flow characteristic of non-axisymmetric FVABI where the mixing process is heavily influenced by three-dimensional flow effect and is very different from that in conventional mixer.14Therefore, once the geometry of FVABI component is preliminarily determined, the zerodimensional model cannot provide accurate performance prediction for VCE and a new modeling method for FVABI is necessary to improve the accuracy of VCE performance simulation.
Some approaches have been employed in NPSS and PROOSIS software to integrate the result obtained from high-fidelity model into the whole engine, in order to evaluate the design of components and improve the accuracy of engine performance simulation.15,16In the new multi-level engine model, the zero-dimensional FVABI model is replaced with three-dimensional model, or a working characteristic for FVABI just like characteristic map of tubomachinery component is established based on the result of three-dimensional simulation or experiment. As for former, the threedimensional model is called repeatedly when solving the engine model and it is time consuming.As for the latter,the real challenges are finding suitable expression form of the working characteristic with multiple geometric and aerodynamic parameters and interpolating performance parameters from it. Neither approach is appropriate for FVABI. Therefore, a new method is proposed in this paper to establish the highfidelity FVABI model and the method for the integration of high-fidelity FVABI model into the zero-dimensional VCE model is also presented.
In the following parts,a brief introduction of the modeling methods of zero-dimensional VCE model and FVABI model is presented firstly. Then the FVABI flow characteristic is investigated. Based on its flow characteristic, the high-fidelity FVABI model is developed with multi-scale support vector regression (SVR) method. Finally, the coupling method of high-fidelity FVABI model and zero-dimensional VCE model is presented,and the multi-level VCE model is built and is used to predict VCE performance.
2. Zero-dimensional VCE model
The structure of double bypass VCE is shown in Fig. 1.17Compared with conventional mixed flow turbofan engine,some new components, such as Mode Selection Valve(MSV), Core Driven Fan Stage (CDFS), FVABI and Rear VABI,are employed in double bypass VCE.When VCE works in single bypass mode,both MSV and FVABI outer bypass are closed.All the airflow of fan flows through CDFS.When VCE works in double bypass mode, MSV is open and the working status of both fan and CDFS can be controlled with changing the area of FVABI inner and outer bypass.
The zero-dimensional VCE model used in this paper is developed based on the mixed flow turbofan engine and is described using the high-level object-oriented language C++. The complete double bypass VCE model is shown in Fig. 2. The behaviors of all turbomachinery components,including Fan, CDFS, High Pressure Compressor (HPC),High Pressure Turbine (HPT) and Low Pressure Turbine(LPT), and combustion chambers are represented by default maps. The modeling method of VABIs is developed based on the mixer of turbofan and is described in detail in the following part.
The geometry of mixer is usually simplified, just like the sketched in Fig. 3.12Stations 6 and 16 are the inlet of inner bypass and outer bypass of mixer. Station 63 and station 163 is the inlet of mixing section and station 64 is the presupposed location where the two flows are fully mixed.In order to solve the aerodynamic parameters at station 64, some assumptions are made here.It is assumed that there is no pressure loss form stations 6 to 63 and 16 to 163. The static pressure balance is assumed to be realized at stations 63 and 163 and it means the static pressure of the two flows are equal at stations 63 and 163.Then the mixing happens in a frictionless duct of constant cross section.The combined area of station 64 is equal to the sum of the area of stations 63 and 163. Based on these assumptions, the laws of conservation of mass flow rate,energy and momentum are applied to the mixing.12
The design point of VCE is set at sea level static condition and VCE is set in double bypass mode. The design point parameters are shown in Table 1. The parameters of Fan and CDFS are set according to literature data.18As for FVABI, the aerodynamic parameters in stations 63 and 163 are determined by Fan and CDFS. The Mach number in station 64 must be specified. The area of stations 63 and 163 are calculated according to the presupposed static pressure and then the aerodynamic parameters in station 64 are solved based on the three conservation equations. The presupposed static pressure needs to be adjusted to meet the specified Mach number at station 64.Finally,VCE thrust and sfc are obtained by performing the components model according to their logical order.And some essential parameters,including the nozzle throat area, inlet and outlet area of VABIs and map scaling scalars of default maps, are calculated. Then all these parameters are used to predict the VCE performance in off-design points.
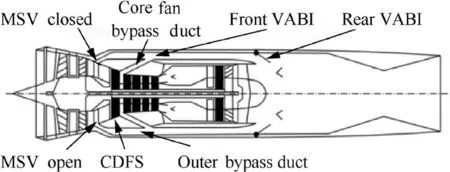
Fig. 1 Structure of double bypass VCE.17

Fig. 2 Simulation model of double Bypass VCE.
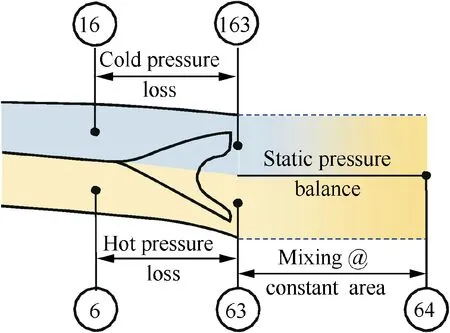
Fig. 3 Mixer nomenclature.12
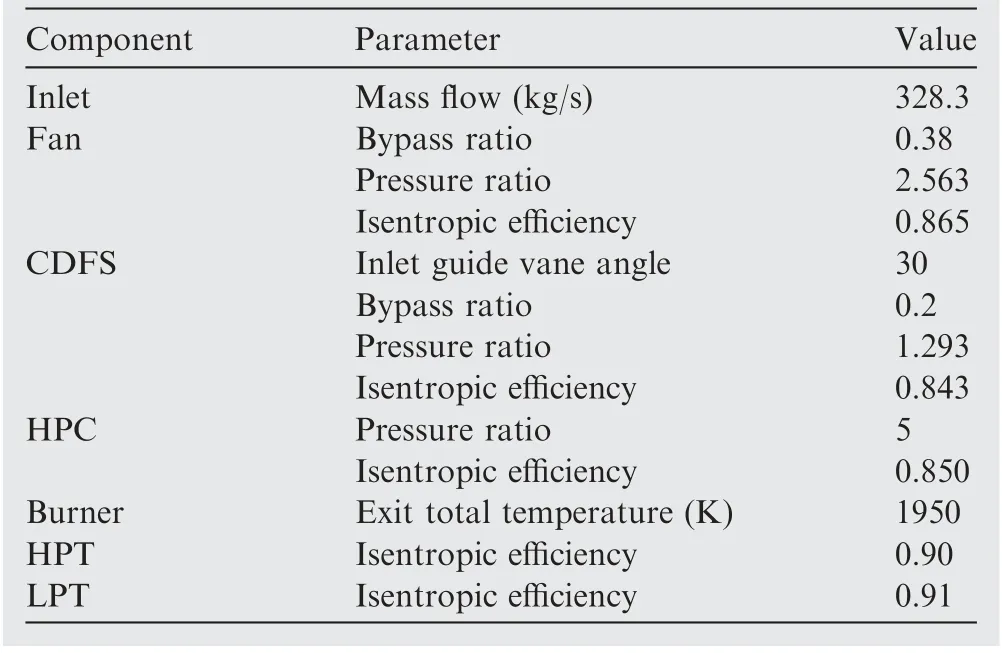
Table 1 Design parameters of double bypass VCE.
In the off-design point analysis,the most important work is to create a mathematical system by selecting the iteration variables and balance equations. The balance equations are formed with the physical constraints, such as mass flow continuity and conservation of power.As for turbomachinery components,the mass flow rate is calculated by two different ways.One is that the mass flow rate is determined by the upstream component.Meanwhile,the mass flow rate can be interpolated from the characteristic map, and then the two values are used to form the balance equation. The balance equation of mass flow rate for nozzle is form as well. As for VABIs, the sum of areas of stations 63 and 163 is supposed to be constant,and the area of stations 63 and 163 is adjustable and needs to be designated. The corresponding static pressure in station 63 and 163 can be solved respectively. The aerodynamicparameters in station 64 can be also solved with the three conservation equations.The balance equation of static pressure in station 63 and 163 is employed.In addition,the power balance between the turbine and compressor is applied to each spool.The iterative variables and balance equations in double bypass mode are show in Table 2.The parameter β is a map auxiliary parameter,12and After Burner does not work in this paper.As a result, ten iterative variables and nine balance equations in total are obtained, and the Burner outlet total temperature is used as the control parameter.This problem can be solved iteratively with Newton iteration method. When VCE mode is transformed to single bypass mode, MSV and FVABI outer bypass are closed. Therefore, the iterative variable of Fan bypass ratio and the balance equation of static pressure balance in FVABI are crumbled simultaneously. The numbers of iterative variables and balance equations are equivalent and the problem is solvable.
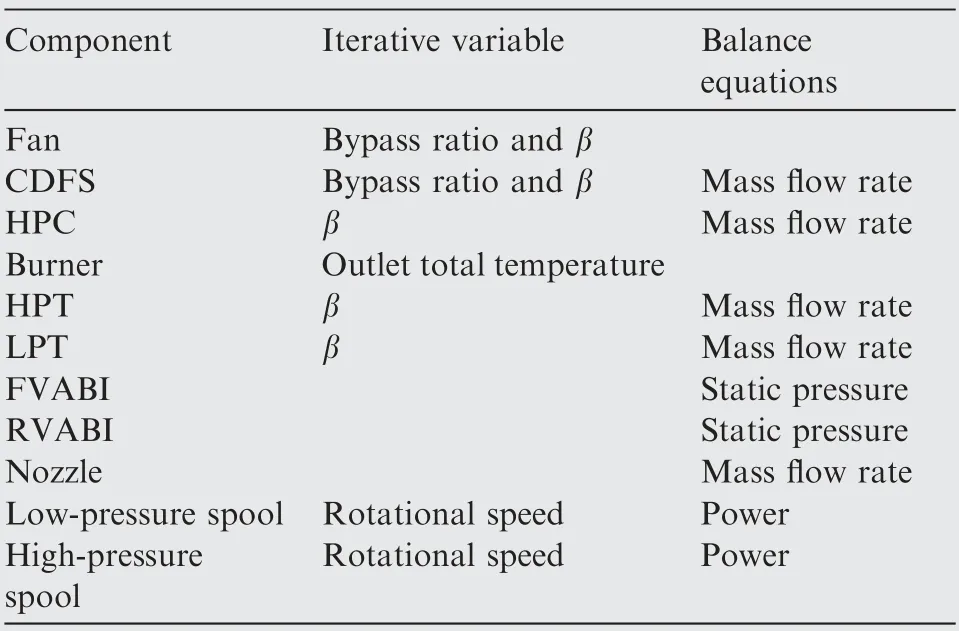
Table 2 Iterative variables and balance equations in double bypass mode.
3. The high-fidelity FVABI model
In this section, the FVABI flow characteristic is studied with numerical method and the inherent deficiency of zerodimensional FVABI model is analyzed based on FVABI flow characteristic. Whereafter, the high-fidelity FVABI model is established to provide more accurate performance prediction for VCE.
3.1. The geometry model and simulation method
The geometric model of FVABI is shown in Fig. 4. The geometric model is built according to Ref.18.It can be found that only part before the rotatable valve is presented in literature.The mixing section, including the rotatable valve used to regulate the area of inner bypass and outer bypass,and the mixing section is supplemented by the authors.The outlet is extended downstream to make sure that the static pressure balance can realize before the outlet. It is worth noting that the throat of inner bypass is retained in this paper. The area of the inner bypass inlet, outer bypass inlet and outlet is 0.1879, 0.3310 and 0.4844 square meters. The rotatable angle (θ) can be rotated from 0 to 52.16° and the inner bypass is closed when parameter θ is 0°.
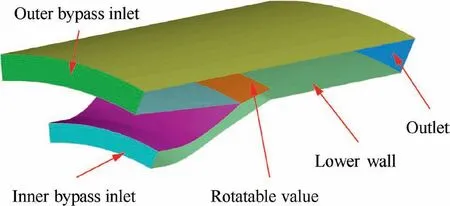
Fig. 4 FVABI geometric model.
The numerical simulation was carried out with Fluent.The equations solved are the fully three-dimensional compressible,Reynolds averaged Navier-Stokes equations and standard k-ε turbulent model is employed. The computational grid used to predict the FVABI performance in double bypass mode is shown in Fig.5.The value of y+for the first grid point above the wall ranges from 30 to 100. The computational domain is only one twelfth of the whole FVABI, and periodic boundary condition is employed. As for the inner bypass and outer bypass inlet, the pressure inlet boundary condition is adopted with the total pressure and total temperature being designated.As for the outlet, the pressure outlet boundary condition is adopted and the static pressure is the only value needed to be designated.
When VCE works in double bypass mode,the difference of aerodynamic parameters between the FVABI inner bypass inlet and outer bypass inlet is mainly determined by working status of CDFS component. The Total Pressure Ratio (TPR)is defined as the ratio of the inner bypass inlet total pressure(Pt,Inner) to the outer bypass inlet total pressure (Pt,Outer).The Total Temperature Ratio (TTR) is defined as the ratio of inner bypass inlet total temperature (Tt,Inner) to the outer bypass inlet total temperature (Tt,Outer). The Static Pressure Ratio (SPRD) is defined as the ratio of outlet static pressure(Ps,Outlet) to parameter Pt,Outer. The FVABI working condition is determined by these six parameters: Tt,Outer, Pt,Outer,TPR, TTR, SPRDand θ. The ranges of these parameters are shown in Table 3. The rough ranges of the first four parameters are calculated by performing zero-dimensional VCE model within the flight envelope. The range of parameter θ is determined by geometric constraints. The range of parameter SPRDis determined by the corrected mass flow rate of outer bypass inlet and the outlet Mach number. In this paper, the corrected mass flow rate of outer bypass inlet is supposed to be greater than 0 which means no backflow in the outer bypass,and the outlet Mach number is supposed to not exceed 0.75. A high outlet Mach number usually means a severe flow loss and this does not happen in this component under normal status.The final range of parameter SPRDis obtained according to the calculation results.
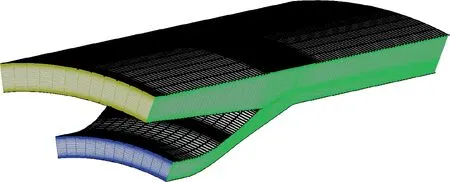
Fig. 5 Computational grid.
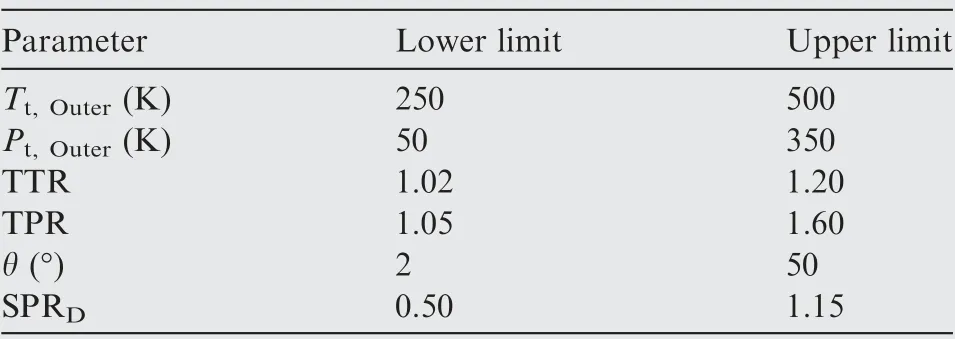
Table 3 Ranges of FVABI boundary conditions.
When VCE works in single bypass mode, the outer bypass is fully closed and parameter θ reaches its maximum value.The FVABI working condition is determined by these three parameters:Pt,Inner,Tt,Innerand SPRS.Parameter SPRSis defined as the ratio of parameter Ps,Outletto parameter Pt,Inner.
The FVABI performance is characterized by following parameters: inner bypass inlet corrected mass flow rate (Wcor,Inner), outer bypass inlet corrected mass flow rate (Wcor,Outer),outlet Mach number (MaOutlet) and total pressure recovery coefficient (Cp). And parameter Cpis calculated with Eq. (1).

where WOutlet, WOuterand WInnerrepresent the mass flow rate of FVABI outlet,outer bypass inlet and inner bypass inlet,and Pt,Outletrepresents the total pressure of FVABI outlet.
The grid-dependence analysis is performed before the study. Three sets of grid with the same value of y+are tested.The amounts of cells for the Coarse,Medium and Fine grid are around 70000, 150000 and 300000. There is no significant difference in FVABI performance among Coarse, Medium and Fine grid. The only difference of wall static pressure distribution occurs near the lower wall.And when the amount of grid cells exceeds 150000, the wall static pressure distributions are the same,as shown in Fig.6.In Fig.6,the wall static pressure(Ps) is nodimensionalized by Pt,Outer. Therefore, the grid with about 150000 cells is employed.
3.2. Flow characteristic analysis
3.2.1. Flow characteristic in single bypass mode
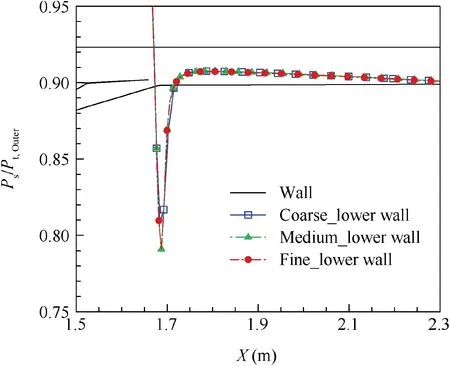
Fig. 6 Comparison of wall static pressure distribution obtained from three sets of grid.
When VCE works in single bypass mode, the MSV and FVABI outer bypass are closed and all Fan airflow passes CDFS. There is no mixing in FVABI. The corresponding Mach number distribution along the axial direction is shown in Fig. 7. The corresponding inner bypass inlet total pressure is 1 atm (1 atm=101325 Pa). When SPRSis 0.90, the flow in FVABI is fully subsonic. And a closed separation zone is formed downstream of the rotatable valve because of the adverse pressure gradient caused by the change of flow path direction. The flow velocity decreases and the corresponding static pressure increases continuously in the downstream of the throat.With the decrease of SPRS,the flow near the throat reaches the sonic speed and the inner bypass is chocked. A shock wave is needed for the flow to match the outlet static pressure. When SPRSdecreases further, the normal shock wave becomes an oblique shock wave. The flow downstream of the oblique shock wave is still supersonic, and the corresponding static pressure is too low to counteract the adverse pressure gradient in the boundary layer. As a result, a closed separation zone is formed near the lower wall.
The effect of SPRSon FVABI performance under different Pt,Innerand Tt,Inneris shown in Fig. 8. It can be seen that the effect of SPRSon parameter MaOutlet, Cpand Wcor,Innerare not affected by parameters Pt,Inneror Tt,Inner.The unchanged performance curves of parameters MaOutlet, Cpand Wcor,Innerover SPRSmake it possible to predict the FVABI performance in single bypass mode rapidly.
3.2.2. Flow characteristic in double bypass mode
When VCE works in double bypass mode, a portion of Fan flow is mixed with the CDFS bypass flow in FVABI. The typical mixing process is shown in Fig. 9 and the corresponding parameter θ is 18°. The outer bypass flow decelerates in the divergent outer bypass flow path and then accelerates in the convergent duct caused by the rotatable valve. And the inner bypass flow accelerates and then decelerates in the convergent-divergent flow path, followed by an acceleration process in the convergent duct caused by the rotatable valve.What’s more,the flow direction of inner bypass flow gradually deflects to the axial direction with the constraint of rotatable valve. It can be seen that static pressure balance between the outer bypass flow and inner bypass flow will be achieved downstream of the rotatable valve.
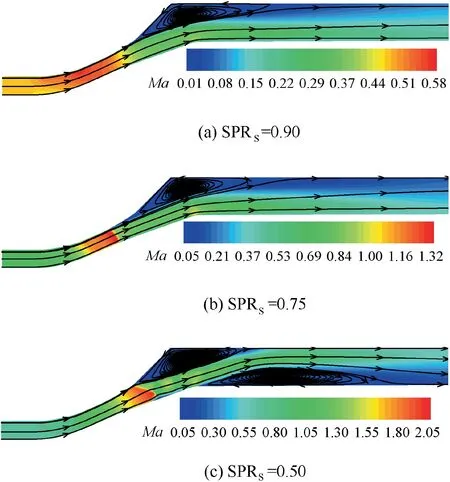
Fig. 7 Mach number distribution of FVABI in single bypass mode.
The interaction between the outer bypass flow and inner bypass flow is affected by the location of rotatable valve. It can be seen in Fig. 10 that the flow capacity of inner bypass is restrained by the rotatable and the airflow velocity is very slow generally when θ is 2°.Near the outlet of the inner bypass,the inner bypass flow accelerates rapidly in the convergent duct. In contract, the Mach number of outer bypass flow would not change apparently.It also can be seen that the maximum Mach number does not appear at the geometric throat formed by the rotatable and lower wall.Affected by the geometry of lower wall, the inner bypass flow will continue accelerating accompanied by mixing process.
When θ is larger, as shown in Fig. 11, inner bypass flow accelerates in the convergent-divergent flow path and turns to the axial direction. As a result, a closed separation zone is formed beneath the rotatable valve caused by adverse pressure gradient. As for outer bypass flow, the flow area is restrained by rotatable valve and it accelerates at the convergent duct.Another notable thing is that energy transfer between the two airflows. The inner bypass flow can do work on outer bypass flow causing the increase of total pressure of outer bypass flow,as shown in Fig.12.Therefore, SPRDcan exceed 1 without backflow in FVABI outer bypass.
The effect of parameter SPRDon Mach number distribution under various θ is shown in Fig. 13. With the increase of SPRD, the Mach number of inner and outer bypass flow decreases. And the Mach number of outer bypass flow falls faster than that of inner bypass flow,because the ratio of inlet total pressure and outlet static pressure of the former is lower.Therefore, the velocity difference between inner bypass flow and outer bypass flow increases with the increase of parameter SPRD. The increase of SPRDcauses the increase of flow loss due to mixing. Meanwhile, the decrease of Mach number of inner bypass flow means the decrease of flow loss due to shock wave,especially when θ is greater than 18°.Another factor that affects flow loss is friction and the friction loss increases with the increase of flow velocity. When θ is 10° or 18°, there is no strong shock wave and the flow loss is determined by friction and mixing. But when θ is greater, the flow loss is mainly determined by shock wave.The corresponding FVABI performance is shown in Fig.14.When θ is 10°and 18°,the flow loss decreases first and then increases with the increase of SPRDbecause of the increase of flow loss due to mixing and the decrease of friction loss. The flow loss decreases with the increase of SPRDbecause of the weakening shock wave when θ is 34°and 42°.It also can be seen that the effect of SPRDon corrected mass flow rate of outer bypass inlet is more significant when θ is small.
The effect of parameters Pt,Outerand Tt,Outeron the FVABI Mach number distribution is shown in Figs. 15 and 16. Parameter Pt,Outercannot change the interaction between inner and outer bypass flow when parameter TPR is constant.Parameter Tt,Outercan change air specific heat ratio and it will affect the Mach number distribution. However, the variation range of parameter Tt,Outerdoes not exceed 250 K.Therefore,the change of air specific heat ratio caused by parameter Tt,Outeris relatively modest. Therefore, neither parameter has obvious influence on FVABI Mach number distribution. The effect of parameters Pt,Outerand Tt,Outeron the FVABI performance is shown in Fig. 17. It can be seen that the performance curves of parameters MaOutlet, Wcor,Innerand Wcor,Outerover SPRDare not affect by parameters Pt,Outerand Tt,Outer. As for the performance curve of parameter Cpover SPRD, the maximum variation under different parameters Pt,Outerand Tt,Outeris much less than one percent. Therefore,the effect of parameters Pt,Outerand Tt,Outeron the FVABI performance curves is ignored for the moment.
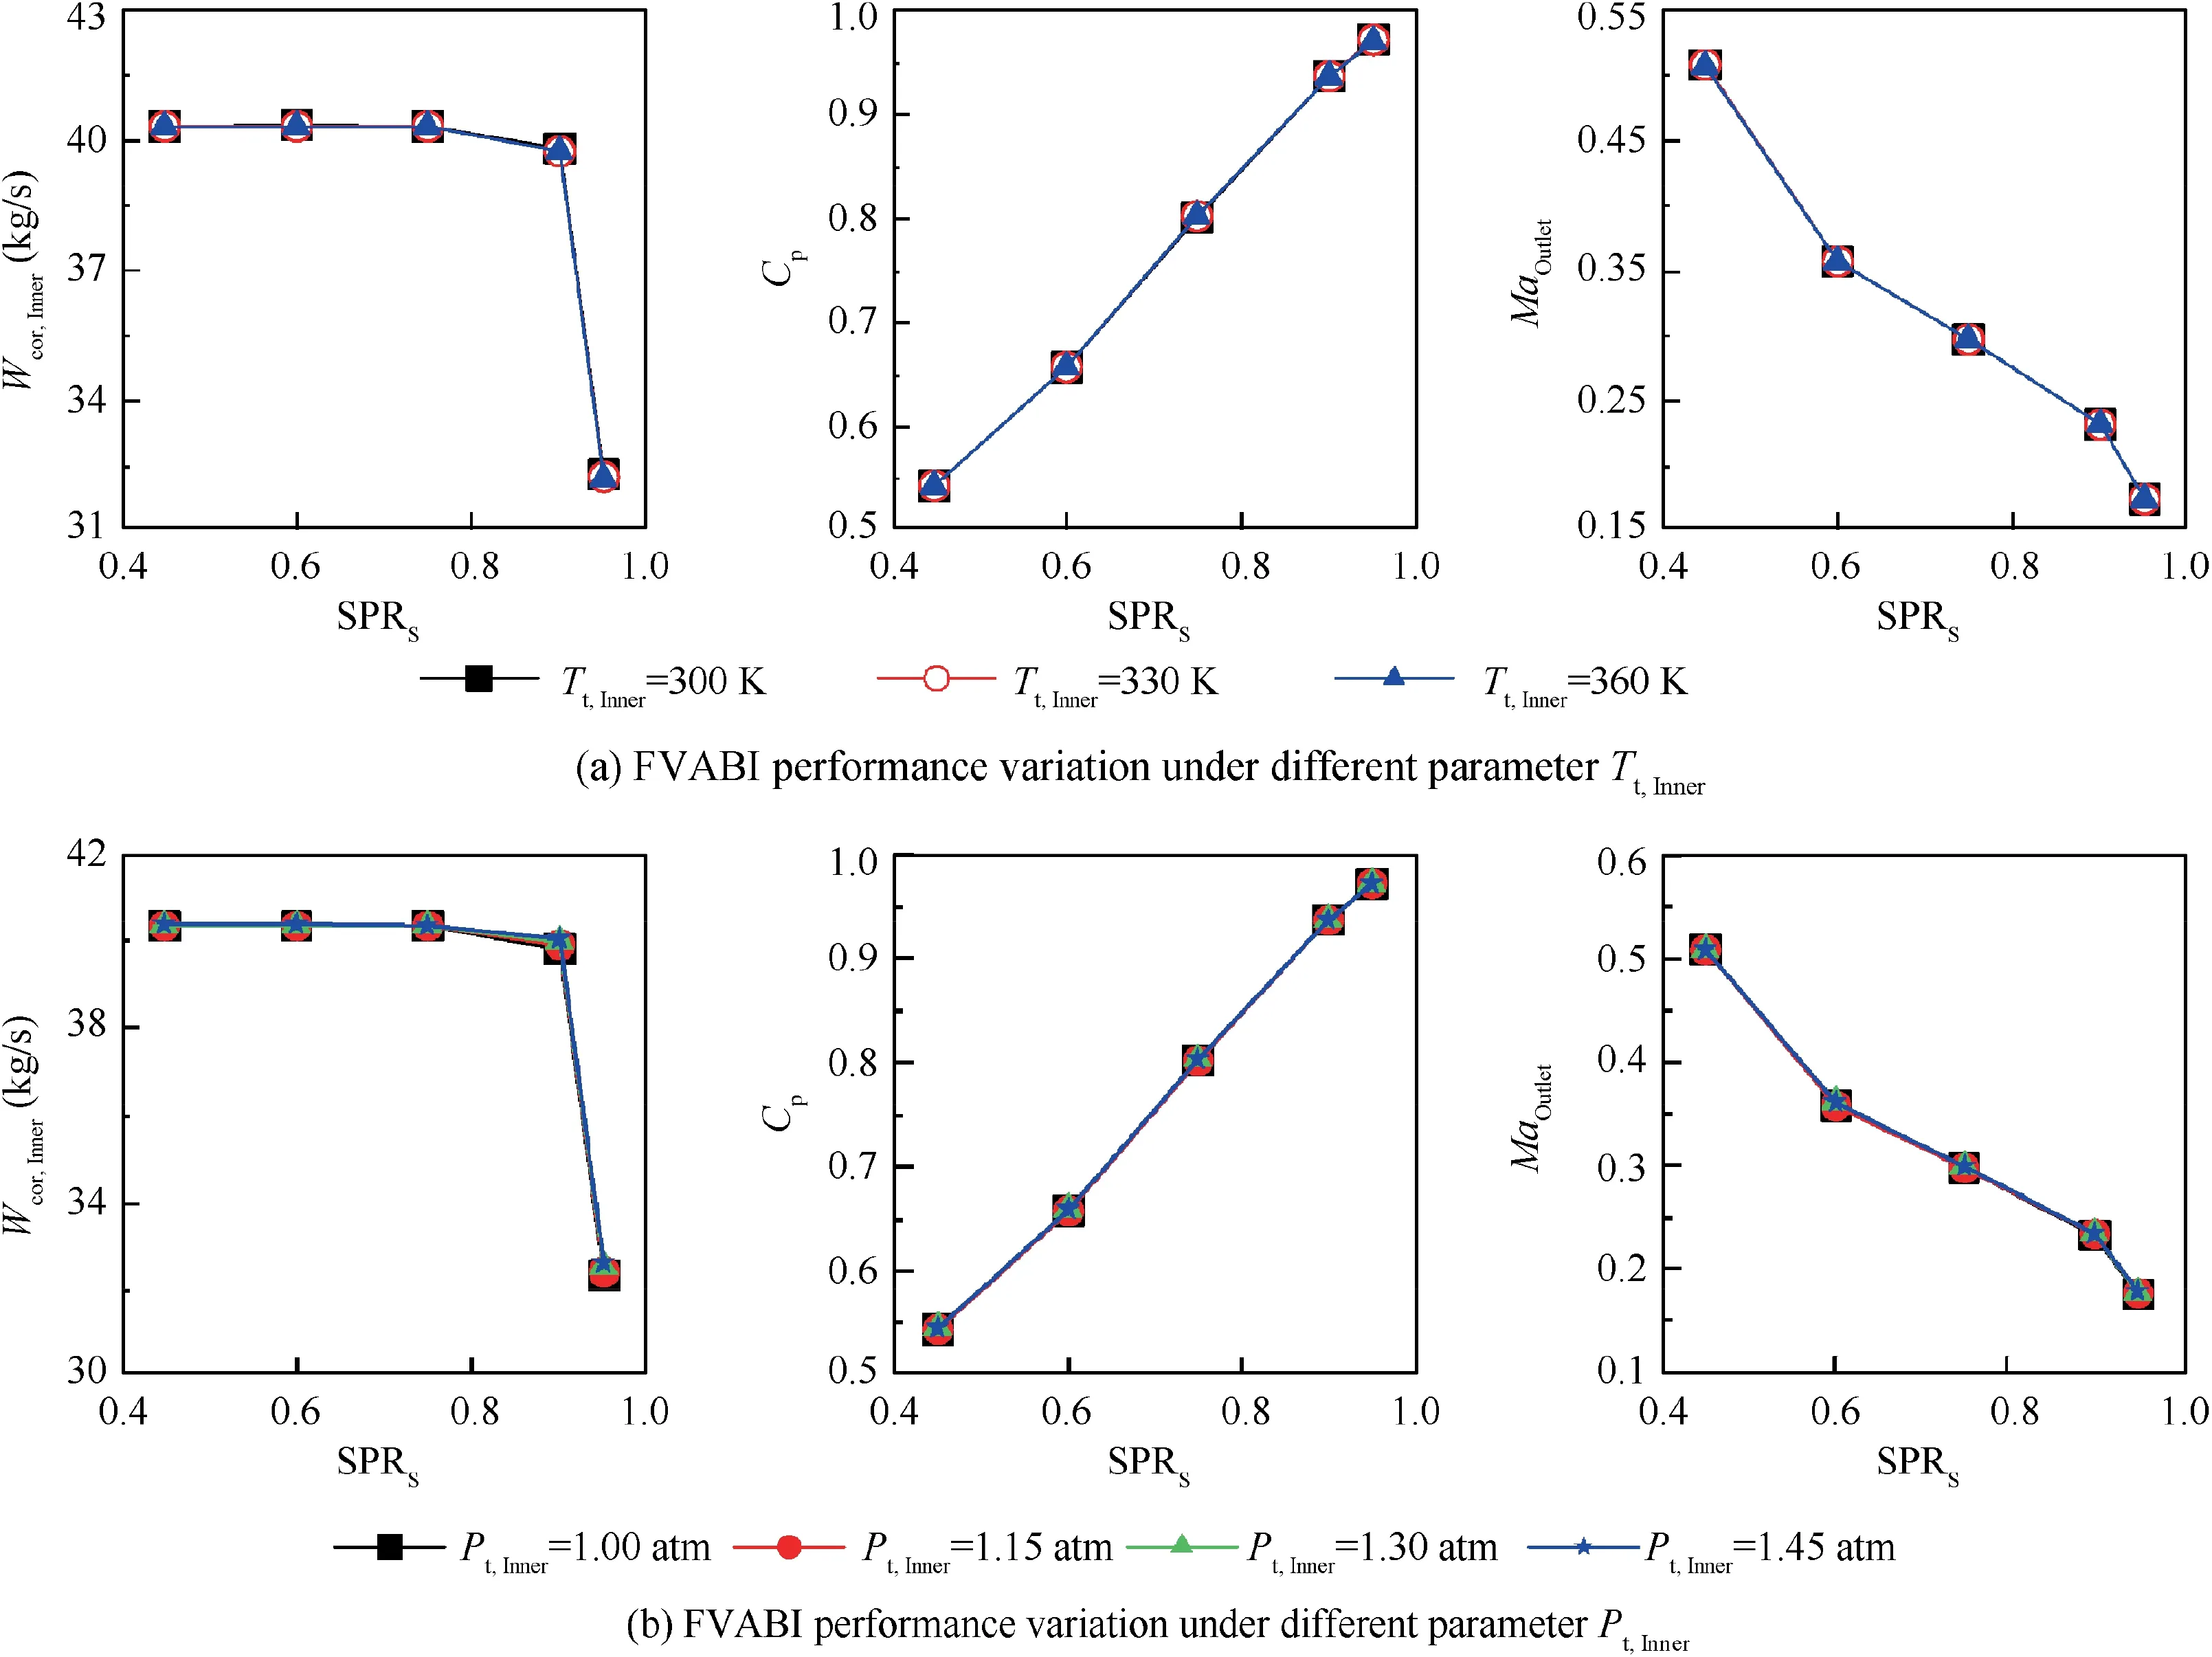
Fig. 8 Effect of SPRS on FVABI performance.

Fig. 9 Distribution of Mach number and static pressure with θ=18°, TPR=1.21 and SPRD=0.90.
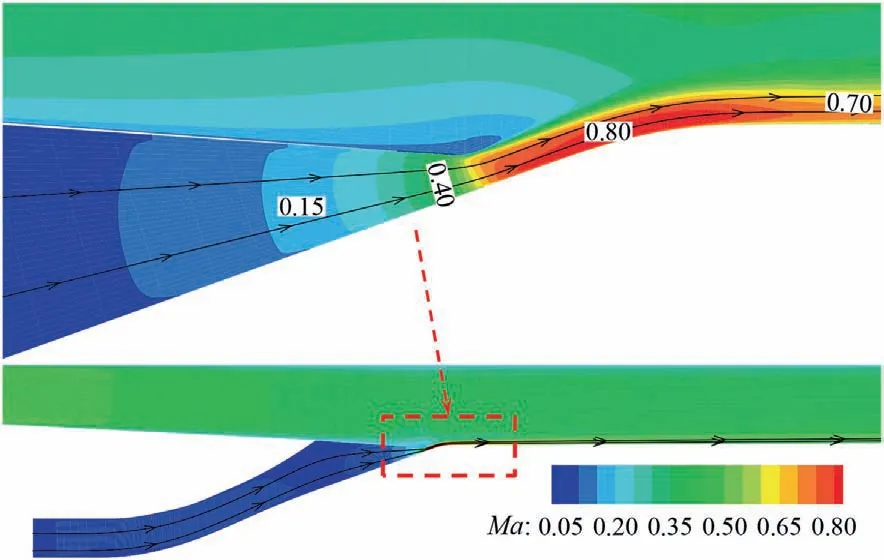
Fig.10 Distribution of Mach number with θ=2°,TPR=1.45 and SPRD=0.90.

Fig. 11 Distribution of Mach number with θ=42°,TPR=1.29 and SPRD=0.90.
The variation range of parameter Tt,innerdoes not exceed 300 K and the corresponding air specific heat ratio will not change significantly. Therefore, the effect of parameter TTR on FVABI flow characteristic is insignificant. As a result, the effect of parameter TTR on the performance curves is insignificant, as shown in Fig. 18.
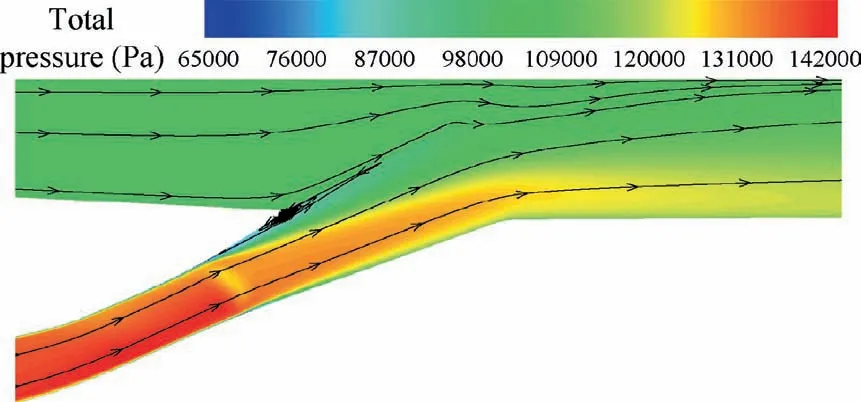
Fig.12 Distribution of total pressure with θ=34°,TPR=1.37 and SPRD=1.05.
Therefore, the slight effect of parameters of Pt,Outer, Tt,Outerand TTR is not considered for the time being. And the FVABI performance in double bypass mode can be characterized by the relationship between the four performance parameters,including MaOutlet,Cp,Wcor,Outerand Wcor,Inner,and the three boundary conditions including parameters TPR, SPRDand θ. It is much easier to capture the relationship with three parameters instead of six.
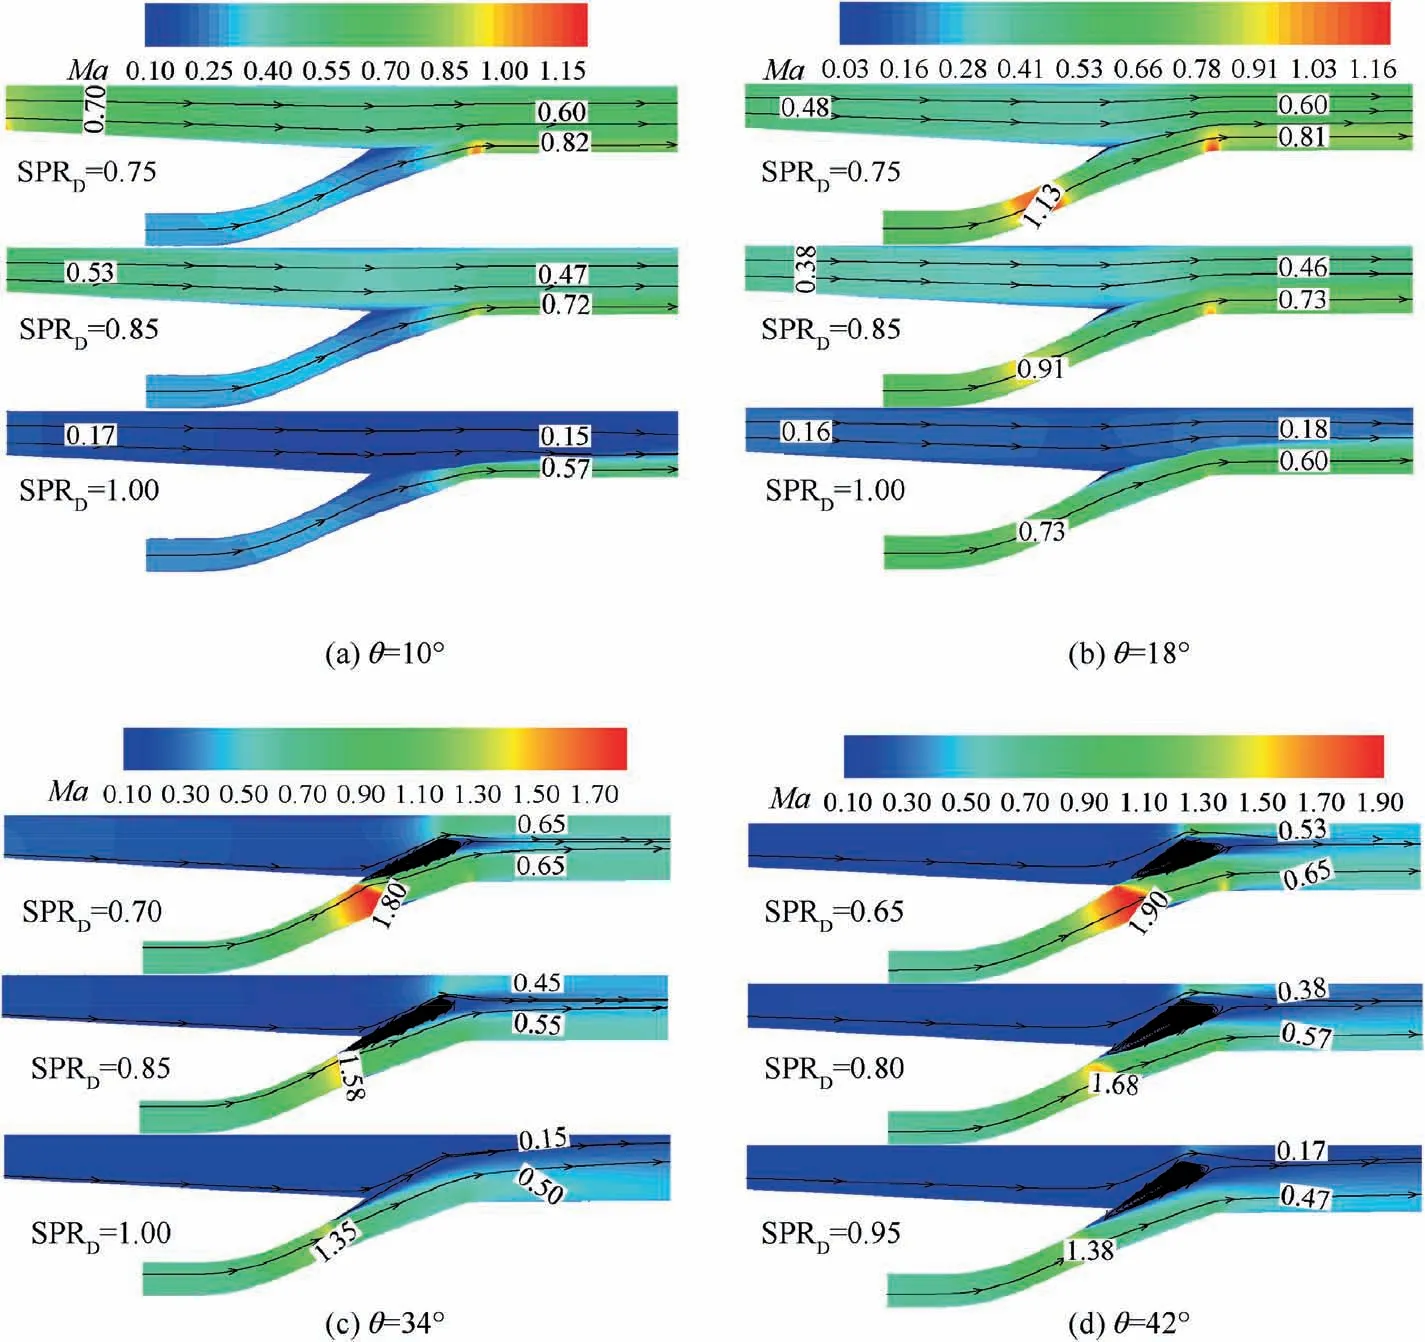
Fig. 13 Effect of parameter SPRD on FVABI Mach number distribution (TPR=1.29).

Fig. 14 Effect of parameter SPRD on FVABI performance (TPR=1.29).

Fig. 15 Effect of parameter Pt, Outer on FVABI Mach number distribution (θ=10°).

Fig. 16 Effect of parameter Tt, Outer on FVABI Mach number distribution (θ=10°).
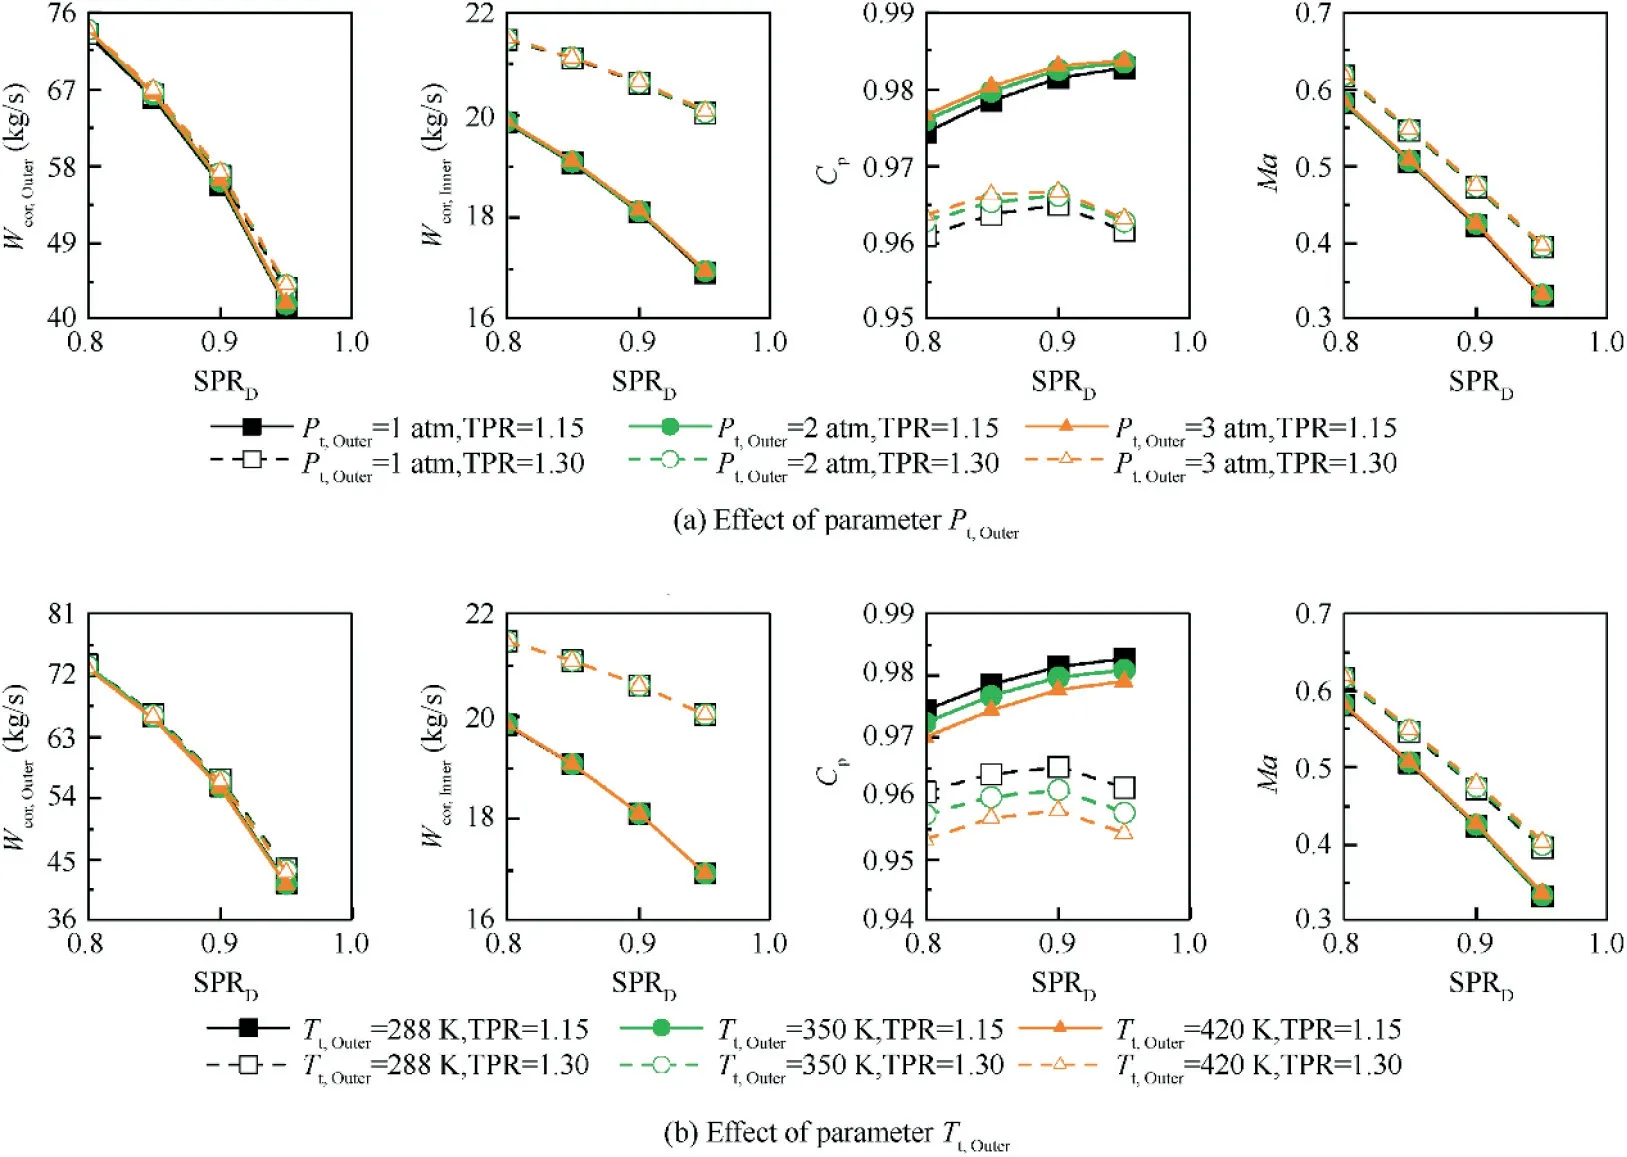
Fig. 17 Effect of parameters Tt, Outer and Pt, Outer on FVABI performance (θ=10°).
3.2.3. The deficiency of the zero-dimensional FVABI model
Compared with the zero-dimensional FVABI model described in Section 2, the sections of FVABI inner bypass inlet, outer bypass inlet and outlet are equivalent to the stations 6, 16 and 64. The stations 63 and 163 where static pressure balance is achieved are equivalent to the outlets of inner bypass and outer bypass. According to the FVABI flow characteristic revealed in Section 3.2.2,the static pressure balance is not realized at the inlet of mixing section and the location where the static pressure balance is achieved moves under various boundary conditions. The inner bypass flow may suffer severe flow loss caused by the strong shock wave and flow separation before it encounters outer bypass flow.Therefore,the assumptions that there is no pressure loss from station 6 to 63 and the static pressure balance is realized at stations 63 and 163 are invalid. And the geometric profile of lower wall has an effect on the mixing process for the FVABI model used in this paper.Thus, the assumption that the mixing happen in a constant cross section is also not practical. What’s more, the key sections for zero-dimensional FVABI model are stations 63 and 163 where determine the maximum mass flow rate of inner and outer bypass.The zero-dimensional FVABI model cannot take the effect of the throat of inner bypass into consideration.It also is difficult to predict the FVABI performance after the inner bypass is chocked in both double and single bypass mode, even if there is no geometric throat in the inner bypass flow path. Therefore, it can be concluded that the zerodimensional mixer model described in Section 2 are too simple to simulate the mixing process occurring in FVABI and a highfidelity model to characterize the FVABI performance in double bypass mode is necessary.

Fig. 18 Effect of parameter TTR on FVABI performance (θ=26°).
3.3. High-fidelity FVABI model with SVR
As analyzed above, the FVABI performance in double bypass mode can be represented by the relationship between FVABI performance parameters and boundary conditions. A method is needed here to capture the relationship.SVR has a complete theoretical system in mathematics, it can minimize structure risk and exhibits good generalization ability and prediction accuracy, and its effectiveness has been proved in many fields.19,20Therefore, SVR is used to capture the relationship between the three boundary conditions and every performance parameter.
As for regression problem, a set of labeled training sample points are provided, D= {(xi, yi), i=1, 2, ..., n}, where xi∊Rdis a vector in an input space, yi∊R is the corresponding target output and n is the number of labeled sample points.The aim of SVR is to find a hyperplane and ensure that all the training sample points locate as closely to the hyperplane as possible. The equation for the hyperplane is as follows:

where f is the regression function, Φ(x) is the feature vector with which the input data is mapped from its natural space into a higher dimensional feature space,21ω is the weight vector in the kernel feature space and b ∊R is a constant. The parameters ω and b need to be solved in the problem. But as for practical problems, it is difficult to find a feature space where the training sample points are linearly distributed exactly in it. Even if such a feature space and the corresponding hypeplane are found,the serious risk of overfitting may be unbearable. Therefore, the sample points are supposed to locate in the interval band around the hypeplane and the SVR problem is converted into the following optimization problem.

where C is the regularization constant, ε is the width of the interval band, and ξiand ζiare the slack variables. The first term requires the map of training data locates around the hyperplane. The second term penalizes any deviation beyond the interval band. When parameter C is finite, the error of regression function around the target output is allowed.
Introducing the Lagrance multipliers αi,α′i,μiand μ′ion the constraints of Eq. (3), the Largrance function is obtained:
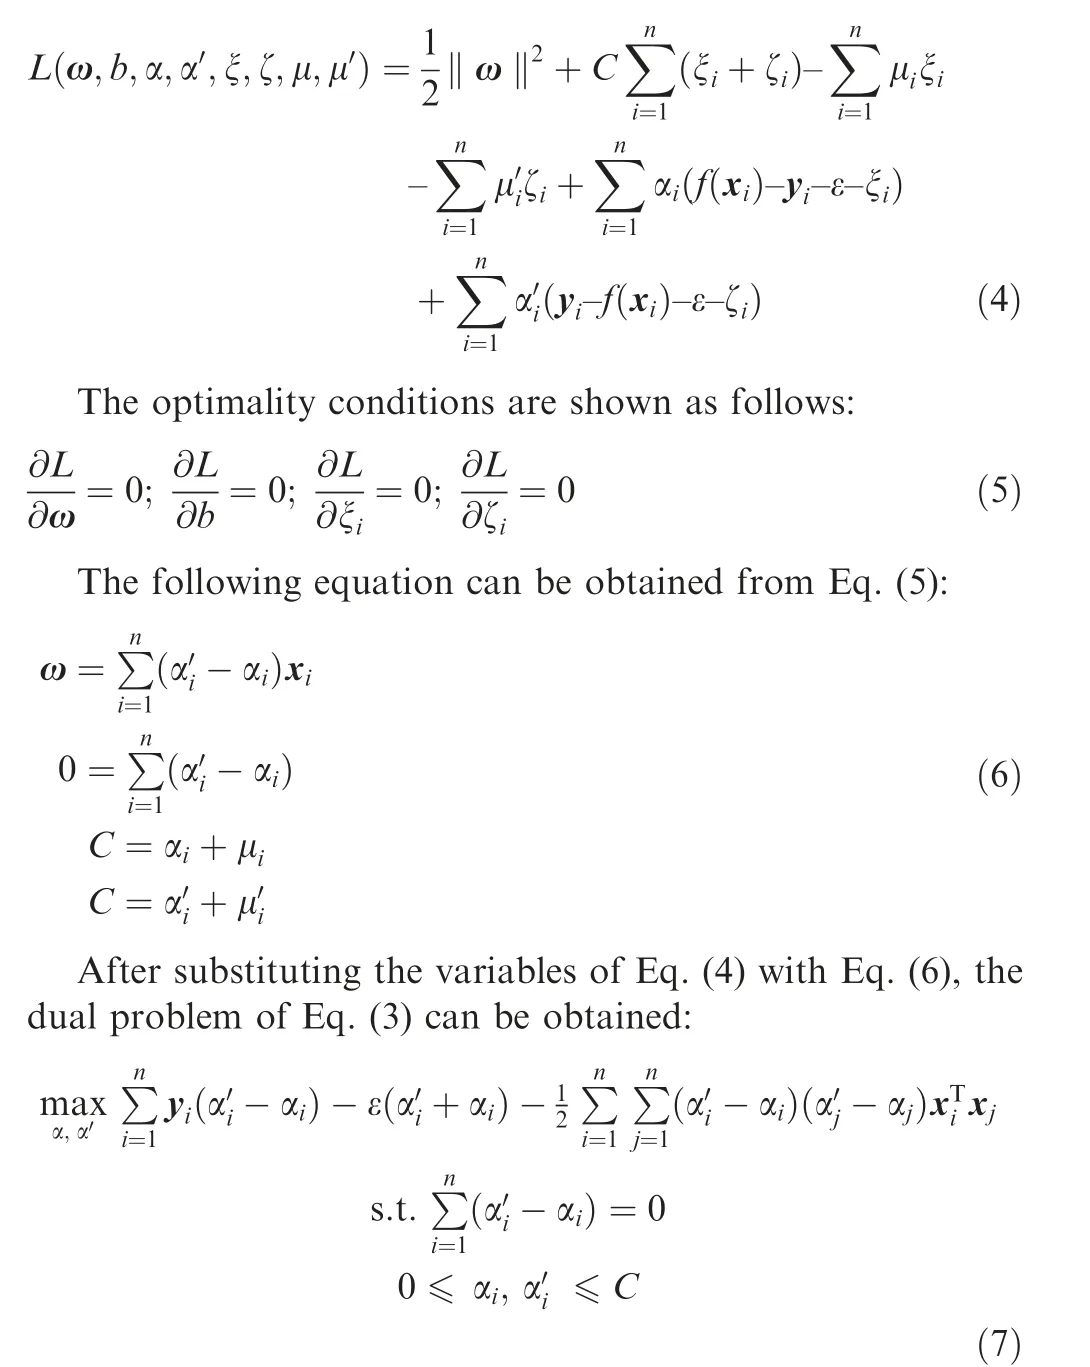
As a quadratic programming problem, the dual problem can be solved with well-developed method what is not described in this paper.22,23After getting Lagrance multipliers αiand α′i, the regression function is obtained:

The solution of dual problem involves the inner product operation.As for the feature space,the dimensions can be very high, even infinite. Therefore, it is usually hard to perform inner product operation directly.A kernel function,κ,is introduced to handle the problem:

The quality of the regression depends on the choice of the kernel function and its parameters. Different kernels have different characteristic and are suitable for different problem.24There is no perfect method for kernel function selection and the selection is usually performed with trial and error, optimization or user expertise at present. What’s more, when the training data is heterogeneous,unnormalized or non-flat,a single kernel function could not capture the characteristic of the training data. It is reasonable to consider the combination of kernel function for better results.24,25One common combination method is that the kernel function is defined as a combination of predefined basic kernel functions.26,27But the basis for the selection of the basic kernel functions and their parameters, such as weight coefficient for each kernel, is unknown and the method performs poorly with non-flat training data.A different method is to build the regression function using the same kernel function with different scales.28,29The smooth variations of the training data are handled by large-scale kernel function and the steep variations are dealt with smallscale kernel function. The treatment of steep variations is based on the result of previous regression of smooth variations and the regression result gradually approaches the target output.
As far as the FVABI performance in double bypass mode is concerned,parameters Wcor,Innerand Wcor,Outervary in a wide range with the change of parameter θ.As a result,the training data is non-flat.Therefore,the multi-scale kernel functions are employed in this paper. The final composite regression function can be written as:

where parameter m is the number of kernel scales. And fi(x)shares the same form as shown in Eq.(10).The kernel function used in the paper is Gaussian function:

where σ represents the scale of kernel and it is set as a geometric sequence σ1, σ1/2, ..., σ1/2m-1. The penalty coefficients Cifor different scales are calculated with a similar method. And C1and σ1are determined according to the authors’experience and adjusted based on the result of ten-fold cross validation.To be more specific,κ1is a kernel with large scale and the corresponding regression function f1(x) can fit the smooth variations generally. Based on the result, f2(x) with the smaller scale kernel κ2is built to fit the difference between the f1(x)and target output,and f2(x)is mainly used to fit the steep variations. Then fm(x) can be built with the same way until the accuracy requirement is achieved.And in this paper,the numbers of kernel scales for Cp,MaOutlet,Wcor,Outerand Wcor,Innerare 4, 4, 5 and 5 respectively.
The ranges of parameters TPR, SPRDand θ are shown in Table 3. Because the working condition of FVABI is affected by all other components of the engine, the combination of the three parameters will change under various operation conditions. In order to get the sample points to establish the regression model, the possible combinations of the three parameters in the sample space are gone through. During this process, all these three parameters are set as independent parameters. The relationship among parameters TPR, SPRDand θ is implicit in the ergodicity of combinations of these three parameters.The regression model can be used to predict the FVABI performance when FVABI works under specific working conditions as long as the specific combinations of parameters are within the sample space and the accuracy of the regression model is acceptable.
Parameter TPR ranges from 1.05 to 1.61 and the step size is 0.08.Parameter θ ranges from 2°to 50°and the step size is 8°.The range of SPRDchanges along with the change of parameter TPR and θ and the step size is 0.05.Beyond 500 combinations of parameters are performed using the method introduced in Section 3.1 and four performance parameters,MaOutlet, Cp, Wcor,Innerand Wcor,Outerare extracted at each computation point. All the results are screened according to parameters Wcor,Outerand MaOutletand 439 sample points are obtained finally. Then SVR introduced above is employed and the relationship between each performance parameter and the three boundary conditions is obtained.
3.4. Validation of multi-scale SVR model
The accuracy of regression model is assessed through the Root Mean Squared Error(RMSE)and the Average Relative Error(ARE) defined by Eqs. (13) and (14).

where n represents the training set size and f(xi) and yirepresent the predicted and real value.
Parameters RMSE and ARE of MaOutlet, Cp, Wcor,Innerand Wcor,Outerare shown in Table 4.As a dimensional parameter, RMSE can indicate the precision of different regression models, but the relative error between the predicted and real value is not reveal. Therefore, the ARE between the predicted value and real value for the four parameters are shown here and are all less than 1 percent. In addition, the comparison of predicted value and real value obtained from Computational Fluid Dynamic (CFD) model under different workingconditions is done and shown in Fig.19.Some values of θ that are not used as the training data are tested here.The results of the intermediate values of θ indicate that the regression function behave well when its input deviates from the sample points. In general, the predicted results agree with the CFD result in both value and trend.

Table 4 RMSE and ARE of the regression results.
4. The coupling method of FVABI and VCE
In Section 3,the high-fidelity FVABI model is established and it can be used to predict the FVABI performance in single bypass mode and double bypass mode quickly and accurately.Here, the coupling method of high-fidelity FVABI model and zero-dimensional VCE model is presented and the multi-level VCE model is built.
In design point analysis, VCE works in double bypass mode. The parameters TPR, Wcor,Innerand Wcor,Outerdetermined by Fan and CDFS components are all known. And parameters SPRDand θ need to be adjusted to match parameters Wcor,Innerand Wcor,Outer. The problem is solved with Newton iteration method.
In off-design point analysis,VCE works under two different operation modes according to actual requirement. In double bypass mode,two variables,parameters θ and SPRD,and two balance equations of mass flow rate are introduced and the static pressure balance is eliminated when the zero-dimensional FVABI model is replaced with the high-fidelity model.Parameter θ is chosen as a control parameter and parameter SPRDis used as an iterative variable. The value of parameter SPRDin design point analysis is used to initialize parameter SPRDin off-design point analysis. When VCE works in single bypass mode, SPRSis used as an iterative variable and the balance equation of FVABI inner bypass inlet mass flow rate is established. Thus, the numbers of iterative variables and balance equations are equivalent in both single and double bypass mode,and the problem can be solved with Newton iteration method.
5. Results and discussion
The multi-level VCE model is performed in single and double bypass mode.The convergence of the multi-level VCE model is proved and all the results are presented.
With the parameters in Table 1, parameters θ and SPRDsolved in design point analysis are 8.21° and 0.9575, and parameters MaOutletand Cpare 0.3473 and 0.9580 respectively.
At takeoff where flight altitude is 0 meter and flight Mach number is 0.3, VCE works in double bypass mode. As for FVABI in double bypass mode, parameter θ needs to be set by user and it affects the working status of CDFS significantly.Thus, the multi-level VCE model is performed under various angles of CDFS inlet guide vane (θCDFS). The performance parameters and boundary conditions of FVABI are shown in Fig.20.Both parameters TPR and SPRDare within the range of sample points used to establish the regression model.
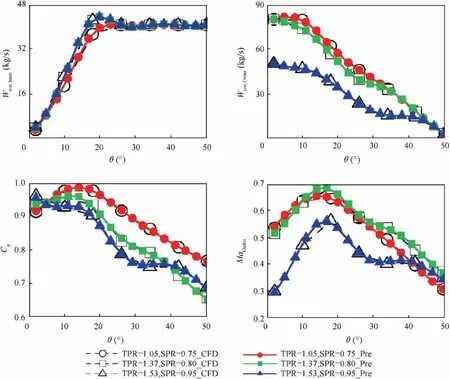
Fig. 19 Comparison of predicted results and CFD results.
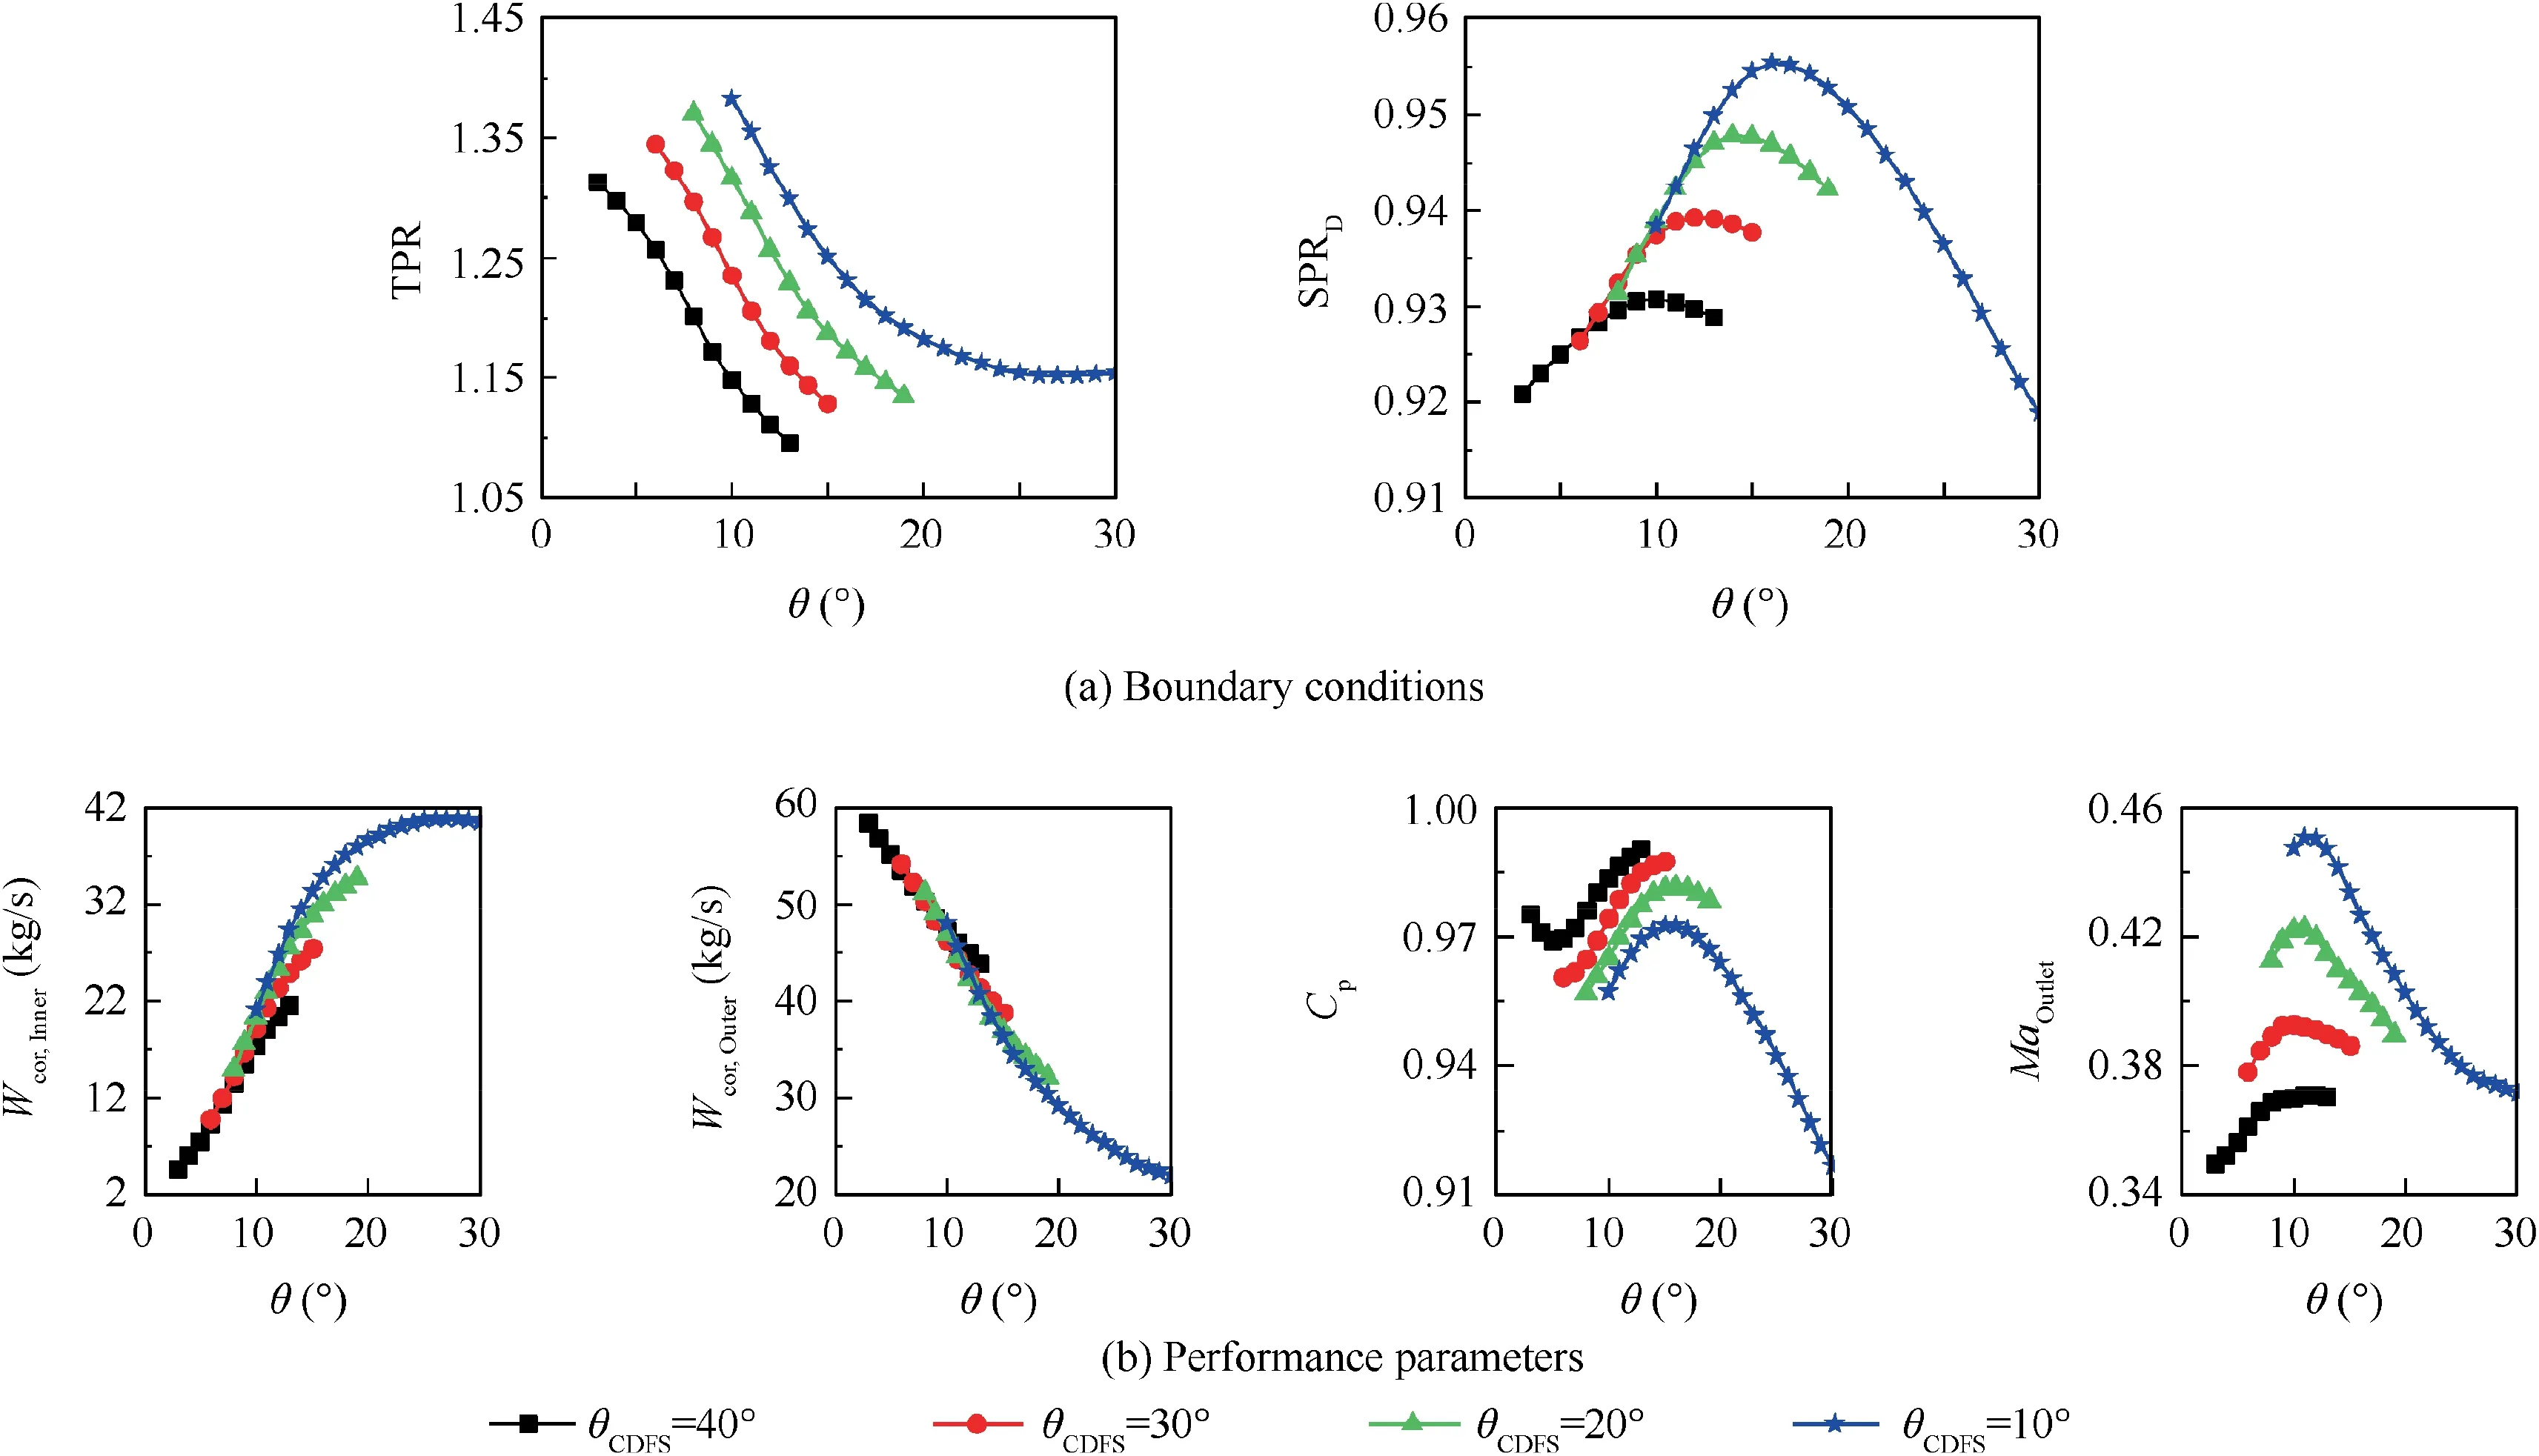
Fig. 20 Performance parameters and boundary conditions of FVABI at takeoff condition.
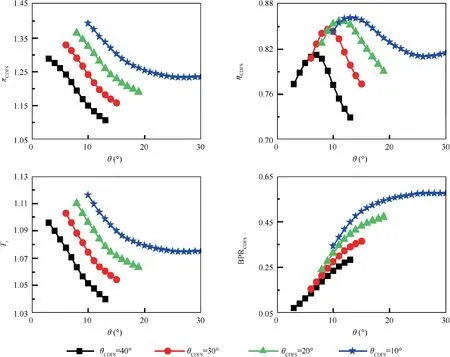
Fig. 21 Effect of parameter θ on CDFS performance.

Fig. 22 Effect of parameter θ on HPC performance.
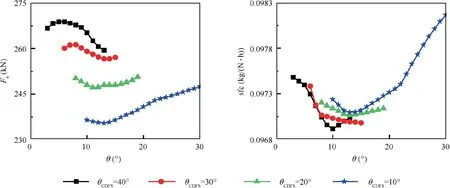
Fig. 23 Effect of parameter θ on VCE performance.

Fig. 24 Effect of parameter θ on fan performance.

Fig. 25 Comparison of FVABI performance obtained from multi-level VCE model and CFD.
The variations of CDFS pressure ratio (πCDFS) and isentropic efficiency (ηCDFS) are shown in Fig. 21. With the increase of parameter θ, the back pressure of CDFS drops,and it causes the increase of CDFS bypass ratio (BPRCDFS)and the decrease of parameter πCDFS.The variations of parameters πCDFSand ηCDFSresult in the decrease of the total temperature ratio of CDFS outlet and inlet (Tr), and it means the decrease of CDFS outlet total temperature. Then the corrected rotational speed of HPC (ncor,HPC) increases as well as the HPC corrected mass flow rate (Wcor,HPC), as shown in Fig. 22. Consideration that the combustion outlet total temperature is not changed, and the HPT and LPT work under supercritical condition what means the pressure ratio and isentropic efficiency are nearly the same.Then the output power of HPT and LPT is determined by mass flow rate. According to mass flow continuity, the mass flow rate of HPT and LPT is determined by HPC mass flow rate (WHPC). And parameter WHPCis affected by HPC inlet corrected mass flow rate, inlet total temperature and inlet total pressure.The output power of LPT will affect the working status of Fan component. Therefore, the variation of VCE thrust will be mainly determined by the variation of parameter WHPC.It can be seen in Figs.22 and 23 that the variation trends of VCE thrust and WHPCare the same under various θCDFS. And the sfc is affected by thrust, Fan bypass ratio and CDFS bypass ratio and the variation is slighter.
As analyzed in Section 3.2.3, the zero-dimensional FVABI model cannot predict FVABI performance when its inner bypass is chocked. And with the multi-level VCE model, the throttling effect of FVABI inner bypass is observed when θCDFSis 10°. When the parameters θ increases further after the FVABI inner bypass is chocked, parameter Cpdrops severely,and the working status of CDFS and HPC do not change significantly. Meanwhile, the backpressure of Fan component increases causing the increase of Fan pressure ratio (πFan)and the decrease of Fan bypass ratio (BPRFan), as shown in Fig. 24. The increase of parameter πFanwill result in the increase of CDFS mass flow rate and WHPC. The increase of LPT output power can result in the increase of Fan corrected mass flow rate(Wcor,Fan)and fan pressure ratio.Finally,both the VCE thrust and the sfc will increase, as shown in Fig. 23.
At supersonic condition where flight altitude is 16,300 m and flight Mach number is 2.32, VCE works in single bypass mode. The corresponding θCDFSis 0° and the FVABI outer bypass is fully closed. The simulation result shows that the parameter SPRSis 0.9505. It means that FVABI inner bypass is not chocked and the corresponding Cpis 0.9715.Meanwhile,because the CDFS pressure ratio at supersonic condition is 1.3822, the FVABI outlet static pressure is much higher thanthe Fan outlet total pressure. If the mode of VCE is transformed to double bypass mode and FVABI outer bypass is open at the moment,backflow in FVABI outer bypass is inevitable. It indicates that something needs to be done to make parameter SPRSdrop before the mode transition is performed.The high-fidelity FVABI model developed in this paper has the potential to predict the initial point of VCE mode transition and the VCE performance during the dynamic process.

Table 5 FVABI performance difference between multi-level VCE model and CFD.
In order to show the accuracy of the multi-level VCE model,the boundary conditions of FVABI is extracted to perform numerical simulation and the CFD results are compared with the FVABI performance parameters obtained from multilevel VCE model. Three numerical simulations are performed and parameter θ is 10°, 20° and 30° with θCDFSbeing 10°.The values of 20° and 30° for parameter θ are not contained in the sample points. The comparison is shown in Fig. 25.The difference of FVABI performance is defined as the relative change of performance parameters obtained from multi-level VCE model to CFD results and is shown in Table 5. It can be seen that the maximum difference does not exceed 2.61 percent,even though the value of θ is not contained in the sample points.The results indicate that FVABI performance obtained from the multi-level VCE model is within the acceptable error range.It is reasonable to evaluate the effect of FVABI on VCE performance with the multi-level VCE model.
6. Conclusions
(1) The FVABI flow characteristic is significantly affected by the location of the rotational valve and the related aerodynamic parameters. The zero-dimensional FVABI model based on some assumptions cannot provide accurate prediction of FVABI performance, especially when its inner bypass is chocked.
(2) The high-fidelity FVABI model is established for single and double bypass mode respectively. The performance curves are used to represented performance of FVABI in single bypass mode. As for FVABI in double bypass mode, the multi-scale SVR is employed to capture the relationship between its performance parameters and boundary conditions.And the predicted results obtained from the regression model agree with the CFD results in both value and trend.
(3) In order to establish the multi-level VCE model, the zero-dimensional FVABI model is replaced with highfidelity FVABI model, and the corresponding iterative variables and balanced equations in both single bypass mode and double bypass mode are adjusted according to the features of zero-dimensional VCE model and the high-fidelity FVABI model. The convergence of multi-level VCE model in single and double bypass mode is proved and the high-fidelity FVABI model can predict the performance of FVABI and VCE when FVABI inner bypass is chocked.
Declaration of Competing Interest
The authors declare that they have no known competing financial interests or personal relationships that could have appeared to influence the work reported in this paper.
Acknowledgments
The authors would like to express their gratitude for the financial support of the National Natural Science Foundation of China (Nos. 51876176 and 51906204) and MIIT.
 CHINESE JOURNAL OF AERONAUTICS2021年8期
- CHINESE JOURNAL OF AERONAUTICS的其它文章
- A novel virtual material layer model for predicting natural frequencies of composite bolted joints
- Multi-layered plate finite element models with node-dependent kinematics for smart structures with piezoelectric components
- Modeling bending behavior of shape memory alloy wire-reinforced composites: Semi-analytical model and finite element analysis
- Sequential ensemble optimization based on general surrogate model prediction variance and its application on engine acceleration schedule design
- Transition prediction and sensitivity analysis for a natural laminar flow wing glove flight experiment
- Modeling on mechanical behavior and damage evolution of single-lap bolted composite interference-fit joints under thermal effects
