
A comparison of visual acuity measured by ETDRS chart and Standard Logarithmic Visual Acuity chart among outpatients
2021-04-17 02:43TaoWangPeiJieHuangChenChenDingWeiLiuJingLinYi
Tao Wang, Pei-Jie Huang, Chen Chen, Ding-Wei Liu, Jing-Lin Yi
1Jiangxi Medical College, Nanchang University, Nanchang 330000, Jiangxi Province, China
2Department of Ophthalmology, the Affiliated Eye Hospital of Nanchang University, Nanchang 330000, Jiangxi Province,China
Abstract
● KEYWORDS: visual acuity; logMAR; ETDRS; Standard Logarithmic Visual Acuity Chart
INTRODUCTION
A ccurate visual acuity (VA) measurement is at the core of ophthalmological examination for all age groups, which is founded on letter recognition[1]. Eye chart is an important and commonly used tool in the screening, ophthalmology clinic and scientific research. However, there is no systematic consensus on the best eye chart for VA measurement in China.Two eye charts are widely used in China to measure the VA of outpatients include the Early Treatment Diabetic Retinopathy Study (ETDRS) chart and Standard Logarithmic Visual Acuity(SL) Chart.
EDTRS chart, made by Ferris and recommended by the National Academy of Sciences National Research Council,are considered to be the gold standard for international clinical research. The design of ETDRS chart follows the design criterion of the Bailey-Lovie chart[2]. Each line of the ETDRS charts consists of five SLOAN letters with the same size and identical reading difficulty, with a total of 14 lines. The design follows the Weber-Fechner rule. The size of the letter increases by equal ratio series, and the increment rate is constant to √10.
The interval between letters is one letter wide, and the interval between adjacent two lines is the same size of the letters of the next lower line. Ophthalmologists suggests that it is more appropriate to set 4 m as the standard measurement distance.ETDRS charts provide three methods for recording VA,including logMAR, fractional and decimal recording methods.The measuring range is 1.0 to -0.3 (logMAR recording method). However, some patients may not be able to read the“SLOAN” letters, which limited the use of ETDRS charts for VA measurement among Chinese outpatients[3].
The 5 m Standard Logarithmic Visual Acuity (5SL) Chart,designed by Professor Tianrong Miao in 1959 and revised by Professor Qinmei Wang in 2011, has proved its value and significance in screening, ophthalmology clinic after more than 20y of applications. The design follows the Weber-Fechner rule. There are 14 lines and the line space is 24 mm. The equal length of the three lines of E were used as optotype, and the increment rate of the letter was set to √10. The test distance is 5 m and the VA was recorded by 5-grade recording method and decimal recording method. The measuring range is 4.0-5.3(5-grade recording method). The 5-grade recording method can be directly used for VA statistics and efficacy evaluation, which is essentially equivalent to logMAR recording method. The 5-grade recording method shows that the better the VA, the larger the vision value and the negative value does not appear,which is in line with Chinese customs. The 2.5 m Standard Logarithmic Visual Acuity (2.5SL) Chart is consistent with the 5SL chart in the core design but the test distance is at 2.5 m for small clinical situation. In China, both 5SL chart and 2.5SL chart are commonly used in screening, ophthalmology clinic.Although these three types of eye charts have been applied to the VA measurement of Chinese outpatients, as far as we know,there are few large clinical trials comparing the consistency and difference of these three eye charts. Therefore, the purpose of this experiment is to compare the consistency and difference of the results of ETDRS chart, 5SL chart and 2.5SL chart in different age groups and evaluate the performance of these three eye charts in clinical VA examination, help clinician properly assess the severity of diseases in outpatients.
SUBJECTS AND METHODS
Ethical ApprovalThe study was approved by the Ethics Committee of the Affiliated Eye Hospital of Nanchang University and conformed to the tenets of the Declaration of Helsinki. Informed consent was obtained from all of the study participants.
Study DesignWe conducted a cross-sectional study in the outpatients clinic of the Affiliated Eye Hospital of Nanchang University from May 1, 2019 and August 25, 2019. Outpatients between the ages of 12-80y and both eyes which were eligible for tests were included in the study, and those who did not cooperate with any one of the test or underwent vision correction surgery before were excluded.
Environment and Eye ChartsExamination with both ETDRS chart and SL chart were performed in the same room under the same light conditions with a contrast of at least 85%and the luminance at 200 cd/m2[4]. Select a well-illuminated,quiet and interference-free room as the text room[5]. The 0 (logMAR) line of the eye charts should be at the same height as the eye to be examined.
The size of ETDRS chart used in this test were 62×65 cm2and the size of the letter is ranging from 58.18 mm to 2.92 mm. The special material for making ETDRS chart can maintain high contrast between the black letters and the white background[6].ETDRS chart are placed in the lighthouse box which can provide standardized illumination[7].
According to the Chinese national standards, 5SL chart used in this test was printed on offset printing paper with a format of 787×1092 mm2. The lighthouse box designed by the rear reflective illumination method should have brightness no less than 200 cd/m2on the white background of the eye chart[8]. The 2.5SL also follows the Chinese national standards, but the size of letter is half of the letter in 5SL chart, and the examination distance is half of 5SL chart. Due to the smaller examination distance, it is often used when the test room is small.
ProceduresCheck the right eye first followed by the left eye.When measuring the VA of right eye, we use the eye mask to cover the left eye completely without oppressing the eye and instruct the subjects to open their eyes naturally[5]. The steps of tests for both eyes were the same. After both eyes were tested,subjects were given about 5min for rest. The order of the three charts shown to each subject was random.
For the ETDRS charts, the subject was required to stand at 4 m and read the chart from the top to the bottom line by line until more than 2 errors appeared on the line. Acuity was scored as the smallest line where 3 of 5 letters were recognized correctly[9].
For the SL chart, the VA was tested with the subject stand at 5 m for the 5SL chart and at 2.5 m for the 2.5SL chart. The subject was required to read the chart from the top to the bottom line by line. Measure the minimum optotype that can be recognized by the eye to be tested. Acuity was scored as the smallest line where the number of letter correctly recognized was more than half of the total number of letter on the line[8].Statistical AnalysisThe results of VA were transformed to logMAR[10]to show the difference between the three eye charts directly and were divided into 4 groups according to the age ranges: 12-17y, 18-45y, 46-60y, 61-80y. We used the Shapiro-Wilk test to assess the normal distribution of the data, and we found that the tests were not distributed normally (P<0.001),so we analyzed the comparisons with non-parametric methods.Data were analyzed using SPSS21, and P<0.05 was treated as statistically significant.
RESULTS
A total of 2000 outpatients [4000 eyes; age (mean±SD),44±20y] were included in the study.
Difference Analysis of Three Eye ChartsIn all outpatients’VA tests, the mean logMAR VA results of ETDRS chart, 5SL chart and 2.5SL chart are 0.52±0.28, 0.50±0.30, and 0.46±0.28 respectively. There is significant difference in the mean VAresults of ETDRS charts, 5SL chart and 2.5SL chart (P<0.001;Table 1). The VA difference in the eye charts changes with the increase of their ages (P<0.05; Table 2).

Table 1 Mean VA between eye charts
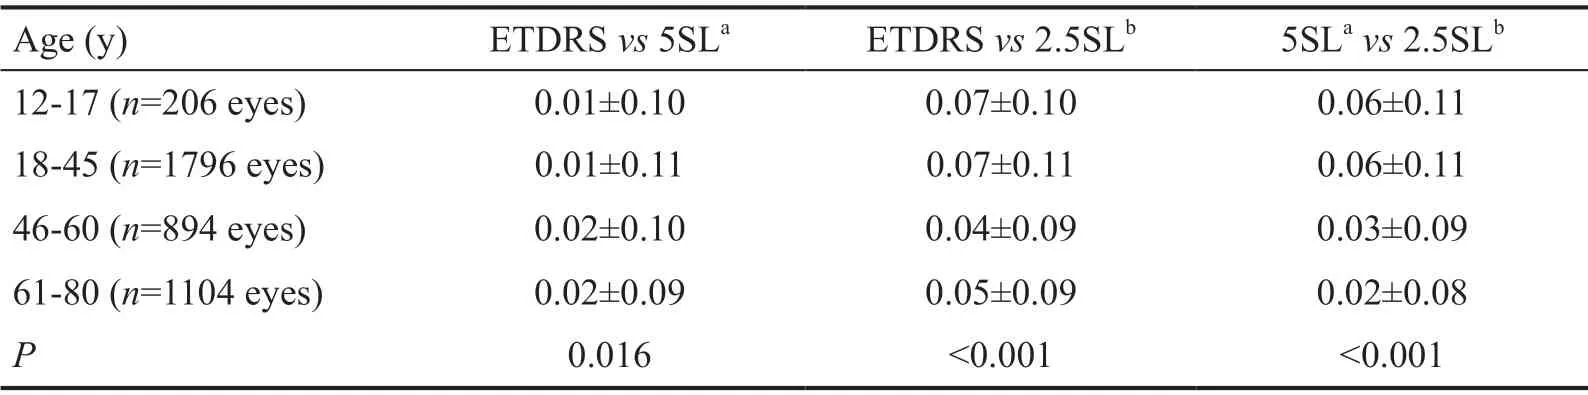
Table 2 VA difference in eye charts
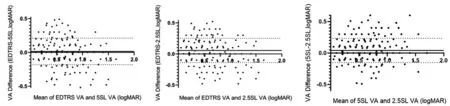
Figure 1 Bland-Altman plot of three eye charts.

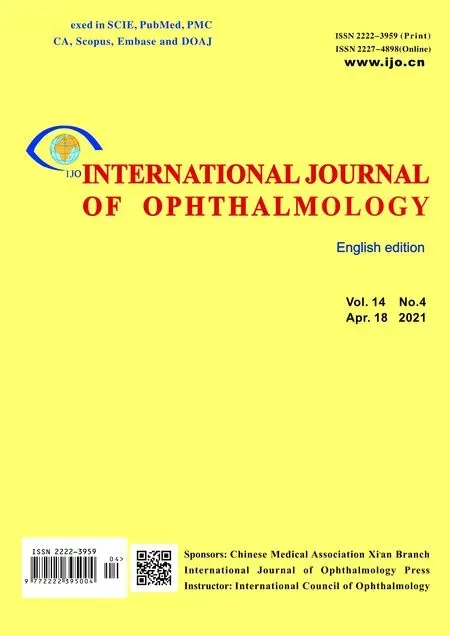
Figure 2 Linear regression of three eye charts.
Agreement Analysis of the Three Eye ChartsThe Bland-Altman plot of ETDRS charts and 5SL chart shows a mean bias of 0.014 (horizontal solid line) and the 95% limits of agreement(±1.96 SD of the bias) at -0.182 and 0.210 (dashed lines).
The Bland-Altman plot of ETDRS charts and 2.5SL chart shows a mean bias of 0.056 (horizontal solid line) and the 95%limits of agreement (±1.96 SD of the bias) at -0.139 and 0.251(dashed lines).
The Bland-Altman plot of 5SL chart and 2.5SL chart shows a mean bias of 0.0416 (horizontal solid line) and the 95%limits of agreement (±1.96 SD of the bias) at -0.151 and 0.235(dashed lines; Figure 1).
Correlation Analysis of Three Eye ChartsWe used Spearman correlation analysis in every two eye charts. The correlation coefficient between ETDRS chart and 5SL chart was 0.944 (P<0.001); the correlation coefficient between ETDRS charts and 2.5SL chart was 0.937 (P<0.001); the correlation coefficient between 5SL chart and 2.5SL chart was 0.946 (P<0.001; Figure 2).
DISCUSSION
The study provides the first large-scale comparison of VA tested by ETDRS chart, 5SL chart, and 2.5SL chart in outpatients of age 12-80y. Such comparison is important because it is necessary to evaluate the difference in the three eye charts to help ophthalmologist judge which eye chart to use.ETDRS chart is consistent with the SL charts in the core design, which means there is the same visual angle, the same increment rate, and the same recording method. Our statistics show that the VA measured by 5SL chart and 2.5SL chart are better than ETDRS chart. We guess that there are three reasons for this result. The first is the crowding effects and the widely used of SL charts in China. Crowding effects indicate the phenomenon that VA for a letter surrounded by other letters may be damaged relative to VA for a single letter. Danilova and Bondarko[11]found the crowding effects of emmetropic eyes showed a U-shaped change. The crowding effects reach its peak at 2 gap widths and reach a plateau at 3-5 gap widths[11]. The arrangement of letters of ETDRS chart follows the design criterion of the Bailey-Lovie chart. The line space and the interval between adjacent letters change with the size of the letter. The interval between adjacent letters and the top space is about 5 gap widths, and the bottom space is about 3-5 gap widths. So the crowding effects are constant and the VA measured by a line of letters is roughly equal to the VA measured by a single letter. For SL charts, crowding effects vary from line to line because the space between lines is 24 mm,which does not change with the size of the letter. The line space below 0.5 logMAR line is wider, the crowing effects are smaller, the letters are easier to identify, so the VA value is higher. The second reason is that SL charts are widely used in China and people are familiar with SL charts and even keep the charts in mind. In this case, the subjects could identify letters correctly by guessing which will overestimate the VA.The third reason is that during the data analysis, we converted decimal VA to logMAR which will overestimate VA value[12].VA is measured by the minimum resolution angle of the human eyes, at the same visual angle, the corresponding VA is equal.At the standard distance of three charts, the visual angles formed by the letters representing the same VA should be the same. But we found the VA measured by the 2.5SL chart is about 0.5 line better than the VA tested by the 5SL chart. We suggest the main reason is the difference in test distance. The test distance for examining distant VA depends on the fact that the parallel rays of the outside pass through the refractive system of the eye and are focused on the foveal of the retina when the accommodation of emmetropic eye is still. In theory,the farther the test distance is, the more accurate it is. Due to the limitation of the clinical situation, it is more approximately to set 5 m as standard for examination and doctor-patient communication. An infinite equivalent refraction is obtained by subtracting 0.2 D from 5 m refraction and 0.2 D can be ignored. The light emitted by near objects is discrete light,which can make the focus move back to the retina and form a clearer image, so it can be seen more clearly.
Therefore, when tested with 2.5SL at 2.5 m, VA value will be overestimated. But for ETDRS chart, ophthalmologists suggest that it is more appropriate to set 4 m as the standard test distance. This distance is the same as the current metre system changes in the United States[6]. Compared with other test distances, we can get the results of the maximum VA and minimum dispersion of VA at 4 m test distance[13]and it is useful to use ETDRS chart in small clinical situation.
Our study included 2000 people between the age of 12y and 80y and we divided the results into four groups by ages. We found the differences of VA between ETDRS and 2.5SL chart, 5SL and 2.5SL chart are gradually reduced. The degree of VA depends on the number of cone cells in the retina. The cones are mainly distributed in the central fovea of macula.However, Gao and Hollyfield’s[14]study showed that the density of cone cells in the central fovea of macula did not change with ages, and there was no statistical significance.Curcio et al[15]also did research which showed that the density of cone cells in the central fovea of macula changed little during the ages of 27 to 90. So, we think the reason is the adjustment scope of eyes decreases with ages. The acquisition of visual information depends on whether the optical system of the eye can clearly focus on the externally incident light on the retina, and the front surface of the cornea and lens is the main refractive medium. In order to focus on the near-distance target on the foveal of the retina, it is necessary to increase the curvature of the lens, thereby increasing the refractive power of the eye. With the increase of ages, a series of changes have taken place in the lens, such as gradually increase in the hardness of the lens[16], the decrease of lens capsule elasticity and the change of ciliary muscle and curvature (shortened radius) of the anterior lens surface[17], cause the adjustment of the eyes gradually decrease. Therefore, the ability of middleaged and old people to identify fine optotypes is reduced,so the differences of VA between ETDRS and 2.5SL chart,5SL and 2.5SL chart are gradually reduced. But we found the difference of VA between ETDRS chart and 5SL chart is slightly increased with ageing. We guess the main reasons are that we don’t know if the subjects had eye diseases or not and the type of eye diseases they were suffering from. For patients with age-related macular degeneration, the macular function is impaired[18]and they need higher luminance and contrast for VA tests[19-20]. The vision value obtained are deviated.Therefore, different diseases can have different effects on the results of VA which may produce the abnormal results.
Bland-Altman analysis has been widely used in the world to evaluate the consistency of different clinical measurement methods[21]. Generally, the 95% consistency of the two VA differences does not exceed 0.2 logMAR, and the eye charts can be considered to be consistent[22]. Our results show the 95%limits of agreement between ETDRS chart and 5SL chart is-0.182 to 0.210 logMAR; the 95% limits of agreement between ETDRS chart and 2.5SL chart is -0.139 to 0.251 logMAR; the 95% limits of agreement between 5SL chart and 2.5SL chart is-0.151 to 0.235 logMAR. The 95% consistency of the two VA differences is about equal to 0.392, 0.390 and 0.386 logMAR respectively. Thus, the agreement in the three eye charts is not high. The difference in the three eye charts is clinically significant and the VA measured by the three eye charts are not equal. In conclusion, the results indicate that the agreement in the three eye charts is not high. There is significant difference in the three eye charts. The VA measured by the 5SL chart is slightly better than that by the ETDRS chart and the 5SL chart would be a suitable alternative when the ETDRS chart is not available in the clinical situation. The 2.5SL chart produced VA that was about 0.5 line better than VA tested by the ETDRS chart, which may overestimate VA.
ACKNOWLEDGEMENTS
Conflicts of Interest:Wang T,None;Huang PJ,None;Chen C,None;Liu DW,None;Yi JL,None.
 International Journal of Ophthalmology2021年4期
- International Journal of Ophthalmology的其它文章
- Prevalence and risk factors of dry eye disease in young and middle-aged office employee: a Xi’an Study
- YM155 inhibits retinal pigment epithelium cell survival through EGFR/MAPK signaling pathway
- Clinical features and treatment outcomes of intraocular lymphoma: a single-center experience in China
- Trends in research related to high myopia from 2010 to 2019: a bibliometric and knowledge mapping analysis
- A simple new technique for the induction of residual posterior vitreous cortex removal and membrane peeling
- Differential degeneration of rod/cone bipolar cells during retinal degeneration in Royal College of Surgeons rats