Inconsistency of changes in uniaxial compressive strength and P-wave velocity of sandstone after temperature treatments
Jinyun Zhng, Ynjun Shen, Gengshe Yng, Hun Zhng, Yongzhi Wng, Xin Hou,Qing Sun, Guoyu Li
a College of Architecture and Civil Engineering, Xi’an University of Science and Technology, Xi’an, 710054, China
b College of Geology and Environment, Xi’an University of Science and Technology, Xi’an, 710054, China
c Geological Research Institute for Coal Green Mining, Xi’an University of Science and Technology, Xi’an, 710054, China
d State Key Laboratory of Frozen Soil Engineering,Cold and Arid Regions Environmental and Engineering Research Institute,Chinese Academy of Sciences,Lanzhou,730000, China
Keywords: Sandstone High temperature Uniaxial compressive strength (UCS)P-wave velocity Distortion Mineralogy
ABSTRACT It is generally accepted that the uniaxial compressive strength(UCS)and P-wave velocity of rocks tend to decrease simultaneously with increasing temperature. However, based on a great number of statistical data and systematic analysis of the microstructure variation of rocks with temperature rising and corresponding propagation mechanism of elastic wave, the results show that (1) There are three different trends for the changes of UCS and P-wave velocity of sandstone when heated from room temperature(20 °C or 25 °C) to 800 °C: (i) Both the UCS and P-wave velocity decrease simultaneously; (ii) The UCS increases initially and then decreases, while the P-wave velocity decreases continuously; and (iii) The UCS increases initially and then fluctuates,while the P-wave velocity continuously decreases.(2)The UCS changes at room temperature-400 °C, 400 °C-600 °C, and 600 °C-800 °C are mainly attributed to the discrepancy of microstructure characteristics and quartz content, the transformation plasticity of clay minerals, and the balance between the thermal cementation and thermal damage, respectively. (3) The inconsistency in the trends of UCS and P-wave velocity changes is caused by the change of quartz content, phase transition of water and certain minerals.
1. Introduction
The uniaxial compressive strength (UCS) is one of the most important mechanical properties of rock materials. It is of great significance in many deep rock engineering applications, such as geothermal resource development, underground storage and extraction of petroleum and natural gas, utilization of deep underground space, disposal of radioactive waste in deep geological repositories (DGR), underground coal gasification (UCG), and geological carbon dioxide (CO2) storage (Leung et al., 2014;Ozguven and Ozcelik,2014;Sirdesai et al.,2017;Zhang et al.,2017).The strength of rock materials is generally determined in the laboratory on core samples according to test standards (e.g. ASTM D7012-14e1, 2014). This method to directly determine the rock strength can provide reliable results, but generally it is timeconsuming and expensive, and the core samples are sometimes very difficult to obtain (for example the rocks containing weaknesses or very tough rocks) (Rezaei et al., 2019). The lack of convenient direct methods to determine the strength of rock has led to the development of indirect testing methods, such as Schmidt hammer test,block and cylindrical punch tests,point load tests and wave velocity tests(Fereidooni and Khajevand,2018).The measurement of P-wave velocity is a simple, feasible, nondestructive testing method in both laboratory and in situ tests.
Due to the simplicity and convenience of P-wave velocity measurement, the method of predicting the mechanical property changes by P-wave velocity has been widely used. The UCS and Pwave velocity of rocks of different types were determined at room temperature (20°C or 25°C) by previous scholars, and empirical relationships between the UCS and P-wave velocity of different rocks with relative high correlation coefficients (>0.6) were established by the regression analysis. It was found that the correlation between the UCS and P-wave velocity is positive(Yasar and Erdogan, 2004; Kılıç and Teymen, 2008; Sharma and Singh,2008; Khandelwal and Singh, 2009; Yagiz, 2011; Sarkar et al.,2012; Khandelwal, 2013; Azimian et al., 2014; Azimian and Ajalloeian, 2015; Jamshidi et al., 2016a; Kurtulus¸ et al., 2016).Some researchers investigated the influences of fabric, saturation,diameter size, density, and porosity of rock samples on the relationship between the UCS and P-wave velocity (Török and Vásárhelyi, 2010; Karakul and Ulusay, 2013; Jamshidi et al.,2016b, 2018; Abdi et al., 2018; Rezaei et al.,2019).
Due to the development of deep underground engineering around the world,the physico-mechanical properties of rocks(such as density, porosity, permeability, P-wave velocity, thermal diffusivity,thermal conductivity,elastic modulus,UCS,tensile strength,and peak strain) after thermal treatment are extensively studied(e.g. Hajpál, 2002; Chaki et al., 2008; Ranjith et al., 2012;Kompaníková et al., 2014; Ozguven and Ozcelik, 2014; Sengun,2014; Sirdesai et al., 2017, 2019; Gautam et al., 2018, 2019;Rathnaweera et al., 2018; Vagnon et al., 2019). High temperature can cause thermal stress and mineral expansion as well as various changes of physical and mineral properties. This leads to microstructure changes and development and expansion of microcracks(Tian et al.,2016).The UCS and P-wave velocity of rocks reduce due to the deterioration of rock microstructures and the development of microcracks (Zhang et al., 2016, 2019; Shen et al., 2018a).Conversely, some researchers experimentally studied the differences in the changes of the UCS and P-wave velocity of rock samples subjected to high temperatures (Liu and Xu, 2015; Yu et al.,2015; Lei et al., 2019).
In this study,we focused on different changes of the UCS and Pwave velocity of sandstone after thermal treatment. It shows that the P-wave velocity of sandstone decreases with increase in temperature, and the UCS of sandstone either increases or remains unchanged in temperatures from room temperature to 800°C,based on the normalization processing of UCS and P-wave velocity of sandstone determined from previous researches. According to the microstructure changes of rock caused by high temperature and propagation principle of elastic wave in rock,different relationships between the UCS and P-wave velocity of sandstone after thermal treatment are analyzed using conceptual graphs and scanning electron microscopy (SEM) images.
2. Materials and methods
2.1. Materials
The characteristics of sandstones in several publicly available studies are summarized in Table 1.As shown in Table 1, sandstone samples were mainly sampled from China, USA and Germany. As the P-wave velocity measurement and UCS tests have to be carried out successively on the same sample after thermal treatment, cylindrical sandstone samples (φ50 mm × 100 mm) are generally prepared according to ASTM D7012-14e1(2014).The main mineral composition of most sandstone samples is quartz,with some minor components of feldspar, albite, calcite and sericite. In this context,the coarse-, medium-, and fine-grained sandstones samples are considered.
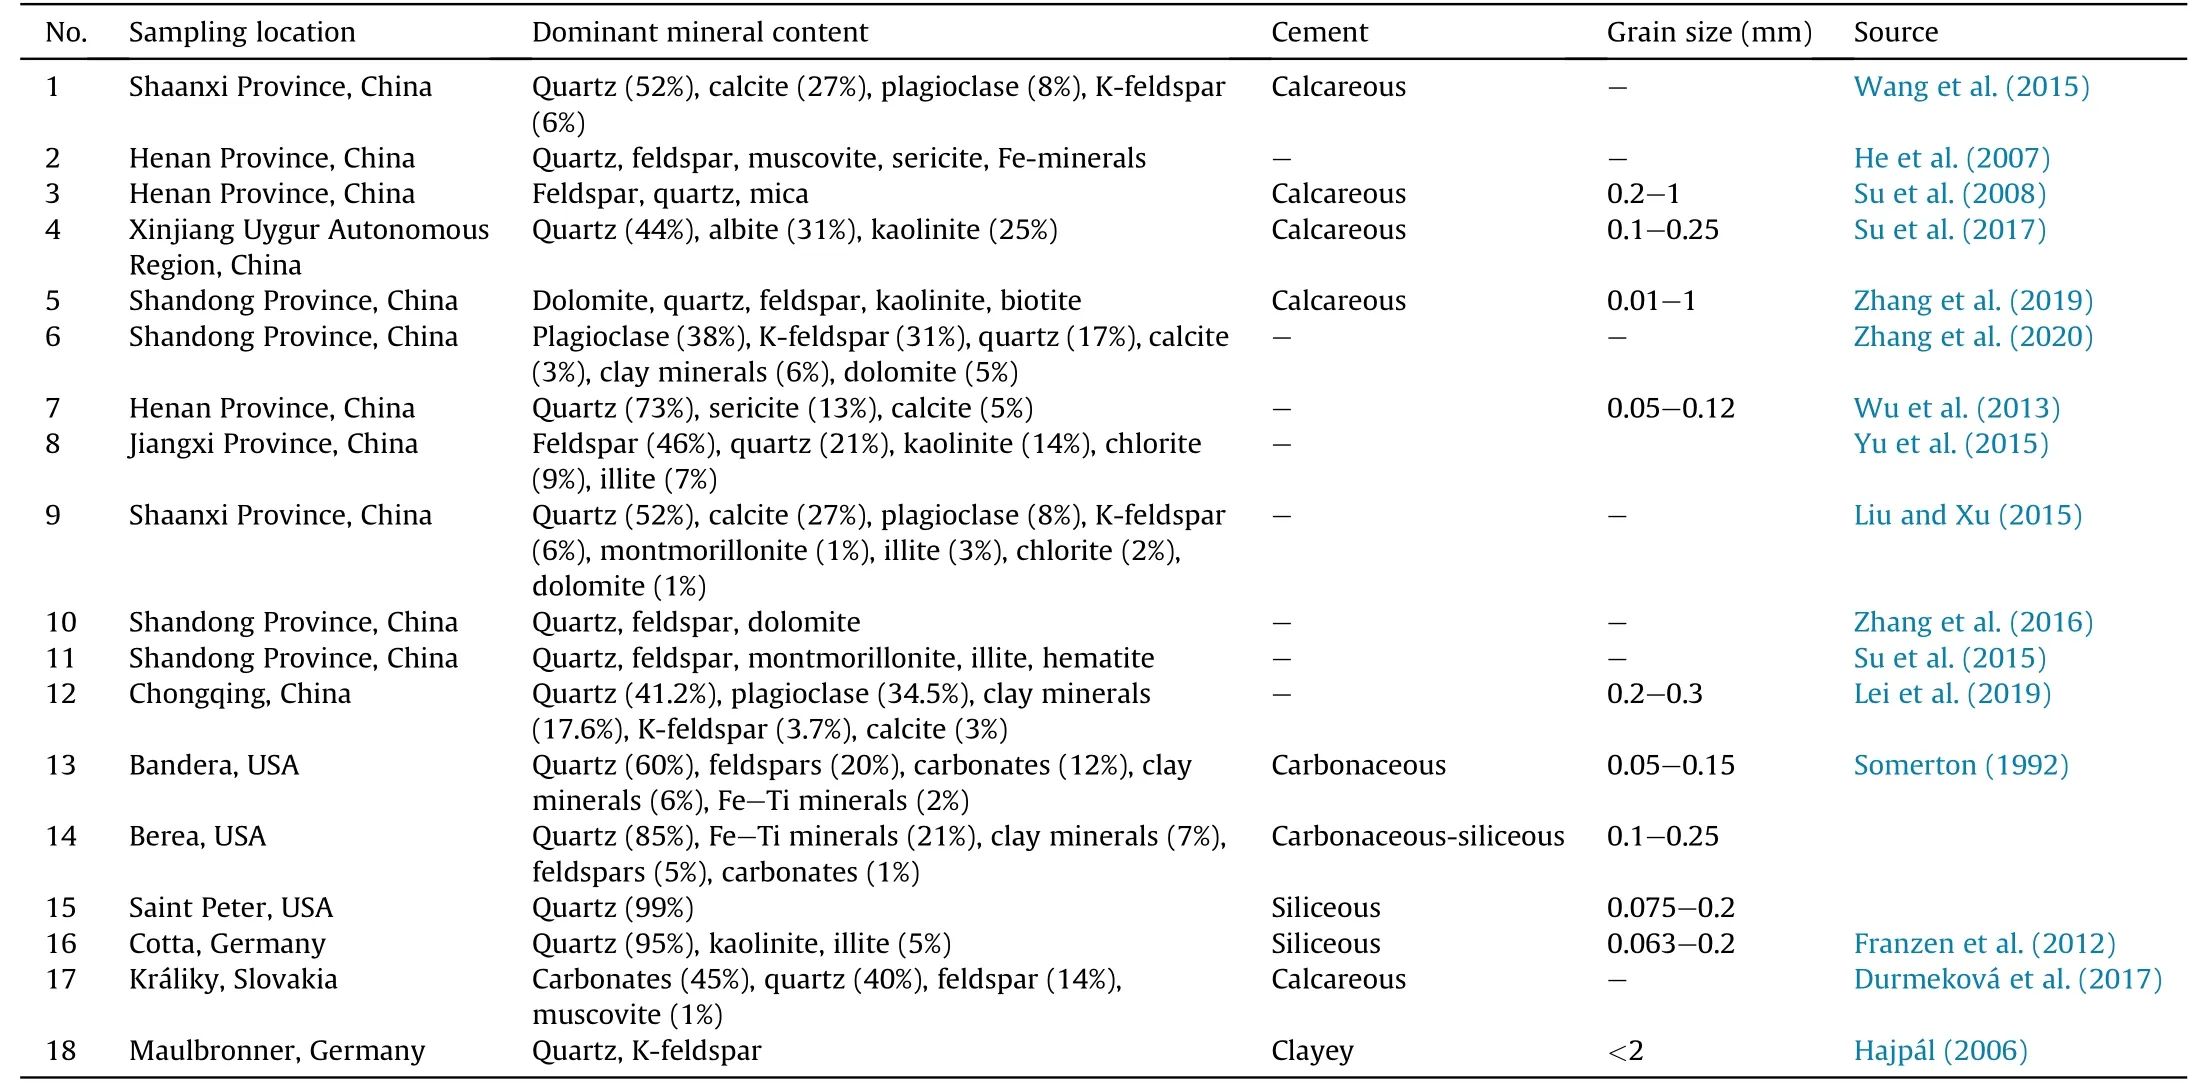
Table 1 Characteristics of the sandstone samples from previous researches.
2.2. Test data acquisition process
In Table 1, although different experimental schemes are used,the experimental processes in terms of measurements of the UCS and P-wave velocity of sandstones before and after high temperature treatment are roughly the same. Similar to the in situ measurement of P-wave velocity, the P-wave velocity of sandstone in the laboratory at room temperature was also indirectly determined by arrival time of P-wave from transmitter to receiver(Meglis et al.,2005). Firstly, based on the P-wave velocity test results, the sandstone samples with approximately the same P-wave velocity were used to decrease data discreteness. Secondly, the sandstone was heated in the temperature-controlled heating equipment (e.g.muffle furnace) until the target temperatures were reached and cooled to room temperature.Finally,the P-wave velocity and UCS of sandstones after cooling were measured successively.
2.3. Properties of thermal treatment
The properties of thermal treatment in the above studies are listed in Table 2. The thermal stresses induced by high heating or cooling rate(quenching effect)can lead to the premature failure of rocks (McCabe et al., 2007; Gautam et al., 2016). Additionally, the duration at target temperatures can affect the interaction between the heat and the entire volume of the samples(Goudie et al.,1992;Sirdesai et al., 2017). For comparing the different changes of UCS and P-wave velocity conveniently,the cooling treatment of selected previous studies is the same, besides, the thermal treatment properties of certain previous studies (Nos. 2, 5, and 10, Nos. 3, 4,and 8, Nos.13,14, and 15, and Nos.17 and 18) are also the same.
3. Statistical results and analysis
The UCS and P-wave velocity of sandstone obtained in the above-mentioned studies at different temperatures are listed in Tables 3 and 4, respectively. The numbers in the first column of Tables 3 and 4 correspond to those in Tables 1 and 2. In order to facilitate the observation of different laws of sandstone’s UCS and Pwave velocity changing with increasing temperature, the normalized parameters are used, i.e. UCSs and P-wave velocities at different temperatures divided by those at room temperature,respectively.Fig.1 represents the scatter points of normalized UCS and P-wave velocity at different temperatures. The temperatures selected in these studies are different from each other. However,most studies were conducted at room temperature,200°C,400°C,600°C and 800°C, with a few studies lacking data at certain temperatures.Thus,in order to obtain enough data of the UCS and P-wave velocity for observing their evolutions with temperature,the above temperatures were selected.
It can be observed from Fig. 1a that the scatter points of normalized UCS are distributed on either side of the room temperature line, indicating that UCSs at higher temperatures are fluctuating at room temperature.It can be seen from Fig.1b that the scatter points of normalized P-wave velocity are all below the room temperature line, indicating that P-wave velocities at higher temperatures are lower than that at room temperature.

Table 2 Parameters of thermal treatments.

Table 3 UCSs of sandstone samples at different temperatures from the literature.
Fig. 2 presents the graphs of the UCS and P-wave velocity variations according to Fig.1.Three trends for the changes of UCS and Pwave velocity can be detected from Fig. 2:
(1) UCSs and P-wave velocities in the five sources (Fig. 2a) all decrease continuously.
(2) UCSs in the six sources (Fig. 2b) increase initially and then decrease, while the P-wave velocities decrease constantly.
(3) UCSs in the seven sources(Fig.2c)increase initially and then fluctuate,while the P-wave velocities continuously decrease.

Table 4 P-wave velocities of sandstone at different temperatures from the literature.
4. Discussion
According to the variations of normalized UCS and P-wave velocity in the above-mentioned studies,it is found that the changes of the UCS and P-wave velocity of sandstone heated from room temperature to 800°C show three different trends. It should be noted that the increase or decrease of the UCS from room temperature to 200°C ignores the change of the UCS at 100°C relative to that at room temperature. The mechanical behavior of rocks essentially depends on their mineralogy, structure, temperature, and stress history (Homand-Etienne and Houpert, 1989).Moreover,the evolution of microcracks has an important effect on the mechanical behavior of rocks (Hu et al., 2018). The P-wave velocity of rocks is determined based on a complex set of rock properties, such as the mineral compositions, porosity, pore fluid characteristics, and pore structure (Vutukuri and Lama, 1978;Yavuz, 2011; Aquino-López et al., 2015). Based on this, Fig. 3 presents the conceptual graph of the P-wave propagation in rocks. It shows that P-wave propagates mainly through minerals in the rock,but the P-wave velocities of various minerals (including various phases) are different, and the reflection,refraction, and diffraction of P-wave will occur when it reaches the position of cracks, which will increase the actual propagation distance of P-wave traveling.Based on the changes of rock microstructure caused by high temperature and propagation mechanism of elastic wave, the three different trends for the changes of UCS and P-wave velocity are analyzed.
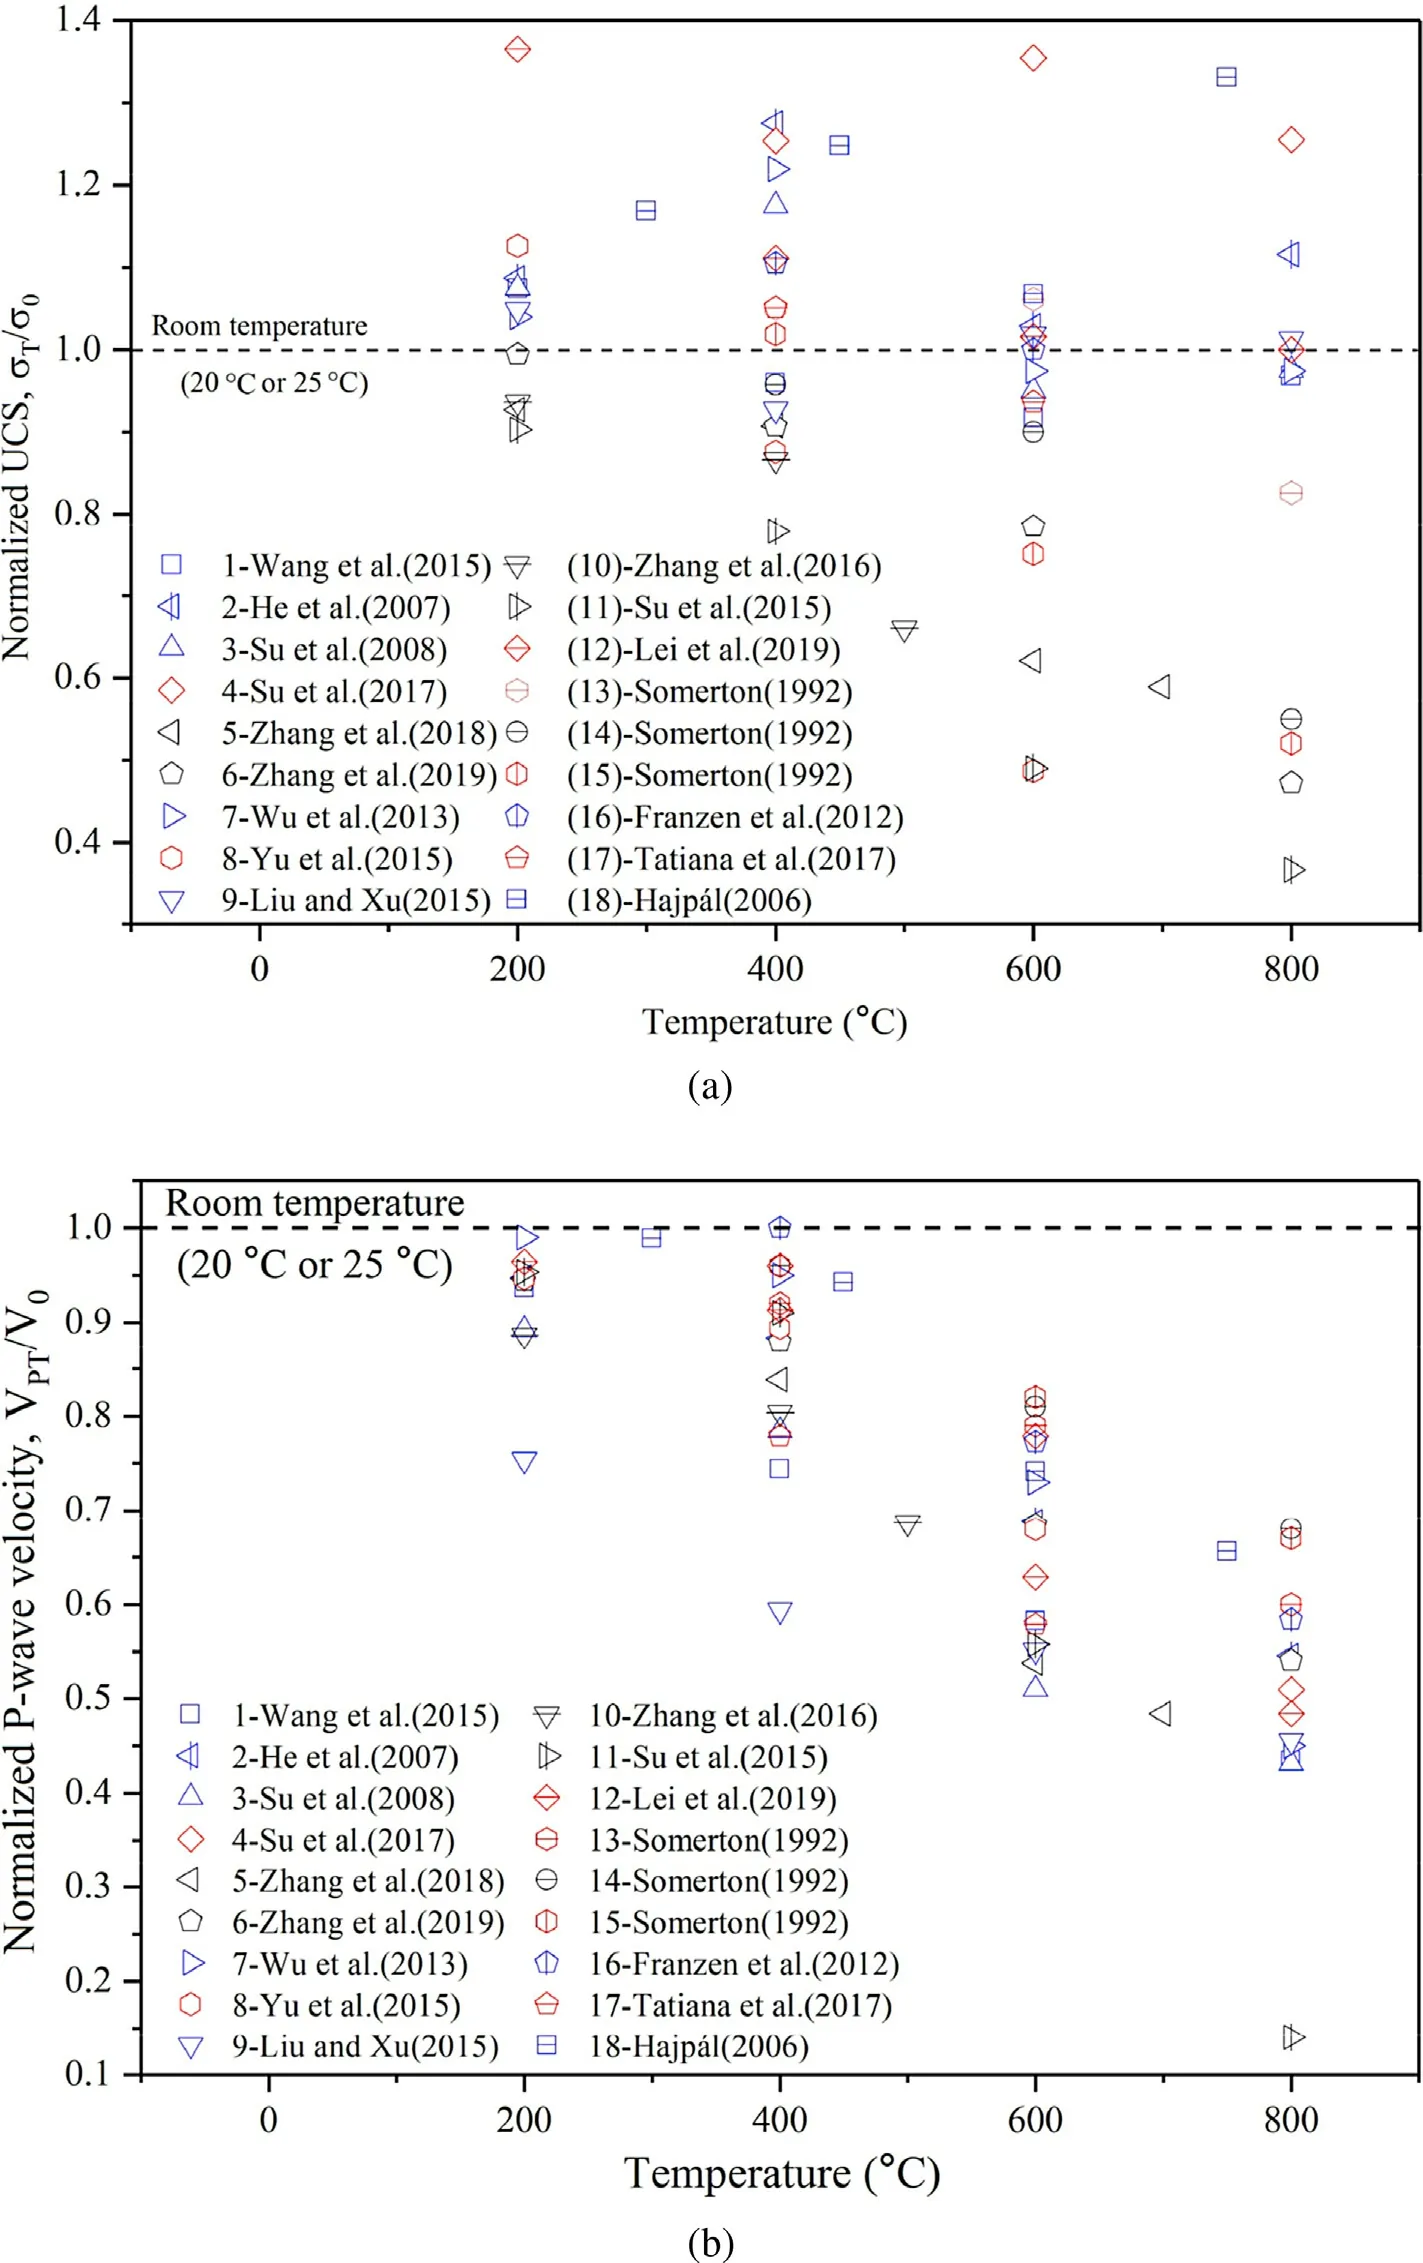
Fig.1. Scattered distribution of normalized UCS and P-wave velocity.
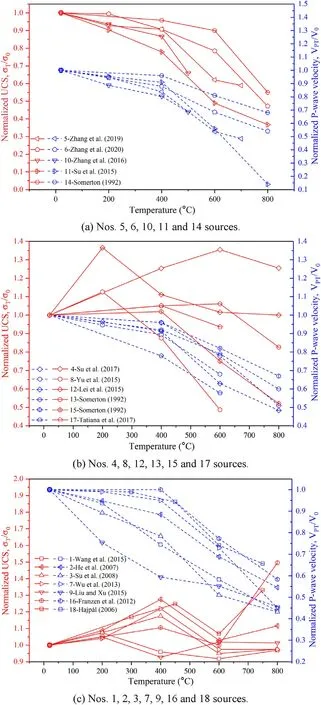
Fig. 2. Variations of normalized UCS and P-wave velocity with temperature.
4.1. The first trend for the changes of UCS and P-wave velocity
All SEM images on the right side of the conceptual graphs shown in Fig. 4 are taken under corresponding heating conditions. We analyzed the influence of temperature on the microstructure deterioration of sandstone using the SEM images at different temperature stages (Shen et al., 2018b)

Fig.3. The conceptual graph of P-wave propagation in rocks.The P-wave that reaches the acoustic detector firstly is the head P-wave.
(1) Room temperature to 400°C
At this stage, the properties of minerals do not change apparently(see Tables 1 and 5),and the water vaporization and thermal expansion of mineral particles are significant which can be confirmed by the mass loss and porosity decrease in Nos.5 and 10 sources. Therefore, as shown in Fig. 4b, the thermal expansion of mineral particles will close the defects (including microcracks caused by water vaporization). However, due to the difference of relative position between particles and defects, there are new intergranular cracks and initial microcracks when no compression is applied after the closure of defects. The uncompressed original microcracks will also extend because of the difference in thermal expansion coefficient of adjacent minerals (Tian et al., 2012;Gautam et al.,2019).Additionally,the loss of crystal water results in damage to the mineral crystal lattice skeleton (Sun et al., 2015).
(2) 400°C to 600°C
Enlarged view of clay minerals in Fig. 4c exhibits the intracrystalline diffusion of hydroxyl created by the dehydroxylation of clay minerals(kaolinite and montmorillonite).This reaction causes the structure of these minerals prone to collapse (Gomez-Heras et al., 2004). After that, the hydroxyl will precipitate in a form of water molecules, and this process breaks the microstructure of minerals(McCabe et al.,2007).More significantly,the color change of quartz in the left graph of Fig.4c represents the α-β transition of quartz at 573°C. The α-β transition of quartz and the associated volume increase lead to creation of fissures in and around a quartz grain (Ranjith et al., 2012). Adjacent microcracks around quartz may become connected. Thermal damage is dominant even if the local plasticity development of certain minerals increases the friction between the dominant minerals (Zhang et al., 2016, 2019;Sirdesai et al., 2019).
(3) 600°C to 800°C
The degree of expansion of rocks also varies upon thermal treatments (Yavuz et al., 2010); therefore, the microcracks will further develop due to the thermal stress caused by the anisotropic expansion (Fig. 4d). For example, intergranular cracks between feldspar and quartz grains develop above 600°C,and the intragranular cracks of feldspar and quartz initiate at 750°C and above (Chakrabarti et al., 1996; Hajpál and Török, 2004). The collapse of calcite structure caused by the initial decomposition of calcite at 700°C (CaCO3→CaO + CO2) is evident and easy to be visualized by the microscope at 750°C (Hajpál and Török, 2004;Török and Hajpál, 2005). Complete disintegration of kaolinite structure occurs at 600°C while illite is still presented(Hajpál and Török, 2004; Kompaníková et al., 2014). Although the thermal cementation can form the cementation and thus enhance the contact between adjacent minerals, the above thermal damages are more severe.
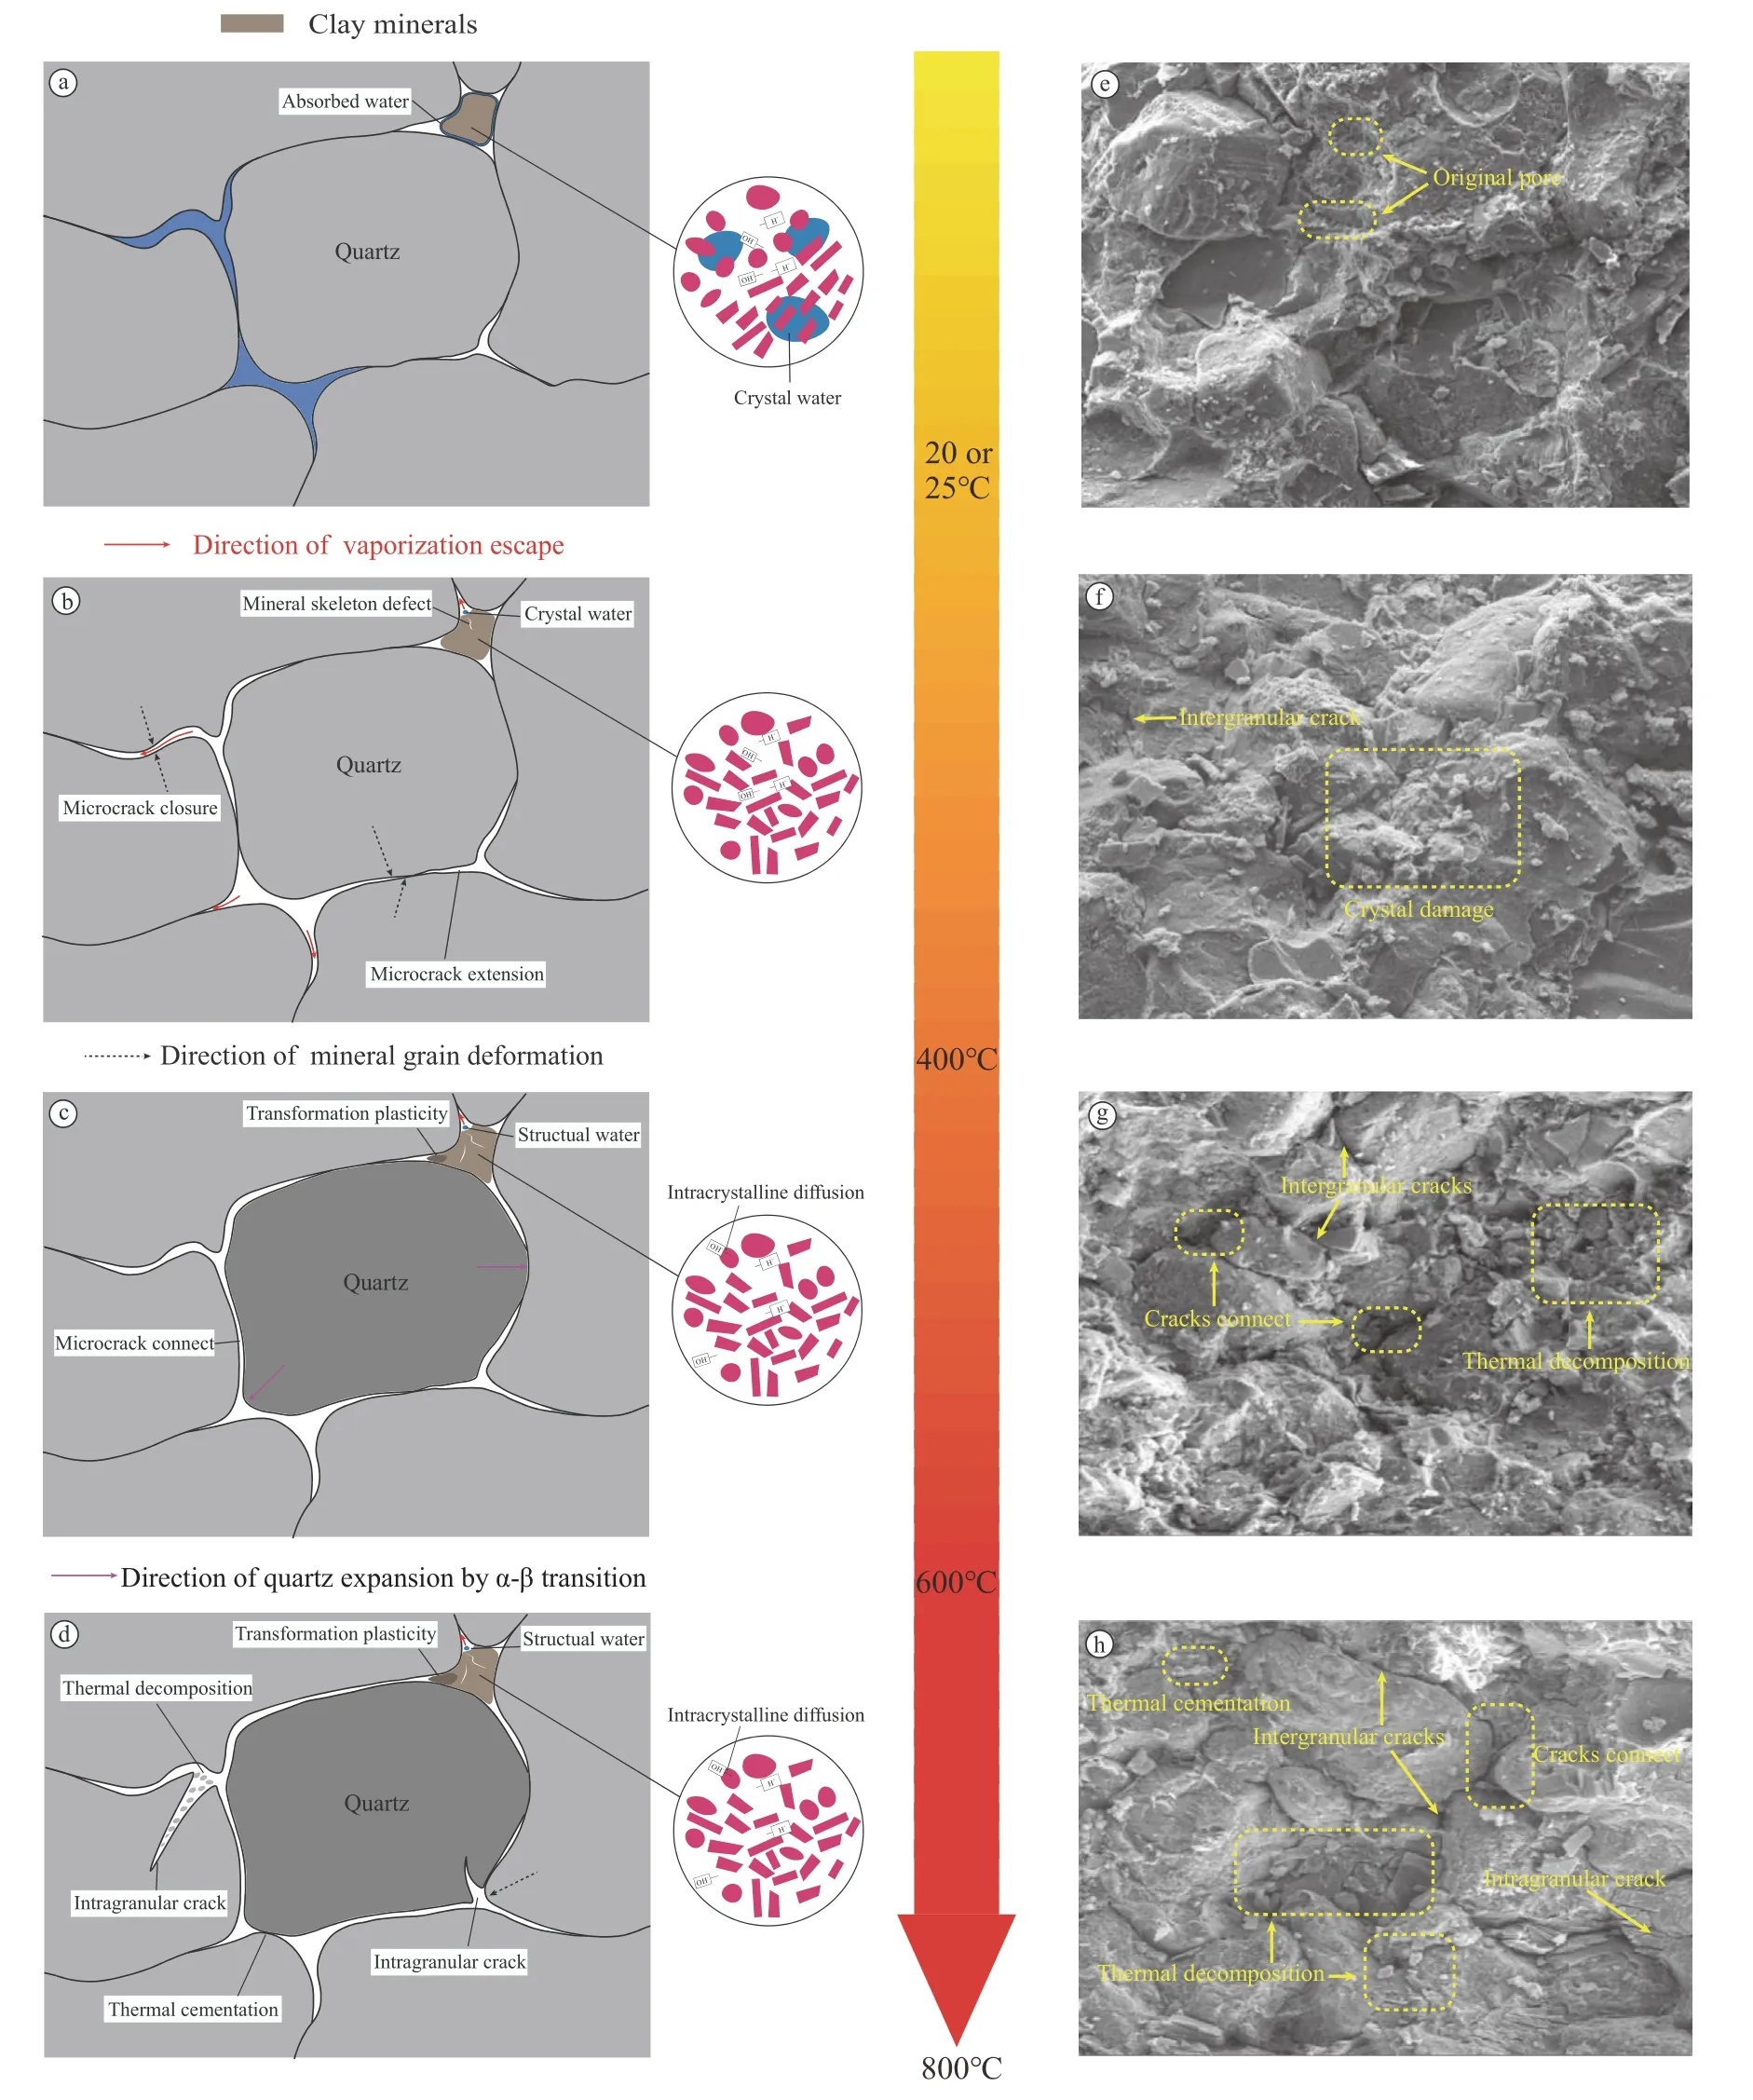
Fig.4. The graphs of thermal treatment process for the first trend of UCS and P-wave velocity changes.(a)-(d)The concept graphs;and(e)-(h)The SEM images(Shen et al.,2018b).
4.2. The second trend for the changes of UCS and P-wave velocity
The SEM images on the right side of the conceptual graphs in Fig.5 are taken under associated heating conditions.Fig.5 presents the changes of rock samples in Nos. 8 and 12 sources and corresponding SEM images which can provide evidence for the conceptual graph. Based on the thermal reaction of sandstone in different temperature ranges (Table 5), thermal treatment properties and changes of mineral contents provided by certain sources,all the changes of UCS and P-wave velocity in the second case can be discussed in a form of conceptual graph.
(1) Room temperature to 200°C
As shown in Fig.5b,the microcracks will extend due to absorbed water vaporization and weak bound water inside the sandstone.However, the defects (including microcracks caused by water vaporization) are still under compression and even disappear due to the particle expansion (Sirdesai et al., 2017; Lei et al., 2019).Meanwhile, water vaporization inside the sandstone is also denoted as the process of liquid-vapor transition. The propagation velocity of elastic waves in the vapor phase is lower than that in the liquid phase. The possible increase of the quartz content resulting from the polymorphic transition of minerals will strengthen the bearing capacity and deformation resistance of samples(Rathnaweera et al., 2018). However, the propagation velocity of elastic waves in pure quartz is relatively low(Goodman,1989).
(2) 200°to 400°C
In Fig. 5c, it shows that the microcracks will extend due to the vaporization of strong bound water and the crystal water inside the sandstone, and the loss of crystal water will cause damage to the mineral crystal lattice skeleton. After the defects close, new intergranular cracks will occur and the uncompressed original microcracks will extend with the development of thermal stress. It is noted that the data in Nos. 4 and 8 sources show the same heat treatment properties,and the increase of quartz content may cause the increase of UCS (Su et al., 2017).
(3) 400°C to 800°C
The uneven cross-section of the crystal in Fig. 5d confirms the transformation plasticity (plastic deformation accommodated by changes in minerals or monomineralic phase transitions). The transformation plasticity of muscovite, illite, and montmorillonite has a positive effect on the UCS(Ranjith et al.,2012;Liu et al.,2016;Zhang et al., 2019). The thermal cementation of temperaturesensitive minerals can produce the cementation and thus enhance the strength of rock. However, the following thermal damages are more intense: (i) The intragranular cracks will occur due to thermal decomposition of calcite (see Tables 1 and 5); (ii)The dehydroxylation of clay minerals will cause damages to the crystal skeleton;and(iii)Adjacent microcracks may connect under the squeezing action of the adjacent particles caused by the volumetric expansion of quartz and feldspar(Kompaníková et al.,2014).It is noted that the thermal treatment properties of Nos. 4 and 13 sources are the same as those of Nos. 3, 8 and 15, but the clayey mineral contents of Nos.4 and 13 sources are higher than those of Nos.3,8 and 15.The increase of the UCS at 400°C-600°C may be related to the transformation plasticity of clayey minerals.
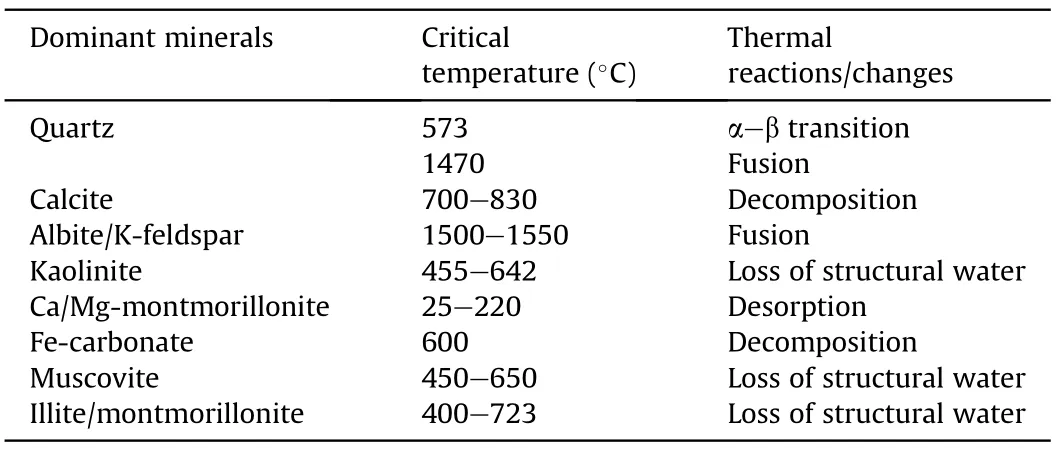
Table 5 Key thermal reactions occurring in sandstone(Somerton,1992; Liu et al., 2016).
4.3. The third trend for the changes of UCS and P-wave velocity
The SEM images on the right side of the conceptual graphs in Fig.6 are also taken under corresponding heating conditions.Fig.6 shows the changes of Nos.2,3,7,16 and 18 sources.Because there are no SEM images in the sources consistent with the third case,the SEM images in Fig.6 are obtained from different previous sources.The aim of these SEM images is only to provide support for the existence of thermal reactions in the conceptual graph.
(1) Room temperature to 400°C
Comparing Figs.4b and 6b,due to the difference of the relative position between mineral particles and microcracks, the microcracks in Fig.6b are under compression and even disappear under the action of mineral thermal expansion. After that, there are no new intergranular cracks and extension of original microcracks.The water vaporization and the compression of defects can both lead to the increase of UCS. Nevertheless, the loss of water can result in a decline of P-wave velocity.
(2) 400°C to 600°C
Fig. 6c shows that the volumetric expansions of quartz due to the α-β transition at 573°C,and the dehydroxylation of muscovite,kaolinite, illite, and montmorillonite above 400°C, are all able to reduce the UCS and P-wave velocity. Although the transformation plasticity of the clay minerals and muscovite has a positive effect on the UCS, the thermal damage is more intense.
(3) 600°C to 800°C
According to Fig. 6d, temperature-sensitive minerals are transformed to form the cementation and thus improve the contact condition between particles (Su et al., 2008; Gautam et al., 2016).The phenomenon that temperature-sensitive minerals melt to form the cementation is defined as the thermal cementation. Some studies (e.g. Bernard et al., 2004; Seiferlin et al., 2007; Su et al.,2008; Tian et al., 2014) also support this viewpoint that thermal cementation phenomenon exists in the heated sandstone. Therefore,the different features of UCS at 600°C-800°C are the results of balance between the thermal damage and thermal cementation.When the thermal cementation is dominant over the thermal damage,the UCS will increase.In addition,these minerals undergo a transition from crystalline to amorphous (Kompaníková et al.,2014), and the elastic wave propagation velocity in the solid phase is greater than that in the liquid phase.
5. Conclusions
Using the normalized UCS and P-wave velocity of sandstone at different temperatures in the literature and based on the changes of rock microstructures under thermal reaction, different trends for the changes of UCS and P-wave velocity of sandstone after thermal treatment are analyzed.The following conclusions can be drawn:

Fig.5. The graphs of thermal treatment process for the second trend of UCS and P-wave velocity changes.(a)-(d)The concept graphs;and(e)-(h)The SEM images(Lei et al.,2019).
(1) There are three different relationships between the UCS and P-wave velocity of sandstone when heated from room temperature to 800°C: (i) Both the UCS and P-wave velocity decrease simultaneously; (ii) The UCS increases below the temperature of 600°C and then decreases, yet the P-wave velocity decreases continuously; (iii) The UCS increases below the temperature of 400°C and then fluctuates, while the P-wave velocity continuously decreases.

Fig.6. The graphs of thermal treatment process for the third trend of UCS and P-wave velocity changes.(a)-(d)The concept graphs;and(e)-(h)The SEM images(Sun et al.,2016;Lei et al., 2019).
(2) The main reasons for these three changes of UCS are as follows: (i) the discrepancy of microstructure characteristics(especially the relative position between the mineral particles and defects) and the content of quartz from room temperature to 400°C; (ii) the transformation plasticity of clay minerals from 400°C to 600°C;and(iii)the balance between the thermal cementation and thermal damage from 600°C to 800°C.
(3) Focusing on the distortion phenomenon of the second and third trends for the changes of UCS and P-wave velocity,it is not rational to use the P-wave velocity to reflect the UCS change directly.The inconsistency in the trends of UCS and Pwave velocity changes is caused by the factors such as water vaporization, increase of quartz contents, and thermal cementation of temperature-sensitive minerals.
Declaration of competing interest
The authors wish to confirm that there are no known conflicts of interest associated with this publication, and there has been no significant financial support for this work that could have influenced its outcome.
Acknowledgments
This work was supported by the National Natural Science Foundation of China(Grant No.41772333),the program of State Key Laboratory of Frozen Soil Engineering (Grant No. SKLFSE201713),and the Shaanxi Province New-Star Talents Promotion Project of Science and Technology (Grant No.2019KJXX-049).
 Journal of Rock Mechanics and Geotechnical Engineering2021年1期
- Journal of Rock Mechanics and Geotechnical Engineering的其它文章
- Monitoring lime and cement improvement using spectral induced polarization and bender element techniques
- Predicting uniaxial compressive strength of serpentinites through physical, dynamic and mechanical properties using neural networks
- Axial response and material efficiency of tapered helical piles
- Improved prediction of slope stability using a hybrid stacking ensemble method based on finite element analysis and field data
- Rock brittleness indices and their applications to different fields of rock engineering: A review
- Application of artificial intelligence to rock mechanics: An overview
