Rock brittleness indices and their applications to different fields of rock engineering: A review
Fanzhen Meng, Louis Ngai Yuen Wong, Hui Zhou
a College of Science, Qingdao University of Technology, Qingdao, 266033, China
b Department of Earth Sciences, The University of Hong Kong, Pokfulam, Hong Kong, China
c State Key Laboratory of Geomechanics and Geotechnical Engineering,Institute of Rock and Soil Mechanics,Chinese Academy of Sciences, Wuhan,430071,China
Keywords: Rock brittleness Practical applicability Hydraulic fracturing Rockburst proneness Crack propagation Fragmentation efficiency
ABSTRACT Brittleness is an important parameter controlling the mechanical behavior and failure characteristics of rocks under loading and unloading conditions, such as fracability, cutability, drillability and rockburst proneness. As such, it is of high practical value to correctly evaluate rock brittleness. However, the definition and measurement method of rock brittleness have been very diverse and not yet been standardized.In this paper,the definitions of rock brittleness are firstly reviewed,and several representative definitions of rock brittleness are identified and briefly discussed. The development and role of rock brittleness in different fields of rock engineering are also studied. Eighty brittleness indices publicly available in rock mechanics literature are compiled, and the measurement method, applicability and limitations of some indices are discussed. The results show that (1) the large number of brittleness indices and brittleness definitions is attributed to the different foci on the rock behavior when it breaks;(2) indices developed in one field usually are not directly applicable to other fields; and (3) the term“brittleness” is sometimes misused, and many empirically-obtained brittleness indices, which lack theoretical basis, fail to truly reflect rock brittleness. On the basis of this review, three measurement methods are identified, i.e. (1) elastic deformation before fracture, (2) shape of post-peak stress-strain curves, and (3) methods based on fracture mechanics theory, which have the potential to be further refined and unified to become the standard measurement methods of rock brittleness. It is highly beneficial for the rock mechanics community to develop a robust definition of rock brittleness.This study will undoubtedly provide a comprehensive timely reference for selecting an appropriate brittleness index for their applications,and will also pave the way for the development of a standard definition and measurement method of rock brittleness in the long term.
1. Introduction
Rock brittleness is a key parameter determining the failure characteristics of rocks upon loading and unloading conditions. A number of mechanical responses and failure processes of rocks,such as cutability and drillability associated with rock excavation(Blindheim and Bruland, 1998; Altindag, 2002, 2003; Kahraman,2002; Kahraman et al., 2003; Gong and Zhao, 2007; Yagiz, 2008,2009; Dursun and Gokay, 2016; Liu et al., 2016), fracability during hydraulic fracturing (Jarvie et al., 2007; Rickman et al., 2008; Jin et al., 2014a, b; Guo et al., 2015a; Kim et al., 2017; Xia et al.,2017), and rockburst proneness in deep hard rock tunnels (Wang and Park, 2001; Hajiabdolmajid and Kaiser, 2003; Tarasov and Potvin, 2013; Meng et al., 2015; Gong et al., 2019a), are inherently influenced by rock brittleness to different extents. Correct evaluation of rock brittleness is crucial for the safe design and selection of excavation and mining machineries, efficient stimulation of unconventional shale gas reservoir,and proper stability assessment of deep hard rock tunnels.
Over the past 50 years, dozens of rock brittleness indices have been developed (Hucka and Das,1974;Andreev,1995;Meng et al.,2015;Zhang et al.,2016).Despite the widespread use of brittleness indices in different fields of rock engineering, both the definition and measurement method of rock brittleness have been significantly differed and not yet been standardized, and most of the indices were proposed to cater for specific fields of application.Their applicability to other fields is often not sufficiently evaluated and thus remains questionable. Given the variety of brittleness definitions and indices and the important role of rock brittleness in deep rock engineering and exploitation of unconventional resources, it is instrumental to comprehensively summarize and evaluate the applicability and limitations of the various brittleness indices available in the literature. In this study, the definitions of rock brittleness are first reviewed and briefly discussed, and the role of rock brittleness in different fields of rock engineering is studied. Afterwards, eighty brittleness indices are compiled based on a comprehensive review of rock mechanics literature, and the applicability of some indices is also discussed.
2. Definition of rock brittleness
The first question we have to address is “what is brittleness?”.The word“brittleness”is not provided in the Cambridge Dictionary and Oxford Living Dictionaries,but the word“brittle”is explained.Brittle (adj) is stated as “delicate and easily broken” and “hard but liable to break easily”respectively in these two dictionaries.In the
Dictionary of Geological Terms (Bates and Jackson,1984) and Glossary of Geology(Neuendorf et al.,2005),a rock that fractures at less than 3%-5% deformation or strain is explained as brittle, and brittleness is explained by Bates and Jackson(1984)as a property of solid material that ruptures easily with little or no ductile deformation. Notice that the strength of the rock is not taken into account in the above definitions. In The Concise Oxford Dictionary of Earth Sciences(Allaby and Allaby,1990),minerals such as pyrite and fluorite crumble easily and are said to be “brittle”, and the “brittle behavior”is explained as a manner in which competent rocks lose their internal cohesion along certain surfaces when the elastic limit is exceeded under stress. According to this definition, one prerequisite of being “brittle” is the rock has to be “competent”.
The definition of brittleness from some rock mechanics related textbooks and research papers is also searched. Hetenyi (1966),Obert and Duvall(1967),Bates and Jackson(1984),Andreev(1995)and Yilmaz et al.(2009)defined material brittleness as the ability to fracture without appreciable permanent deformation in the tension or compression test (Fig.1). The statements put forward by Mogi(1966), Hoek and Brown (1980), Brady and Brown (2005),Paterson and Wong(2005)and Jaeger et al.(2007)on“brittle”are similar, although “brittleness” is not defined by them. Brittle fracture or brittle failure is used by them to qualitatively describe the post-peak failure process (i.e. brittle-ductile transition) of rock in the compression test (Fig.1). Brittle failure is considered to occur when the ability of the rock to resist load decreases with increasing deformation, and ductile behavior of rock is characterized by increase of compressive strength with increasing strain in the compression test. Ramsay (1967) and Allaby and Allaby (1990)related the “brittle” or “brittle behavior” of rock to the loss of its internal cohesion in the elastic range under loading. Reichmuth(1967) and Lawn and Marshall (1979) defined brittleness as the ease of crack propagation, while Dollinger et al. (1998) defined brittleness as the ease at which the rock forms chips during indentation.Lawn and Marshall(1979)called brittleness one of the most elusive mechanical properties, which measures the competition between deformation (residual or plastic impression) and fracture under indentation.
As shown above, the term “brittle” or “brittleness” is often qualitatively used to describe the response and behavior of rocks under different loading conditions (tension, compression, or indentation). However, the definition of brittleness is highly ambiguous and controversial. Researchers usually define rock brittleness based on the extent of rock deformation and failure characteristics, which leads to the development of numerous different brittleness indices. Rock material is quite different from other common construction materials such as metal,ceramics and glass, and it is characterized by pronounced anisotropy and inhomogeneity. Whether those brittleness definitions originally developed for metal or ceramics (Hetenyi, 1966; Lawn and Marshall, 1979) are applicable to rock is debatable. Therefore, a unified and robust definition of rock brittleness that considers the characteristics of rock is required.

Fig. 1. Brittle and ductile behavior of material under tension (the left half) and compression (the right half) loading conditions. The right part shows the brittle and ductile behavior of trachyte under different confining pressures (modified from Mogi(1966)).
3. Role of rock brittleness in different fields of rock engineering
Rock brittleness is an important parameter that significantly influences the intended or unintended rock failure process in mining, tunneling and drilling operations. In hard rock tunnels,brittle failure of surrounding rocks in the form of spalling and rockburst frequently occurs under high geo-stresses(Martin et al.,1999; Corkum et al., 2012; Zhang et al., 2012; Zhou et al., 2015;Meng et al.,2016).A great amount of strain energy is accumulated in the surrounding rocks after excavation, and the small deformation of brittle rock only consumes little energy. Most of the strain energy transforms into kinetic energy of rock blocks when a rockburst occurs. On the other hand, large deformation induced by squeezing and creep often takes place in ductile rock, which dissipates almost all the strain energy. Therefore,the rock brittleness is considered as an indicator of the rockburst proneness in deep mines and tunnels (Singh, 1989; Aubertin et al., 1994; Wang and Park, 2001; Zhang and Fu, 2008; Meng et al., 2015; Zhao et al.,2015; Zhang et al., 2017, 2020; Gong et al., 2019b). In this case,proper determination of brittleness is crucial to better predict and mitigate dynamic brittle failure such as rockburst (Hajiabdolmajid and Kaiser, 2003; Tarasov and Potvin, 2013; Meng et al., 2015;Munoz et al., 2016a).
Rock brittleness is also closely related to the efficiency(the term“efficiency”in this study defines the ease to cut,bore or drill a rock,and a higher efficiency suggests less energy is needed to break the rock)of cutting, drilling, sawing and boring process of mechanical excavators such as rippers, road headers and tunnel boring machines (TBMs) during hard rock tunneling and mining (Goktan,1991; Bruland, 1998; Gong and Zhao, 2007; Yagiz, 2008, 2009;Mohammadi et al., 2015; Dursun and Gokay, 2016; Munoz et al.,2016b; Li et al., 2018). In the rock breakage process under TBM rolling cutters,the disc cutter first intrudes into the rock to generate a number of fragments as well as internal cracks(Swain and Lawn,1976; Cook et al.,1984; Pang and Goldsmith,1990). The generated cracks then propagate and coalesce when the cutters rotate,leading to chipping of the rock ridges. A higher proportion of energy is consumed to generate fracture surfaces for rocks with high brittleness, and more crack formation and chipping occur to cutter sides. On the contrary, rocks with low brittleness have less crack formation and chipping,and most of the energy is consumed by the larger inelastic deformation beneath the cutters (Li et al., 2018).Brittle rocks tend to require less energy to bore than non-brittle rocks of comparable strength (Evans and Pomeroy,1966; Bruland,1998; Dollinger et al.,1998; Gong and Zhao, 2007).
During the exploitation of unconventional hydrocarbon resources, hydraulic fracturing is widely employed to increase the permeability and connectivity of the tight shale gas reservoirs characterized by low porosity and low permeability (Guo et al.,2015a; Bai, 2016). Brittleness of the shale formation is one of the key parameters for characterizing and identifying unconventional shale gas reservoirs favorable for hydraulic fracturing(Jarvie et al.,2007;Rickman et al.,2008;Wang and Gale,2009;Jin et al.,2014b;Lai et al.,2015;Zhang et al.,2016).Ductile shale reservoir tends to heal natural or hydraulic fractures, while brittle shale reservoir more likely responds well to hydraulic fracturing treatment to maximize the efficiency of hydraulic fracturing (Rickman et al.,2008; Jin et al., 2014b).
4. Review of rock brittleness indices
Since 1967, dozens of different brittleness indices have been proposed to cater for various applications especially in rock mechanics,eighty of which are summarized in Table A1 in Appendix A.The indices can be roughly categorized into 11 groups based on the parameters or measurement methods involved (for those indices comprising more than one parameter, they are assorted based on the main parameter(s) involved): (1) strength parameters, (2)shape of stress-strain curves, (3) elastic parameters, (4) mineral compositions, (5) conventional well logging, (6) angle of internal friction, (7) force-penetration graphs, (8) indentation tests, (9)content of fines after impact, (10) over-consolidation characteristics, and (11) other indices. In the following sub-sections, the brittleness indices are summarized and reviewed according to the aforementioned 11 groups.
4.1. Brittleness indices(B1 to B13) based on strength parameters (σc and σt)
Index B1, which is probably the simplest brittleness index, is expressed as

where σcand σtare the uniaxial compressive strength (UCS) and Brazilian tensile strength,respectively.Another index(B2),which is also based on the ratio of the two strength parameters,is expressed as

It is generally believed that the higher the values of B1and B2,the more brittle the rock(Hucka and Das,1974;Goktan,1991;Gong and Zhao,2007;Zhang and Fu,2008;Jin et al.,2014a).The two indices are popularly used for the assessment of rock fragmentation efficiency(Singh,1986;Goktan,1991;Gong and Zhao,2007;Mohammadi et al.,2015)and prediction of rockburst possibility(Wang and Park,2001;Zhang and Fu,2008;Adoko et al.,2013;Cai,2016).As σcand σtare the two basic mechanical parameters that can be easily obtained in routine laboratory loading tests, B1and B2are preferred by many researchers and engineers. However, the two indices have the following limitations.First,the physical meaning for the two indices does not reflect the rock fracture process.Second,Fig.2a and b shows that both σtand B1increase with σcof rock,and similar results were also reported by Meng et al. (2015) using different sets of data.Therefore,B1is more suitable to describe the rock strength than its brittleness.Besides,rock with different σcand σtvalues may have the same strength ratio (B1), and the variation range of B1is narrow.Therefore,B1is not a satisfactory brittleness index.

Fig. 2. Variations of (a) Brazilian tensile strength, (b) B1, and (c) B4 with uniaxial compressive strength of different rocks(data compiled from Dursun and Gokay(2016)and Yarali and Soyer (2011)).
The following examples indicate that the use of B1(or B2) has resulted in some contradictory results and conclusions. A number of researchers have investigated the relationship of B1(B2) with cutability, drillability and boreability of rocks. A negative correlation between boreability index(rock mass boreability is expressed by the boreability index, defined as the ratio of the applied thrust per cutter to the penetration per revolution) of rock and B1was reported (Gong and Zhao, 2007, 2009; Zhao et al., 2007), which indicates that a greater rock brittleness leads to a higher rockbreaking efficiency with TBM and other rock-breaking tools.However, the cutting resistance and specific energy (defined as energy consumed per unit volume of excavated material) were found to increase with increasing B1of coal and rock,and negative exponential relationships between the penetration rate of TBM and the brittleness of B1and B2were obtained(Singh,1986;Kahraman,2002;Mohammadi et al.,2015).For the rockburst prediction,Wang and Park (2001) showed that when B1is greater than 40, no rockburst occurs; and when B1is lower than 14.5, violent rockburst occurs,i.e.the lower the B1value,the more intense(or likelihood)the rockburst. However, Zhang and Fu (2008) proposed that rockburst tends to occur when B1of rock is greater than 15.The above two conclusions are obviously contradictory.
Indices B3, B4and B5are expressed as

These three brittleness indices were applied to investigating the relationship between rock brittleness and its drillability,sawability,drilling rate, etc. (Altindag, 2002, 2003, 2010; Yarali and Soyer,2013; Dursun and Gokay, 2016; Özfırat et al., 2016). B4was also used to predict the fracture toughness values (KIC) (Kahraman and Altindag, 2004). According to Altindag (2002, 2003), high B4corresponds to low brittleness of rocks. Various studies have shown that drillability index(kN/m,a lower value indicates higher drilling efficiency), specific energy and fracture toughness of rocks are positively related to B4(Altindag, 2002, 2003; Kahraman and Altindag, 2004), while sawability (measured by hourly production(m2/h) and higher value indicates easier sawing), drilling rate and drilling rate index (DRI, a measure of the ease or difficulty of rock drillability, will be discussed in Section 4.9) decrease with increasing brittleness B4(Gunaydin et al., 2004; Yarali and Kahraman, 2011; Yarali and Soyer, 2013). Those analyses show that more energy is required to drill and bore a rock with higher B4.
Although satisfactory relationships have been established between drillability,specific energy,DRI and B3to B5,these brittleness indices share similar limitations to B1and B2.Besides,Fig.2c shows that B4increases nonlinearly with σcof rock with a high correlation,which implies that B4describes rock strength characteristics rather than brittleness.
The brittleness indices B6to B9were developed by linear fitting or regression analysis. They are expressed as


where ρ and γ are the density and unit weight of the rock,respectively. The drive to develop the above four empirical brittleness indices is to predict the brittleness index B66which is determined by penetration test(Yagiz,2009;Yagiz and Gokceoglu,2010;Khandelwal et al.,2017)(B66will be discussed in Section 4.7).Fig.3a and b shows the relationship between B6,B7and B66.There is no physical meaning and theoretical basis for these indices.Besides,these indices are based on the assumption that the rock brittleness can be well represented by B66.As will be discussed in Section 4.7,B66reflects the rock strength, rather than brittleness. As such, the applicability of these brittleness indices is doubtful.
Brittleness index B10was proposed by Nejati and Moosavi(2017), which is expressed as


Fig. 3. Relationship between (a) B6 and B66 (modified from Yagiz (2009)), and (b) B7 and B66 (modified from Yagiz and Gokceoglu (2010)).
where E is the elastic modulus of rock. This index was used to estimate mode I and mode II fracture toughness of rock,and positive linear relationships between B10and mode I, mode II fracture toughness were established (Fig. 4a and b). This index has no physical meaning, and its positive relation with the fracture toughness is also ambivalent towards the brittleness definitions as discussed in Section 2(fracture toughness describes the ability of a material to resist fracture(Lawn and Marshall,1979)).Besides,as B4is also positively related to fracture toughness (Fig. 4c) and B4reflects rock strength (Fig. 2c), B10also reflects rock strength like B4.
Brittleness index B11, which was developed by Dursun and Gokay (2016) using multiple linear regression analysis, is in the form of


Fig. 4. Relationships between (a) B10 and mode I rock fracture toughness KIC, (b) B10 and mode II rock fracture toughness KIIC, and (c) B4 and mode II rock fracture toughness KIIC (modified from Nejati and Moosavi (2017)).
where PLS is the point load strength of rock.This index was used to estimate specific energy during rock cutting, and a positive linear relation was found between B11and B74(Fig. 5). As B74decreases with increasing σcof rock and it cannot represent rock brittleness properly (see Section 4.9 for more details), neither does B11.
Tarokh et al. (2016) treated brittleness as a structural response rather than a material property, and proposed B12(brittleness in compression)and B13(brittleness in tension)as

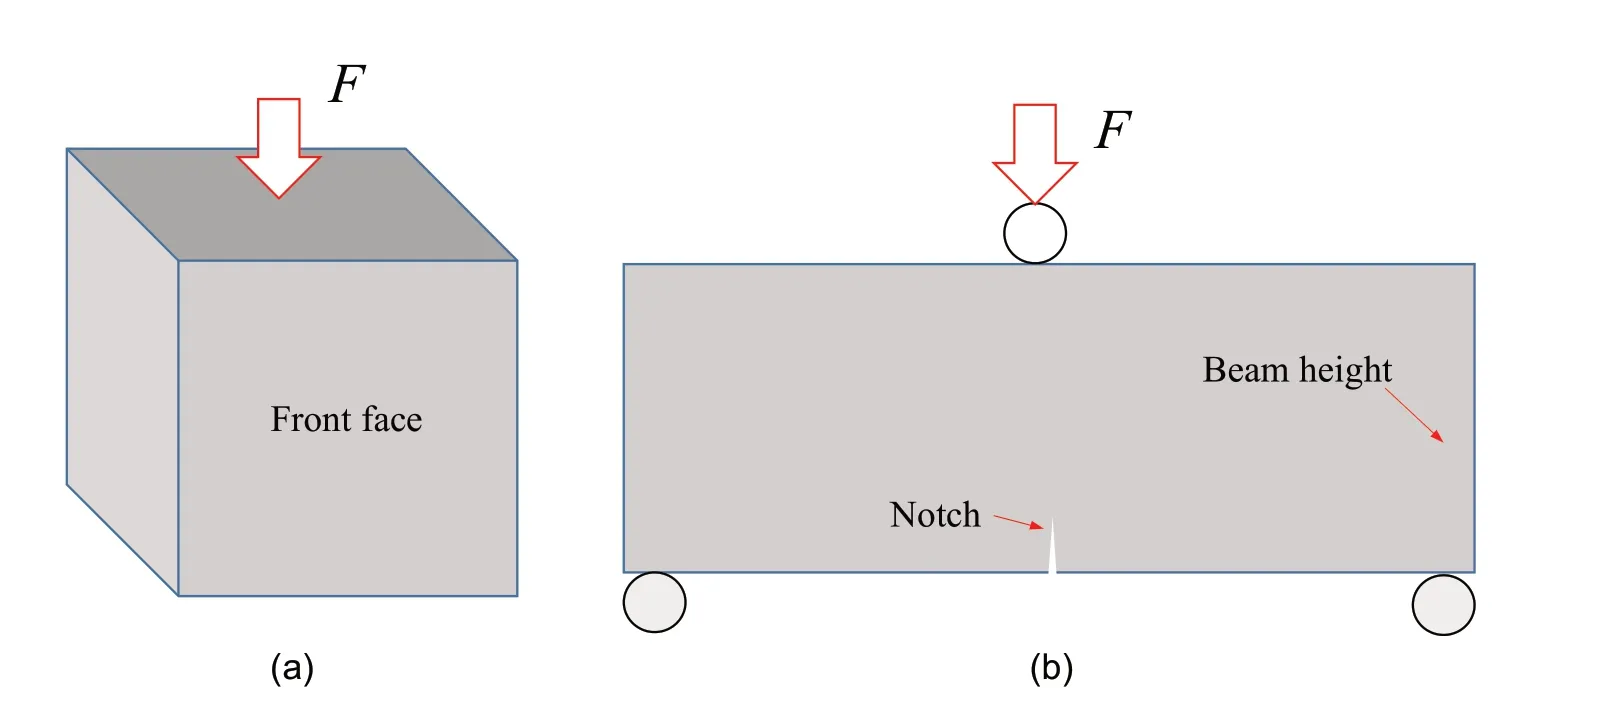
where SIPS and D are the surface instability peak stress(i.e.the axial stress when the first sign of surface spalling occurs),and structure size parameter(e.g.beam height),respectively.B12is measured by surface instability test (uniaxial compression test using cubic specimen with one side exposed and the other sides constrained)(Fig.6a).For highly brittle rock,B12is close to one;for ductile rock,it approaches zero. B13is measured by three-point bending test(Fig.6b),and is relatively small for the perfect-ductile material and very large for the ideal-brittle material. Based on B13, rock brittleness during tension is size-dependent, and increases with beam size (Tarokh et al., 2016).
The above analyses show that there is no significant physical meaning for those indices based on the combination of σcand σt,and no direct correlation between these indices(such as B1to B11)and rock fracture either. Most of the above-mentioned brittleness indices(e.g.B1to B10)reflect rock strength.Besides,the influence of stress state on rock brittleness cannot be considered by these indices (e.g. B1to B13).
4.2. Brittleness indices (B14 to B40) based on compression stressstrain curves
As the stress-strain curves obtained by loading rocks are the most intuitive reflection of rock property, a majority of brittleness indices(B14to B40)have been developed based on the shape of the uniaxial and triaxial compressive stress-strain curves. The deformation, stress and energy picked or calculated from pre- or postpeak stress-strain curves are often used to denote the rock brittleness under uniaxial or triaxial compressive stress condition.
B14to B17are closely related to the strain before peak strength as

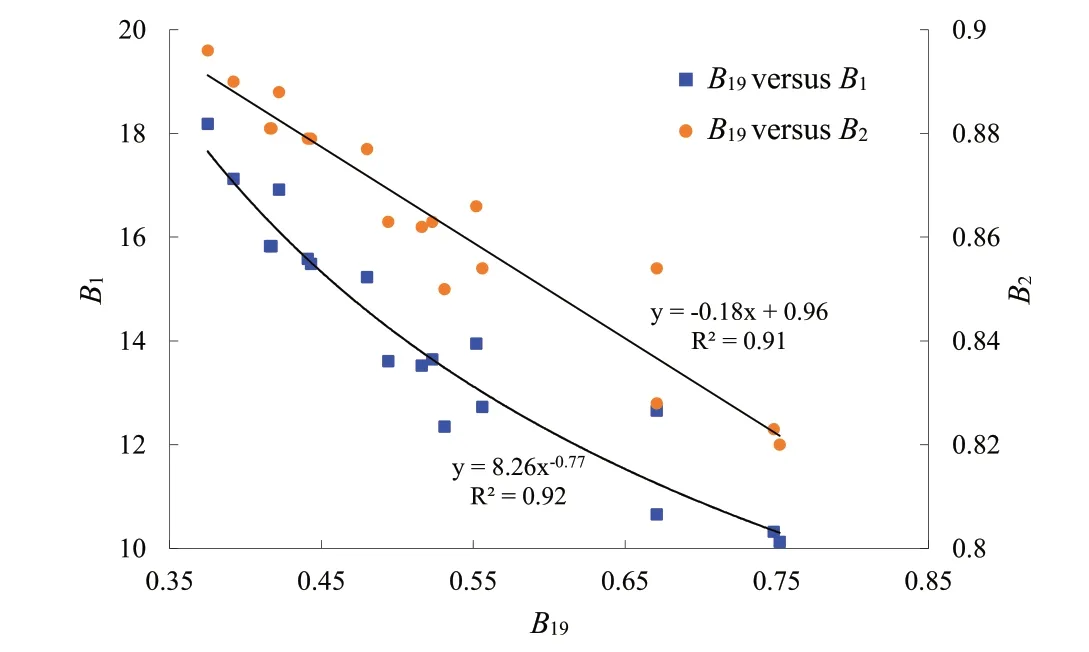
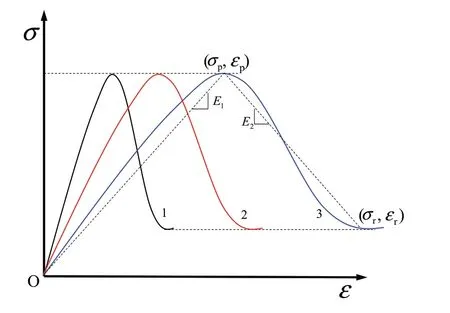
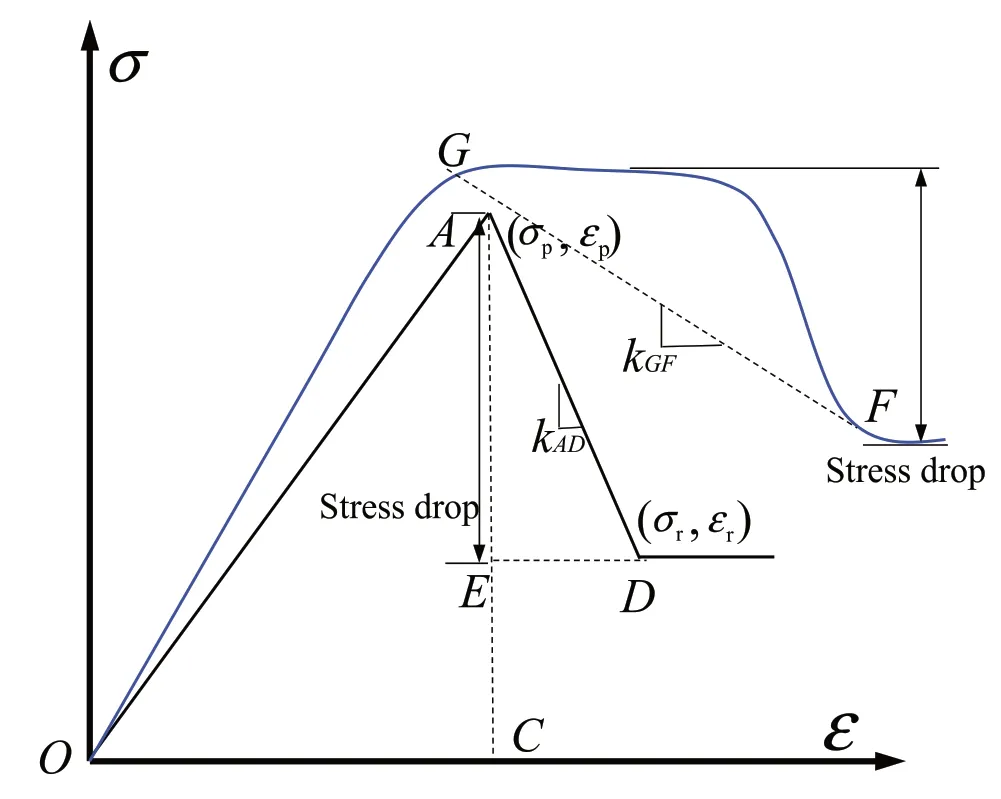
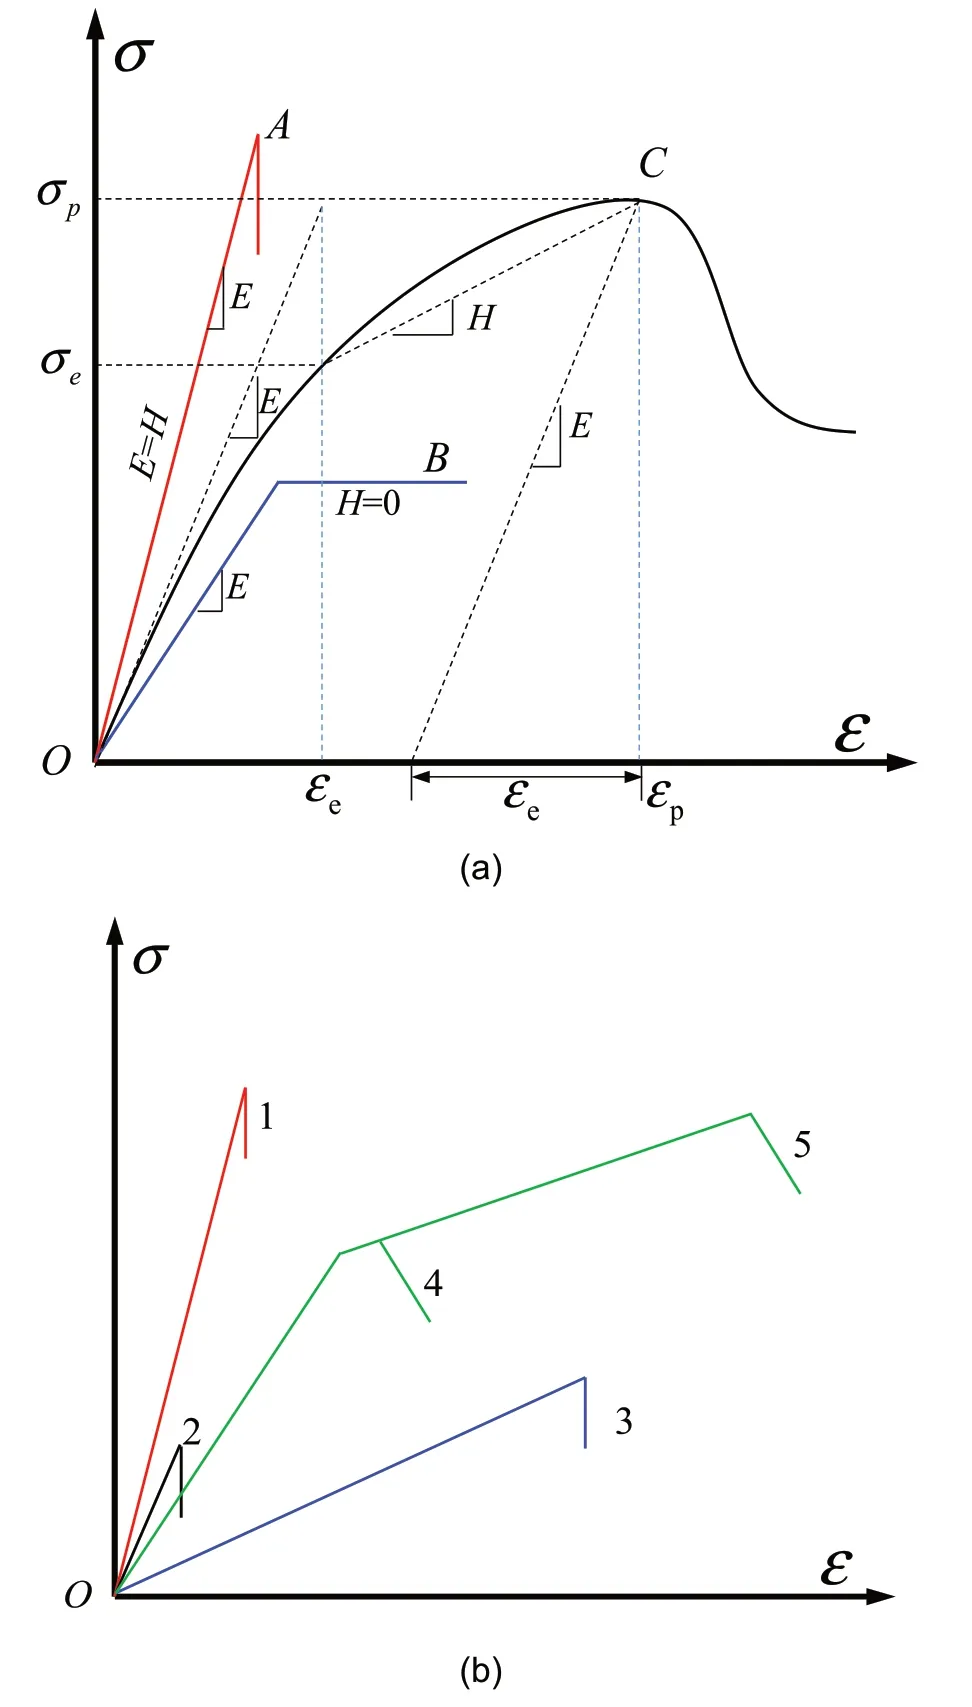
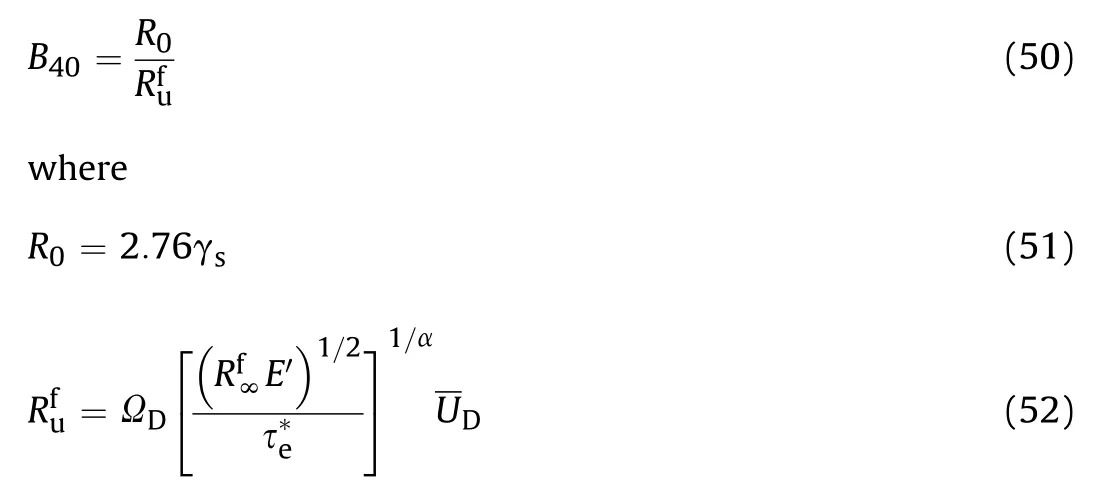
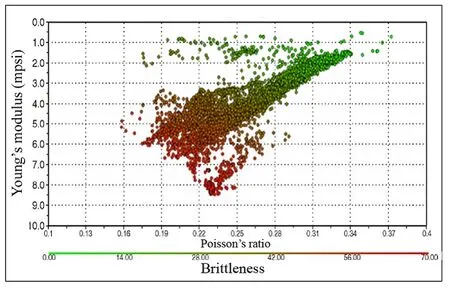
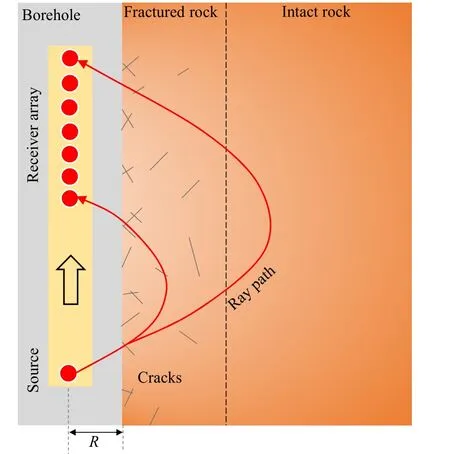
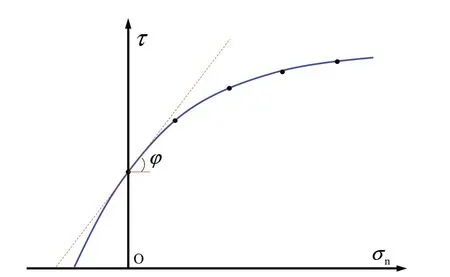
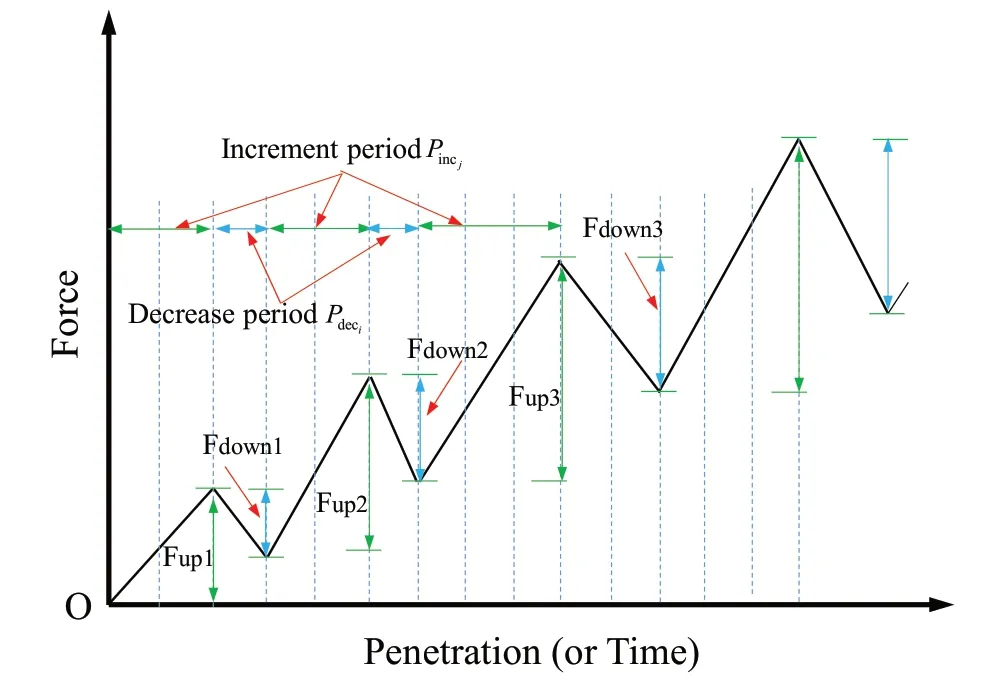
where εpand εeare the peak strain and elastic strain at peak strength, respectively; and ε1iis the absolute irreversible longitudinal (parallel to σ1) strain until failure (Fig. 7). B14was used to determine the brittleness of shale (Liang et al., 2017), and five grades of brittleness were classified:extreme brittleness(B14>40),high brittleness (30 < B14< 40), brittle (20 < B14< 30), middle brittleness(10 Fig. 5. Relationship between B11 and B74 (modified from Dursun and Gokay (2016)). B15, B16and B17all emphasize the role of elastic strain prior to peak strength in determining rock brittleness. According to Andreev (1995), the rock is considered brittle when B15< 3%, and ductile when B15> 5%. The ratio of reversible or elastic strain to total strain at fracture is taken as a brittleness index (B16) considering that most of the strain can be reversible for brittle rock,while large amount of inelastic deformation occurs for ductile rock(Hucka and Das,1974). B17was developed based on the consideration that a smaller value of elastic strain indicates a higher brittleness (Gong and Sun, 2015). However, B17cannot reflect rock brittleness properly because the small elastic strain may be accompanied by a very large amount of irreversible strain, which indicates a highly ductile characteristic of rock.Besides, unloading test should be conducted to measure the elastic/inelastic strain before peak strength. The choice of unloading point has a great influence on determination of the two strains.The irreversible axial strain will be underestimated if the unloading point is far away from the point of peak strength. B18is a strain-dependent brittleness index, and is expressed as B19is defined as the ratio of crack initiation stress to UCS of rock in the form of Fig.6. Test method for(a)B12 and(b)B13(modified from Tarokh et al.(2016)).In the surface instability test of(a),the five surfaces of the cubic specimen are constrained except the front face; and in the three-point bending test of (b), a notch with width of 1 mm and length of 20% of the beam height is prefabricated. Fig. 7. Stress and deformation used in brittleness indices B14 to B17, and B27 to B29. where σciis the crack initiation stress (i.e. the stress when the lateral strain curve starts to deviate from linear trend). This index correlates rock brittleness with the crack initiation of rock in the uniaxial compression,and strong relationships of B1and B2with B19were discovered (Fig. 9). As discussed in Section 4.1, B1and B2cannot truly reflect rock brittleness, neither does B19. Besides, the accurate determination of crack initiation stress is often difficult which will limit the widespread use of this index.Stress state such as confining pressure is not taken into consideration by this index. Using the relative stress drop in the post-peak stress-strain curve to assess rock brittleness was pioneered by Bishop (1967)who proposed B20as follows: where τpand τrare the peak and residual strengths,respectively,in the compression test(Fig.10).This index was used by the author to characterize the susceptibility of the soil to progressive failure or to flow. However, this index only considers the magnitude of the stress drop,while the rate at which the strength decreases from the peak to the residual strength is ignored(in Fig.10,curves OAB and OCD have the same B20but obviously different brittleness values). Fig. 8. Schematic diagram of cohesion-loss and frictional strengthening as a function of plastic strain (modified from Hajiabdolmajid and Kaiser (2003)). Although B20has limitations,it paves the way for quantitatively evaluating the rock brittleness in the compression test by taking the post-peak stress-strain curve into consideration. On the basis of B20, a number of more elaborate brittleness indices (B21to B24)were proposed. Brittleness index B21consists of two parts: Fig. 9. Relationships of B1 and B2 with B19 (re-plotted with the data in Wang et al.(2014)). Fig.10. Two stress-strain curves with the same post-peak stress drop value but with different stress decrease rates. Fig.11. Schematic diagram of parameters needed for calculation of brittleness index B21 (curves 1, 2 and 3 have the same ratio of E2/E1). where εmand εnare respectively the maximum and minimum peak strains of all the tested rock specimens statistically;and α,β and η are the coefficients; and σp, σrand εrare the peak stress, residual stress and residual strain, respectively (Fig.11). Bareflects the influence of pre-peak deformation (i.e. peak strain) on the rock brittleness,while Bbshows the contribution of post-peak response to the rock brittleness(Li et al.,2012).The index was developed to determine the brittleness of shale. This index suffers from several limitations.First,the calculation formula shows that both Baand B21increase with peak strain. However, a larger peak strain does not necessarily indicate a higher brittleness(in Fig.11,rock with curve 1 is more brittle than the rock with curve 3).Besides,cs in Bbcan be transformed into the following formula: where E1and E2are the secant modulus and post-peak modulus,respectively. Rocks with different brittleness values may have the same ratio of modulus(E2/E1may be the same for the three curves in Fig.11, but they have different brittleness values). Additionally,the three coefficients required to obtain Bbhave not been clearly illustrated and given when different rocks are tested. Similar to B21, B22is also composed of two parts: where BPOSTreflects the stress decrease rate after peak stress,while BEis the ratio of elastic energy released(SAED,which corresponds to the area of AED in Fig.12) during failure to the total energy stored(SOAC)before the peak strength.The index was used to evaluate the brittleness of oil reservoir specimen (Xia et al., 2017). In B22, BPOSThas the same unit as stress,and can be in the range of 0 to infinity,and dimensionless BEranges from 0 to 1.Mathematically speaking,problem arises when the two parts with different units are added up. Besides, the role of BEin contributing to B22will be unreasonably ignored if the value of BPOSTis much greater than 1. B23and B24also consider the post-peak behavior of rock in the compression test,and are expressed as where kAD(GF)is the stress decrease rate after peak strength,which is calculated by the slope of the post-peak stress-strain curve, i.e.kADor kGFfor curves OAD and OGF,respectively,as shown in Fig.12.The large ductile deformation around peak strength in the stressstrain curve (e.g. curve OGF in Fig.12) under high confining pressure indicates a reduction of brittleness and enhancement of ductility, thus the stress drop rate was calculated from the initial yielding point(point G)in the stress-strain curve(kGF).The brittle failure intensity (B24), which is associated with the energy release when failure occurs, can be determined by incorporating the absolute stress drop and stress drop rate. The two indices were used to evaluate rockburst proneness and effectiveness of different reinforcement measures in preventing and controlling dynamic rockburst (Meng et al., 2015). The UCS of brittle rock can be obtained by the following constitutive equation considering the heterogeneity of rock (Chen et al., 2006): Fig.12. Schematic diagram of parameters needed for calculation of brittleness index B21 to B24(point G denotes the initial yielding point)(modified from Meng et al.,2015). where σ and ε are the stress and strain, respectively; ε0is a scale parameter; and m is the homogeneity index. The first-order derivative of Eq.(29)is equal to zero at the peak stress,and then the homogeneity index m can be derived as (Chen et al., 2006): where Esis the secant modulus. The uniaxial compressive stressstrain curve of the rock specimen associated with a higher m has a sharper post-peak shape (Fig. 13), thus the rock is considered more brittle and is more likely to fracture fully. Therefore, Wang et al. (2016) introduced the homogeneity parameter m as brittleness index (B25) of shale: As the UCS of rock generally increases with homogeneity(Villeneuve et al., 2011; Peng et al., 2017), B25in fact reflects the strength characteristic of rock.Weak rock does not always possess low brittleness since strength and brittleness of rock are not conceptually identical (Dollinger et al.,1998; Bai, 2016). The ratio of hardening modulus H to the Young’s modulus E is defined as B26: Fig.13. Stress-strain curves of rocks with different heterogeneities(Chen et al.,2006). where σeis the elastic stress (Rybacki et al., 2016, see Fig. 14a).Based on the deformation behavior of brittle and ductile rock,B26=1 corresponds to brittle(pure elastic)deformation(curve OA in Fig.14a)and B26=0 corresponds to elastoplastic behavior(curve OB in Fig.14a). This index was used to compare the brittleness of shale rock specimens(Rybacki et al.,2016).This index suffers from the following limitations. Rocks with the same E and H may be characterized by different amount of inelastic deformation(Fig. 14b, curves 4 and 5 with the same pre-peak stress-strain curve), thus they will have different brittleness values. Besides,the brittleness for curves 1, 2 and 3 will be the same and equals 1 based on B26. However, the three rocks are characterized by different brittleness values based on a qualitative comparison. The above indices are developed based on the stress or deformation in the compression test. The failure process of rock is intimately related to the energy accumulation and dissipation, thus a number of indices based on the energy balance in the pre- and post-peak stress-strain curves (B27to B39) are proposed. B27, B28and B29are measured by the energy ratios in the prepeak stage. B27and B28are expressed as Fig. 14. (a) Schematic diagram of parameters needed for calculation of brittleness index B26, and (b) Several cases that cannot be differentiated by B26. where Wrand Wtare the elastic energy (SABCin Fig. 7) and total energy (the area enclosed by the stress curve OA and AC in Fig. 7),respectively, before peak strength. The two indices emphasize the percentage of elastic energy in total energy before peak strength,and are widely used to estimate the proneness to rockburst(Hucka and Das,1974; Kidybi'nski,1981; Aubertin et al.,1994). Instead of using the directly obtained stress-strain curve area to calculate the energy like B27and B28, Li et al. (2017) introduced a damage variable into the stress-strain constitutive relation, and defined B29as Fig. 15. Classification of class I and class II behaviors of rock failure in uniaxial compression. The shaded area is the surplus energy which would be supplied by the loading machine when loaded under axial strain control mode(Fairhurst and Hudson,1999). where dWsand dWeare the stored energy(the area enclosed by the stress curves OA and AC in Fig.7)and elastic energy of deformation(SODCin Fig.7),respectively;φ[(εf-ε0)/S0]is a normal distribution function;Dfis the damage variable when the dependent variable is the peak strain εf; and S0is the distribution parameter of Weibull distribution.Li et al.(2017)investigated the evolution of brittleness with increase of damage variable for coal,shale and tight sandstone in the loading process. The requirement of many parameters for calculation of B29makes it too complex to use.The values of initial damages and defects within the rock that are required in the index are not easy to be determined accurately.Besides,the brittleness is usually used to describe the brittle characteristic of a particular rock under a given stress state, and the study on the variation of brittleness with damage variable in the loading process seems lacking scientific significance. Wawersik and Fairhurst (1970) suggested two classes of behaviors of different rocks in the post-peak stress-strain curves.Class I behavior is characterized by stable fracture propagation and negative post-peak modulus, and work must be done to continue rock deformation after peak strength (Fig. 15). In contrast, deformation of a class II rock is self-sustaining, and the elastic strain energy before peak strength is sufficient to maintain the fracture propagation after peak strength, and the post-peak modulus is positive.When the rock is loaded in the axial strain control mode,only class I behavior can be generated.Special load control modes,such as rapid unloading (Wawersik and Fairhurst, 1970) or circumferential strain control (Fairhurst and Hudson,1999; Wong et al., 2020), should be adopted to produce class II stress-strain curves. B20to B24are only applicable to rocks which follow the class I stress-strain curves (with negative post-peak slope). Many other brittleness indices(B30to B39)considering the energy balance of both class I and class II stress-strain curves were proposed. Tarasov and Potvin (2013) considered brittleness as the capability of self-sustaining macroscopic failure in the post-peak region due to the elastic energy accumulated within the loaded material.They were the pioneers who clearly elaborated different types of energies in the class II stress-strain curve and proposed B30and B31as where dWr,dWeand dWaare the rupture energy,elastic energy and additional energy(or released energy),respectively(see Fig.16 for the definition of different energy types); and M is the post-peak modulus. B30and B31can be used to assess and predict the rockburst potential of rocks. The two indices are only dependent on E and M due to the simplification made by the authors that the unloading modulus at different points in the post-peak period was equal to elastic modulus(E).The ranges of B30and B31are(+∞,0)and (-∞, 1), respectively, and the brittleness gradually increases from the left to the right boundary of the above two ranges. B32is expressed as the product of elastic modulus(E)and postpeak modulus (M) (Andreev,1995): This index, however, has scarcely been used due to the lack of sufficient physical basis. Ai et al. (2016) defined brittleness as the ability of rock to accumulate elastic energy during the pre-peak stage and to selfsustain fracture propagation in the post-peak stage, and proposed B33 and B34: where dWdis the dissipated energy (Fig. 16). B33and B34have almost the same physical meaning as B30and B31except that the pre-peak dissipation energy (i.e. dWd) was also taken into consideration. B35, B36and B37are defined as the ratio of the stored elastic energy at peak strength to the total energy or rupture energy at failure (Munoz et al., 2016a), and are expressed as where Ueand dWteare the stored elastic energy at peak strength,Utotaland dWd+ dWrare the total energy at failure, Upostand dWrare the rupture energy, and Upeakand dWte+ dWdare the sum of energy at peak strength. The three indices were used to evaluate rock cutting and drilling performance (i.e. specific energy and penetration rate) of different cutting and drilling tools (Munoz et al., 2016b). The comparison of the formulae of B30and B36shows that they are approximately inversely correlated. Munoz et al. (2016a) also showed that B35, B36and B37of different rocks increase with the UCS (σc), crack damage stress (σcd, the stress corresponding to the reversal point of the volumetric strain) and tangent Young’s modulus(E),which indicates that the three indices reflect the strength characteristics of rock: Both B38and B39consist of two parts: the ratio of the (total)elastic energy to total energy at peak strength,and the ratio of the(total) elastic energy to the rupture energy at failure. B38uses the sum and B39uses the product of the two parts, respectively: Fig.16. Different energy types used in brittleness indices B30 to B39 (modified from Tarasov and Potvin (2013) and Munoz et al. (2016a)). B38and B39were separately used to assess the brittleness of shale rock and coal specimens (Kivi et al., 2018; Li et al., 2019). B40is the ratio of intrinsic cohesion (R0) to the fracture propagation resistance (Rfu) of mode II crack (Chen et al., 2017), and is expressed as Two groups of brittleness indices have been widely used in the field of tight oil and gas shale resources exploitation. The first group is based on the elastic constants obtained from geophysical methods, such as the Young’s modulus E, Poisson’s ratio ν, Lame’s first parameter λ, and shear modulus μ (B41to B47), which can be obtained by the analysis of P- and S-wave velocities of the shale formation. Rocks with high Young’s modulus and low Poisson’s ratio are considered to be more brittle (Fig.17), which favors the generation of complex fracture network during hydraulic fracturing(Rickman et al.,2008;Wang et al., 2015). B41is one of the most widely used brittleness indices in shale gas exploitation, and is expressed as where Emaxand Eminare the maximum and minimum static Young’s moduli, respectively; and νmaxand νminare the maximum and minimum static Poisson’s ratios of the shale formation,respectively(Rickman et al., 2008). The static Young’s modulus and Poisson’s ratio used in the model are estimated from the dynamic values which can be directly calculated with the compressive and shear slownesses (Mullen et al., 2007): Fig. 17. Cross plot of Young’s modulus and Poisson’s ratio showing the brittleness percentage increasing to bottom left of the plot(Rickman et al.,2008)(unit of Young’s modulus is mpsi, and 1 mpsi = 6.8947573 GPa). where Edis the dynamic Young’s modulus, νdis the dynamic Poisson’s ratio, Δtsis the shear slowness (μs/ft), and Δtcis the compressive slowness(μs/ft),Esis the static Young’s modulus,and is the total porosity. B42is modified from B41after considering the dominant role of tensile mechanism in complex brittle failure of shale cores (Guo et al., 2015b), and is expressed as where α and β are the coefficients. B41and B42have no physical meaning,and also are not related to the rock fracture process. Besides, how to determine the weight coefficients(i.e.α and β)of Young’s modulus and Poisson’s ratio is also unclear. B43and B44are respectively expressed as where E and ν are the static Young’s modulus and static Poisson’s ratio, respectively (Sun et al., 2013; Luan et al., 2014). The two indices were used to estimate the brittleness of shale. E and ν are two different parameters with different units,thus B43and B44are not robust mathematical definitions since they involve the division of a large number(Young’s modulus,104-105MPa magnitude)by a much smaller number(Poisson’s ratio,0-0.5 magnitude).The ratio of the Young’s modulus to Poisson’s ratio also does not have any clear physical meaning, and has nothing to do with the brittle fracture process of rock. Similar to B43and B44,B45and B46are defined as the ratio of the common elastic or Lame constants, and are expressed as where E,λ and μ are the Young’s modulus, Lame’s first parameter and shear modulus, respectively. The Lame constants in these indices can be obtained from prestack inversion of the seismic data using the amplitude versus offset (AVO) technique(Goodway et al., 2010). These indices were also used to denote the shale brittleness (Guo et al., 2012; Chen et al., 2014). The Lame constants (λ, μ) are theoretically correlated to the E and ν by the following formulae: Substitute Eqs.(63)and(64)into Eqs.(61)and(62),B45and B46can be rewritten as The Poisson’s ratio(ν)of rock ranges from 0 to 0.5,therefore,B45and B46increase with the decrease of ν, which is similar to the dependency of brittleness on Poisson’s ratio determined by B41to B44(a lower Poisson’s ratio indicates a higher brittleness). B47is obtained by multiple linear regression,and is expressed as where φ and E are the porosity and static elastic modulus of rock;and a,b,c and d are the harmonic coefficients.B47was found to be linearly related to B14(Liang et al.,2017),and was used to evaluate the shale rock formation brittleness. The development of the above indices (B41to B47) based on elastic constants generally assume that a greater E and a smaller ν favor fracturing, hence indicating a higher brittleness of rock.However, the study of Hiyama et al. (2013) illustrated that rocks with low Young’s modulus deform more easily and create fractures with larger average apertures, which leads to higher permeability and better performance in the hydraulic fracturing process.Nasehi and Mortazavi (2013) also found greater fracture conductivity in low Young’s modulus rocks. Based on Roylance (2001), a greater Young’s modulus means that a higher stress is needed to fracture the rock, indicating difficult and inefficient hydraulic fracturing process. The data collected from different parts of Woodford shale intervals by Miskimins (2012) showed that the Young’s modulus and Poisson’s ratio were positively correlated(Fig.18), which contradicts the results obtained by Rickman et al.(2008)(Fig.17).The data from a well in Gulf of Mexico also show an approximately positive linear relationship between Young’s modulus and Poisson’s ratio of sandstone (Bai, 2016). The above conclusions are in contrary to those obtained by Grieser and Bray (2007), Rickman et al. (2008), Sone and Zoback (2013), Sun et al. (2013) and Luan et al. (2014) who considered that rock with high Young’s modulus (i.e. higher brittleness) was much easier to fracture. The comparison also suggests that the brittleness indices developed for Barnett shale are not necessarily applicable to other shale formations and other rock types. Fig.18. Relationship between Young’s modulus and Poisson’s ratio for Woodford shale(Miskimins, 2012). The other group of brittleness indices that is often used in selection and design of hydraulic fracturing in shale gas reservoirs is based on different aspects of rock composition (brittle or ductile minerals). The ratios of weight or volume fraction of constituent minerals that are considered to favor brittle failure to those considered to be less favorable to brittle failure are used as brittleness indices (B48to B54), which can be obtained either by mineralogical logging tools or laboratory X-ray diffraction (XRD)tests. where Wqtz,Wcarb,Wdol,Wlm,Wcal,Wfsp,Wclay,Wtocand Wtotare the weights of quartz,carbonate minerals,dolomite,limestone,calcite,feldspar, clay, total organic content, and total minerals, respectively; and Wqfmis the weight sum of quartz, feldspar and mica.Shale brittleness is regarded to increase with the increasing amount of brittle minerals such as quartz(Jarvie et al.,2007;Wang and Gale,2009;Jin et al.,2014b;Liu and Sun,2015).B48,B49and B50differ in the types of brittle minerals being considered.For instance,B48only considers quartz as the brittle mineral,while B50considers quartz, feldspar, mica, calcite and dolomite as brittle minerals. The above three indices are based on the premise that brittleness is only dependent on the content of the brittle minerals, and each mineral has equivalent contribution to the brittleness. However, the physico-mechanical properties vary among different minerals, which contribute differently to the overall rock brittleness.In view of this,B51to B54were proposed,and are expressed as where a,b,c,d and e are the constants;Vqtz,Vfsp,Vpy,Vcarband Vtotare the volume fractions of quartz, feldspar, pyrite, carbonate and total minerals, respectively; αiand fiare the brittleness factor of each kind of mineral and volume fraction of various minerals,respectively; and Ai, Mi, ai, Eiand νiare the normalized brittleness coefficient to quartz content (aiq), mineral content, brittleness coefficient, Young’s modulus and Poisson’s ratio of ith mineral,respectively. How to determine the coefficients in B51and B52was not explained in detail by the authors(Shi et al.,2017;Moghadam et al.,2019).In B53and B54,the coefficients(also termed brittleness factor of different minerals) are calculated by the ratio of Young’s modulus and Poisson’s ratio of each mineral obtained from the literature (Liu and Sun, 2015; Huo et al., 2018). B55, which is known as rock tenacity rating index (RTRI), is another brittleness index that considers different contributions of the constituting minerals, and is expressed as where SFis the stiffness factor determined by referring to the stiffness of each mineral from the literature, GFis the grain size rating factor which can be estimated from petrographic analysis,and FFis the foliation rating factor related to the percentage of platy/prismatic minerals (Suorineni et al., 2009). The index was related to the brittle parameter s of the Hoek-Brown damage initiation criterion,and used to predict compressive stress-induced damage (depth of failure zone) in elastic rock models. Brittleness indices (B48to B54) based on the mineral contents ignore many other important factors that also contribute to rock brittleness such as stress state, diagenesis, pre-consolidation pressure, porosity, grain size, type and strength of cementing material. Since rock is usually formed after millions of years of geological evolution and complex multi-stage tectonic movements,the property and brittleness of rocks possessing the same mineralogical composition will be also different.The study of Hernandez-Uribe et al.(2017)revealed that brittleness of mudstone correlates negatively with quartz content, which indicates that those brittleness indices developed for Barnett shale, such as B48, may not be applicable to other organic mudrocks. Some other indices(B56to B61)that can be easily obtained from conventional well logs have been proposed for characterization of unconventional shale gas reservoirs and screening favorable hydraulic fracturing candidates. B56and B57were developed based on the variation profile of Pand S-wave velocities around the borehole, respectively, and are expressed as where R is the borehole radius; VPand VSare the P- and S-wave velocities,respectively;ΔVPand ΔVSare the variations of P-and Swave velocities, respectively, and are obtained from P-wave travel time tomography and dipole shear-wave dispersion inversion(refer to Tang et al. (2016) for more details about the calculation). The radial variation profile of velocity is then integrated along the radial direction and scaled with borehole radius R.It is believed that rocks with high brittleness tend to generate a large number of microcracks at the borehole wall during borehole or well drilling(Fig.19),which will lead to large variation in the radial elastic wave velocity(Tang et al.,2016).The two indices attribute the different numbers of microcracks(or the velocity variation)surrounding the borehole only to the different brittleness values of rock. However, the different stress level along the depth of borehole is also one important factor that can lead to different microcrack distributions and densities(Suorineni et al.,2009).Therefore,it is unreasonable to use B56and B57as brittleness indices. B58to B61are alternative brittleness indices to the mineral brittleness B50, which can be easily obtained from conventional well log if the expensive mineralogical logging and shear slowness from sonic logging data are unavailable. They are expressed as Fig.19. Schematic diagram of acoustic-wave ray paths around the borehole with the velocity increasing away from borehole (modified from Tang et al. (2016)). where GR and Pe are gamma ray logs (which measure the natural radioactivity in formations) and photoelectric absorption crosssection index (the ability of a molecule to absorb a gamma photon during photoelectric effect), respectively, which can be obtained from conventional log suits (Lai et al., 2015); φ is the neutron porosity, and is measured by employing a neutron source to detect the hydrogen index in a reservoir,which is directly related to porosity;DTC is the compressional wave travel time,and can be obtained from conventional sonic log(Jin et al.,2014b);p1,q1,r1,p2,q2and r2are the output parameters; and a and b are the fitting coefficients. Fig. 20 shows two relation examples between the mineral brittleness index B50and GR/Pe and DTC. As discussed in Section 4.4, the mineral brittleness indices (e.g. B50) have limitations, so will B58to B61because of their intimate relationship. B62was developed using artificial neural networks, and is expressed as where P, S and ν are the P- and S-wave velocities, and dynamic Poisson’s ratio,respectively;and R is a constant which is dependent on rock type (sedimentary, igneous and metamorphic). This index was used for the study of mechanical excavation and underground tunneling(Kaunda and Asbury,2016).As a positive linear relation is found between B62and B66, B62also reflects rock strength like B66(refer to Section 4.7 for the discussion of B66). Fig.20. Relationships between(a)mineral brittleness B50 and ratio of gamma ray(GR)and photoelectric absorption cross-section index(Pe)(re-plot with the data in Lai et al.(2015)), and (b) B50 and compressional wave travel time (DTC) (re-plotted with the data in Jin et al. (2014b)). Brittleness indices of B63and B64are merely associated with the angle of internal friction (φ), and are expressed as In B63,φ is determined by the slope of Mohr’s envelope at σn=0(Fig.21).In B64,φ is obtained by the measurement of the fracture plane angle αf(i.e.the angle between the fracture plane and axis of specimen) (Hucka and Das,1974). It is believed that a more brittle rock was characterized by a larger angle of internal friction(Hucka and Das,1974; Chang et al., 2006; Jin et al., 2014a, b; Zhang et al.,2016). B65is developed on the basis of B63, and it considers both preand post-peak deformation behaviors of rock as Fig. 21. Schematic diagram on the determination of angle of internal friction from strength envelope. σn and τ are the normal stress and shear strength, respectively(Hucka and Das,1974). where σpand σrare the peak and residual strengths, respectively.The angle of internal friction φ is determined from the slope of the tangent lines with the strength envelope at different normal stresses (Zhou et al., 2018). As the fracture plane angle(αf)of specimen and the slope of the tangent lines vary with confining pressure (or normal stress), B64and B65can be used to estimate the rock brittleness under different stress states.These indices based on angle of internal friction have scarcely been used since their emergence either because of the lack of sufficient physical basis or the time-consuming complex process to calculate the friction angle. Handin (1969) commented that the internal friction was a fictitious quantity that cannot be measured directly in cohesive material. In addition to the conventional triaxial compression tests to obtain the angle of internal friction,the porosity and sonic logging data are also utilized to derive the friction angle which is then used as a brittleness indicator in petroleum science and engineering(Chang et al., 2006; Jin et al., 2014a, b). The limited experimental results of shale and sandstone summarized by Chang et al. (2006)showed that the angle of internal friction (φ) was positively related to P-wave velocity Vp,and negatively related to porosity(φ)and gamma ray (GR), which can be described by the following formulae: where GRsandand GRshaleare the gamma ray of pure sand and pure shale, respectively; and μsandand μshaleare the internal friction coefficients of pure sand and pure shale, respectively. However, considerable scatter existed between the fitting lines and the actual values of angle of internal friction, indicating unsatisfactory correlations (see Fig. 22). Therefore, the use of these empirical equations mentioned above have rarely been reported in other rock engineering applications(tunneling,mining,rock slope)to estimate the angle of internal friction of rocks. Besides, the empirical equations developed for a particular rock type to estimate the angle of internal friction may not be applicable to other rock types due to their different physico-mechanical properties. As the rock breakage process under TBM rolling cutters consists of two continuous stages, i.e. rock indentation and chipping formation between two cutters,brittleness indices(B66,B67,B68)based on the penetration test are sometimes employed to evaluate the fragmentation efficiency of disc cutter (Copur et al., 2003; Yagiz,2008, 2009). B66is one of the most popular brittleness indices in the underground tunneling, and many other indices (e.g. B6to B9, B62) as discussed above are developed based on B66. B66is expressed as where Fmaxand P are the maximum applied force and corresponding penetration depth, respectively in penetration test. The test setup and the penetration-force curves for three rocks with different brittleness values are shown in Fig. 23. Positive relation between B66and UCS (σc) was found with high correlation coefficient (Yagiz, 2009), indicating that B66is more representative of rock compressive strength, rather than rock brittleness: Fig.22. Relationship between angle of internal friction and porosity of sandstone(data from Chang et al. (2006)). Fig.23. (a)Setup for penetration test and(b)penetration-force curves for three rocks with different brittleness values (Yagiz, 2009). Highly brittle rock demonstrates fluctuating force-penetration relationship due to the large force drops and large chips, and the increment periods of brittle rock in the force-penetration graph are shorter compared to a ductile rock (Copur et al., 2003). Based on this, B67is introduced: where Pdecand Pincare the average force increment periods and force decrease periods in the force-penetration curve,respectively;Pdeciand Pincjare the ith force decrease period and jth force increment period, respectively (Fig. 24); and s and n are the total numbers of decrease and increase stages over the entire graph,respectively. Calculation of B67is time-consuming and subjective because the increment and decrement points are picked manually from the force-penetration curve. The irregularity of the forcepenetration curve also makes the identification of these points difficult. B68shares similar form as B67, and is expressed as Fig. 24. Simplified force-penetration curves (modified from Copur et al. (2003)). where Fdownand Fupare the sums of force drop value and force increase value from the force-penetration graph, respectively; and Fdowniand Fupjare the ith force drop and jth force increase values,respectively(Fig.24).A lower B68denotes a higher brittleness(Liu et al., 2016). In addition to the limitations similar to B67, the definition of B68implies that the rock is the most brittle when B68is equal to zero. However, the sum of force drop (Fdown) and B68are both equal to zero for very ductile rock where no force drops occur.Therefore,B68cannot truly reflect the rock brittleness. Indentation test is one commonly used method to test the hardness of material.Several indices were developed based on rock hardness(B69to B71)or the generated crack size or volume(B72,B73)during indentation. B69is calculated by the difference between the micro- and macro-indentation hardness values, and is expressed as where Hμis the micro-indentation hardness which is measured by impressing a diamond indenter of specific geometry into the surface with low applied load; H is the macro-indentation, which is measured similarly to Hμ but with high applied load; and K is a constant (Hucka and Das,1974). The underlying physical meaning of the difference between the micro- and macro-indentation hardness values is unclear, and its correlation with rock brittleness needs to be further verified. Lawn and Marshall (1979) defined brittleness as the relative susceptibility of a material to two competing mechanical responses,i.e. deformation (residual or plastic impression) and fracture, and proposed B70as brittleness index of ceramics: where H is the hardness which describes the resistance to deformation. B71is based on the energy balance between the generation of permanent deformation and the creation of new fracture surfaces in indentation test of ceramics (Quinn and Quinn, 1997), and is expressed as where H and E are the hardness and Young’s modulus,respectively.A material with low B71is more apt to deform than fracture, and conversely,a material with high B71is more apt to fracture(Quinn and Quinn,1997). B70and B71are similar in nature and are deduced from fracture mechanics.An important aspect is that mode I fracture is assumed to occur beneath the indenter, thus the two indices are only dependent on KIC. However, mode I, mode II and even mode III fractures can occur in rock compression test and in different fields of rock engineering. Besides, both B70and B71are proposed for ceramics use,and the general properties of rocks and ceramics are not the same (rocks are typically anisotropic and inhomogeneous,while ceramics are much more homogeneous and isotropic).Therefore, B70and B71may be not completely applicable to rocks. The ratio of characteristic crack to indentation diagonal length beneath the indenter in Vickers indentation test was used to denote the brittleness of glass(Sehgal et al.,1995),and B72is expressed as where C and a are the characteristic crack length and indentation diagonal length, respectively (Fig. 25). As rocks are much more inhomogeneous and anisotropic than glasses,the deformation and fracture zones are more complicated and irregular in rocks than those in glasses, which makes the determination of parameters C and a difficult. Considering that there is no visible radial crack (the median crack in Fig.25) forming during the indentation of shale,Fan et al.(2019) proposed B74to denote brittleness of shale: Fig. 25. Typical Vickers deformation-fracture pattern for glass under indentation.Cracks form at the four corners of the indent in excess of the critical load. 2a is the dimension of the “plastic” impression and 2C is the dimension of the median crack(Sehgal et al.,1995). where VC, VVand VIare the crack formation volume (reflects the energy to create new crack surfaces),rock deformation volume and indenter intrusion volume(reflects the total energy exerted by the indenter), respectively. For ideally ductile rocks, only plastic deformation occurs without any cracking (VC= 0, and VI=VV,B73= 0) (Fig. 26). For not ideally-ductile material such as siliceous shale,the crack formation and chipping would cause extra indenter penetration (Fig. 26). As such, the indenter intrusion volume (VI)consists of rock volume deformation (VV) and crack deformation(VC). This method has the following two limitations. First, the deformation volume caused by crack initiation and propagation is difficult to be measured precisely. Besides, the deformation and cracking process in the indentation test is load-dependent, which will affect the value of B72. When the load is low, only volume deformation occurs; while both deformation and cracking start to occur when the applied load is higher than a critical value. Impact testing measures the energy required to break a specimen by dynamically applying a load (i.e. the crushability of rock).Material with high brittleness is considered fragile and delicate,and the percentage of fines with smaller size after impact test will be more than that of ductile material(Protodyakonov,1962;Hucka and Das, 1974; Dahl, 2003). Therefore, the content of fines after impact is taken as an indicator for rock brittleness. B74is used to denote the influence of rock brittleness on DRI of rocks in the Norwegian University of Science and Technology(NTNU)model for prediction of TBM performance(Bruland,1998),and is expressed as where S20is the percentage of fines less than 11.2 mm. The test procedure is illustrated in Fig. 27a, and the chart using S20to determine DRI is shown in Fig. 27b. Firstly, a rock sample was crushed in a jaw crusher and sieved by 16 mm and 11.2 mm sieves.A mass of 14 kg hammer was dropped down on the mortar containing rock material with size between 11.2 mm and 16 mm for 20 times. This procedure was repeated for 3-5 times for every rock sample. After impact action, rock material was sieved through an 11.2 mm sieve and the percentage of material passing the sieve was determined as the S20value (Blindheim and Bruland, 1998; Dahl,2003). Fig. 28a and b shows that B74value decreases with σcand σtof different rocks, which indicates that rocks with the lowest σchas the highest brittleness. This is in conflict with our common understanding that brittleness will not be very high for rocks with extremely low strength, which are usually characterized by high porosity, weak cemented strength or ductile mineral composition. B75is obtained from the Protodyakonov impact test, and is expressed as Fig. 26. Schematic diagram of deformation characteristics for ideally ductile material and not ideally ductile material during indentation (Fan et al., 2019). Fig. 27. (a) Outline of principle of the brittleness test and (b) Chart for determining drilling rate index (DRI) (Blindheim and Bruland,1998; Dahl, 2003). where q is the percentage of fines(-28 mesh,which corresponds to sieve opening of 0.6 mm)formed in the Protodyakonov impact test(Protodyakonov,1962),which has a physical meaning similar to S20.As S20decreases with increasing σc(see Fig.28a),similar variation of q with increasing σccan also be expected. Unfortunately, the product of q and σchas no physical meaning. Fig. 28. Variations of B74 with (a) uniaxial compressive strength and (b) Brazilian tensile strength of different rocks (data compiled from Dursun and Gokay (2016) and Yarali and Soyer (2011)). Brittleness indices based on penetration tests,indentation tests,and impact tests cannot consider effects of stress state on rock brittleness. The deformation and mechanical properties of sedimentary rocks (such as shale and mudstone) are influenced by formation processes such as uplift, chemical diagenesis and overpressure build-up(Nygard et al.,2006),and the consolidation state of these rocks is considered to influence their brittleness. Ingram and Urai(1999) proposed B76as brittleness index of mudrock: where UCSNCis the UCS of a normally consolidated rock in nonoverpressure domains, and UCSOCis the UCS at over-consolidated state and can be measured directly on plug samples or estimated from logs or cuttings on the basis of the following empirical correlations(if the historical maximum effective stress is greater than present-day effective pressure of the rock, then the rock is in the over-consolidated state): UCSNCwas determined from empirical soil mechanics relations and was estimated by where σ′is the effective in situ pressure corresponding to normal consolidation at the depth of interest. This index was used to estimate the brittleness of mudrock which functioned as the top seal for hydrocarbon, and the risk of embrittlement increased with increasing B76when B76> 2 (Ingram and Urai,1999). To provide a more direct measure of brittleness, overconsolidation ratio (OCR, defined as ratio between the maximum effective vertical stress in the history to the present effective vertical stress) was related to B76as a new brittleness index (B77) of shale and mudrock(Nygard et al., 2006): OCR increases with increasing pre-consolidation stress, and a higher ratio corresponds to a greater brittleness.Actually,both B76and B77reflect rock strength characteristic. Besides, the OCR method was developed from soil mechanics principles and then applied to the brittleness evaluation of mudstone.B76and B77may not be applicable to other rock types such as strong igneous rocks where insignificant influence on mechanical properties can be imposed by pre-consolidation because of the high stiffness and low porosity of the rocks. B78is determined from point load test(PLT),and is expressed as Fig.29. Schematic diagram of the point load test to determine B78(Reichmuth,1967). where Kbis the brittleness index, Ksis the shape factor, Stis the tensile strength,P is the applied load at failure,and h is the distance between loading points (Fig. 29). The tensile strength (St) and brittleness (Kb) are considered as material constants, and can be respectively determined by the intercept and slope of the best-fit regression line through PLT on specimens with different h and P values(Reichmuth,1967).The author did not explain why the slope of the fitting curve can represent the brittleness of rock, and only mentioned that “one gets an intuitive feel for their relative brittleness which closely follows the tabulated values”. B79is defined as ratio of maximum possible linear size of the plastic area at the end of an isolated crack (with depth of l) to the distance L,designating the geometric scale of the specimen,where l/L and the thickness h are the constants(Fig. 30): where σsis the tensile yield strength,L is the distance between the crack tip and plate boundary,γ*is the dissipation of energy due to crack growth per unit area of newly formed surface, and E is the Young’s modulus (Cherepanov,1979). Based on the Griffith theory for fracture of the crystalline material,the yield tensile strength of the material can be expressed as where E,γ and b are the Young’s modulus, surface energy density and lattice spacing,respectively.Substitute Eq.(109)into Eq.(108),the following simple form can be obtained: When B79≫1, the material behaves as an ideally plastic material,and the maximum possible deformation of the plastic area is much greater than L, and the mean stress at failure is equal to tensile yield strength of the plate (σs). On the other hand, when B79≪1, the material behaves as ideally brittle material and the plastic area is much less than the value L.This index is based on the fracture mechanics analysis of mode I fracture under tensile load,and the application of this index in rock failure process may be questionable because a mix of modes I, II, and III fractures may occur in rock under complex loading condition. B80is measured from micro-scratch test,and is expressed as where WBand WTare the extra work spent in brittle events(areas enclosed by the top shaded triangles in Fig. 31a) and total energy(areas below the fluctuating curve) required for scratching in micro-scratch test, respectively. This index was used to determine the brittleness of mudstone reservoir (Hernandez-Uribe et al.,2017). A constant normal load was applied during the test, and the pattern of the transverse force-scratch position curve is dependent on the value of applied vertical load,which has a great influence on B80.However,how to determine the vertical load value for different rock types is unclear. Brittleness indices B78to B80do not consider the influence of stress state on rock brittleness. Fig. 30. Schematic diagram of tension test using a plate containing an artificial crack.The thickness h of the specimen is assumed to be sufficiently large,and l is the depth of the crack (Cherepanov,1979). In Section 4,80 brittleness indices compiled from the literature in rock mechanics field are reviewed. Table A1 indicates that indices obtained based on compressive stress-strain curves account for the majority of the reviewed indices,followed by indices obtained by strength parameters, mineral compositions, elastic parameters, and conventional well logging data. The popularity of those indices (B14to B39) based on stress-strain curves is likely attributed to their most intuitive reflection of rocks’property under loading.Besides,the uniaxial and triaxial compression tests are the most commonly used fundamental tests to obtain the basic strength parameters of rocks, and no additional tests are required to obtain the rock brittleness. Therefore, they are widely used to characterize the mechanical behaviors (e.g. brittle-ductile transition) of rocks under different confining pressures, and to analyze the stability of deep hard rock tunnels and mines (e.g. rockburst analysis and breakout zone prediction). As discussed in Section 3,these indices are mainly applied in the following three fields of rock engineering(1)stability analysis(e.g.rockburst proneness): of surrounding rock in deep rock tunneling and mining (2) rock fragmentation efficiency (e.g. drillability, cutability and penetration rate), evaluation of different mechanical excavators, and (3) selection and design of hydraulic fracturing targets in shale gas reservoirs. Several brittleness indices originally developed for one application have been applied in multi-field. For instance, brittleness index B1based on strength parameters has been adopted to predict the likelihood of rockburst (Wang and Park, 2001; Zhang and Fu,2008) and investigate the rock drillability and cutability(Kahraman,2002;Gong and Zhao,2007).Brittleness indices B35to B37based on compression stress-strain curves have been applied to predicting the specific energy during rock cutting(Munoz et al.,2016a,b).Nonetheless,most of the indices developed based on one particular measurement method are mainly applied in a specific area. For example, those indices based on elastic constants (B41to B47), mineral compositions (B48to B54) and conventional well logging data (B56to B61)are solely used in exploitation of unconventional hydrocarbon resources,but not applicable to rock tunneling and mining where location-specific and accurate brittleness values and mechanical parameters (such as angle of internal friction) are usually needed rather than an approximate profile of brittleness.As discussed in Section 4,some indices(B41to B47,B48to B54,and B56to B61)have no explicit physical meanings and are not related to rock fracture process,despite their extensive application in the recovery of shale gas resources. On the other hand, brittleness indices obtained by strength parameters (B1to B11), force-penetration graphs (B66to B68) and fine contents (B74and B75) are mostly used in the analysis of rock cutting,drilling and rock excavations.Most of the indices based on strength parameters(B1to B11)have no strong direct link with rock fracture process, i.e. they are only developed based on a formula with a combination of UCS and tensile strength of rock. A close examination of Table A1 reveals that a number of indices are positively correlated. For instance, (1) B66is associated with indices B6,B7,B8,B9and B62;(2)B4with B5and B10;(3)B50with B58,B59,B60and B61;(4)B74with B11;(5)B19with B1and B2;and(6)B14with B47.Based on the present comprehensive analysis and critical review, it is conclusive that three rock brittleness measurement methods, which have sound physical meanings, are capable of reflecting rock brittleness to some extent, although these measurement methods of rock brittleness still need to be refined considering their limitations (as discussed in the following part): (1) The elastic deformation before fracture in the compression tests (B15, B16, B17); (2) The shape of post-peak stress-strain curves in the compression tests(B21to B23, B30to B39); and (3) Fracture mechanics methods (B13, B40, B70, B71, B72, B73). The three methods are indeed based on different definitions of brittleness as discussed in Section 2. The first method is based on the widely accepted viewpoint that brittle rocks usually fail by fracture at or only slightly beyond the yield stress with little or no ductile deformation (Hetenyi, 1966; Obert and Duvall, 1967;Andreev,1995). Although tension tests are commonly used to test metal and cast iron,compression tests are more suitable for testing rocks. The second method is based on the definition of “brittle” provided by Mogi (1966), Hoek and Brown (1980), Brady and Brown(2005), Paterson and Wong (2005) and Jaeger et al. (2007).Tarasov and Potvin(2013)extended this method by considering the class II stress-strain curves. The third method is developed in terms of the ease of(tensile or shear) crack propagation in a stressed medium, which aligns with the definition of brittleness proposed by Reichmuth (1967) and Lawn and Marshall (1979). The crack is considered to propagate easily and consume less energy for brittle rock. However, the existing brittleness indices obtained from the above three methods also have their limitations. In the first method, how to quantify the elastic deformation (using the absolute elastic deformation or the ratio of elastic deformation to total deformation at fracture)is controversial.In the second method,the post-peak stress-strain curves obtained by the axial straincontrolled load test are similar for very brittle rocks with respect to the post-peak stress drops(the peak stress will abruptly decrease to a very small value). The indices based on such post-peak stress and strain cannot differentiate the brittleness among different rocks (Wong et al., 2020). In this case, the lateral (circumferential)displacement-controlled load test is suggested to be conducted to obtain the complete stress-strain curves of hard rocks (Fairhurst and Hudson,1999; Tarasov and Potvin, 2013; Munoz et al., 2016a;Wong et al.,2020).Besides,can rock brittleness be estimated by the ratio of energy at different loading stages?If so,which energy term(elastic energy, dissipated energy, total energy or rupture energy)should be used?In the third method,as the properties of rocks are generally different from those of glasses and ceramics, Modes I, II and III fractures may occur in rocks under complex loading,thus the indices solely considering Mode I (i.e. B13, B70, B71) or Mode II (i.e.B40) fractures cannot reflect the true rock brittleness. The variation trend of brittleness values measured by the aforementioned three methods may not be consistent with each other because the definitions of brittleness are different in nature.The first two methods based on uniaxial and triaxial compression tests can consider the effects of stress state on the brittleness,while the last one only measures rock brittleness at room temperature and atmosphere pressure. A rock can fail brittlely under uniaxial compression while ductilely under high confining pressure condition. At the present stage, developing one universally accepted/applicable brittleness index in rock mechanics is a challenging issue,before which a standard definition of rock brittleness should first be proposed or agreed upon.More likely,the definition of rock“brittleness” should meet the following requirements: (1) Has clear and specific physical meanings; (2) Be easy and convenient to measure in the laboratory; (3) Consider the unique properties (e.g. inhomogeneity, anisotropy) of rock material; and (4) Consider the influence of stress conditions. Fig.31. Simplified(a)and real(b)transverse force-scratch position curves in the micro-scratch test(modified from Hernandez-Uribe et al.(2017)).The area sum of the top shaded triangles in(a)and the area between the force curve and dashed line in(b)represents the extra work that is stored as strain energy,which is rapidly released upon brittle chipping(WB). The area enclosed by the force curve and axes is the total energy required for scratching (WT). In this study, the commonly used “brittle” or “brittleness” definitions from a number of publications in classical rock mechanics field are compiled and studied.Eighty published brittleness indices are critically reviewed, and the limitations of some indices are discussed. After a thorough evaluation of these indices, it is found that the term “brittleness” sometimes is misused, and some brittleness indices cannot accurately reflect rock brittleness. In addition, brittleness indices developed in one field usually are not effective when directly applied to other fields. Brittleness indices obtained based on one certain rock type or a small database may not be applicable to other more general conditions (such as other rock types and stress states). Although satisfactory correlations between certain indices and the relevant rock failure process (e.g.hydraulic fracturing network development,and penetration rate of TBM)have been frequently reported,some of these indices are lack of physical meaning. Some indices may represent other rock properties, such as rock strength, rather than the brittleness. In view of the diverse measurement methods available in the literature,three measurement methods which have promising potential to be the standard measurement methods of rock brittleness after further in-depth research and improvement are identified. The authors declare that they have no known competing financial interests or personal relationships that could have appeared to influence the work reported in this paper. We gratefully acknowledge financial support from the National Natural Science Foundation of China (Grant Nos.51879135 and 41877217). The work in this paper was also supported by the Hong Kong Scholars Program (Grant No.XJ2017043). Table A1 Summary of brittleness indices. Table A1 (continued) Table A1 (continued)











4.3. Brittleness indices (B41 to B47) based on elastic parameters




4.4. Brittleness indices (B48 to B55) based on mineral compositions


4.5. Brittleness indices (B56 to B62) based on conventional well logging data




4.6. Brittleness indices (B63 to B65) based on angle of internal friction



4.7. Brittleness indices (B66 to B68) based on force-penetration graphs


4.8. Brittleness indices (B69 to B73) measured from indentation test


4.9. Brittleness indices (B74, B75) based on content of fines after impact


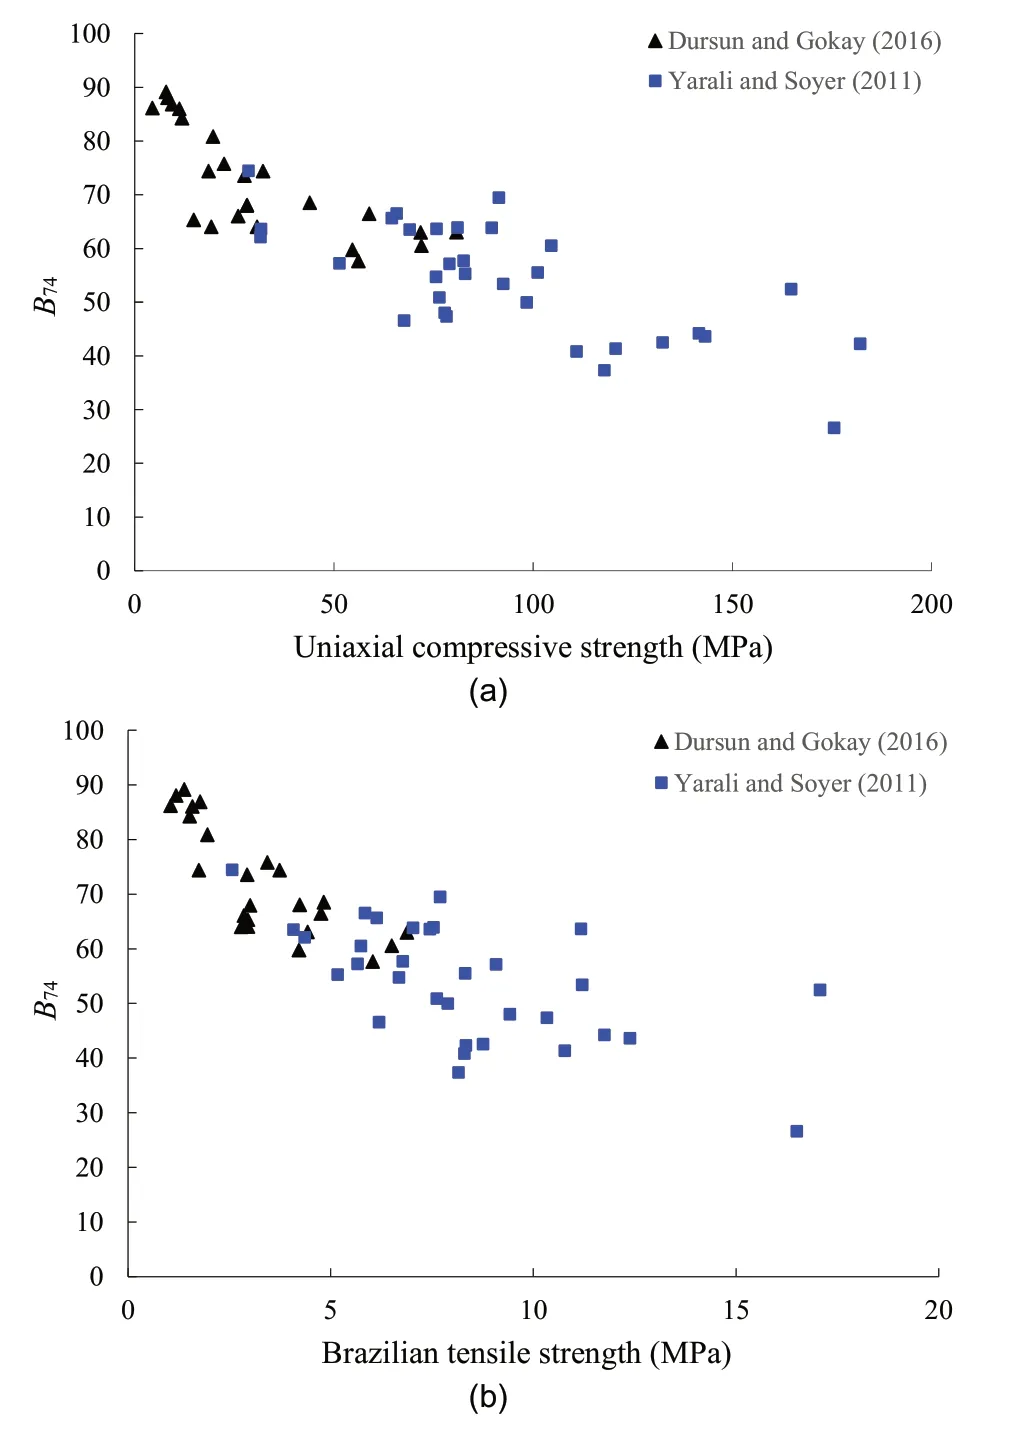
4.10. Brittleness indices (B76 to B77) based on over-consolidation characteristics


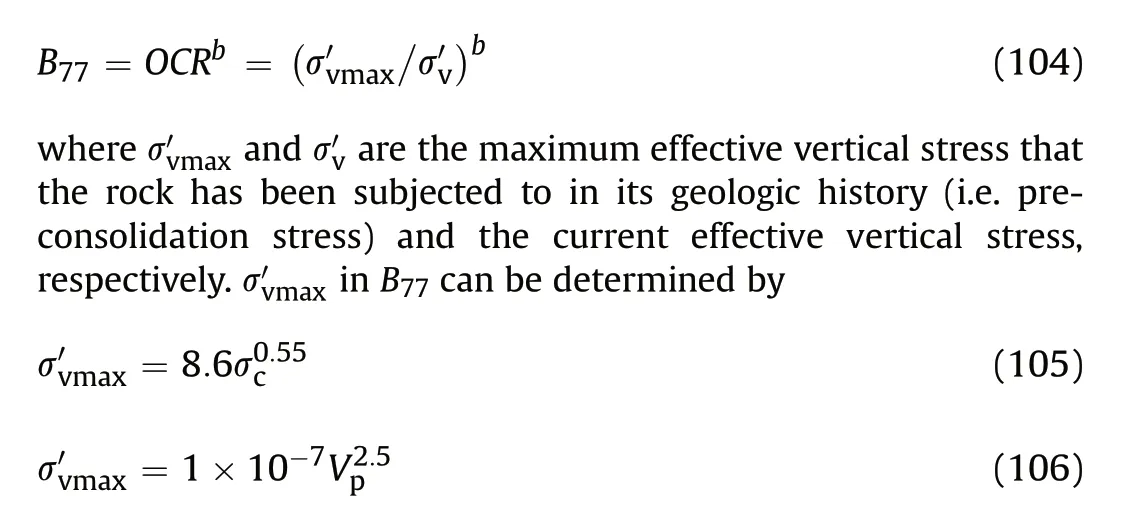
4.11. Other brittleness indices

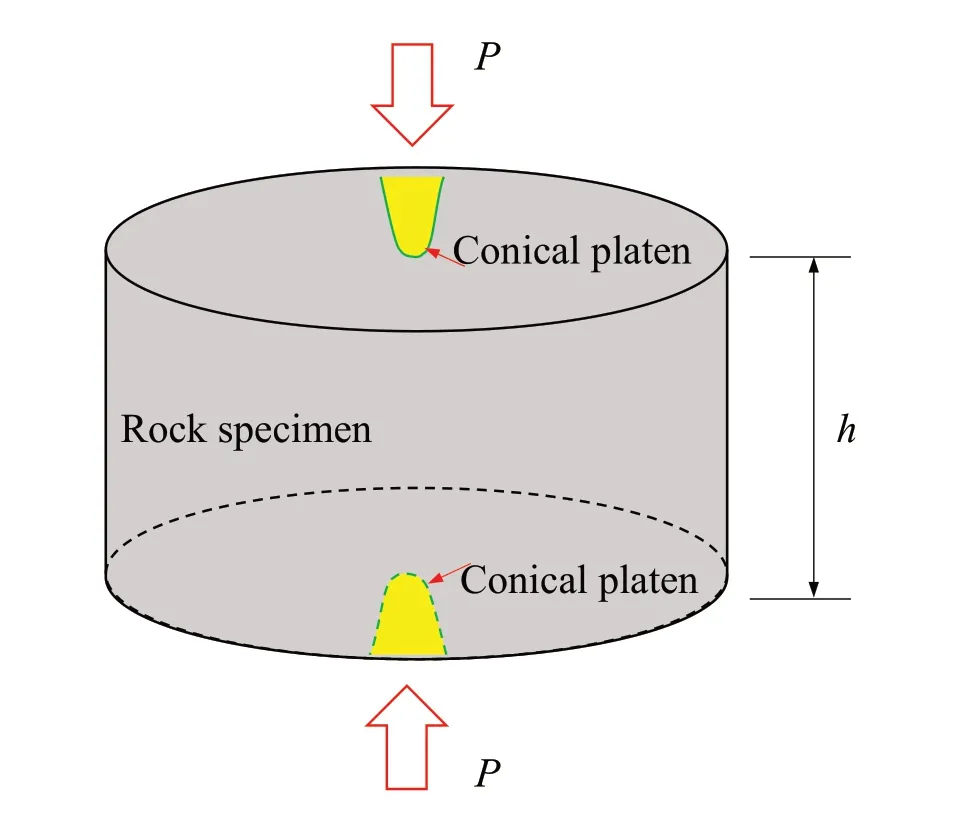


5. Discussion

6. Conclusions
Declaration of competing interest
Acknowledgments
Appendix A


 Journal of Rock Mechanics and Geotechnical Engineering2021年1期
- Journal of Rock Mechanics and Geotechnical Engineering的其它文章
- Improved prediction of slope stability using a hybrid stacking ensemble method based on finite element analysis and field data
- An integrated laboratory experiment of realistic diagenesis, perforation and sand production using a large artificial sandstone specimen
- Predicting uniaxial compressive strength of serpentinites through physical, dynamic and mechanical properties using neural networks
- Axial response and material efficiency of tapered helical piles
- Optimizing micaceous soil stabilization using response surface method
- Application of artificial intelligence to rock mechanics: An overview
