Influence of uniaxial tensile pre-strain on forming limit curve by using biaxial tensile test
Wennn YUAN, Min WAN, Xingdong WU,*, Bolin MA, Xu LU,Bing YANG
a Department of Mechanical Engineering and Automation, Beijing University of Aeronautics and Astronautics, Beijing 100083,China
b Research Institute of Baosteel, Shanghai 201900, China
KEYWORDS Aluminum alloy sheet;Biaxial tensile tests;Formability;M-K model;Yld2000-2d
Abstract This paper focused on the effect of pre-strain on forming limit curves (FLC) of 5754-O aluminum alloy sheet through utilizing biaxial tensile approach. Based on Swift model and Yld2000-2d yield criterion, the dimensions of cruciform specimen was optimized through applying finite element method for increasing the strain at specimen center. After that, with the recommended specimen size,the cruciform specimen was tested under various stroke ratios to experimentally characterize the limit strains under different pre-strain levels.Subsequently, the biaxial tensile tests were simulated by Abaqus to obtain the limit strains and validate the material models. It can be observed in both experiments and simulations that the pre-strained uniaxial tension followed by plane tension or equi-biaxial tension can improve the formability of sheet metals.Besides,the strain path change affects the trend of first derivative of strain rate difference between neighboring points with respect to time. An early increase occurred and then fell back to the stable value, the steady evolution continued until to a new increase reaching the critical value. The M-K prediction approach was simulated to verify the influence of pre-strain on FLC.It can be found that the early increase peaks of the major strain incremental ratio rose with the amplitude of pre-strain. Finally,the phenomenon of pseudolocalization caused by the strain path change was explained through evolution of stress state inside the groove.
1. Introduction
The forming limit curve (FLC), which was proposed by Keeler1and improved by Goodwin,2is an essential tool to evaluate the deformation margin. Many researchers focused on the FLC of sheet metal with the considerations of strain path, strain rate and temperature. In experiment, the out-ofplane stretching and the in-plane stretching are commonly applied to achieve the limit strains under various desired strain paths.The sample was clamped between die and blank holder,and stretched by hemispherical or flat rigid punch. However,friction caused by the contact between metal sheet and punch may affect the formability of sheet metal.For in-plane stretching method,the premature fracture at the corner of punch will lead to the failure of forming limit tests. In addition, a large part of specimens with different geometric shapes are required in both these two tests for covering the whole strain paths,and the effect of the complex strain path change on FLC cannot be explored since the simplistic linear loading path of this test cannot be guaranteed.3,4
Biaxial tensile test, proposed by Shiratori and Ikegami5in 1968,is an alternate approach to characterize mechanical properties of sheet metals. Unlike the conventional methods mentioned above, a unique geometry of specimen is sufficient for the whole test, and different stress states or complex strain paths can be implemented by controlling the actuators in two perpendicular directions. The biaxial tensile test has been adopted by many authors to investigate the yielding and hardening behaviors of materials.For instance,by utilizing the biaxial tensile tests,the geometry of yield loci of steel sheet BH220 and the hardening behavior of 5086 aluminum alloy sheet up to large equivalent plastic strain were determined by Wu et al.6and Liu et al.,7respectively.The ISO standard of biaxial tensile test was proposed as a guidance to investigate the yield behavior of the sheet metals. The cruciform specimen with slits on arms was adopted in the test and examined under different loading ratios by biaxial tensile apparatus. It was verified that this geometry can provide much lower shear stress component in the central area.8Unfortunately,the deformation in the center region of this shape specimen cannot reach the limit strain level and the fracture often occurs on arms. As a result, this standard type of cruciform specimen could not satisfy the prerequisite of forming limit investigation of sheet metals,and the design of cruciform specimen still attracts the attention of many researchers.Smits et al.9proposed that the specimen with a cutin fillet between adjacent arms can reduce stress concentration at the junction of two arms,thus the premature fracture could be avoided.Subsequently,further studies on the influence of fillet radius and fillet position on forming result were pursued by Lamkanfi et al.10and Yuan et al.,11and the optimized scheme was suggested. Thickness reduction at the central region of specimen is an effectively method to increase the strain level.Xiao et al.12concluded that thickness reduction with circular groove was better than that with plane groove. To date, even though many improved shape of cruciform specimens were proposed,no standard shape still exists.13
Aside from the experimental methods, the instability criteria are also widely utilized to theoretically predict the FLC of sheet metal. Many impact factors on FLC were discussed by means of theoretical analysis. The temperature and strain rate influence on AA5086 forming limit curves were investigated by M-K model associated with a Ludwick’s hardening model.14For strain path change, the effect of pre-strain on FLC of AA5083 was explored by Zhalehfar et al.15on the basis of M-K method, and the numerical results were coincided with experimental data obtained from out-of-plane formability tests. Xavier et al.16compared the FLC0of IF steel under two kinds of loading paths, and concluded that a significant change could be observed between proportional and nonproportional strain paths. By the extension of the constraint equation for material necking to the non-linear loading condition,Li et al.17proposed an analytical approach for determining FLC under combined-linear strain path. Although the theoretical methods have the capability to predict the FLC of sheet metals, the calculation procedure was considerable complicate.18
With the development of finite element method,the numerical simulation by the combination with failure criteria has become an effective way for evaluating the FLC of metal sheet.Banabic et al.19simulated the M-K model to obtain the FLCs of metal sheet, and Zhang et al.20investigated the formability of AA5086 by modelling the Marciniak test. Besides, the numerical simulation method was also suitable to explore the influence of pre-strain on FLC. Reyes et al.21used the FE M-K models by the combination of two instability criteria to analyze the effect of pre-strain on FLC.Graf and Hosford22characterized the FLC of aluminum alloy specimens under different levels of pre-strain, and suggested that the degree and direction of pre-strain can result in the shift of the entire forming limit curve and the analogous finding was also found by Leotoing et al.3The uniaxial tensile pre-strain followed by plane strain tension or biaxial tension could contribute to improving the formability of materials,whereas for the biaxial tensile pre-strain followed by uniaxial tension,the forming limits would decrease.
Additionally, research on the effect of strain path change on FLC of sheet metals has been carried out by many authors.Experimentally, Tolazzi et al.23presented a method for the determination of FLC of dual phase steel DP450 under nonlinear strain paths, and the results show as expected with a reduced formability for uniaxial load after biaxial stretching.Vysochinskiy et al.24studied the effect of prestrain by rolling on the formability of AA6016 sheets by Marciniak-Kuczynski tests, and found that the pre-strain by rolling has the same influence on forming limit strains as the pre-strain by plane strain tension.Numerically,Zhalehfar et al.25found that biaxial pre-straining shifted the FLC of 5083 aluminum alloy to the right hand side of the diagram for the specimens parallel to the rolling direction, and also decreased the FLC for both directions. In order to improve the accuracy of FLD prediction under nonlinear strain paths, Yao et al.26presented a backstress tensor to determine the center of the subsequent yield surface after preloading and unloading.Beside,a combination of M-K model and a general anisotropic yield criterion was used to verify the validation of nonlinear formability prediction of both Al2008-T4 and Al6111-T4.The works mentioned above demonstrated that the level of the FLD is strongly strain path dependent.
This work focused on the effect of pre-strain on formability of 5754-O aluminum alloy sheet through biaxial tensile tests and numerical simulations. Firstly, uniaxial tensile tests were conducted, followed which the significant anisotropy coefficients in Yld2000-2d yield function were determined. The geometry of cruciform specimen was optimized under two impact factors for effectively improving the strain level in the central region. With the optimized cruciform specimens, the biaxial tensile tests were conducted under different stress paths to obtain the FLC of metal sheet. The finite element model of the experiments was established according to the actual loading procedure, and the accordance of the limit strain pairs between simulations and experiments assures the validation of numerical model. Finally, FE M-K model was conducted by Abaqus,and the effect of pre-strain on FLC was discussed.
2. Mechanical properties
Due to the excellent advantages of low-density and good formability, 5754-O aluminum alloy was extensively adopted in lightweight structural manufacturing and its chemical composition is listed in Table 1. In this study, the aluminum alloy sheet with thickness of 0.9 mm was employed.
2.1. Uniaxial tensile tests
The specimen for uniaxial tensile test was shown in Fig. 1,which were manufactured along three direction (0°, 45° and 90° with respect to the rolling direction). The uniaxial tensile tests were conducted on a MTS tensile testing machine. Each test was repeated three times for minimize the man-made error in experiments, and the test results are presented in Fig. 1.
The plastic strain-stress curves obtained from uniaxial tension tests were fitted by Swift model σ=K(εp+ε0)n. Meanwhile, the Lankford’s coefficient r-value, defined as the ratio of the strain in width direction to that in thickness direction,was measured when the strain in the tensile direction reached 10%.27The tested mechanical properties are summarized in Table 2.
2.2. Yield function
In terms of the international biaxial tensile test standard ISO16842-201415, cruciform specimen could ensure homogeneous strain distribution and lower shear stress in central measurement area as a result of slits on arms of specimen.Proposed by Kuwabara et al.27and Wu et al.,8the geometry of the specimen as presented in Fig. 2 was used in this study.TD and RD denote the rolling and transverse directions of specimen, respectively. The specimens were manufactured by laser cutting, and 11 slits with 82 mm in length and 0.2 mm in width were prepared on each arm.
A flexible biaxial tensile testing apparatus(shown in Fig.3)was presented, and detailed introduction could be found in Ref. 11. PID closed-loop controlling code was developed to the PLC unit to control the testing machine precisely.The displacement control error of each arm and the synchronous error of opposite arms could be both as low as 0.02 mm,which ensure that the central region of specimen maintains stationary throughout the tests.For each actuator,the loading capacity is 50 kN and the maximum velocity can reach up to 100 mm/min. The specimen was placed to the origin of coordinates,the rolling and transverse directions were along two loading axes (X-axis and Y-axis in Fig. 3) respectively.
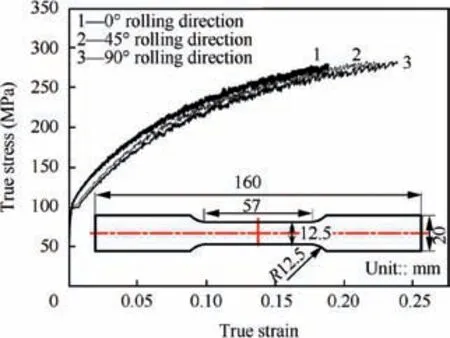
Fig. 1 Uniaxial tensile tests results.
The digital speckle correlation method (DSCM) was applied in testing procedure to measure specimen strain distribution, and Fig. 4 illustrates the schematic implementation of stereo-DIC technique. t0and tndenote the initial and terminated moment of image acquirement,respectively.Stereo camera calibration was firstly carried out for the determination of digital camera parameters.The cruciform specimens decorated by artificial speckle patterns were stretched by the testing machine, and the entire deformed procedure were recorded by imaging device. The three-dimensional coordinate points were calculated based on the subset-based correlation algorithm associated with reconstruct profile. Subsequently, the displacement field and corresponding strain distribution were well estimated.28The whole calculation procedure described above was developed by programing language.
The loading ratio of two actuators was set as Fx:Fy=4:4.Average values of triple repetitive tests were calculated to eliminate man-made error. The yield stress (σb) and r-value (rb)under equi-biaxial tension were obtained, and summarized in Table 3.The calculation process of these two parameters could be found in Ref. 11.
The Yld2000-2d non-quadratic anisotropic yield function,proposed by Barlat et al.29was used in this work. Due to the introduction of anisotropy to yield function, the convexity could be proven theoretically. As eight anisotropy coefficients were contained in the yield function, it became a good candidate to describe the yield behavior of aluminum alloy sheets.30The Yld2000-2d yield function could be expressed as
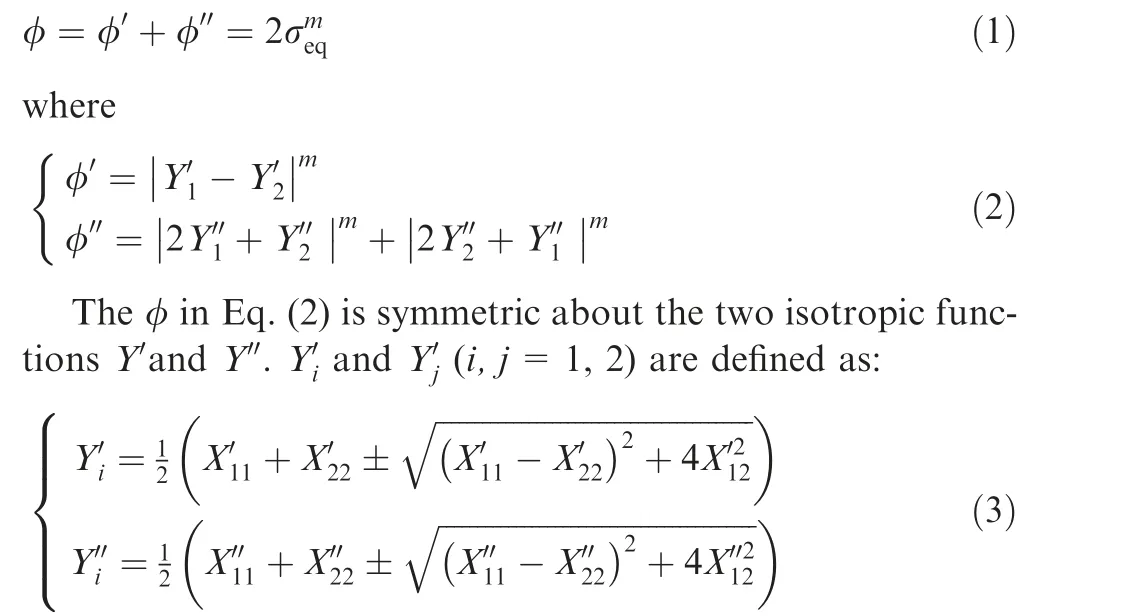

Table 1 Chemical composition of 5754-O aluminum alloy (wt%).

Table 2 Tensile properties of 5754-O aluminum alloy.
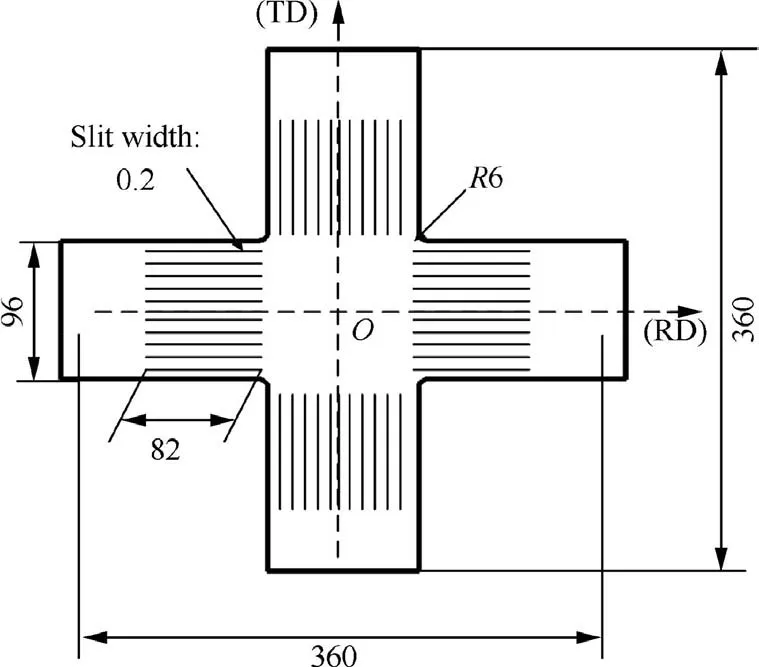
Fig. 2 Cruciform specimen used in biaxial tensile tests (unit:mm).
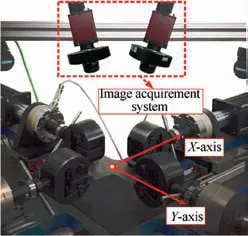
Fig. 3 Biaxial tensile testing apparatus.
The elements of X′and X′′in Eq. (3) could be calculated by linear transformation on stress components σ, as shown in Eq. (4)
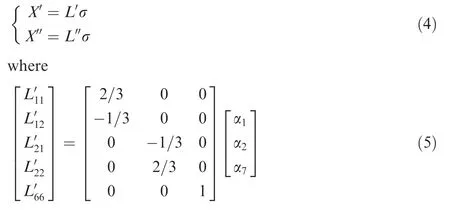

Fig. 4 Schematic implementation of stereo-DIC technique.

Table 3 Yield stress and r-value from equi-biaxial tensile tests.

Here, σ is Cauchy stress tensor and m is set to 8 owing to FCC crystal structure of 5754-O aluminum alloy. With the mechanical properties obtained from uniaxial and equibiaxial tensile tests, eight independent anisotropy coefficients α1~α8in Eqs. (5) and (6) can be calibrated through utilizing numerical algorithm proposed by Ref. 29, and the values of each parameter are listed in Table 4.For the simulations thereinafter, the constitute function was implemented into Abaqus(version 6.14) as user subroutine VUMAT with semi-implicit back-Euler integration algorithm.31
3. Biaxial tensile test with cruciform specimen
3.1. Cruciform specimen design
Numerous researches have demonstrated that the design solution of circular groove thickness reduction in center and concave fillets between arms have more adherents for the investigation on FLC of sheet metals.The dimension of cruciform specimen used in this work was displayed in Fig. 5(a).The length and width of each arm are 210 mm and 50 mm,respectively. The clamped length in biaxial tensile process is 44 mm. The coordinate origin was located at specimen center,and the rolling and transverse direction are regarded as horizontal and vertical axes,respectively.The radius of concave fillet equals to 12 mm, and distances from the center of fillet to two axes (expressed as x and y in the figure) are 26 mm. The central region of the specimen was unevenly milled into a spherical crown with a radius of 250.42 mm. The minimum thickness at specimen center point was marked as t, and the diameter of this thickness reduction region was φ.
In order to optimize the cruciform specimen shape,two significant influence factors φ and t/t0(t0denotes initial thickness of metal sheet) on dimensions were further discussed by simulation analysis. One quarter of finite element model of cruciform specimen was shown in Fig. 5(b). The specimen models were constructed with 4-node shell elements with reduced integration (S4R). Considering the computational efficiency and accuracy,rough mesh size on arms and dense mesh size on central zone were 2 mm and 0.2 mm, respectively. In the simula-tion process, the values of parameter φ and t/t0are listed in Table 5 and the specimen was stretched under equi-biaxial tensile condition.

Table 4 Anisotropy coefficients of Yld2000-2d for 5754-Oaluminum alloy.
3.1.1. The determination of φ
Aiming to optimize the value of parameter φ,t/t0was kept as a constant value of 1/3.With the values of parameter φ listed in Table 5,each simulated result at simulation time of 0.15 s was shown in Fig. 6. At this moment, the displacement loading of horizontal and vertical boundary reached 4.5 mm. It shows that the parameter φ has a significant influence on specimen stress distribution. The simulation results under φ=3, 5, 7,10 mm shows a larger stress distribution on specimen arm,which results in premature facture on arms. However, with the increase of φ, the larger stress distribution appears on the thickness reduction region, and it is beneficial to raise the strain level of thickness reduction region. Whereas for larger values of φ(such as 20,23 mm),the stress concentration on fillets appeared.
The strain and stress of element A at specimen center and element B located at the edge of fillet (seen in Fig. 7) were extracted from the simulation results under different geometrical parameters, which were plotted in Fig. 8. The evolution of major strain of element A along with simulation time was plotted in Fig.8(a).It can be concluded that the smaller value of φ(φ=3,5,7,10 mm)has negligible influence on raising central deformation degree of specimen. Nevertheless, when φ is beyond 15 mm, the strain level is significantly improved. For instance, when the simulation conducted for 0.1 s, the major strains for each geometry are 0.127, 0.126, 0.127, 0.134,0.155, 0.169, 0.178, and 0.190, respectively.
Fig. 8(b) illustrates the evolutions of stress of element B along with major strain of element A. As can be seen from the figure,in some extent,the increase of φ could weaken stressconcentrate of fillet,but not the case for models with larger φ,namely the excessive value of φ will also has a considerable risk of premature fracture on arms. Considering the effect of φ on both deformation degree of central region and fillets,15 mm was adopted as the optimal value of φ.

Table 5 Values of two discussed parameters.
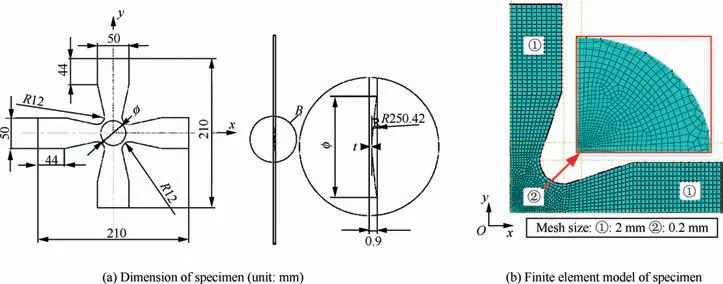
Fig. 5 Dimension and finite element model of cruciform specimen.
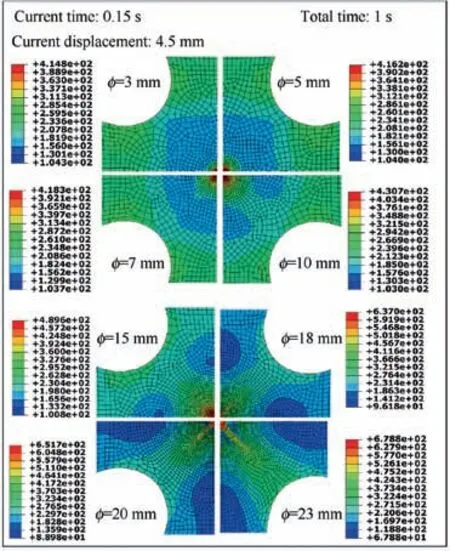
Fig. 6 Stress distribution of cruciform specimens with different diameters φ of central region.
3.1.2. Determination of t/t0
In this section, φ was fixed as 15 mm, and parameter t/t0was optimized. With values of t/t0listed in Table, the simulations were conducted, and stress distributions from the simulation results are displayed in Fig.9.It shows t/t0also has great influence the central deformation degree.Fig.10(a)illustrates principle strain curves of element A. The strain level would be improved with decrease of t/t0at the same simulation time.When t/t0is equal to 1/2 and 3/4, the maximum strain were both no more than 0.05. The evolutions of principle stress of element B along with major strain of element A were shown in Fig. 10(b). In comparison to other two models, element B suffered larger stress when t/t0is equal to 1/2 and 3/4, and the strain level of element A was extremely low. In contrast,for the results of t/t0=1/4 and 1/3, maximum strain values of element A are large enough to characterize the forming limit of material and the stress values of element B were sufficient to avoid premature facture phenomenon. Nevertheless, for the situation of t/t0=1/4,wrinkling would occurs on the contrary side of metal sheet by mechanical manufacturing. Therefore,the geometric dimension of cruciform specimen with φ=15 mm and t/t0=1/3 was finally adopted.
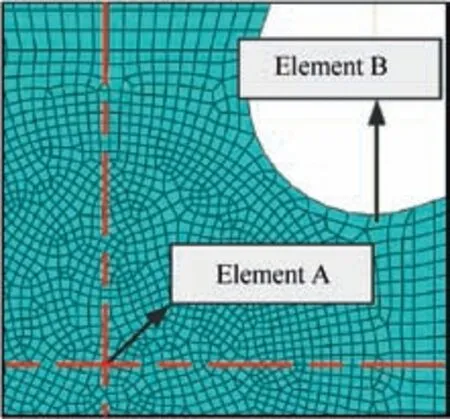
Fig. 7 Position of two elements observed.
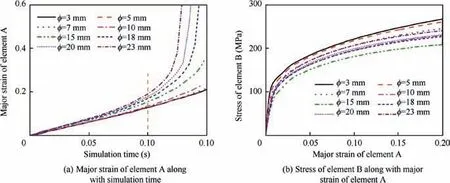
Fig. 8 Strain evolution of two elements for each model with different φ.

Fig. 9 Stress distribution of cruciform specimens with different thickness reduction.
As non-uniform thickness of central region,the strain measurement area and shear stress component have significant influence on experimental result. Thus it is essential to further validate the feasibility of the geometry with φ=15 mm and t/t0=1/3. Fig. 11(a) illustrates shear stress distribution, from which it is clear that the shear stress is gradually decrease from fillet to center region. In addition, the principal stress of two directions and shear stress of each node along tagged direction were extracted and shown in Fig.11(b).With deformation proceeded, the principal stress along two directions of central nodes gradually increased with similar tendency. However,the shear stress is far lower than the corresponding principal stress, which is almost closed to zero in the central region of specimen. That is, the impact of the shear stress on deformation of central region is tiny enough, and reasonable ignored.As a result, the geometry of cruciform specimen proposed in this work can be recommend as a good candidate to characterize the FLC of metal sheet.
3.2. Experimental procedure and results
The 5754-O aluminum alloy sheet was processed into the proposed geometry with diameter of thickness reduction of 15 mm and minimum thickness in central region of 0.3 mm.The biaxial tensile tests were conducted on the apparatus mentioned in previous section.The sample was clamped in centre of machine and stretched with a velocity of 5 mm/min until fracture happened in the center.The stroke ratios of x-axis and y-axis were set to 4:1, 4:2, 4:3 and 4:4. The deformation of specimen was measured by DSCM. The central region of specimen was selected as a region of interest (ROI), and the corresponding calculation configuration is expressed in Fig. 12.
The definition of the onset of necking during tests has signification influence on FLC.In this work,the first derivative of strain rate difference between two neighboring points with respect to time was applied to determine FLC, which is expressed as follows:


Fig. 10 Stress and strain evolution of two elements for each model with different t/t0.
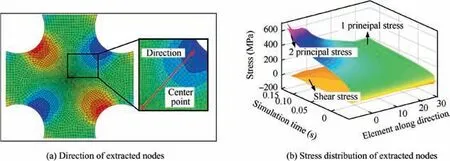
Fig. 11 Direction and the stress distribution of extracted nodes.
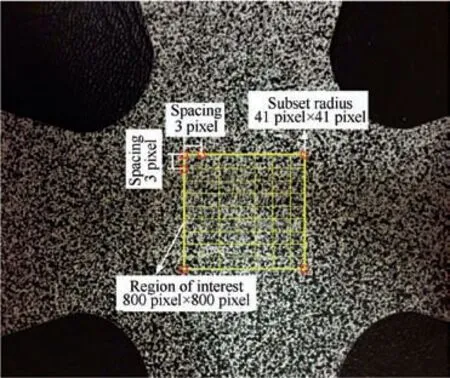
Fig. 12 Principle calculation configuration of DSCM.
In order to investigate the effect of strain path change on formability, the cruciform specimens were carried out under various combined loading paths with different levels of prestrain. As shown in Fig. 14, the pre-strain stage was firstly applied in uniaxial tension along rolling direction,and the following deformation was followed by controlling stroke ratios of 4:1 and 4:4 for two axes. The displacements of different groups in pre-strain step and the corresponding levels of prestrain measured by DSCM were listed in Table 6.
The pre-strain path and final forming limits under different pre-strains were determined and depicted in Fig.15.As can be seen from the figure, the strain path change has a great influence on the material formability.The pre-strained deformation applied in this study promotes FLC position of the investigated material. For instance, with the introduction of 8%pre-strain,the major limit strain at balance biaxial tensile state shifted up from 0.26 to 0.31. The deviation indicates that the pre-strain employed could enhance formability of materials.This phenomenon was referred as‘dynamic shift of the limiting strains’.32
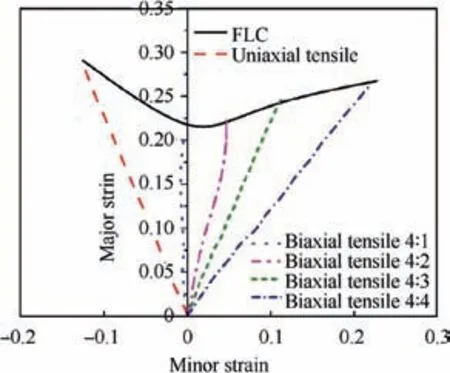
Fig. 13 Experimental FLC without pre-strain.
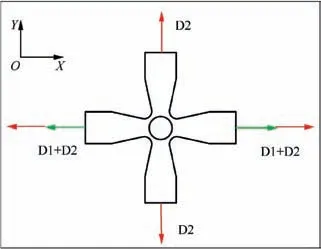
Fig. 14 Two different kinds of combined loading path.

Table 6 Pre-displacement and the corresponding levels of prestrain.
3.3. Simulations of biaxial tensile tests
A numerical model of the proposed cruciform specimen was established with Abaqus. The Yld2000-2d yield function and Swift hardening law were adopted as material model.The corresponding parameters have been determined and are listed in Tables 2 and 4.Two groups of numerical simulations with different displacement constraints were performed according to the experiments. The stroke ratios of two directions in group 1 adhere to 4:1, 4:2, 4:3, 4:4, while for the other group, the pre-strain was firstly imposed and then followed with plane tension and equi-biaxial tension.
It is worth noting that for the case of subsequent equibiaxial tension, the determination of the limit strains was in accordance with the description in Eq. (7), and the evolution of λ with time was given in Fig. 16. All the curves were expected to be remained stable at the early stage until a rapid increase occurred at a time period of 0.12 s, which implied the‘‘pseudolocalization” at central region of specimen. Afterwards, a new increase appeared and sustained to the critical value, at this moment the real necking was generated. Consequently, finite element method of the biaxial tensile test can effectively predict the tendency of pseudolocalization and necking of the specimen.
The numerical and corresponding experimental results were depicted in Fig. 17. As can be seen from the figure, a good agreement between the numerical FLCs and experimental results was observed,which well validates the numerical simulation efforts.
4. Prediction
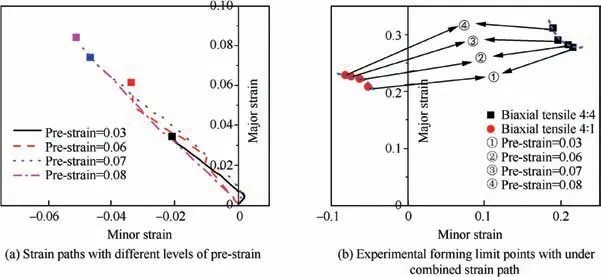
Fig. 15 Experimental FLCs of biaxial tensile tests.
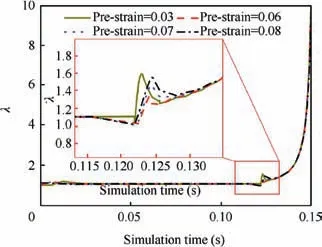
Fig. 16 Evolution of λ with the simulation time in FEM.
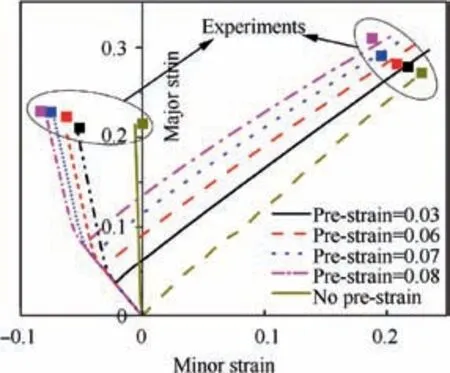
Fig. 17 Numerical strain paths and experimental limit strains.
The M-K model was widely adopted to theoretically investigate the effect of strain path change on the FLC of materials.In M-K instability theory, an initial thickness imperfection is assumed on the surface of the original sheet metal,which could be caused by many factors, such as local grain size variation,texture, alloy elements.33The value of initial thickness imperfection will affect the level of metal sheet formability, and is also the key to obtain the predicted FLC. An initial groove was introduced along the transverse direction of sheet model to characterize this defect. Fig. 18 schematically illustrates the geometry of M-K model.σ1and σ2denote major and minor stress.Zone A and Zone B represent the deformation areas outside and inside groove,respectively. The initial imperfection coefficient f0was defined by the thickness ratio of these two different zones,as following expression

Fig. 18 Schematic diagram of M-K model.
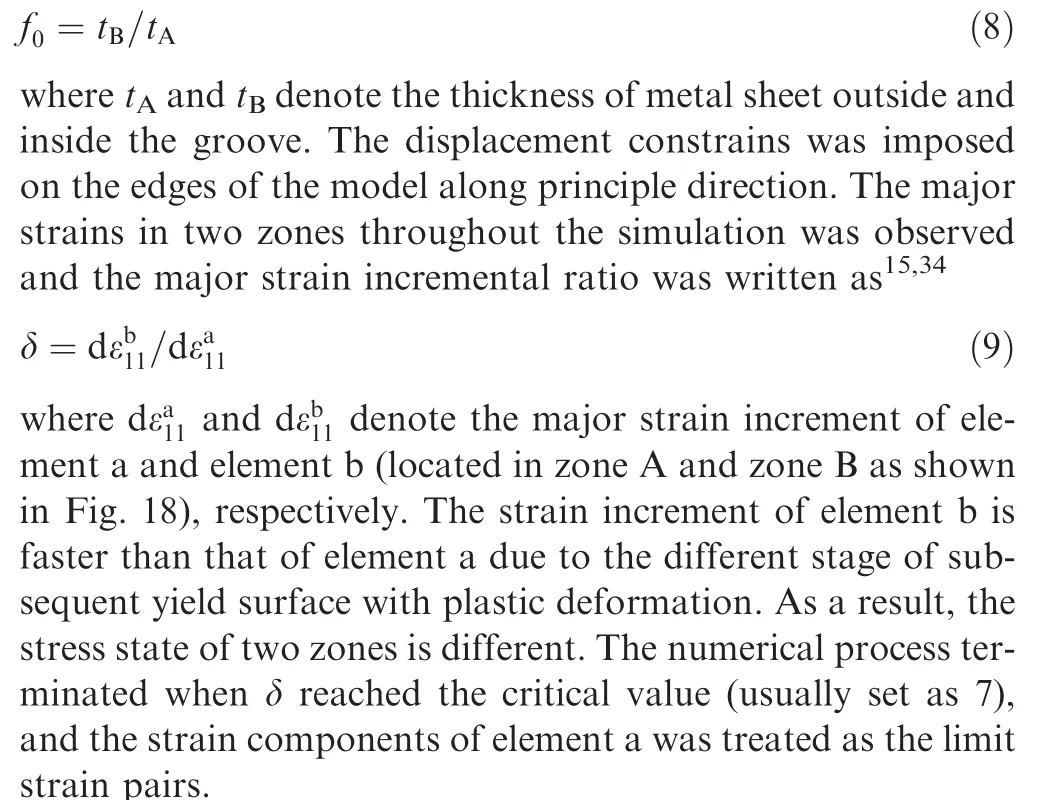
In this study, M-K model was simulated with commercial software Abaqus. A quarter of FE M-K model was modeled owing to the symmetrical properties, as diagramed in Fig.19.In particular, for the purpose of eliminating the effect of groove on strain path of zone A, the width of groove is set as 1 mm, which is relative small to the whole width of specimen.The thickness of zone A was 0.9 mm,while the thickness of zone B was determined by Eq. (8). The mechanical properties were assigned to the finite element model which was verified in Section 3.1. The S4R element with size of 0.05 mm was applied to mesh sheet for the consideration of mesh sensitivity discussed by Ozturk et al.35The strain increments of two zones were firstly determined,and the displacement restriction transformed from the strain could be obtained. The displacement boundary conditions loaded on the edge of model was shown as red arrows shown in Fig. 19.
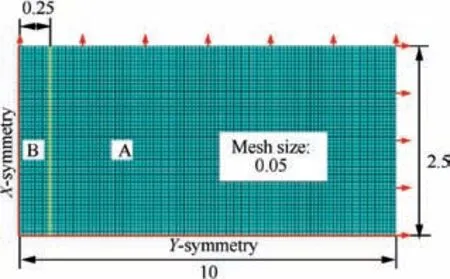
Fig. 19 FE M-K model (unit: mm).
Due to highly sensitivity of M-K model to initial imperfection coefficient, f0is considered as an essential parameter in prediction. In general, the calibration strategy of f0is chose by the comparison between numerical results and experimental ones. In order to identify the appropriate initial imperfection coefficient, FE M-K model was performed with various f0(0.987,0.992,and 0.997)under different strain paths.The predicted limit strains of each model were collected and compared with experiments in Fig.20.The initial imperfection coefficient has a great influence on the predicted FLCs. Meanwhile, the value of f0could also reflect formability of sheet metal. The limit strains of different models under the same strain path elevated with the increase of f0. When the value of parameter f0was set to 0.992, there is a minimum gap of limit strains between experimental and numerical results.The initial imperfection coefficient in this work was therefore determined as 0.992.
In order to investigate the effect of the pre-strain on the formability of sheet metal,FE M-K model with suitable value of f0(0.992) was implemented under uniaxial pre-strain tension. As shown in Fig. 21, the loading procedure was decomposed into two steps, first-step was conducted until the strain outside groove reached the preset strain degree and subsequent loading followed. The pre-major strains applied were listed in Table 7.

Fig. 20 Predicted FLC with various f0.
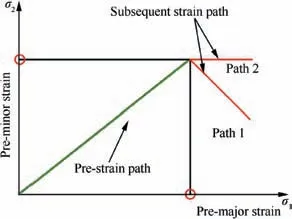
Fig. 21 Loading process schematic in FE M-K model.
The numerical FLCs in strain space and corresponding equivalent stress pairs are plotted in Fig. 22, respectively. As depicted in Fig. 22(a), FE M-K model could completely predict limit strains of the studied sheet under different prestrain conditions. Besides, the comparison of the FLC under linear strain paths with curves under pre-strain conditions shows considerable deviation, which demonstrates the limit strains have strongly dependent on strain path. With the increase of pre-strain,the major limit strains under plane strain state and equi-biaxial tensile state were changed from 0.23 and 0.28 to 0.27 and 0.33, respectively. This effect of pre-strain on the FLC was consistent with the phenomenon in previous biaxial tensile tests and simulations. In contrast, the shape of the equivalent stress curves under different pre-major strains,shown in Fig. 22(b), have similar tendencies and are almost coincident with each other, which inferred that pre-strain has negligible effect on equivalent stress.
The evolutions of major strain increment ratio δ along with simulation time under different levels of pre-strain were observed and diagrammed in Fig. 23. For the case of subsequent strain path ρ=-0.2 (shown in Fig. 23(a)), δ remained stable during early stage until it reached the critical value when the simulation proceed 0.35 s. For the case of subsequent strain path ρ=1 (shown in Fig. 23(b)), the initial trend of δ was similar,however,the change of strain path caused a rapid increase of δ. The values of peak in different simulations increased with amplitude of pre-strain. After that, a stable deformation state was sustained until a new rise appeared again and localization began to generate at this time.The final rupture of specimen could be observed when δ exceeded critical value.
In order to better understand this process,the evolutions of major strain inside and outside groove are illustrated in Fig. 24. In these two types of strain path change, the value of δ is close to 1 since the major stain increments in two regions were almost equal with each other during the pre-strain stage.When subsequent loading stage commenced,the linear increasing stress state in pre-strained stage rotated owing to theabrupt load path change.36Different from the case of subsequent strain path ρ=-0.2,when the stress state changes from uniaxial tensile state to the equi-biaxial tension state, there must be a moment that the stress state inside the groove reaches the plane strain state, and results in a sharp increase of δ. Therefore, it is reasonable to conclude that the transformation of stress state outside and inside groove contributes to the occurrence of pseudolocalization.

Table 7 Pre-major strain of FE M-K model.
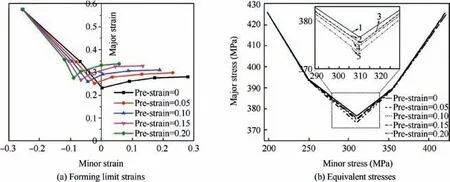
Fig. 22 Numerical limit strains and equivalent stresses under different pre-major strains.
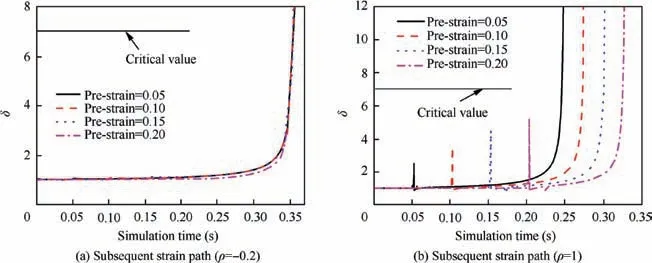
Fig. 23 Evolution of δ along with simulation time.
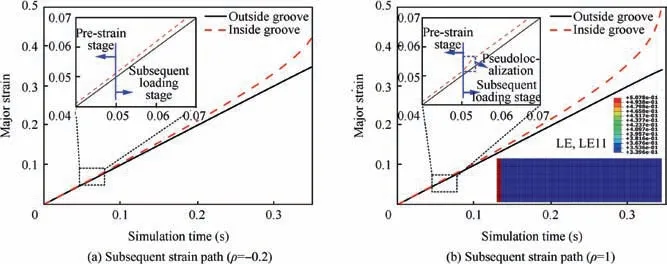
Fig. 24 Major strain inside and outside groove along with simulation time.

Fig. 25 Effect of strain path change on FLC.
Theoretically, the evolutions of stress states for two zones in FE M-K model along with the yield surface are illustrated in Fig.25.The stress states inside groove transforms from initial stress state B0to the plane stress state B1, while the stress state outside the groove changes from A0to the limit stress state A1. When pre-strained path is negative and the subsequent loading path is positive, the stress state outside and inside groove transforms according to paths of A0-A0-A1and B0-B0-B1, respectively. During this shifting process, the subsequent stress state move towards plane stress state A*, and the major stress increment outside groove got smaller, which results in the ascending trend of δ. When plane stress state is passed, the increase of major stress increment would lead to the decrease of δ. In contrary, when pre-strained path, as well as subsequent strain path, are both negative, the strain path change does not pass through plane stress state,and no sudden increase of δ occurs.That is why in this study,pseudolocalization procedure happen when following subsequent loading path ρ is equal to 1,but does not occur when subsequent strain path ρ is equal to -0.2.
5. Conclusion
The formability of 5754-O aluminum alloy sheet under different loading paths was investigated in both numerical simulations and experimental validations. The mechanical properties were firstly obtained, and the optimized geometry of cruciform specimen was proposed by considering two significant factors. The comparison between the numerical FLCs and experimental results demonstrates the validation of finite element model. Finally, the FE M-K was adopted to analyze the effect of pre-strain on formability of sheet metal. The primary conclusions are listed as follows:
(1) The biaxial tensile test is verified to be a promising approach to investigate the limit strains of sheet metal.The cruciform specimen with geometry of φ=15 mm and t/t0=1/3 thickness reduction in central region could be proposed as a recommended cruciform specimen.
(2) The finite element method of cruciform specimen shape shows good reliability for predicting FLCs of 5754-O aluminum alloy under different loading paths. Besides,the shift of stress state characterized by strain path change would be attribute to the increase of the major strain increment ratio, and represents as phenomenon of pseudolocalization.
Acknowledgements
This work was supported by the National Natural Science Foundation of China (Grant No. 51875027) and the China Postdoctoral Science Foundation (No. 2018M630058). The authors wish to acknowledge assistances of the program for the financial support.
 CHINESE JOURNAL OF AERONAUTICS2020年8期
- CHINESE JOURNAL OF AERONAUTICS的其它文章
- Structural dynamic responses of a stripped solar sail subjected to solar radiation pressure
- Dynamic coefficients and stability analysis of a water-lubricated hydrostatic bearing by solving the uncoupled Reynolds equation
- Rotor airfoil aerodynamic design method and wind tunnel test verification
- A heuristic cabin-type component alignment method based on multi-source data fusion
- Effect of curing condition on bonding quality of scarf-repaired composite laminates
- Influence of non-equilibrium reactions on the optimization of aerothrust aeroassisted maneuver with orbital change
