A heuristic cabin-type component alignment method based on multi-source data fusion
Hao YU, Fuzhou DU
School of Mechanical Engineering and Automation, Beihang University, Beijing 100083, China
KEYWORDS Alignment strategy;Force-driven assembly;Heuristic alignment method;Multi-source data fusion;Relative pose calculation
Abstract In cabin-type component alignment, digital measurement technology is usually adopted to provide guidance for assembly.Depending on the system of measurement,the alignment process can be divided into measurement-assisted assembly (MAA) and force-driven assembly. In MAA,relative pose between components is directly measured to guide assembly, while in force-driven assembly, only contact state can be recognized according to measured six-dimensional force and torque(6D F/T)and the process is completed based on preset assembly strategy.Aiming to improve the efficiency of force-driven cabin-type component alignment, this paper proposed a heuristic alignment method based on multi-source data fusion.In this method,measured 6D F/T,pose data and geometric information of components are fused to calculate the relative pose between components and guide the movement of pose adjustment platform.Among these data types,pose data and measured 6D F/T are combined as data set.To collect the data sets needed for data fusion,dynamic gravity compensation method and hybrid motion control method are designed. Then the relative pose calculation method is elaborated, which transforms collected data sets into discrete geometric elements and calculates the relative poses based on the geometric information of components.Finally, experiments are conducted in simulation environment and the results show that the proposed alignment method is feasible and effective.
1. Introduction
Large component alignment is one of the key processes in the final assembly of airplanes and missiles,substantially affecting the performance of products. Driven by the requirements for high precision and high efficiency assembly, digital geometric measurement systems and force sensors are used to provide guidance for assembly.1-3
Digital geometric measurement systems can measure feature points or point cloud of components and the pose of component can be solved based on measurement results. With the development of digital measurement technology and pose flexible adjustment technology, measurement-assisted assembly(MAA)has been applied to make the assembly process flexible and accuracy.4,5Chen,et al.6used laser tracker to measure the relative pose between components in airplane wing-fuselage alignment.For assembly of non-rigid components,Falgarone,et al.7,8introduced a flexible best fit positioning method which takes the deformation of components into consideration. Li,et al.9proposed a multi-objective optimization model of pose adjustment for aircraft fuselage joining assembly and considered engineering constraints when calculating component pose based on measured feature points.Zhu and Zheng10proposed a large component assembly method based on key assembly characteristics, the feature point of which can be measured by laser tracker, and calculated the target pose with multiple-objective particle swarm optimization algorithm.The application of MAA can quantitatively evaluate assembly state and improve assembly accuracy.
For components with high stiffness, force-driven assembly is also an applicable method. By measuring the interaction force and torque between components, the contact state can be estimated and used to guide assembly.This process is quite like peg-in-hole assembly except for the large size and heavy weight of assembly objects, so relative research on peg-inhole could be contributive to large component alignment.Kim,et al.11proposed a hole detection method based on shape recognition,in which the coordinates of contact points are calculated and used to fit the shape of peg.Newman,et al.12analyzed the relationship between measured torque and position deviation between peg and hole and estimated contact state based on the variation of torque. Qiao, et al.13,14studied the contact configurations of different contact states and proposed an assembly strategy which can eliminate position deviations gradually. As for the force-driven assembly of large components, valuable progress has been made in recent years. In robotic aircraft structures assembly, Jonsson, et al.15,16calculated the relative pose between rib and jig based on force feedback.Inspired by the peg-in-hole assembly method,Sun17and Wen18realized compliant alignment of cabin-type components using parallel mechanism which is integrated with force sensor.The research of Sun focuses on the impedance control method by which the parallel mechanism moves accordingly to measured six-dimensional force and torque (6D F/T). Wen proposed a compliant alignment strategy which can be summarized as shown in Fig.1 where solid points indicate contact points and bold arrows denote controlled degree of freedom (DOF). For movable component, the translational DOF is denoted by x,y,z( ) and rotational DOF is denoted by α,β,γ( ). In different contact state, the movable component moves in corresponding DOF and transformation between contact states is recognized according to measured 6D F/T.From Step 2 to Step 6,the deviation in x,z,α,β and y is eliminated gradually. By appropriate assembly strategy and control method, force-driven assembly can enable low-cost automation.
In terms of multi-stage assembly, some scholars combine the advantages of MAA and force-driven assembly to improve assembly efficiency. Aiming at the peg-hole assembly problem of aircraft duck wings and tails, Li19proposed an automated and flexible assembly method, which constrains pose error to a certain range with laser tracker firstly and then uses passive compliant mechanism to achieve local high precision assembly.In airplane sidewall assembly, Roveda, et al.20coarsely adjusted the pose of sidewall based on vision system and finished assembly in force control. In these methods, geometric information of components is measured for coarse positioning and force feedback is applied to realize local high-precision assembly.
It can be inferred from the above researches that the assembly efficiency of force-driven assembly is limited mainly because the relative pose of components is hard to be determined. In force-driven assembly, the pose of movable component is adjusted based on preset strategy and 6D F/T is monitored in real time. Although 6D F/T is used to recognize the change of contact state,the exact contact state or the relative pose between components is hard to be obtained. To improve the efficiency of force-driven cabin-type component alignment, this study presents a heuristic alignment method,which can calculate the relative pose between components based on multi-source data fusion. The fused data types include measured 6D F/T, pose data and the geometric information of components. During alignment process, these data types are not independent of each other. The measured 6D F/T is determined by the relative pose between components and the shapes of components. Taking this relationship of them into consideration, a multi-source data fusion method is designed. Measured 6D force/torque and pose data are transformed into geometric elements. Then the relative poses are calculated based on the geometric information of components. In this way, the relative pose between components can be calculated without geometric measurement, which is valuable for improving the efficiency of force-driven alignment.
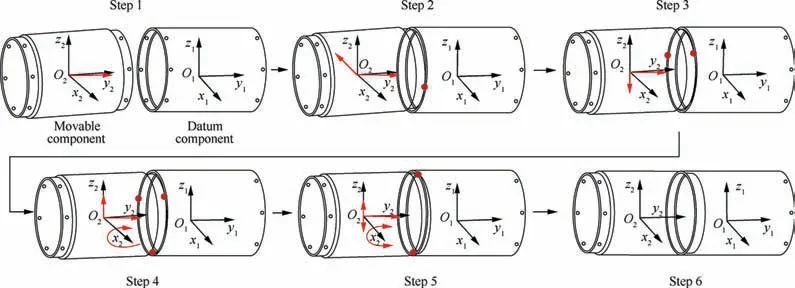
Fig. 1 Schematic diagram of compliant alignment strategy based on 6D F/T.
The remainder of this paper is organized as follows. Section 2 presents the overall description of heuristic alignment strategy, in which the gravity compensation method and hybrid motion control method are also introduced. Section 3 elaborates the relative pose calculation method which fuses measured 6D F/T, pose data and geometric information of components. In section 4, experimental verification is carried out by simulation and the experimental results are analyzed and discussed.Finally,the conclusions are presented in section 5.
2. Heuristic alignment strategy based on relative pose calculation
Force-driven alignment method adjusts the pose of cabin-type component based on the measurement results of contact force between components, and Fig. 2 shows the composition of a usual alignment system. Odand Omrepresents the coordinate system of datum component and movable component respectively. Force sensor is mounted between movable component and pose adjustment platform with Osrepresenting its coordinate system. The coordinate systems of pose adjustment platform include Opmand Ops, in which the former is for moving platform and the latter is for stationary platform.
2.1. Analysis of typical contact states
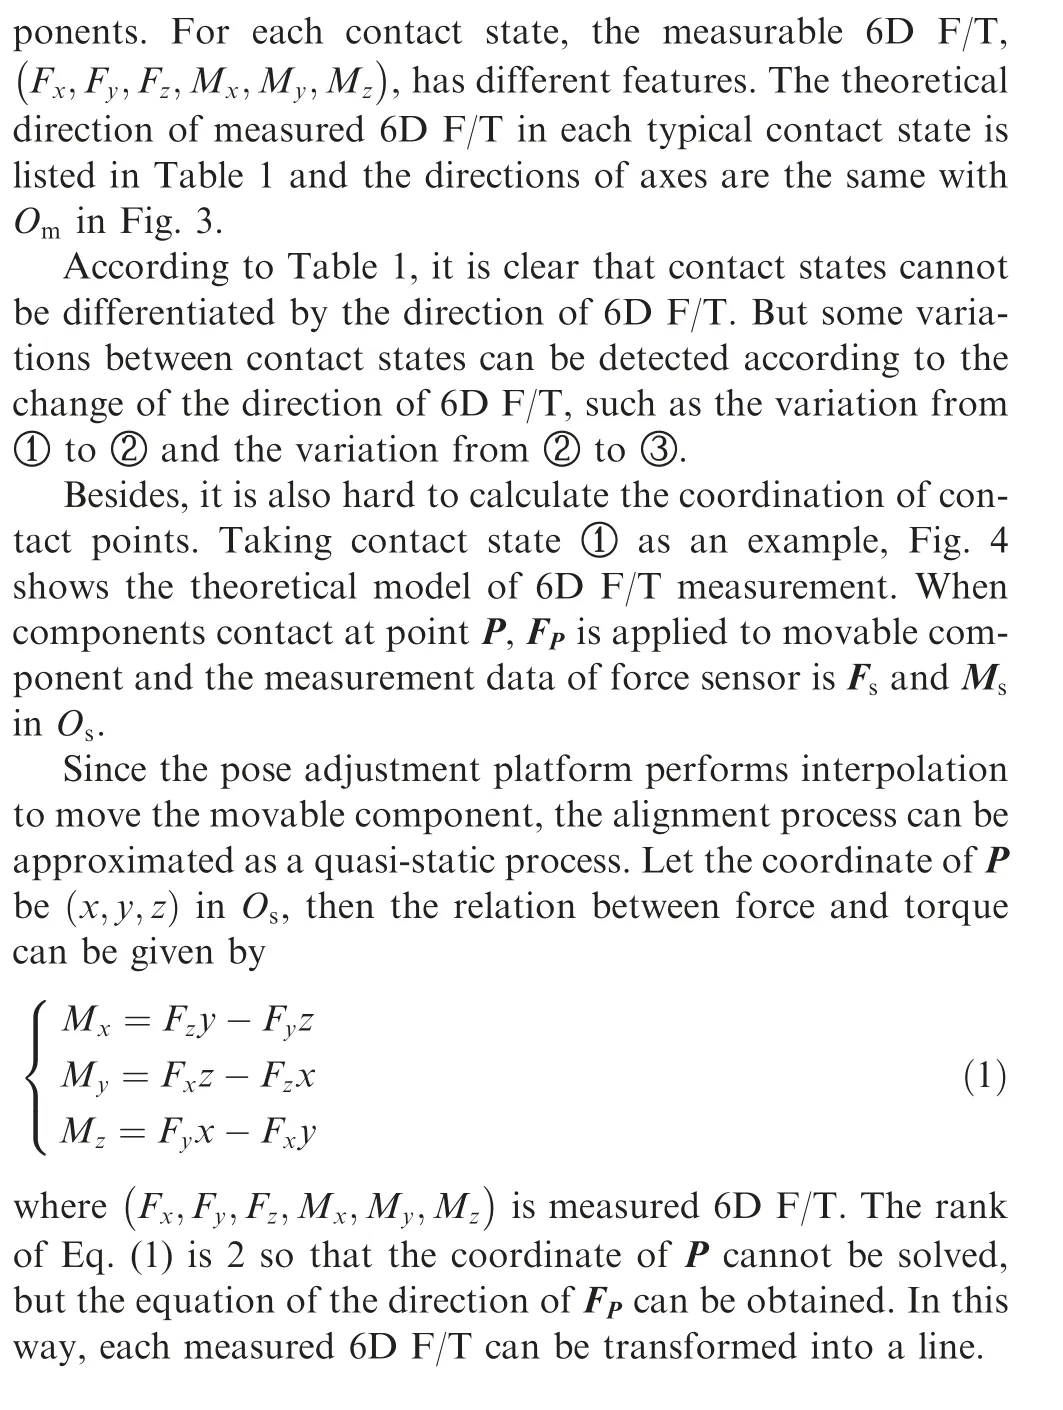
During the force-driven alignment process, the components have different contact states as the platform adjusts the pose of movable component.Fig.3 shows the typical contact states occurring in the alignment process, which includes alignment stage and insertion stage. In alignment stage, the end face of movable component has not come into datum component,and the components need to be aligned to control their concentricity. In insertion stage, the movable component is partly inside the datum component and it should move to the target pose without jamming. After gravity compensation,21,22the measured 6D F/T is only caused by the contact between com-
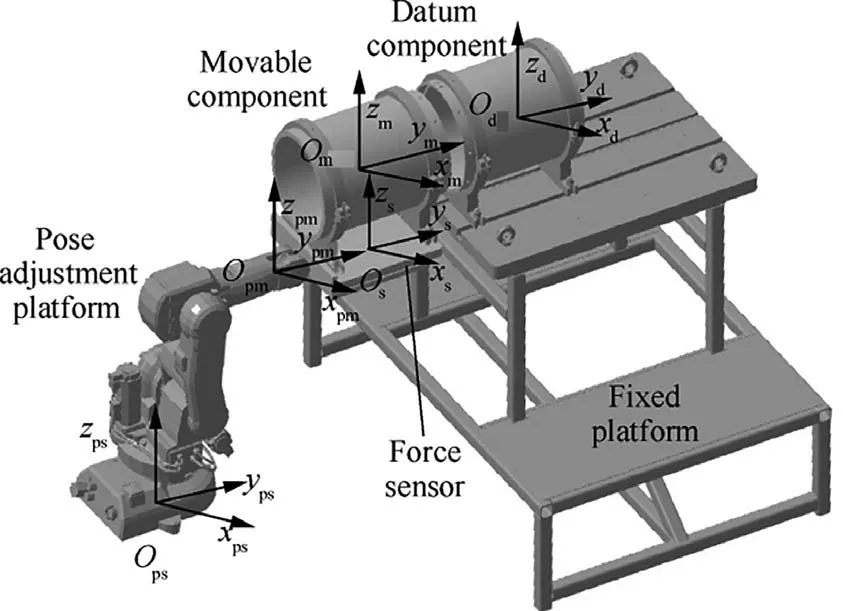
Fig. 2 Force-driven alignment system for cabin-type component.
2.2. Heuristic alignment strategy for cabin-type component
Based on the above analysis on contact states and calculation of geometry,a heuristic alignment strategy is designed to make the alignment of cabin-type components efficient and relative pose between components calculatable, which is shown in Fig. 5. The alignment process is completed through changes between different contact states which can be judged by the variation of 6D F/T. When certain contact state is reached or calculation is completed, the pose adjustment platform changes the adjusted DOF to complete alignment.
Before components contact, the gravity compensation is carried out. The effect of gravity is compensated dynamically so that the measured 6D F/T is only caused by the interaction force between components. Then the pose of movable component is coarsely adjusted to make sure contact state ①can be reached. In alignment stage, the strategy restricts the concentricity between components by hybrid force/position control and calculates the relative poses based on multi-source data fusion. As shown in Fig. 5, the contact state varies from ①to ②firstly.In this process,the relative pose between movable component and the moving platform of pose adjustment platform is calculated. When contact state varies from ②to ③,the relative pose between movable component and datum component is calculated.The detailed calculation method is elaborated in section 3. Based on these two relative poses, the current and target pose of movable component can be determined.Then in insertion stage,the movable component moves compliantly to reach the target pose without jamming.
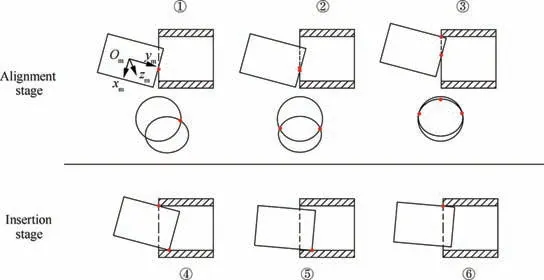
Fig. 3 Typical contact states in force-driven alignment.

Table 1 Theoretical direction of 6D F/T in typical contact states.

Fig. 4 Theoretical model of 6D F/T measurement.
2.3. Dynamic gravity compensation method
In order to compensate the effect of gravity,the vector of gravity in Osand the coordinate of center of mass in Osshould be calculated. The schematic diagram of dynamic gravity compensation is shown in Fig. 6, where C is the center of mass,G represents the vector of gravity and R represents the orientation of force sensor. For each R, it is calculated according to Rpand Rs.Rpis the orientation adjustment of the platform and Rsis the orientation relationship between the moving platform and force sensor. Since the moving platform and force sensor are fixed by designed fixture,Rsis obtained by mechanical positioning.
Because gravity is always directed downward,the measured G will change when the orientation of Oschanges.To compensate gravity dynamically,the relation between G and R should be obtained. For a single orientation, the measured force is equal to the gravity and the vector of gravity can be obtained by
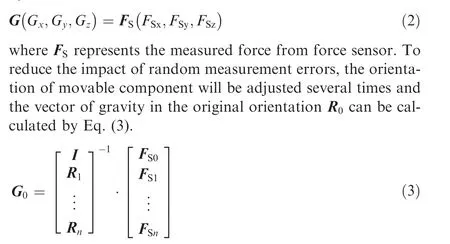

The center of mass C is the average position of movable component and the ring fixture, and its position in Osdoes not change during pose adjustment.The coordinate of C is calculated based on the relationship of measured torque and measured force, which is shown in Eq. (4).
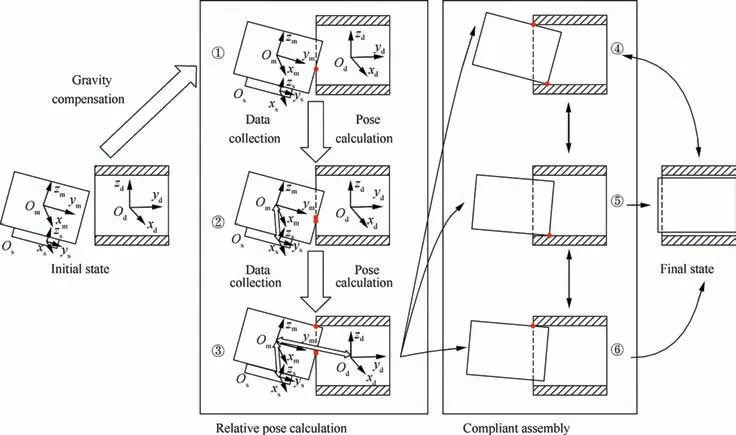
Fig. 5 Schematic diagram of heuristic alignment strategy.
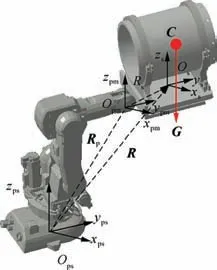
Fig. 6 Schematic diagram of gravity compensation.
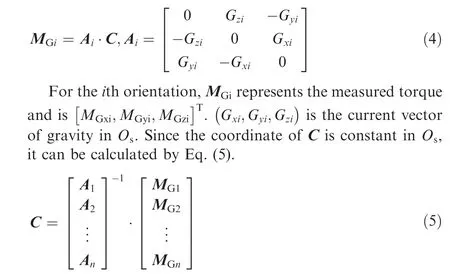
During the alignment process, the effect of gravity is compensated dynamically by

where FSand MSis the measurement data of force sensor.Thus the final output F and M is only caused by the contact between components.
2.4. Hybrid motion control method for data collection in alignment stage
To collect data for relative pose calculation, hybrid motion control method is designed for one-point and two-point contact states in alignment stage, which are the contact states ①and ②in Fig.3.Taking into account that this alignment strategy is applied in muff-coupling of cabin-type components, the alignment is simplified as a peg-in-hole model.
2.4.1. Hybrid motion control in one-point contact state
In one-point contact state, the control strategy is shown in
Fig.7 with Opsdenoting the coordinate system of pose adjustment platform and Cmdenoting a local coordinate system at the center of movable component’s end face. Force control is applied in yps-axis and position control is applied in zps-axis and the movement directions are shown by arrays in Fig. 7.In this way the components can keep one-point contact state until two-point contact state is reached. The measured force is converted to Opsto monitor the change of contact state.When Fzincreases sharply, contact state ②is reached.
2.4.2. Hybrid motion control in two-points contact state
In two-points contact state, the control strategy is shown in Fig. 8. Force control is still applied in yps-axis and position control is applied in xps-axis.

Fig. 7 Hybrid force/position control in one-point contact state of alignment stage.
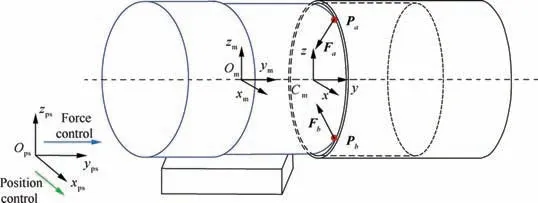
Fig. 8 Hybrid force/position control in two-points contact state of alignment stage.
By this control strategy, the components can keep twopoints contact state. When Fxincreases sharply in negative direction of xps-axis,contact state ③is reached and the hybrid motion control is finished.
3. Relative pose calculation based on multi-source data fusion
3.1. Collected pose and 6D F/T data set
In the alignment process, the measured 6D F/T will change accordingly when pose adjustment platform moves the movable component. Thus the pose adjustment and measured 6D F/T are combined as data set. For each interpolation step of the platform, a data set is collected and Fig. 9 shows its structure.
Each data set contains current pose adjustment of the platform and measured 6D F/T from the force sensor.To calculate the needed relative poses,the data set is transformed into geometric element as shown in Fig. 10.
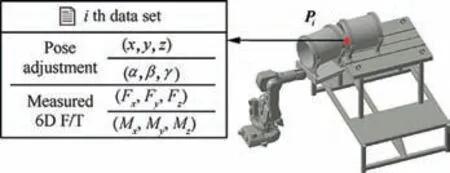
Fig. 9 Structure of data set collected during alignment stage.
According to Eq. (1), the measured 6D F/T can be transformed into a line, which represents the direction of contact force and passes contact point.The initial equation of the line is in the coordinate system of force sensor Os, as shown in Fig. 10(a). Combined with the current pose adjustment, the equation can be converted to the coordinate system of the platform Ops, as shown in Fig. 10(b). The following relative pose calculation methods are both based on this transformation.
3.2. Calculation of the relative pose between pose adjustment platform and movable component
During one-point contact state in alignment stage, the single contact point P moves along the edge of the end face of movable component. And when one-point contact state ends, P will change greatly. Fig. 11 shows the position change of P in the local coordinate system Cmand the contact points are clustered into three groups. Group PAcontains usual contact points in this state, while group POand PBcontain contact points collected at the end of one-point contact state. Group POappears because the deviation along z-axis has been eliminated and two-points contact state is reached, and its position is explained in section 3.3. Group PBmeans that the sign of deviation along z-axis has changed, yet the movable component is still in one-point contact state. Depending on the positioning precision of pose adjustment platform, POor PBis collected when the motion control for one-point contact state ends.When calculating the pose of Cm,only group PAand PBis used.
For each contact point, the line’s equation in Osis calculated and the ith equation can be expressed as Eq. (7). After this calculation,a set of lines has been obtained, but the coordinates of these contact points are still unknown.

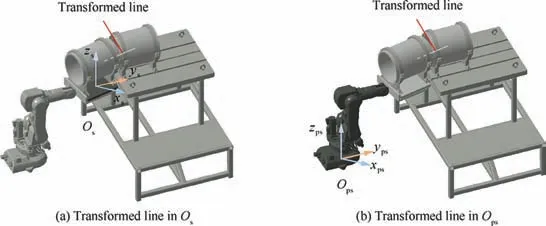
Fig. 10 Schematic diagram of the obtained geometric element.

Fig. 11 Change of contact point in one-point contact state of alignment stage.
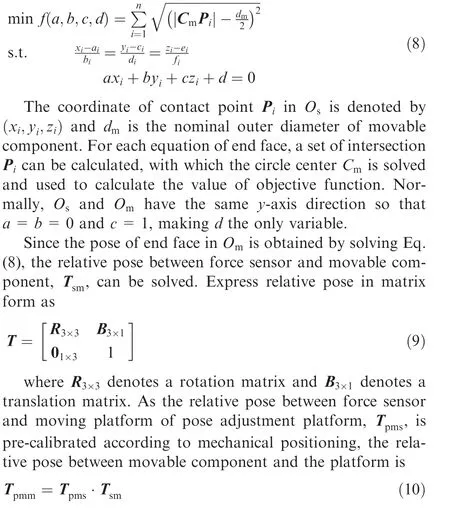
Let the equation of a plane in Osbe ax+by+cz+d=0,and the contact points are the intersections of this plane and the lines as shown in Fig. 12.
According to the calculated contact points, a circle can be fitted by the method of least squares. Considering the directions of the lines are divergent,the diameter of fitted circle will be the same as the nominal outer diameter of movable component only when the plane is on the end face of movable component. To calculate the equation of the end face in Os, an optimization model is formulated as shown in Eq. (8).
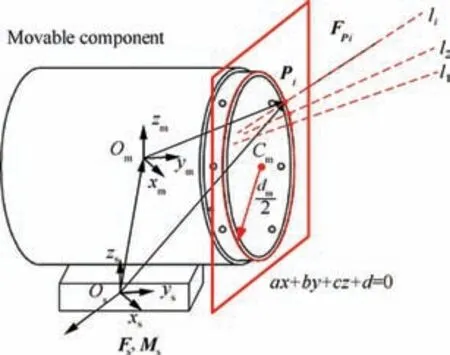
Fig. 12 Schematic diagram of relative pose calculation between movable component and force sensor.
3.3.Calculation of the relative pose between movable component and datum component
In one-point contact state of alignment stage, the position of contact point on datum component is barely changed, which is why the relative pose between components cannot be solved.When the components reach two-points contact state, contact points on both components move in corresponding coordinate system respectively. Fig. 13 shows position change of contact points in two-points contact state with Paand Pbrepresenting two contact points. Although Faand Fbare applied at Paand Pbrespectively,the force sensor can only measure the resultant force of them.Thus an equivalent contact point,Pc,is created to indicate where the resultant force is applied.By applying the motion control method shown in Fig.8,the components of Faand Fbsatisfy so the resultant force only contains components along x-axis and y-axis.Based on Eq.(11)and taking the symmetry of component into account, Pcis at the midpoint of PaPband moves along x-axis during alignment process.
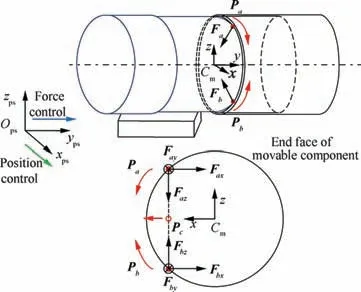
Fig. 13 Change of contact points in two-points contact state of alignment stage.

By Eq. (7), the direction of resultant force, lf, can be obtained. As the equation of end face has been calculated,the coordinate of Pccan be solved. Adding an auxiliary line at Pcand perpendicular to the movement direction νm, the coordinate of contact points Paand Pbcan be calculated in Osand converted to Ops. Since components contact at these two points, the calculated contact points are also on the edge of the end face of datum component. According to these contact points,the end face of datum component can be fitted and the circle is fitted to determine the coordinate of Cd.The schematic diagram of this calculation method is shown in Fig. 14 and ddis the nominal internal diameter of datum component.
To reduce the impact of measurement errors of 6D F/T, a data filtering method is designed as shown in Fig. 15. Firstly,the calculated contact point in Omis checked whether it is within the end face.In this way,gross errors can be eliminated.The contact points that have passed first filtering are used to calculated the movement direction vector νmby principal component analysis (PCA). Then an auxiliary line at the center of contact points is created along νmand the distances between each contact point and the line is calculated.Finally,the standard deviation of the distances is calculated and used as the evaluation standard. If the calculated standard deviation is smaller than the preset threshold, the data filtering process is completed. Otherwise, those contact points having distance larger than half of the distance maximum will be filtered.
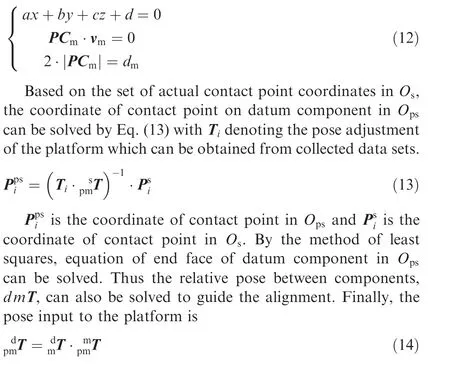
After data filtering,for each calculated contact point,a pair of actual contact points is calculated by Eq. (12) where P x,y,z( ) is the coordinate of actual contact point in Os.
4. Simulation experiments
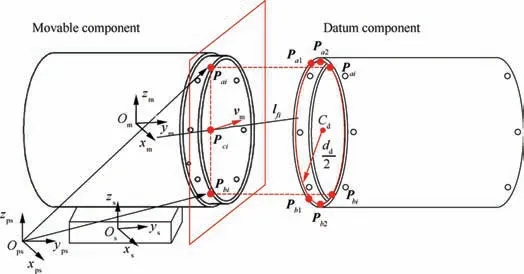
Fig. 14 Schematic diagram of relative pose calculation between two components.
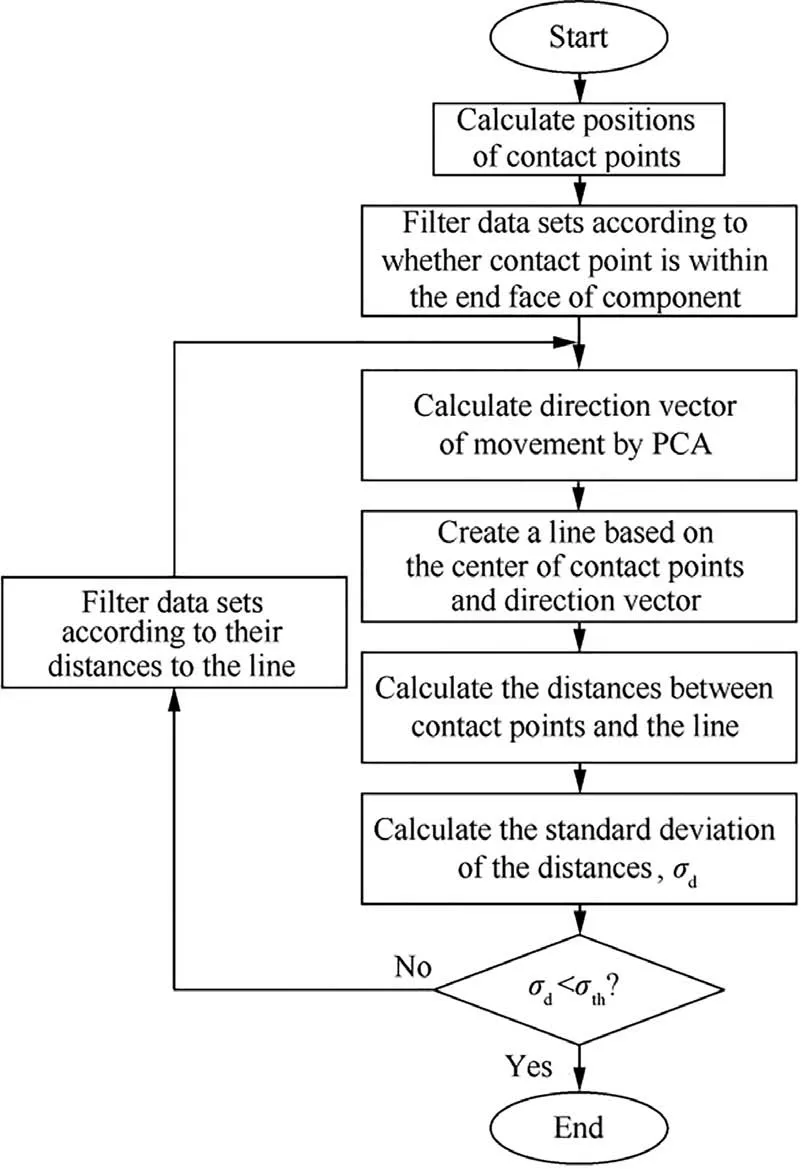
Fig. 15 Data filtering flow chart for two-points contact state of alignment stage.
Simulation experiments are carried out using V-REP with Bullet physics library as the physical engine. In V-REP, physical contact can be simulated and 6D F/T is measured by a virtual force sensor. The simulation environment is shown in Fig. 16.A robot is used as the pose adjustment platform. Fig. 16(a)shows the components to be aligned and the inner diameter of datum component is 380.01 mm and the outside diameter of movable component is 379.77 mm. The models of components are built in CATIA and imported into V-REP. After imported, the models are represented by triangular meshes as shown in Fig. 16(b). Considering the stability of physical engine can affect the simulation accuracy, some changes have been made for the simulation.In V-REP,simple convex shape is optimized for dynamic collision response calculation, so the movable component is replaced by a cylinder as recommended by V-REP. Since the datum component is concave, the imported mesh is directly used. Besides, the diameter of cylinder is adjusted.By pretest,the maximum diameter of the cylinders which can finish alignment without interference is 378.16 mm, so the final diameter is set to be 377.92 mm to make the clearance between components’ diameter 0.24 mm.In addition, the alignment direction is changed to be vertical.This is because the orientation of robot in V-REP is controlled by Euler angles. When the alignment direction is horizontal,gimbal lock problem will happen. The final simulation environment is shown in Fig. 16(c).
Fig. 17 shows the definition of coordinate systems in this simulation environment. In V-REP, the force sensor is used as rigid link between robot tool and movable component,and the coordinate system of force sensor is set to be identical with the coordinate system of robot tool so both of them is represented by Os. Cmand Cdare the coordinate systems of components and set on the end faces of components. OGis the base coordinate system of robot and also represents the global coordinate system. The relative pose between Osand Cmis (0, 0, -266.71, 0, 0, 0) and the pose of Cdin OGis(600.00, 0, 300.00, 0, 0, 0), where the unit for position is millimeter and unit for orientation is radian.
The simulation process is based on the communication between V-REP and MATLAB. During simulation,MATLAB performs motion control and related calculation,while V-REP simulates alignment process and sends measured 6D F/T between components to MATLAB, which has been compensated to eliminate the effect of gravity. The simulation procedure is shown in Fig. 18. The sampling period is 0.01 s and interpolation step size is 0.02 mm for translation and 0.001745 rad for rotation.
In the following sections, the relative pose calculation results are firstly analyzed and then the entire alignment process is evaluated.At last,the limitation of this simulation environment and its effect on the experimental results are discussed.
4.1. Relative pose calculation
4.1.1. Relative pose between robot tool and movable component
The initial pose of Osis set to be (585.00, -20.00, 570.00,-0.08727,0,0).At first,the robot moves in the negative direction of z-axis and Fzis monitored. When Fzincreases sharply,components contact with each other and the hybrid force/position control proposed in section 2.4 is applied to the robot.
Fig. 19 shows the directions of contact forces during onepoint contact state of alignment stage.
By solving the optimization problem, the pose of Cmin Osis (0.0619, 0.1584, -266.6653, 0, 0, 0). Fig. 20 shows the contact points and fitted circle.
4.1.2. Relative pose between datum component and robot
As the equation of end face of movable component in Oshas been solved, the coordinate of contact point can be calculated during two-points contact state of alignment stage.After eliminating the gross errors,the collected contact points are shown in Fig.21(a).During this contact state,the robot moves along the negative direction of y-axis and the calculated movement direction vector is (-2.37×10⁻⁴, -1.00, -1.16×10⁻²⁹),which is close to the real movement direction.After data filtering, the left contact points are shown in Fig. 21(b).
By Eq. (13), the coordinate of actual contact point on datum component in OGis calculated and Fig. 22(a) shows the distribution of contact points. Fig. 22(b) shows the fitted end face of datum component and the calculated center Cdand the calculated pose is (599.9857, -2.9135, 288.3488,-0.0654, 0,0). Comparing this calculation result with the theoretical value,it can be found that the deviations mainly exists in y, z and α, the reason of which is discussed in section 4.3.
4.2. Heuristic cabin-type component alignment process
The heuristic alignment strategy is successfully implemented for the alignment of cabin-type component and Fig. 23 shows the pose variation of robot tool.The coordinate axis on the left side represents the position parameters, and since the initial values are quite different, the amount of change along each axis is shown in this figure. The coordinate axis on the right side represents the orientation parameter and only α is shown because it is the only orientation parameter changing during the alignment process.

Fig. 16 Simulation environment based on V-REP.
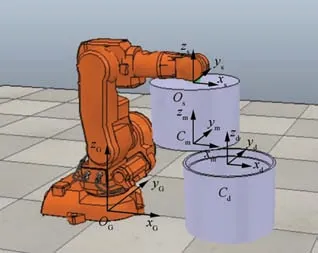
Fig. 17 Coordinate system definition.
The entire alignment process takes 4771 steps and the first 3236 steps are in alignment stage. After the 2822th step,contact state changes from ②to ③and relative pose is calculated. As designed in the strategy, the movable component should move to the target pose directly, but the deviations in y,z and α will affect the alignment.And in several simulations,the deviations all have the same directions,so they are considered as the systematic errors in this simulation environment and the alignment strategy is adjusted slightly. After relative pose calculation, the movable component only rapidly adjusts its x,y and α, which is from 2823th step to 3067th step. Then the robot adjusts its α to make components contact and moves along y-axis while applying force control in z-axis afterwards.The above deviation compensation method can ensure the components enter insertion stage and the process is from 3068th step to 3236th step in Fig. 23.
Fig.24 shows the 6D F/T variation during contact state ①,in which the movable component moves along x-axis and Fzis controlled between 10 N and 100 N. The stopping condition for this contact state is Fxbecomes smaller than 10 N and in 747th step Fxreached -53.83 N, which causing the point group PBin Fig. 20.
During contact state ②, the components are controlled barely contacted to reduce the impact of the stability of this simulation environment, resulting in the force is smaller than 1 N. But when contact state ③is reached, Fyand Mxvary greatly,making the change easy to detect.When movable component moves rapidly after pose calculation, there is no contact between components. Fig. 25 shows the 6D F/T variation in deviation compensation and insertion stage. At first, the components don’t contact, and then in 3105th step the 6D F/T change greatly indicating components contact.After 3237th step, the components enter insertion stage and there are fluctuations of 6D F/T due to interference between models. In insertion stage force control is applied in z-axis and the movable component moves compliantly in other DOF. The stopping condition is Fz>1000 N and in 4771th step Fzis 1078.32 N,marking the end of the alignment process.
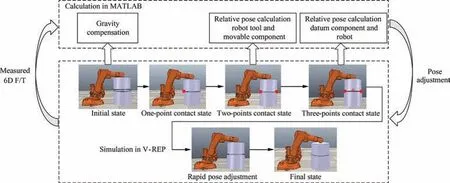
Fig. 18 Schematic diagram of the simulation procedure.
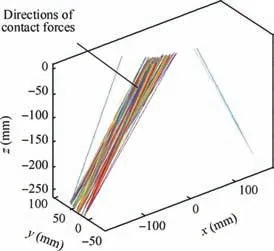
Fig. 19 Directions of contact forces in Os during one-point contact state of alignment stage.
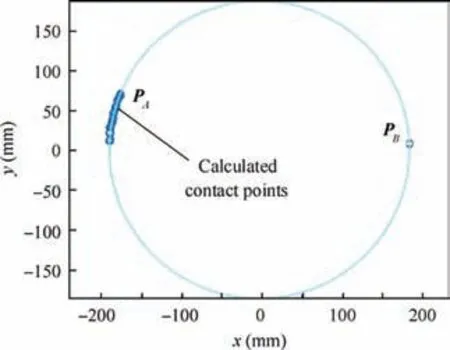
Fig. 20 Calculated contact points and fitted circle in Os.
To evaluate the efficiency of this heuristic alignment strategy, the compliant alignment strategy shown in Fig. 1 is also simulated and Fig. 26 shows the alignment process takes 5869 steps. It is proved that the heuristic alignment strategy has higher efficiency even it takes some steps to compensate for calculation deviation.
4.3. Discussion
As mentioned above, the experimental results are affected by the stability of V-REP simulation environment because both dynamic collision response calculation and 6D F/T generation are performed in V-REP.The physical engine of V-REP is different from the real world and its performance brings more uncertainty to the measured 6D F/T than a real force sensor.The affection is caused mainly by contact points misjudgment and relative movement inside rigid systems.
Fig. 27 shows the detected contact points in alignment stage.Fig.27(a)shows the contact points in one-point contact state and there are several points detected simultaneously.The contact points in two-points contact state is shown in Fig. 27(b)and on one side there are separated multiple contact points.
When calculating the position of contact point, the extra contact points will cause error as shown in Fig. 28, which accounts for the pose deviation of datum component in section 4.1.2.
In insertion stage, due to interference between models, the change of contact points is more significant, resulting in the increase and fluctuation of 6D F/T as shown in Fig. 25. Contact points keep changing even after the alignment process,which is shown in Fig. 29.
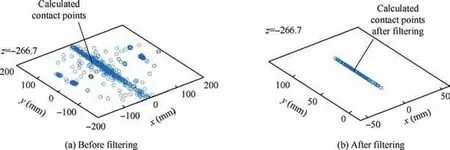
Fig. 21 Calculated contact points in Os during two-points contact state of alignment stage.

Fig. 22 Calculation results of datum component in OG.
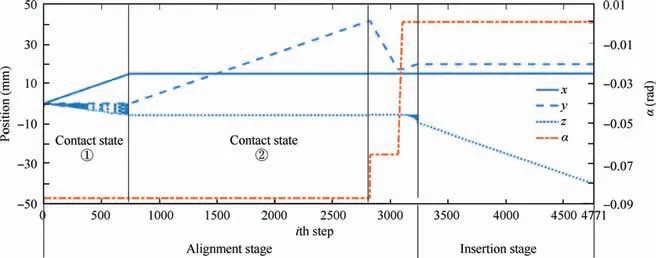
Fig. 23 Variation curve of pose of robot tool during alignment process.
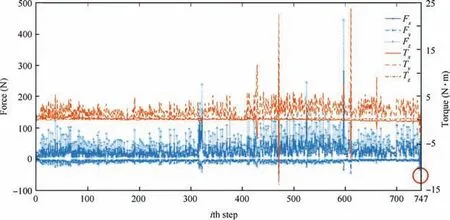
Fig. 24 Variation curve of 6D F/T in one-point contact state of alignment stage.
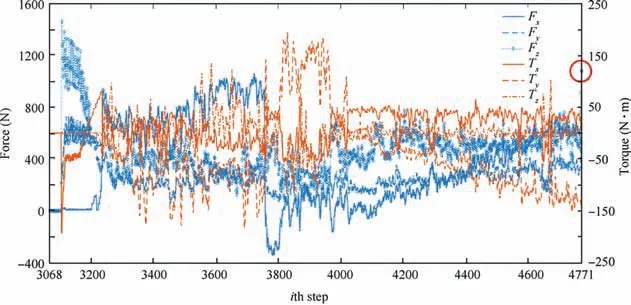
Fig. 25 Variation curve of 6D F/T in deviation compensation and insertion stage.
Deviations are also caused by the relative movement between movable component, force sensor and robot tool,all of which should be fixed together. Fig. 30 shows their pose variation in x,α and β.As shown in this figure,relative movement does exist because of the 6D F/T between them.Though the change in relative pose is quite small, it still affects the direction of contact force,reducing the accuracy of simulation.
To summarize, there is difference between the simulation environment and the real world, and extra uncertainty is brought into the simulation procedure due to the performance of physical engine. But the experimental results in section 4.1 and 4.2 still prove that the proposed alignment method is effective to improve the efficiency of alignment.
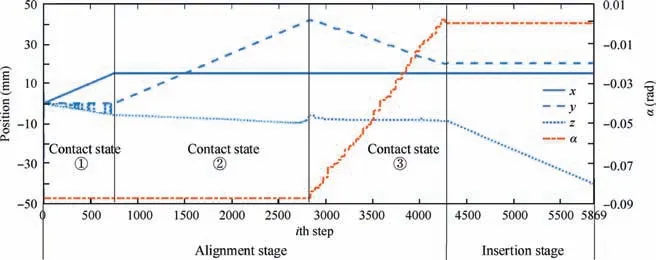
Fig. 26 Variation curve of pose when using compliant alignment strategy.

Fig. 27 Detected contact points in alignment stage.
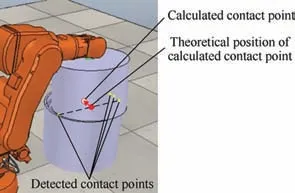
Fig.28 Change of calculated contact point in two-points contact state of alignment stage.
5. Conclusions
(1) This paper proposed a heuristic cabin-type component alignment method, which is based on multi-source data fusion.Based on analysis of contact states between components and the variation of 6D F/T during alignment,a heuristic alignment strategy is designed and the corresponding motion control method is introduced. By fusing 6D F/T, pose data and geometric information of components, the relative pose between components is calculated to guide alignment, improving the alignment efficiency.
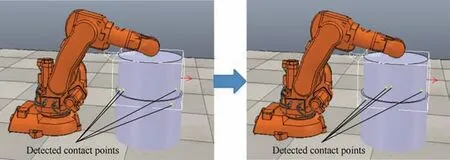
Fig. 29 Change of contact points after alignment process.

Fig. 30 Relative movement between movable component, force sensor and robot tool.
(2) The proposed heuristic alignment method is verified in simulation environment which uses a physical engine to simulate alignment process and generate 6D F/T between components. The relative pose between pose adjustment platform and movable component is calculated and the pose of datum component in global coordinate system is calculated.Simulation results show that the alignment process is completed by adopting the heuristic alignment method, and the variation of pose and 6D F/T is analyzed. To evaluate the efficiency of the proposed strategy, it is compared with a compliant alignment strategy. In the simulation process, the pose of movable component is changed by (15 mm, 20 mm,-40 mm, 0.08727 rad, 0 rad, 0 rad) in total. The heuristic alignment strategy takes 4771 steps to complete alignment while the compliant alignment strategy takes 5869 steps, proving that the proposed heuristic alignment strategy has higher efficiency.
(3) Considering that the stability of simulation environment affects the experimental results of the proposed method,further study will be undertaken by applying this method to real alignment systems. Besides, in real cabin-type alignment process, the performance of the proposed alignment method can be influenced by the manufacturing accuracy of components, the measurement precision of 6D F/T and the positioning precision of pose adjustment platform. The coordination method of these precisions will also be researched to improve alignment quality.
Acknowledgements
This study was co-supported by the Special Research on Civil Aircraft of China (No. MJZ-2017-J-96) and the Defense Industrial Technology Development Program of China (No.JCKY2016206B009).
 CHINESE JOURNAL OF AERONAUTICS2020年8期
- CHINESE JOURNAL OF AERONAUTICS的其它文章
- Structural dynamic responses of a stripped solar sail subjected to solar radiation pressure
- Dynamic coefficients and stability analysis of a water-lubricated hydrostatic bearing by solving the uncoupled Reynolds equation
- Rotor airfoil aerodynamic design method and wind tunnel test verification
- Effect of curing condition on bonding quality of scarf-repaired composite laminates
- Influence of uniaxial tensile pre-strain on forming limit curve by using biaxial tensile test
- Influence of non-equilibrium reactions on the optimization of aerothrust aeroassisted maneuver with orbital change
