Rotor airfoil aerodynamic design method and wind tunnel test verification
Weiguo ZHANG, Junfeng SUN, Lingqun WANG, Jie WU, Long HE
a School of Aeronautics, Northwestern Polytechnical University, Xi’an 710000, China
b Computational Aerodynamics Institute, China Aerodynamics Research and Development Center, Mianyang 621000, China
c Low Speed Aerodynamics Institute, China Aerodynamics Research and Development Center, Mianyang 621000, China
KEYWORDS Airfoil design;CRA09 airfoil;Optimization method;Rotor;Wind tunnel test
Abstract Well-designed airfoil is very important for high-performance rotor.This paper developed an efficient multi-objective and multi-constraint optimization design system for rotor airfoils based on RANS analysis, and verified the performance of the optimized airfoil. Using CRA09-A as the baseline rotor airfoil, the CRA09-B optimized rotor airfoil was designed successfully. Combined with the foundation of high-precision rotor airfoil stationary test technology, the CRA09-B and CRA09-A rotor airfoils were tested in the S3MA high-speed wind tunnel of ONERA. In order to correct the aerodynamic data,a single parameter linear wall pressure method is used to consider the tunnel effects.The results indicate that multi-objective and multi-constraint optimization design method developed in this study is reliable,and that CRA09-B optimized airfoil provides better stationary performance than CRA09-A airfoil in terms of maximum lift coefficient and lift-to-drag ratio.
1. Introduction
The aerodynamic characteristics of the helicopter rotor are closely related to the design of the rotor airfoil. A refined airfoil can apparently improve the rotor hovering efficiency and also has a significant influence on forward flight speed, equivalent lift-to-drag ratio, maneuvering capability and acoustic radiation. Theory analyses and wind tunnel experiments1-3have contributed to various series of high-performance specific rotor airfoils and a corresponding airfoil library has been developed since 1960s, greatly meeting the aerodynamic performance objectives of the helicopter. Some typical series of rotor airfoil include the TsAGI series of TsAGI,the OA series of ONERA, the VR series of Boeing Vertol, and the SC series of Sikorsky.Such series of airfoils have been widely applied on the rotor of the third and fourth generation helicopter,such as the OA3 airfoil of the NH90,the SC1095 airfoil of the UH-60 Black Hawk and the S-76. At the beginning of the 21st century, the OA5 series of airfoils by ONERA and the TsAGI15 series by TsAGI have been developed. The aerodynamic characteristics of rotors are further improved by adopting the optimized airfoils, and show better performance over a wide range of forward speed.
In China,researches on rotor airfoil were started at the end of the last century.4-6A recently related development in the literature is the design of rotor airfoil and verification methods.However, technologies completing the methods of the design of rotor airfoil and verification are still lacking, limiting the capability of the designed rotor airfoils.7-10
This paper is aimed at designing a kind of optimized rotor airfoil CRA09 (Chinese Rotor Airfoil, 9% thickness) by multi-objective and multi-constraint optimization design,11,12based on a series of classical technologies including the evolutionary algorithm, Class-Shape Transformation (CST)13-16method and Computational Fluid Dynamics(CFD)17method.Then,a correction method18of high-speed wind tunnel is established and the verification method of wind tunnel test of airfoils is improved.Static characteristics of the optimized rotor airfoil have been tested in the France high-speed ONERA-S3MA wind tunnel.
2. Methodology
2.1. Airfoil parameterization
Airfoil parameterization is the foundation of airfoil design,aimed at setting design variables to acquire the data from the aerodynamic configuration of the airfoil. The parametric process is based on CST method. This method can be easily used to control the number of design parameters and the critical parameters, including the leading edge radius, the camber distribution, the thickness distribution, the angle of trailing edge,the thickness of trailing edge,the section shape,the gradual transition and so on.
Considering x and y as the components of the airfoil configuration in the Cartesian coordinates, the complete configuration of the airfoil can be described in
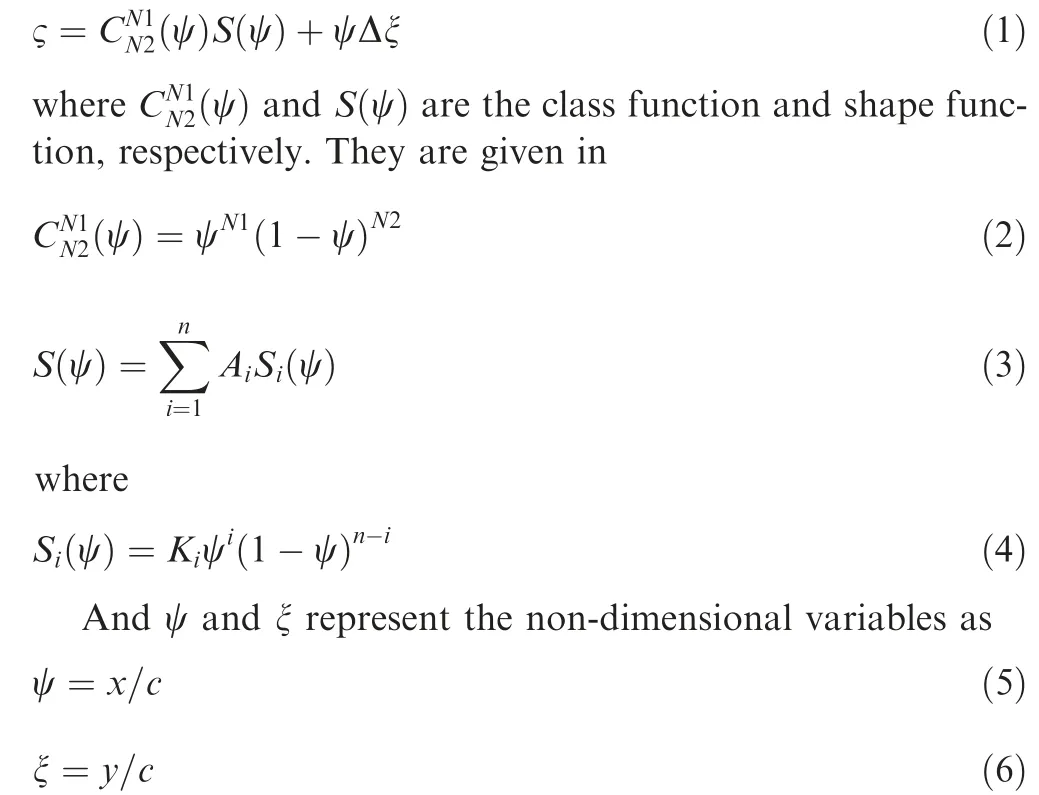
Moreover,Airefers to the design parameter,where variable i is the number of the points of the airfoil configuration within a considerable range.Δξ is the non-dimensional variable given by

where yTEis the thickness of the trailing edge and c is the chord length of the airfoil. As for the round head airfoil, N1 equals 0.5, and N2 equals 2.0.
The fitting approximating method is used to simulate the correct outline of the rotor airfoil accurately, by giving twelve design variables of the upper and lower profiles of the airfoil,respectively.
The variation of the leading and trailing edge can be defined by control functions as

where S(0) and S(1) refer to the shape functions, RLEis the leading edge radius,and β are the angle of the upper and lower profiles at the trailing edge.
2.2. Numerical method and grid system
A self-developed program, Multi-Block Navier-Stokes two dimension (MBNS2D),19based on Reynolds Averaged Navier-Stokes (RANS) equations, is used to analyze the aerodynamic characteristics of the airfoil.The RANS equations are discretized in space by cell-centered finite-volume method with the implementation of Roe’s scheme20,and the simulations are accelerated by multi-grid technology. A γ-Reθtransition model21,22is provided in the computation process of the aerodynamic performance of the airfoil, in order to improve the precision of the calculation of the drag.
The generation and deformation of the grid system are automatically completed by the program using hyperbolic differential equation.The distance of the first layer grid from the wall is set to 1×10⁻⁶m. The wrap-around and normaldirection grids are composed by 767 elements and 127 elements, respectively, as shown in Fig. 1.
The aerodynamic characteristics of CRA09-A airfoil at Mach number Ma=0.4 are depicted in Fig. 2. It can be seen that the predicted lift, drag and moment coefficient (CL, CD,Cm) by MBNS2D are in close agreement with experimental data.19The qualitative correlation at high angle of attack α is less satisfactory but favorable.Predicted moment coefficient is lower than measured data, and this might be caused by the limitation of turbulence model. In view of this fact, performance of the optimized airfoil will be validated in ONERA S3MA wind tunnel and will be discussed later.
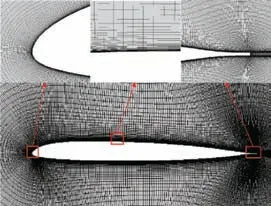
Fig. 1 Sketch of computational grid for airfoil.

Fig. 2 Comparison of predicted and experimental results of CRA09-A airfoil (Ma=0.4).
2.3. Multi-objective optimization method based on evolutionary algorithm
The optimization method adopted in this paper is based on the evolutionary algorithm,the thought of multi-objective Paretooptimal solutions19-23and the penalty function method. Initially, the design variables and the optimization space are encoded by the algorithm.After that,a random method is used to generate fixed-scale population and the individual fitness function of the population is calculated to identify the individual quality of the population.Furthermore,the process including selection, crossover and genetic manipulation for the population is performed and iterated to generate the final Pareto solutions.
In the region of the feasible solution by punishing the individual fitness value against the constraint, the practical problems are constrained using the penalty function method, thus reducing the selection probability of their descendants and limiting the population. However, if the constraint condition is strict excessively, the feasible solution may hardly be searched by using this way. Therefore, for the infeasible solution of the intermediate population, another way is to perform uncontrolled sequencing to retain the good individuals of the infeasible solution and promote the population to the region of the feasible solution as soon as possible.The generated feasible solution will be retained as an elite individual,further evolving the population into Pareto solutions.
2.4. Optimization flowchart and results
Fig. 3 shows the flowchart of the rotor airfoil aerodynamic multi-objective optimization design. It consists of three parts.These three parts are aerodynamic optimization design,database processing, and CFD simulation. According to the optimization target and constraints, the aerodynamic design part establishes response surface model from simulation results of sample points, and selects appropriate model for airfoil shape design.24-27The database processing part is responsible for data reception and transmission, and the related data about the deigned airfoil are stored here.The CFD simulation part provides aerodynamic simulation results during the design process.
In the current study, CRA09-A airfoil is taken as the baseline. Geometric shape of CRA09-A is similar to ONERA OA309 airfoil. The maximum thickness is 8.8%c at 32%c and the maximum camber is 1.3%c at 17%c of the airfoil.This study tries to improve the maneuvering capability without decreasing the thickness of the airfoil and the hover performance of the rotor. Details of the optimization method are shown in Table 1.
The subscript b in Table 1 indicates the performance index of the baseline airfoil CRA09-A, and the symbols CLmax,(CL/CD)maxand tmaxrepresent the maximum lift coefficient,the maximum lift-to-drag ratio and the maximum thickness,respectively.
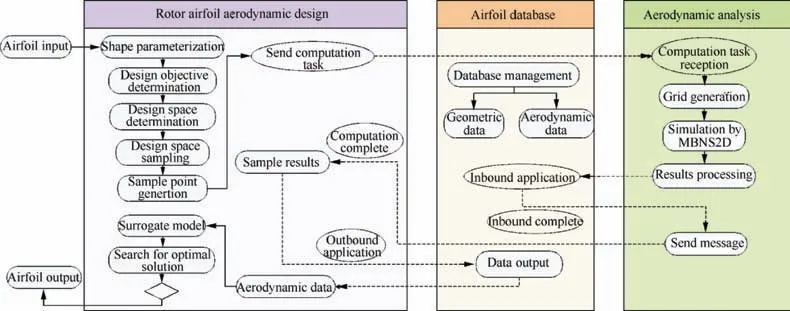
Fig. 3 Flowchart of rotor airfoil aerodynamic optimization design.

Table1 Design states, objective functions and constraint conditions.
According to Table 1, it can be seen that the main constraint of airfoil design is to improve the maximum lift and lift-to-drag ratio without significantly damaging the moment performance from Mach number 0.3 to 0.6.In order to satisfy the multi-objective design and sufficient constraint condition,the values of the optimized parameters, including population size, crossover probability, mutation rate and the maximum generation, are defined as 120, 0.8, 0.2 and 400, respectively.
The Pareto solutions of optimized result are given in Fig.4,Maddmis the drag divergence Mach number. For ease of understanding, the red balls and the purple cube represent the sampling points and initial airfoil, respectively. The blue ball refers to the Pareto solutions of optimized result. Considering the comprehensive characteristics of hover and maneuverability, the green ball shown in Fig. 4 is selected from the Pareto solutions as the final optimized result,which means better maneuverability performance.
The corresponding optimized airfoil, shown in Fig. 5, is named as CRA09-B. The maximum thickness is 9%c at 32%c of the airfoil and the maximum camber is 1.4%c at 17%c of the airfoil. The main characteristics of CRA09-B compared with CRA09-A are a higher camber and a higher thickness.It has a maximum thickness of 9.0%c and maximum camber of 14%c. In particular, the positions of maximum thickness and camber are equal for both airfoils.
Table 2 illustrates the comparison between the performance of the two sets of airfoils from numerical simulation by MBNS2D (0°<α <15°). As described in Table 2, the maximum lift coefficient CLmaxand the maximum lift-to-drag ratio(CL/CD)maxof CRA09-B are significantly improved. For the case Ma=0.6, CLmaxand (CL/CD)maxare improved by 4.1% and 11.1%, respectively. As for the hover performance(CL=0.6), CL/CDis improved by 3.4% (Ma=0.5) and 6.5% (Ma=0.6). Hence, the design objectives about maneuverability and hover performance are satisfied.
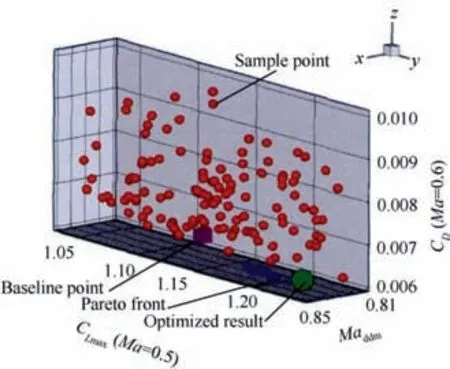
Fig. 4 Pareto solutions of optimized result.
3. Verification in ONERA S3MA high-speed wind tunnel
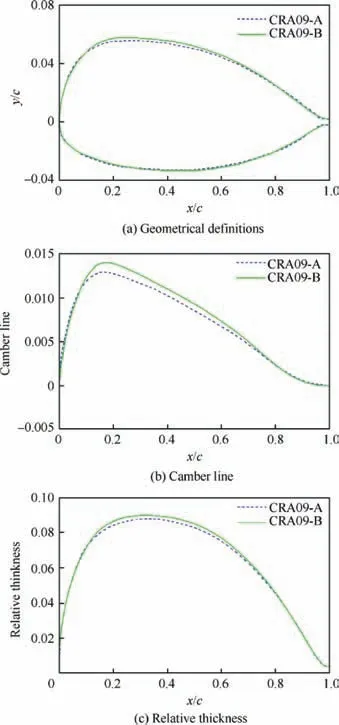
Fig. 5 Comparison between CRA09-A and CRA09-B in configuration.
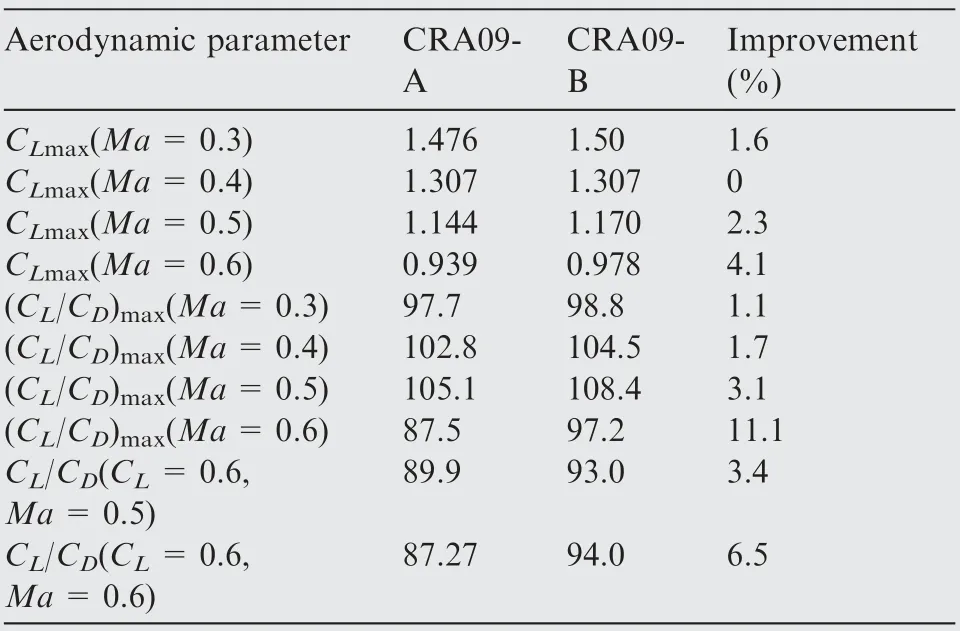
Table 2 Comparison of performance between CRA09-A and CRA09-B.
In order to validate the numerical results, the comparison test of the baseline CRA09-A airfoil and CRA09-B optimized airfoil was performed in the VCP nozzle of the S3 wind tunnel in Modane-Avrieux (S3MA), France. Especially, the VCP test section is designed for testing the performance of twodimension airfoil,and the height and the width of the test section are 0.78 m and 0.56 m, respectively. Fig. 6 presents the layout of the test section. The vertical walls are solid and the horizontal walls have geometric porosity of 9.7%. Test article is driven by angular position system installed in vertical walls for incidence control. The test section walls are equipped with pressure taps used for corrections of wall effects,which will be discussed later.
Fig. 7 exhibits the test article manufactured by CARDC.The span and the chord are 560 mm and 210 mm,respectively.The maximum thickness of the airfoil is 18.9 mm. Moreover,there are sixty and forty pressure taps distributed on the upper and lower surface of the airfoil,respectively.Fig.8 presents the distribution of these pressure taps on the model.The density of pressure taps increases along the leading edge of the airfoil.Considering that the airfoil model is relatively thin, the pressure taps of the upper and lower surface are distributed as slashes symmetrically about the central plane. The angle between the slash and the central plane is 10°. Meanwhile,the test model is also mounted on the side pivoted windows crossing the wind tunnel.
The total pressure and static pressure of the airfoil wake are measured by wake test device and wall pressure test equipment. A motorized rake located downstream of the profile allows measuring the wake. Schematic of the wake rake and the wake rake installed in the wind tunnel are shown in Fig. 9. This rake has five total pressures (PT1-PT5) and four static pressures (PS1-PS4), and it is moved with a speed of 0.15 m/s.Pressure measurements are carried out by Kulite sensors. These sensors are thermal compensated and placed just behind the probes to minimize response time.The Kulite pressure sensors are differential pressure sensors. Therefore, the reference pressure is introduced to the procedure in the test.Total pressure and the static pressure are averaged by measured data.
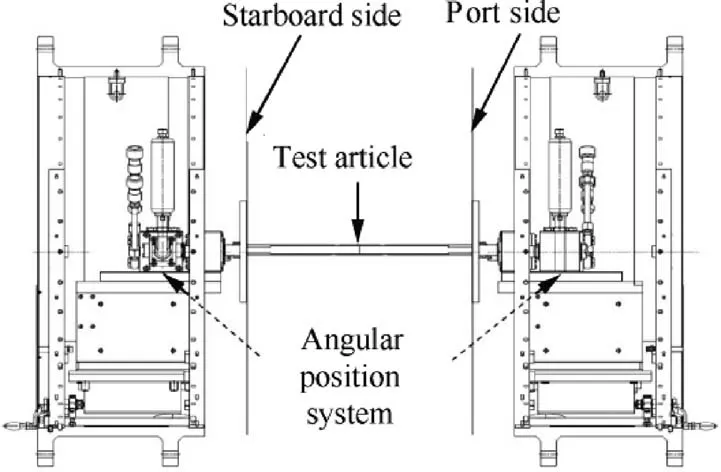
Fig. 6 Test section for two-dimensional airfoil in ONERA S3MA wind tunnel.
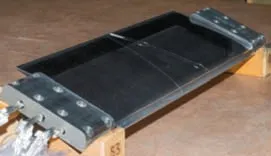
Fig. 7 Manufactured airfoil model.
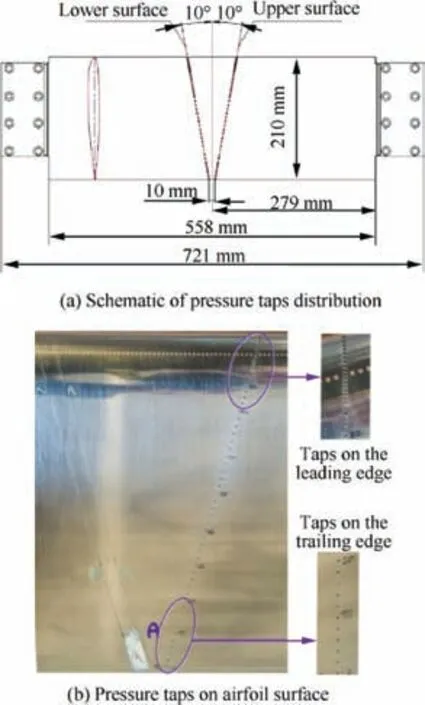
Fig. 8 Distribution of pressure taps on the model in ONERA.
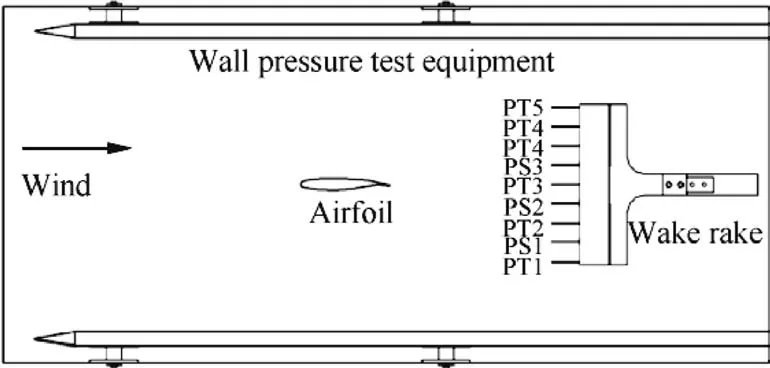
Fig. 9 Schematic of wake rake installed in wind tunnel (left view).
4. Wind tunnel wall interference correction method
The existence of wind tunnel wall results in deviation of the acquired aerodynamic data. Due to the limited size of the high-speed wind tunnel,along with the vent holes and grooves on the ceiling and ground, the airfoil would be interfered. In order to correct the test data of the aerodynamic force, this paper introduces the lift effect correction method. The horizontal walls of the tunnel are equipped with rows of static pressure taps. These pressures are measured by two PSI modules(64 taps).
The single parameter linear wall pressure method28-30is used to perform the correction. Key idea of this correction method is to measure the static pressure distribution on the wind tunnel walls, and then the basic solution on the walls can be obtained. According to the basic solution, the induced velocity on the airfoil surface can be solved. On this basis, the interfering aerodynamic force could be determined. Specifically, the far-field interference velocity potential φmof the model near the wall is defined by
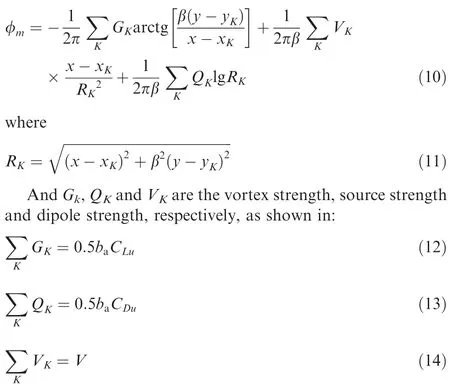
CLuand CDurepresent the tested lift coefficient and drag coefficient, respectively. The subscript K is the number of the singular points. Besides, baand V are the chord length and the section area of the model, respectively.
The velocity potential φ satisfies subsonic small disturbance linearization equation

where,φ=φb+φmand φbis the unknown velocity potential.Once φmis determined, φbcan be obtained by numerical iteration.
5. Results and discussion
5.1. Comparison of lift coefficient with and without wind tunnel wall correction method
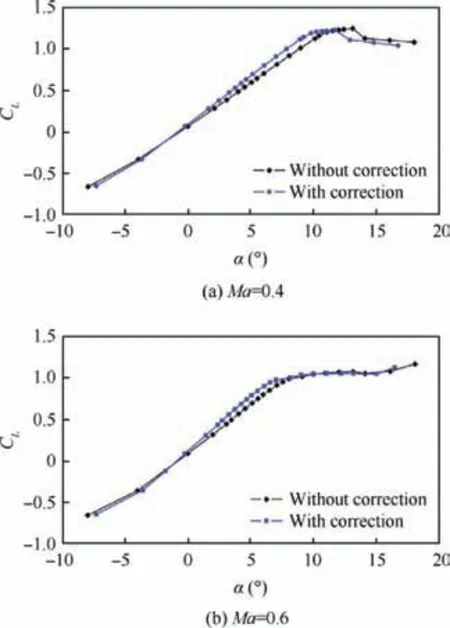
Fig. 10 Comparison of CL of CRA09-A airfoil in S3MA wind tunnel.
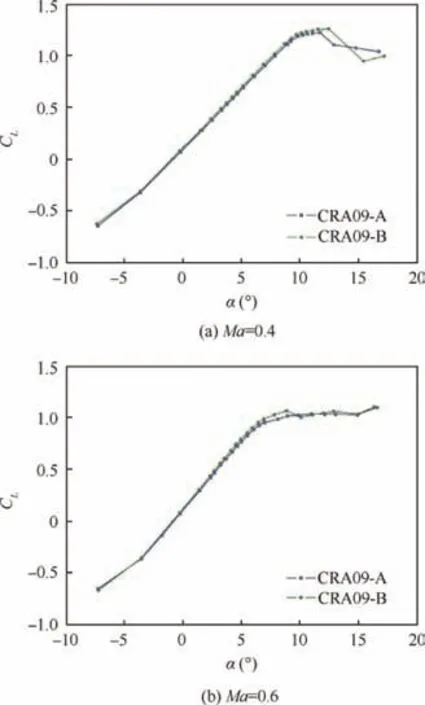
Fig. 11 Comparison of CL between CRA09-B optimized airfoil and CRA09-A airfoil.
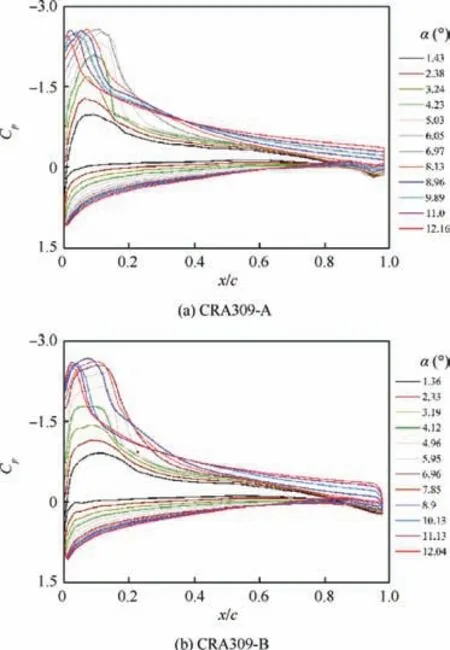
Fig. 12 Pressure distribution on airfoil at different angles of attack (Ma=0.6).
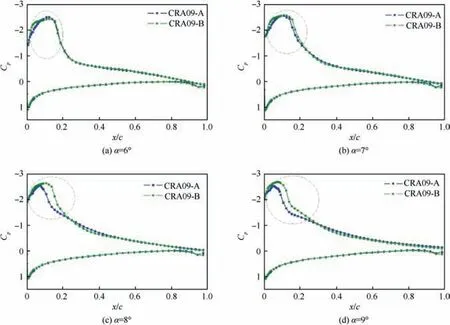
Fig. 13 Comparison of CL between CRA09-B optimized airfoil and CRA09-A airfoil (Ma=0.6).
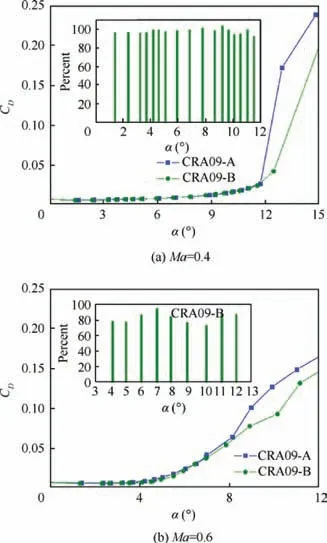
Fig. 14 Comparison of CD between CRA09-B optimized airfoil and CRA09-A airfoil.
The method to correct wind tunnel wall interference of the test data is aforementioned. The correction results are given in Fig. 10. It can be clearly seen from Fig. 11 that in the case of typical Mach numbers(Ma=0.4 and 0.6),the correction of the angle of attack based on the quarter chord according to single parameter linear wall pressure method is very considerable,because the slope of the lift curve with wall pressure correction is increased by 10%.However,the correction for Mach number (△Ma is less than 0.1%)), lift, drag and pitching moment coefficients is very small. Therefore they are not presented in this paper.
5.2. Comparison of aerodynamic performance between CRA09-B and CRA09-A airfoils
Lift coefficients of the two airfoils obtained for Ma=0.4 and Ma=0.6 are compared in Fig.11.It can be seen from Fig.11 that the lift coefficient of the CRA09-B optimized airfoil is slightly higher than that of the CRA09-A airfoil. At Mach number 0.4, the stall of CRA09-B optimized airfoil is delayed compared with the CRA09-A baseline airfoil. The maximum lift coefficient CLmaxof CRA09-B is 1.258, corresponding to 12.5° angle of attack. As a contrast, CLmaxof baseline CRA09-A is 1.222, corresponding to 11.7° angle of attack.At the post stall position (α=9°) when Mach number equals 0.6, the CRA09-B optimized airfoil lift coefficient is 1.072,which is superior to 1.022 of the CRA09-A airfoil. The maximum lift coefficient CLmaxis improved by 2.9% and 4.9% at Ma=0.4 and 0.6, respectively. Recall the numerical results listed in Table 2, and CLmaxis improved by 0 at Ma=0.4 and by 4.1% at Ma=0.6. Experimental data and numerical result match well at Ma=0.6. While at Ma=0.4, it is believed that experimental data are more reliable,because current RANS simulation might be less accurate at high angle of attack. Furthermore, CLmaxobtained from numerical simulation is underpredicted.
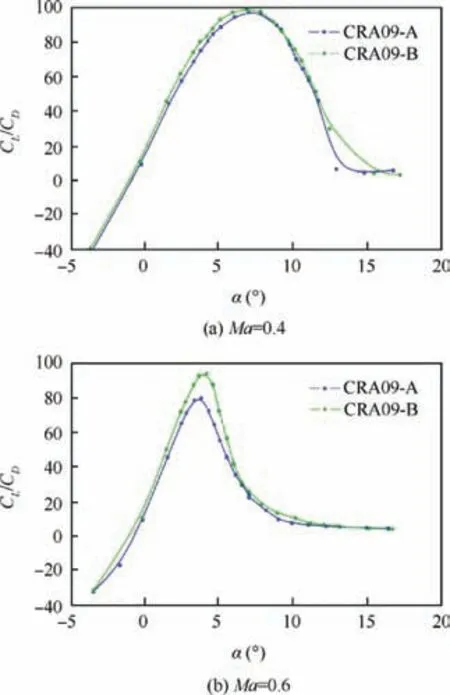
Fig. 15 Comparison of CL/CD between CRA09-B optimized airfoil and CRA09-A airfoil.
Fig.12 shows the measured pressure coefficient Cpat different angles of attack.In order to compare the pressure distribution on the airfoil more intuitively, Fig. 13 compares the distribution at 6°, 7°, 8° and 9° angle of attack. It can be clearly seen that the pressure curve of CRA09-B at the leading edge of upper face is enlarged relative to CRA09-A, especially at 8°and 9°angle of attack.Due to the expansion of the pressure curve on the upper surface of the CRA09-B, the lift performance of this optimized airfoil is better than the baseline CRA09-A.
Fig. 14 shows that the drag coefficient of the CRA09-B optimized airfoil is smaller than that of the CRA09-A airfoil at angle of attack of 0°-12°. The drag reduction is more evident at Ma=0.6. For instance, at the post stall position(α=9°), the drag coefficient of the CRA09-A airfoil is 0.101, and the drag coefficient of the CRA09-B optimized airfoil is 0.078, which is 77% of the drag of CRA09-A.
Fig.15 exhibits that the lift-to-drag ratio is also higher with CRA09-B optimized airfoil over a wide range of α. Its maximum lift-to-drag ratio (CL/CD)maxreaches 99.1 against 97.1 for CRA09-A airfoil at Ma=0.4, and 94.6 against 80.3 at Ma=0.6. (CL/CD)maximproves by 2.0% at Ma=0.4 and by 17.8% at Ma=0.6. Experimental data agree well with numerical results shown in Table 2, only with some minor discrepancy.
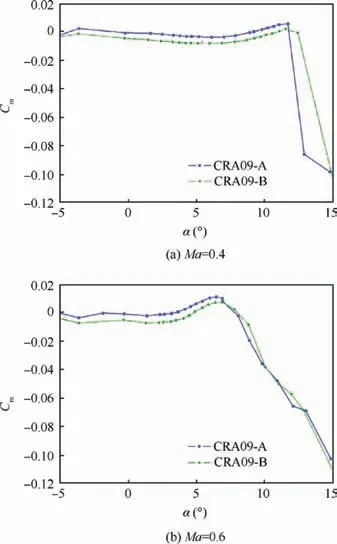
Fig. 16 Comparison of Cm between CRA09-B optimized airfoil and CRA09-A airfoil.
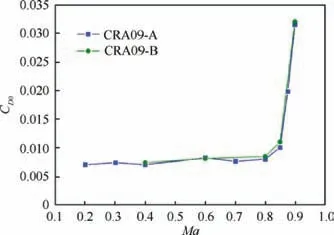
Fig.17 Comparison of CD0 between CRA09-B optimized airfoil and CRA09-A airfoil.
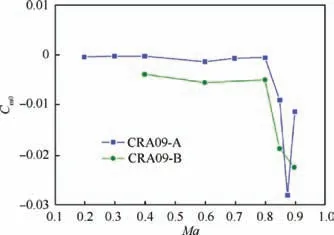
Fig.18 Comparison of Cm0 between CRA09-B optimized airfoil and CRA09-A airfoil.
Fig. 16 presents that the pitching moment characteristic of the CRA09-B airfoil is worse than that of the CRA09-A airfoil. The higher camber of CRA09-B provides an increase of the absolute value at most angles of attack at Ma=0.4, but it is better than the CRA09-A airfoil between 4.4° and 10° at Ma=0.6.
Fig. 17 represents the drag coefficient at CL=0 as a function of the Mach numbers. The two airfoils provide very similar CD0for Ma ≤0.6. Then, for Ma ≥0.7, CRA09-B optimized airfoil gives slightly higher drag coefficients but the trends of the two curves are similar.In particular,the drag divergence Mach number of CRA09-B optimized airfoil is probably similar to that of CRA09-A airfoil (i.e.Maddm=0.84).
Fig. 18 compares the zero-lift pitching moment Cm0of the two airfoils as a function of the Mach number.Once again,the effect of the higher camber of CRA09-B optimized airfoil is clearly visible. While CRA09-A airfoil has been designed to keep the pitching moment as low as possible (Cm0≈0.001),CRA09-B optimized airfoil produces a higher pitching moment. This provides higher performance in terms of maximum lift and lift-to-drag ratio at moderate Mach number,but could be damageable in unsteady helicopter rotor flow conditions because of too high torsion deformation. This also illustrates that there is a contradiction between the optimization goals of the rotor airfoil. If the maximum lift coefficient is increased, the zero-lift torque coefficient will increase.
6. Conclusions
(1) The wind tunnel test results of CRA09-B optimized airfoil and CRA09-A airfoil are basically consistent with the numerical calculation results in the optimization process.
(2) The multi-objective and multi-constraint optimization design method developed in this study is reliable. The CRA09-B optimized airfoil satisfies the constraints determined by design objectives.
(3) The single parameter linear wall pressure method can quickly correct the wall interference of the rotor airfoil successfully. It is necessary and also an effective means to solve the wall interference of the rotor airfoil in wind tunnel test.
(4) CRA09-B optimized airfoil provides better static performance than CRA09-A airfoil in terms of maximum lift coefficient and lift-to-drag ratio. And dynamic test should be conducted later to verify the dynamic aerodynamic characteristics of the CRA09-B optimized airfoil.
(5) In this paper, only the static characteristics of the designed airfoil are studied, and the dynamic performance of airfoil will be studied in future.
Acknowledgement
This study was supported by the National Natural Science Foundation of China (No. 11902335).
 CHINESE JOURNAL OF AERONAUTICS2020年8期
- CHINESE JOURNAL OF AERONAUTICS的其它文章
- Structural dynamic responses of a stripped solar sail subjected to solar radiation pressure
- Dynamic coefficients and stability analysis of a water-lubricated hydrostatic bearing by solving the uncoupled Reynolds equation
- A heuristic cabin-type component alignment method based on multi-source data fusion
- Effect of curing condition on bonding quality of scarf-repaired composite laminates
- Influence of uniaxial tensile pre-strain on forming limit curve by using biaxial tensile test
- Influence of non-equilibrium reactions on the optimization of aerothrust aeroassisted maneuver with orbital change
