Inverse design of mission success space for combat aircraft contribution evaluation
Yuan GAO, Hu LIU, Yongliang TIAN
School of Aeronautic Science and Engineering, Beihang University, Beijing 100083, China
KEYWORDS Contribution effectiveness;Effectiveness evaluation;Gaussian fitting;Inverse design;Military missions;Modelling and simulation;Success rate;System of systems
Abstract This paper presents a novel design method of the Mission Success Space (MSS) for the evaluation on aircraft contribution effectiveness.MSS concept was proposed for giving success criterion of a mission and judging the success by conventional mission effectiveness with regards to the aircraft capabilities. This space is created by the Mission Success Function (MSF) and the original Effectiveness Index Space(EIS)where empirical equations are usually assumed to be MSFs.Based on this MSS concept,this paper firstly defines the MSS-based evaluation, then further summarizes the evaluation process of the Contribution to System-of-Systems (CSS). More importantly, based on the thought of Inverse Design(ID),a new design method of MSF is presented comprehensively analyzing aircraft’s CSS in a combat mission without using any empirical MSF. The definition of MSS based ID is given and the design procedure is sequentially introduced. Two different confrontation cases are depicted with many details as the simulation validation: Air-to-ground and Penetration. There are two design variables considered for designing MSS in the latter case while only one for the former.However,in both cases,the best design is given by evaluating the Gaussian fitting performance of CSS.
1. Introduction
Continued focus of System-of-Systems (SoS) engineering has over the past decades led to a situation where many innovative concepts, theories, methods and technologies are created by the scholars in this targeting field.1-6The design and optimization of aircrafts, especially for the military aircrafts, have to pay high attention to the impact and requirement of SoS at the conceptual design stage since future combat environment goes increasingly complex and this design stage starts and determines the whole aircraft design process. SoS oriented Modelling and Simulation (M&S) technique4is a crucial approach for aircraft conceptual design and has been applied into the development of many aircrafts and platforms (e.g.JSF,7F-358) where the M&S-based effectiveness evaluation should be highlighted. Among the interests, contribution of certain equipment to the effectiveness of SoS combat has become a hot and important index in equipment research and decision area.5,9-12
Contribution to System-of-Systems (CSS) is an effectiveness index which could demonstrate the executive level of equipment (or combat capability) in the future SoS combat.5Many studies on CSS are equipment-oriented evaluation works; however, quite a few scholars have investigated the contribution effectiveness generated by combat capability.Pei and Qin9placed emphasis on the contribution assessment of various capabilities (anti-compression, positioning etc.) in a space navigation and positioning SoS based on the belief distribution function. Gonzales et al.13studied the effectiveness(kill ratio) of Link 16 which is equipped on the F-15 s to find whether the increase in combat effectiveness stemmed from the network-centric capabilities of Link 16. An equipment contribution (offering degree) evaluation method for weapon SoS is proposed in Ref.10where the contribution are offered by different types of notes (sensors, decision maker and influence);in fact,all these three types are examples of combat capabilities which can be integrated into one or more equipment. The deduction of CSS in this study utilizes the same thinking within the Refs.10-12,that is comparing one conventional effectiveness (e.g. Mission Success Rate (MSR),5,14operation loop index of combat network10etc.) in two different combat scenarios where the engagement of the studied equipment (or technique) is the only difference.
On the one hand, SoS oriented effectiveness evaluation is usually significantly complex considering various capabilities and effectiveness which underlines the interest of exploring methods to redefine and recombine effectiveness indexes with regards to equipment capabilities in order to focus on one or more key points (among that mission success must be included). On the other hand, the success criterion should not always be unchanged for different missions with various aircraft design variables; thus, success criterion should vary with the SoS combat missions (confrontation scenario, equipment configuration etc.) which actually conforms to the emphasis on the requirements of SoS operation.
For above reasons, Mission Success Space (MSS) concept was proposed in Ref.5to give the Mission Success Condition(MSC) based on which MSR can be deduced. This concept was defined by a novel point-set introducing an effectiveness index, mission success, to map the relations between equipment capabilities and this index. The authors particularly represented the definition and designed Mission Success Functions (MSFs, fF) to give and compare different success criteria. Though the Inverse Design (ID) method was preliminarily investigated in that paper, the authors only applied the confidence interval of effectiveness distribution(after Gaussian fitting) to inversely design MSS. For practical application,many potential schemes of ID can be utilized and more importantly, there are variable designs in each ID scheme thus the differences among them should be studied. Therefore, this paper continues to focus on the ID of MSS by using the exhaustive algorithm in each design scheme. After simulation cycles, analysis of results’ data characteristics is the first step followed by giving a design scheme for the choice of success criterion. Based on that, different designs in this scheme will be compared using Gaussian fitting performance and the best design can be obtained.
The paper is organized as follows: Section 2 will introduce the evaluation method based on MSS design,which is abbreviate as MSS-based evaluation. After that, CSS evaluation procedure is summarized in Section 3 using two simulation loops to calculate different MSRs. Furthermore, Inverse Design method of MSS is systematically illustrated to introduce the proposed concept and methodology. Finally, two different simulation cases(Sections 5 and 6)are given with many details for the validation of ID method.
2. MSS-based evaluation
MSS is a space designed for giving the criterion of success to a combat mission. In practice, success criterion is commonly designed with empirical data by equipment customers and, in most case, set as ‘‘killing all targets”. However, it should be more rational and effective if the criterion-making considers equipment’s actual capabilities and certain specific combat environment. Therefore, this study evaluates and analyses the combat effectiveness index to give the relatively better criterion of mission success for certain combat scenario with regards to equipment’s capabilities. The whole design process of MSS starts with the MSS-based evaluation which gives success criterion for confirming the final effectiveness(success/failure).
MSS provides a new dimension for mapping the relations between capability and effectiveness by introducing another effectiveness index - Mission Success Effectiveness (MSE,fE). Fig. 1 shows the basic process of MSS-based evaluation with the mapping from capability indexes (vi) to conventional effectiveness indexes (Ej). All these indexes jointly determine the original Effectiveness Index Space (EIS) and the ranges of these indexes represent the size of EIS.
Combat effectiveness evaluation usually utilizes index method,15Analytic Hierarchy Process (AHP),16mixedinteger and nonlinear method,6Multidisciplinary Design Optimization (MDO)17and other methods; however, M&S-based method is more common for SoS effectiveness evaluation since it provides a powerful alternative to the techniques of experimental science and observation when phenomena are not observable or when measurements are impractical or too expensive.18In this work, MSS-based evaluation is also suggested to use M&S technique.
MSF should be first designed to divide EIS into two subspaces: MSS and Mission Failure Space (MFS). The relative positions of these sub-spaces in EIS can give the MSC to judge whether each design point in EIS meets the requirement of mission success. As MSF is the boundary of the two sub-spaces,MSC can be summarized by the comparison of Ejand the corresponding value of MSF, as follows:
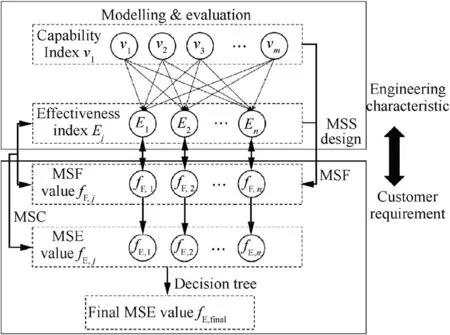
Fig. 1 MSS-based evaluation.

where fE,jis MSE,Ejis the value of original effectiveness index,and fF,jis the value of MSF. If fE,j=1,the mission is successful; otherwise, fE,j=0, the mission fails. v1,v2,···,vmare m capability variables in a combat mission. The inequation‘‘Ej(v1,v2,···,vm)≥fF,j(v1,v2,···,vm)”is the MSC which gives the criterion of judgement for mission success. It is noted that the correlation of fF,jand Ejin MSC is not necessarily be‘‘larger or equal”for practical cases.Here,for MSCs used in both cases (Sections 5 and 6), Ejis assumed to be larger than or equal fF,j.
The final accreditation of mission success should be given by the validation of all MSEs. The process can be represented by a Decision Tree(DT)19showing that only if all MSEs equal 1 the mission can be accredited to be successful.As can be seen from Fig. 2, any effectiveness taken account into MSS-based evaluation should meet its corresponding MSC for the success accreditation. The number of DT level (n) is determined by how many effectiveness indexes are considered and the MSCs in all levels should be checked one by one before finally confirming mission success. Lastly, set the final mission success effectiveness (fE,final) as 1 if all MSCs are satisfied, as follows:

The function of MSS-based evaluation has the similar thinking with the ‘‘deployment” in the indexes quantification method - Quality Function Deployment (QFD) - which converts matrix of demand results from customer to indexes of lower levels.20Fiebrandt and Wilson21applied QFD to convert demand indexes into joint mission effectiveness in JTEM plan.In Ref.4,Biltgen used QFD to decompose indexes for the toplevel strategic goals using the relative importance of a customer requirement. This study proposes MSS-based evaluation and tries to investigate the possibility of transforming the engineers’ conventional focus to the customers’ requirement (mission success). As shown in Fig. 1, this process directly demonstrates the relationship between conventional engineering characteristics and mission success.
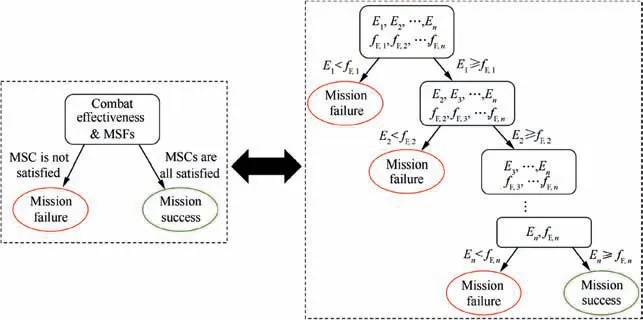
Fig. 2 Decision tree for MSS-based evaluation.
3. CSS evaluation process
In order to quantify the contribution effectiveness(CSS)of an aircraft to SoS confrontation, Ref.5gives an available and effective method to compute this index based on MSR deduction. This paper continues to use this method by comparing different combat SoSs where the engagement of studied equipment is the only difference.
MSR is a variable of ratio,thus,needs to be solved by division.As shown in Fig.3,after designing MSS(namely,the success criterion has been given) in a certain mission, simulation cycle is applied to the solution of MSR whose denominator is the simulation times and numerator is the times of mission success. Therefore, MSR, which reflects the execution level of an equipment to a combat SoS, is defined using a simple rate form, as follows:
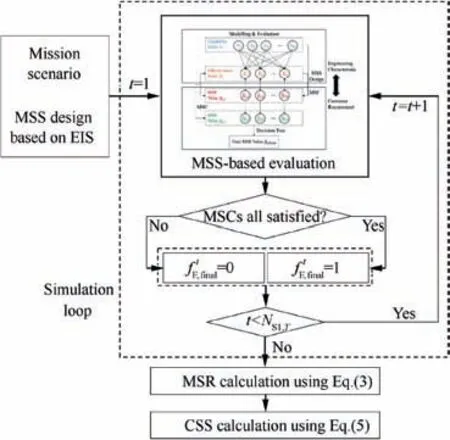
Fig. 3 Evaluation process of CSS.
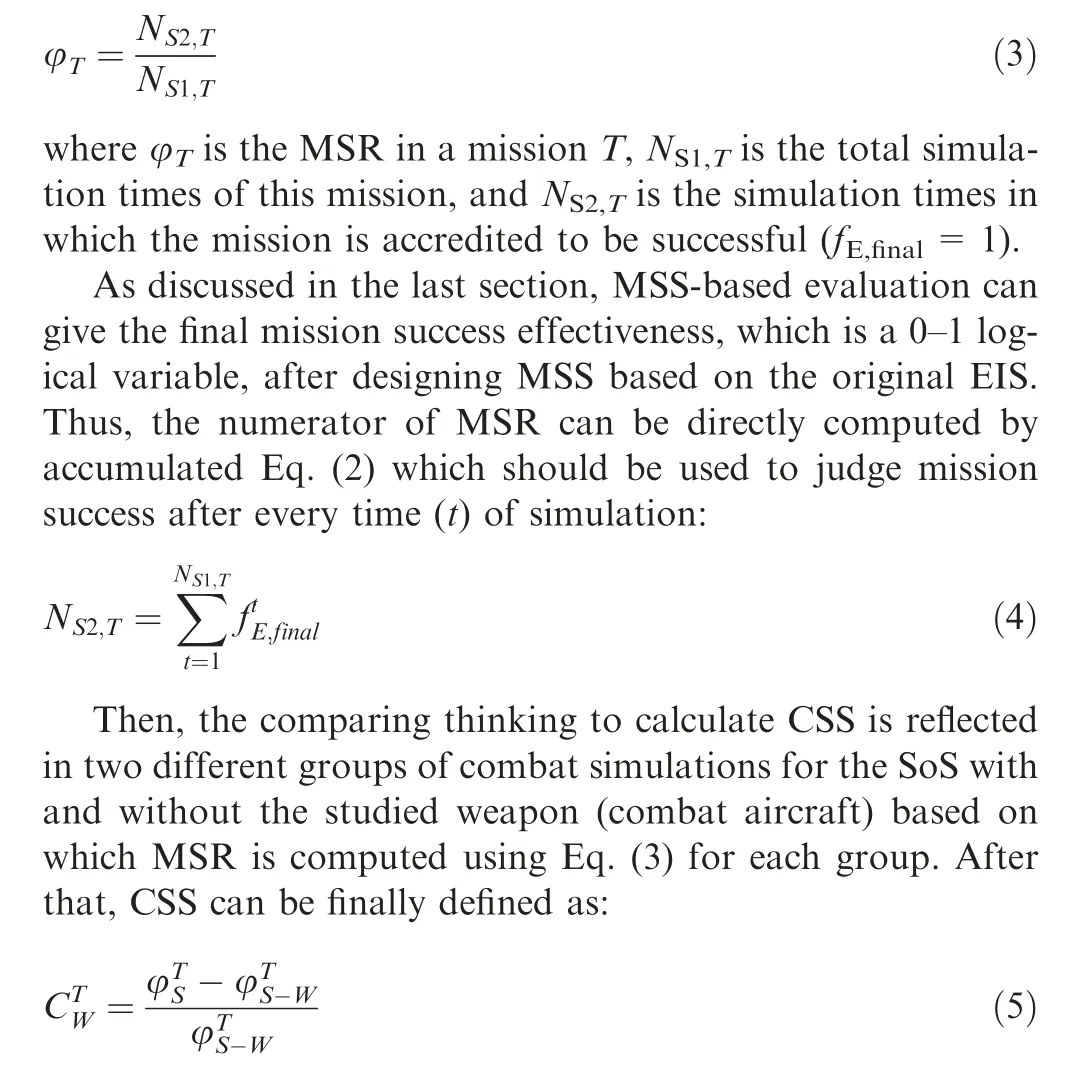
where φTSis the MSR of a combat SoS(S)in a mission T,φTS-Wis the MSR of the combat SoS without a weapon (W) in the same mission T, and CTWis the contribution of this weapon to the SoS in this mission.
It is important to notice that φTSand φTS-Ware separately generated by two simulation cycles where the only difference is the engagement of W.Namely,mission environment,tactics,indices(variables,effectiveness)and MSC(s)in the MSS-based evaluation all stay the same within the CSS evaluation process.
4. Inverse design of MSS
In Section 3, the evaluation process of CSS is discussed by using simulation cycle to deduce MSR and further to calculate CSS. Based on this process, Inverse Design method of MSS is proposed in this section to give the best design of MSS. In Ref.4, Inverse Design refers to a ‘‘Normative Forecasting”method and is equivalent to an assessment process from equipment capabilities to system architecture.By contrast,here,the MSS based Inverse Design means using system operation effectiveness and MSS-based evaluation to design equipment capabilities in an SoS combat.
A simple scheme of MSS based ID has been discussed in Ref.5where Gaussian fitting is exercised for MSR with regards to the capability variable and then bilateral quantiles are found to give the K parts for new MSS design. K part is a design point/line/surface (vi, fF,j) in MSS and also a crucial part of MSF(boundary of MSS)which determines the change of success criterion with regards to the design variable(vi)in EIS.As shown in Eq. (1), the effectiveness results (vi, Ej) generated by simulation should be compared with the related K part before being accredited to be successful.
That ID scheme offers a good thinking for lowering success criterion based on the characteristic analysis of effectiveness:when the design variable reaches a value which makes an effectiveness distribution become out of a confidence interval(usually α=0.05), the corresponding success criterion should be lowered.However,the authors did not give comparing studies of other different ID schemes.This paper explores the possibility of ID method using exhaust algorithm to find the best design for MSS that needs a design cycle to finish the process.
As shown in Fig.4,ID cycle follows the evaluation process of CSS which can give MSRs and CSS of a combat aircraft with the initial MSS design. After generating MSR and CSS results, analysis of their data characteristics is the next step in ID cycle; then, K parts are given by the analysis; lastly,new MSS can be directly determined by the K parts in order to generate new MSRs and CSS. Repeat these four steps until we find the best MSS design according to certain standards of data characteristic.
It is noted that simulation cycle is not embedded in ID cycle as it usually takes a lot of time. Time cost of simulation is not the only reason for this design;another significant reason originates from the good solution performance of multi-time simulation on non-linear systems where the relations between capability and effectiveness are valued. Multi-time simulation method based on well verified modelling work can give accurate estimations of different effectiveness, especially for the ratio indexes,as long as the times of simulation reach a certain level. According to the empirical data of Ref.22, the authors applied 1000 as the maximum number (the same with NS1,T)of simulation in a cycle to compute MSR. In that paper, if exercising the same system(the first version of the case in Section 5)for two cycles,the difference of the results (three effectiveness indexes) was very small. Therefore, here, simulation effectiveness results are directly utilized for ID cycle rather than exercising the same simulation cycle for one more time with new success criterion (MSC).
As discussed above, the design of MSS is to find the functions mapping aircraft capability parameters to combat effectiveness. K parts are noted in this design process since they change the success criterion with respect to aircraft capability variables (e.g. Radar Cross Section, RCS22-23). That means when these variables reach to K parts success criterion will become easier (or harder) for mission effectiveness to meet.This underlines the interests of exploiting algorithm to give K parts among which analysis of simulation results is a useful and important way.
Four main steps of the proposed ID are introduced as follows:
(1) CSS calculation based on simulation results
Initially, as mentioned in the last section, modelling and simulation of SoS combat are exercised with a simple MSS/MSF design.MSS design and MSR calculation are both based on conventional effectiveness indexes (e.g. Number of Destroyed Targets (NDT), Loss Rate). Therefore, quite a few different effectiveness indexes of each design scheme can be generated by the two simulation cycles.These indexes form a potential data base for new MSS design. All analysis and design algorithms start from this data base.
(2) Analysis of data characteristics
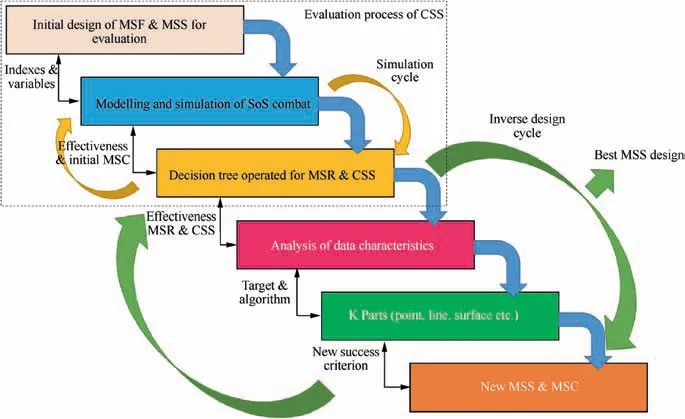
Fig. 4 Inverse Design (ID) methodology of MSS based on CSS evaluation.
This step is to find the new regularities within generated effectiveness results for the following ID process. Gaussian distribution is a common distribution mode for many effectiveness with regards to one or more design variables. Therefore,finding the subspace of EIS regarding a certain level of confidence interval is worth studying (see Section 8 of Ref.5). In addition, clustering analysis24is another useful and unsupervised training method to analyse the data characteristic. For the second case in this study, contour analysis method is utilized for generating new K parts of MSS.
(3) Design of new K parts
Based on the data analysis in last step, we can choose one or more regularities to give new K parts.As mentioned above,confidence interval analyse is a good choice but it cannot guarantee satisfied results.This study comprehensively explores the selection pool of potential K parts based on the data analysis in the two cases where the number of K-part candidate is‘‘75+2775” for the first case and ‘‘7” for the second one.
(4) Choosing the best MSS design
For each K-part design, corresponding MSS can be confirmed to give the success criterion based on which new MSRs and CSS can be deduced following the process in Section 3. If the number of potential K part is finite,exhaustive search algorithm can be applied to find the best design; if infinite, other searching algorithms should be utilized,such as Genetic Algorithm (GA),25,26ant colony algorithm27etc.
For practice, the best MSS design can be chosen by the characteristic analysis of either MSRs or CSS, but this paper only utilizes the Gaussian fitting performance of CSS for that.Therefore, the best MSS design is determined by the fitting performance of CSS data. The reason of using this MSS evaluation method is that,as will be shown in the two case studies,all MSR and CSS data obviously follows the Gaussian distribution and R2in some of MSR data can even be more than 0.94 (see Fig. 9 of Ref.5). Therefore, this data character must be a kind of attribute of CSS results. Actually, this evaluation method is feasible as long as the effectiveness value has the increase trend followed by decreasing. Moreover, after Gaussian fitting, fitting performance (R2and SSE), bilateral quantiles (see Fig. 10 (b) and Fig. 11 (b)) and other data characteristics can be provided to the decision makers for further design and evaluation works.
The following Sections 5 and 6 will introduce two different cases respectively to validate the proposed ID method.Both of them are built on the simulation platform,Anylogic,based on Agent theory28which is a significant concept in the field of Distributed Artificial Intelligence (DAI).29
5. Case study for univariate optimal inverse design
The first simulation case studied here is the mission of fighter air-to-ground combat(represented by T1)to quantify the contribution of an electronic warfare aircraft (EWA, Jammer) to its combat SoS. A transient diagram of the simulation virtual scene is shown in Fig. 5. The red side includes a highperformance fighter, four Unmanned Combat Air Vehicles(UCAVs) and a jammer. The blue includes three sets of landbased air defense systems and three military targets.
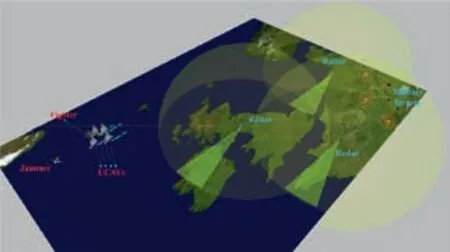
Fig. 5 Transient diagram of air-to-ground combat simulation scenario mission (T1).
Many modelling details of logic in different agents can be found in Section 6.1 of Ref.5. It is noted that initial design there is only based on two common MSFs (Convex quadratic function and S-type function); however, ID method is then preliminarily investigated to give K points by fitting simulation results rather than using any common function. Potentially,more schemes of ID can be utilized and compared with the empirical ways. Among the interests, this paper utilizes exhaustive algorithm to find the K part(s) where the selection criterion is from the performance of Gaussian Fitting (R2and SSE). The following contents will briefly give the Agent modelling in this combat system and the simulation experiment,after that ID is illustrated by two different design schemes.
5.1. Modeling and simulation
There are seven agents built in this system including highperformance fighter, UCAV, Jammer, Air-to-Surface Missile(ASM), radar, Surface-to-Air Missile (SAM) and military target.Fig.6 shows the state charts of Fighter,UCAV and Radar agents in T1.UCAVs initially follows the Fighter(‘‘Following”state in Fig. 6(b)) until Fighter detects an enemy radar air defense system (‘‘Confirm” state in Fig. 6(a)). Fighter orders UCAVs to attach Radars and military targets until the enemy’s targets are successfully destroyed (‘‘Destroyed” state in Fig. 6(c)).
The state logics of Main,SAM,ASM,and Military Targets are relatively simple. However, the confrontation of UCAVs and Radar is mainly based on the two types of missiles in which SAM model considers various parameters to determine the hitting of defense Radar. Therefore, the following Section 5.1.1 highlights the state description and functions used in the SAM agent.
5.1.1. SAM agent
SAMs are launched by radar agents when meeting the launch condition.As shown in Fig.7(a),the state logic of SAM is very simple including two relatively independent parts after the state of ‘‘Flying” where the missile is flying to its target(UCAV). When the distance between SAM and this target reaches 30 km, the state is divided into two parts which depends on whether the UCAV is evading this missile or not(the ‘‘Escaping” state in Fig. 6(b)). When the UCAV is in the states of attacking targets or radars at the point of 30 km, it will not enter the ‘‘Escaping” state while, synchronously, the SAM will enter the state of ‘‘TargetsAttack”,not threating its target. It is worth noting that there is also a‘‘threating rate”related to this division which means that entry of ‘‘TargetsAttack” is not only up to the real-time state of UCAV. These two parts have different hit rates of attack and the rate of ‘‘TargetsAttack” is higher than that of‘‘isThreating”;however,both of them cannot completely guarantee the attack success of this missile.
Fig.7(b)shows the particle motion function of SAM agent which is built using the way of system dynamics in Anylogic:‘‘target”refers to the UCAV target which the missile is attacking;‘‘vtx”,‘‘vty”and‘‘vtz”are velocity coordinates of the target;x,y and z are three real-time space coordinates of this missile;‘‘xinit”,‘‘yinit”and‘‘zinit”are initial coordinate positions of this agent which is determined by its radar air defense system;‘‘vx”,‘‘vy”and‘‘vz”are velocity coordinates of the missile which are obtained by the difference calculation of x, y and z; ‘‘targetDist” is the distance between missile and target;‘‘radarDist” is the distance between missile and its launch radar; ‘‘tm” refers to the remaining fly time of missile; ‘‘xm”,‘‘ym” and ‘‘zm” (derived by ‘‘tm”) are the coordinate values of final encounter point. Blues arrows show the directions of parameter call. The particle motion of this agent can be modelled by the parameters and variables in Fig.7(b);however,the missile hit rate is integrated with various probability parameters and the solution of 4 equations (based on showed parameters and variables) also determines the final hit result. The equations and more details can be found in ‘‘Missile” agent of an example model on Anylogic, called Air Defense System.
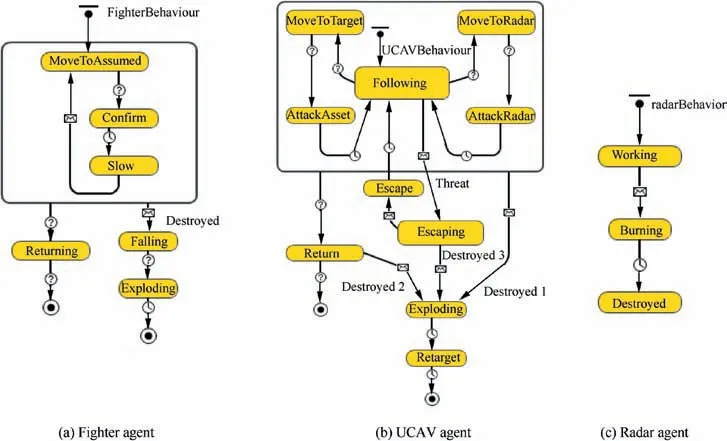
Fig. 6 State charts of UCAV, fighter, radar and SAM agent.
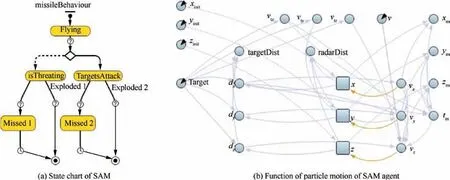
Fig. 7 Modelling of SAM agent.
5.1.2. Simulation experiment
In the simulation experiment, the total number of UCAVs is set as 4, and the total number of targets in the blue side is 6.The design of the simulation experiment is shown in Table 1,5including two different MSFs. The first MSF is a quadratic function, and the second MSF is S-curve. The RCS value in the experiment increases gradually from 0.02 m2to 1.5 m2in the stride of 0.02 m2(totally 75 points),and the other variables remain unchanged in order to obtain the sensitivity analysis curve of MSR with regards to RCS. For every RCS value,the simulation is exercised for 1000 times(one simulation loop)to deduce MSR using Eq. (3) followed by CSS calculation using two simulation cycles,with jammer and without jammer.As discussed in the Section 4, change of MSF (success criterion) does not require a new simulation cycle to compute CSS. The results of MSR should be different regarding the two MSFs;however,the two simulation cycles in CSS calculation only need to be exercised for once since the MSR results will vary slightly for the same simulation experiments. Therefore,the proposed ID method for this experiment case will also utilize the same MSR data to give the best design of K part.
5.2. SoS oriented operation
Relationship between stealth capability of UCAV and effectiveness of SoS is studied by comparing MSRs of two SoSs with and without Jammer. There is one concern needed to be noted: why contribution effectiveness of Jammer could affect the design of stealth capability for UCAV. The reason should be the top-level combat operation concept, called SoS oriented operation,3in which different operational units support each other and coordinate for the same task while each of them has its own functions and independence.
Regarding the jammer,interference capability is utilized for improving surviving probability of UCAVs by suppressing radar detection(Fig.8).For the UCAVs,RCS represents their stealthy ability in the confrontation with radars. Therefore,jammer and UCAVs are fighting in one operational SoS,capabilities of both jammer and UCAVs are key factors for the victory. It is desirable to develop the relationship among these factors, also the relationship of factors in opponents. That is the reason why effectiveness of jammer can be used to direct the conceptual design of UCAV.
5.3. Simulation results
In this air-to-ground combat simulation system, CSS of jammer varies with regards to UCAVs’ RCS value and it will be changed by different K part design. For the two functions in Table 1, the key parts include several points (three points for 1# and two points for 2#). When RCS increases to these points, the success standard becomes lower thus it is easier for effectiveness results to meet MSC (corresponding MSS becomes larger).

Table 1 Design of simulation experiment for T1.5
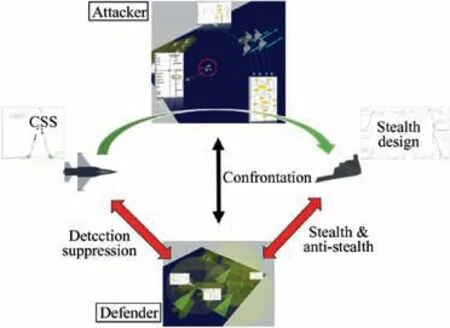
Fig. 8 Stealth design oriented contribution effectiveness evaluation.
Fig. 9 shows the times per simulation cycle of a conventional effectiveness(NDT)in two scenarios as well as the locations of K points (Ki) using the two different MSFs. The colour marked points are in MSS with two design schemes,but not for the black points. Comparing Fig. 9(a) with Fig. 9(c) (similarly Fig. 9(b) with Fig. 9(d)), K parts are in the same locations as success criterion (MSF) should not be changed under the same MSS design; however, NDT results of with-jammer are much higher than that of no-jammer since the blue-side radar detection capability is reduced by 30%when a jammer supports the attacker fleet.
Based on these data of times, NS2,Tin Eq. (3) can be obtained for each RCS value by adding up all corresponding times in MSS (colour marked points in Fig. 9). Then MSR and CSS, as discussed in Section 3, can finally be calculated with regards to RCS. The CSS results with Gaussian fitting operation for the two MSFs are shown in the Section 7 of Ref.5, no more details.
5.4. Inverse design for best K part
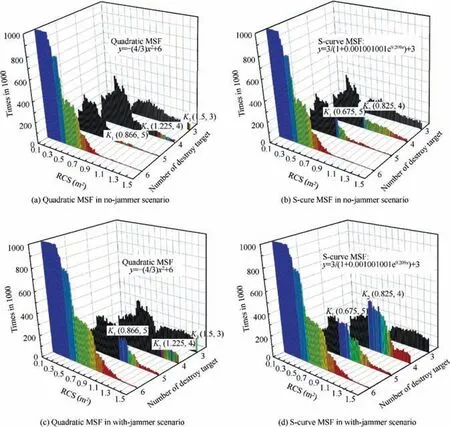
Fig. 9 Combat effectiveness results of air-to-ground mission (T1).
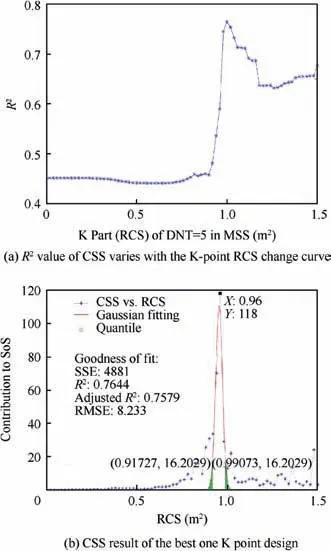
Fig. 10 Best design Results for one K point (NDT=5) in T1.
Different MSSs give different K parts thus CSS results would be different.K parts can be discrete points or a group of lines,surfaces according to case application. Inspired by the former studies in Ref.5, designs of K parts are based on RCS in this case since RCS value can directly determine where K parts locate. Furthermore, RCS is discrete in the simulation experiment which motivates trying candidates exhaustively in the selection pool. In the following subsections, the ID process to choose the best K part(s)will be given in two different ways:one K point and two K points.
5.4.1. Only one K point
The x-coordinate of K points is RCS, a prime variable in aircraft stealth design. The y-coordinate of K points is the original effectiveness(NDT)in MSS.The ID scheme of only one K point refers to the ‘‘NDT=5” point (K1in Fig. 9), that means, all experiments of ‘‘NDT equals 5” can be regarded as success when RCS increases to this point. The following work is to find the value of x-coordinate to maximize the effect(R2) of Gaussian Fitting for CSS. As the simulation stride of RCS range,(0,1.5],is 0.02 thus there are only 75 design values of RCS, this paper applies exhaust algorithm to find the best design K point.For each RCS value,one ID cycle is exercised for one time and corresponding CSS and fitting performance are all generated.
Fig.10(a)shows the variation of CSS R2with regards to the different RCS values in K-point set.There is obviously a peak,(1.0, 0.7644), which means that when the abscissa in the K point of‘‘NDT=5”equals 1.0 m2.When the success criterion changer (from ‘‘NDT=6” to ‘‘NDT ≥5”) is located at‘‘RCS=1.0”,the R2value of Gaussian fitting for CSS results is the maximum comparing with other K-point designs. The Gaussian fitting result of this best design point is shown in Fig. 10(b). The expectation (0.954) of normal distribution is in the middle of the two expectations which are deduced by the two MSFs in Table 1 (see Fig. 7 of Ref.5). Bilateral quantiles of normal distribution function for α=0.025 here are 0.91727 and 0.99073.
Using only one point as K part, the interval (0.91727,0.99073) should be the most concerned in the UCAV stealth design for T1, since it determines whether the CSS can reach 118, or it might be less than 20. This interval range is very small thus it is very good for decision support; however, comparing fitting R2value of the two afore-mentioned MSFs, it is not in a good level for optimal inverse design (R2equals 0.7644).In addition,the SSE of Gaussian fitting(4881)is very high. Therefore, a new design scheme for two-point K part is comparatively studied in the following subsection.
5.4.2. Two K points
The two K points refer to the ‘‘NDT=5” point (K1) and‘‘NDT=4” point (K2) separately. Namely, all experiments where NDT equals 5 can be regarded as mission success when RCS increases to K1while synchronously the MSC is changed to‘‘ND ≥4”when RCS equals or is larger than the abscissa of K2.
Method of exhaustion is again utilized to search the selection pool and to find the best two-point design according to the fitting performance. First, set K1from the minimum RCS value (0.02) to maximum value with the stride of 0.02 one by one after all possible ‘‘NDT=4” K points have been considered.It is noted that the value of‘‘NDT=4”should be larger than the value of ‘‘NDT=5” since the lower of success criterion is due to the relatively poor stealth capability (larger RCS). Therefore, give K2all possible values one by one after setting K1, finally 2775 pairs of two K points can all be found and utilized to generate their corresponding MSRs, CSS and Gaussian fitting results. After that, as shown in Fig. 11(a),the data of Gaussian fitting performance (R2and SSE) is processed using the contours.
In the 2775 K pairs,as discussed,all the RCS value of K2is larger than that of corresponding K1. Therefore, their fitting performance can be represented in their data ranges using the triangle-shape coordinate frame. The top left triangle map in Fig. 11(a) shows the contour distribution of R2where most of the values of design points are beyond 0.4763. The right bottom triangle map in Fig.11(b)represents the contour distribution of SSE where some of them are very high, more than 7000.
Though there is a peak value of R2which is marked as P1(R2=0.840652) in Fig. 11(a), its SSE value is also too large(3266.984).The SSE results challenge the criterion of choosing best Kidesign only by R2. Thus, a new index is proposed to instead of these two fitting indexes.
5.4.3. New criterion for best K part ID
A new criterion (F value) of choosing the best K-point design is introduced here as a solution for the afore-mentioned SSE problem. It can integrate two fitting indexes into one:

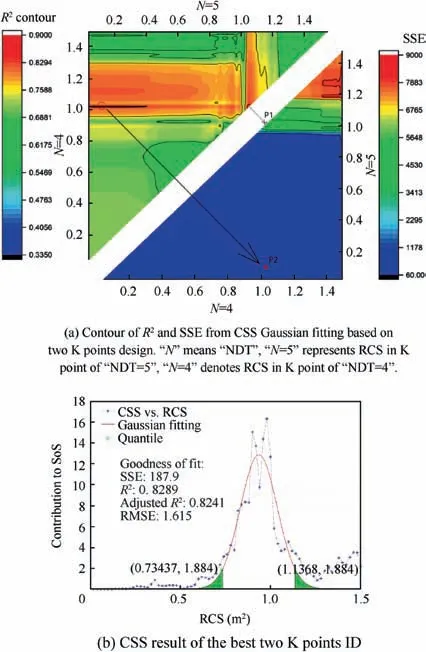
Fig. 11 Fitting performance and CSS result of best two-point ID for MSS in T1.

6. Case study of two design variables and its inverse design
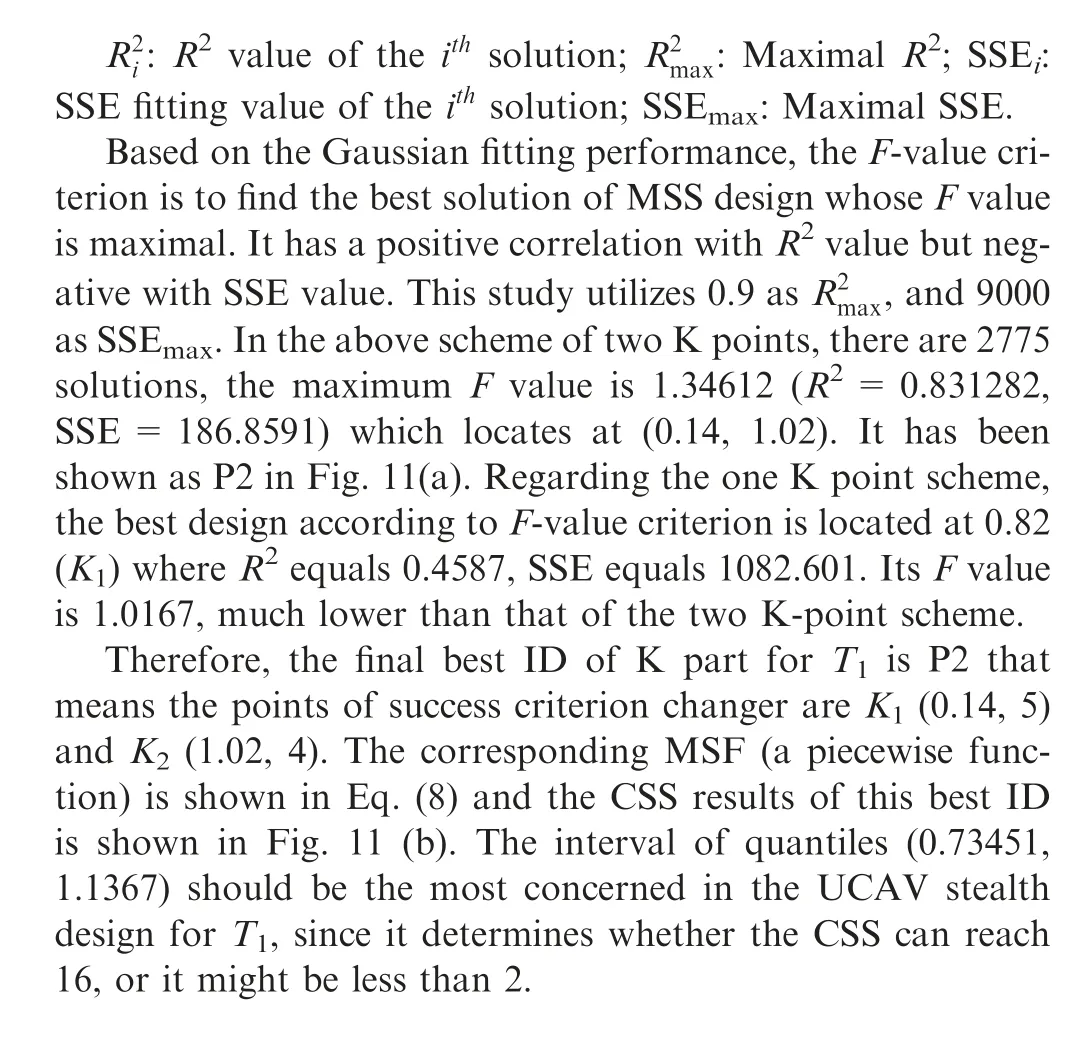
Another studied case further validates the proposed ID method by using two variables (aircraft capability) to design MSS. The scenario is aircraft penetration mission (represented by T2) confronting with ground radar defence system.Except for the key design variable of bombardment fighter,RCS, combat velocity (vkill) is another significant factor for the mission success of T2thus should be involved in the aircraft capability variable for the MSS design. The aim is also to quantify the contribution of the electronic warfare aircraft(EWA, jammer) to the combat SoS based on the proposed CSS evaluation. The transient diagram of T2is shown in Fig. 12.
6.1. Modeling and simulation
Different from the above univariate case, fighters try to penetrate the radar defence and then kill all military targets; therefore, radars are not regarded as their targets. And there is no fighter manager here. All fighters can operate the penetration mission independently and they share the combat information with each other to finish the same mission which demonstrates the characteristics of SoS concept.2,3
Radar,jammer and missile agents in this simulation system are the same with the first case.However,the fighter agent has a lot of difference and there is no UCAV agent in this case.Furthermore, as there are two design variables considered in this case, the design of simulation experiment also varies regarding the sampling method and data range.
6.1.1. Fighter agent
Fig.13 shows the state chart of fighter agent in the simulation system for T2.Assume that the precise position of the target is unknown to the fighter fleet,they first fly to the assumed target location at the cruise velocity. When the distance of the assumed target is smaller than 1000 km,they entry the combat field with a new velocity.After the first radar is detected,all of them speed up to the combat speed (vkill) synchronously to penetrate the radar defence. Then, at this combat speed, they finish the mission T2by killing all military targets and before returning to base.
As discussed in Section 5.1, the fighter will evade the coming SAM when it meets the entry condition of ‘‘Escaping”state. During the ‘‘MoveToTarget” state, the fighter will not evade the coming SAM which definitely increases the hit rate of SAM. It is worth noting that after the fighter is destroyed by SAM, the military target which was initially distributed to this fighter should be retargeted to other fighters. That is the function of ‘‘Retarget” or ‘‘Retarget1” states.
6.1.2. Design of simulation experiment
The input values of two variables originate from Monte Carlo sampling rather than the uniform sampling used in the first case. Another difference is that the total number of design points in this two-variable case is 1000 while only 75 design points of RCS are considered in the other.Data ranges of these two variables are shown in Table 2.
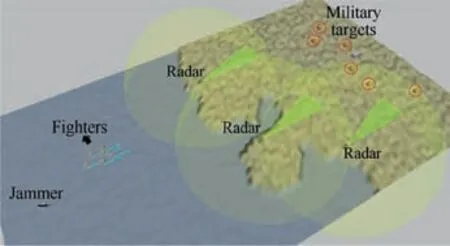
Fig. 12 Transient diagram of penetration simulation scenario mission (T2).
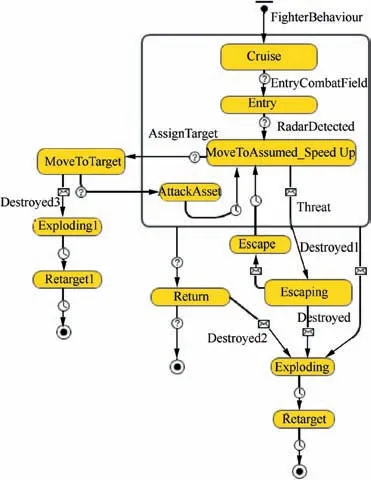
Fig. 13 State chart of fighter agent in penetration mission.
The simulation experiment is exercised on these 1000 design points one by one. For each point, two simulation cycles(1000×2 simulation times) are carried out to compute MSRs and CSS of jammer. The difference between these two cycles for each design point is whether the jammer is involved in the combat simulation. And for different design points, two variables vary while the other values(missile speed,radar location etc.) in the parameter space always remain unchanged.There are six military targets to be killed, the initial MSC is‘‘NDT=6” (killing all targets). If there is a jammer in the fleet, the radar detection capability is reduced by 30%.
6.2. Simulation results
Based on the initial MSC, MSR results of all 1000 design points can be generated after two simulation cycles, as shown in Fig. 14. In both figures, there is a clear decrease trend of MSR as RCS increases or vkillgoes down. The fitting work of MSRs’ data utilizes 2D Gaussian function in the software,OriginPro 2017. The fitting performance is good since the R2values of these two surface fittings are both over 0.8 which is in high level according to Table 35.
Eq. (5) is utilized again to further compute CSS result for every design point.After that,these 1000 points of CSS are fitted using the same Gaussian function in OriginPro. As can beseen from Fig. 15, there is a regularity of normal distribution for the 1000 points; however, the fitting performance is not good (R2equals 0.534, middle level). ID method is promising for searching better MSS designs with higher F values. The application of the proposed ID method on this two-variable case will be discussed in the following subsection to find the best MSS by ranking F values.

Table 2 Input of two design variables.
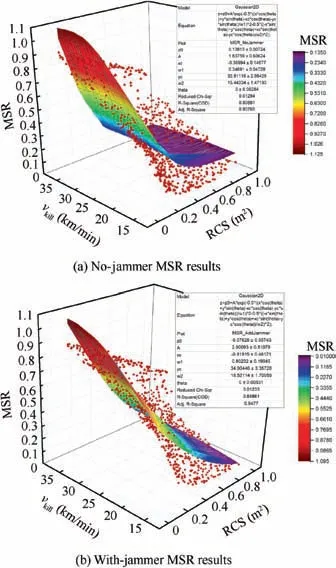
Fig. 14 MSR results and 2D Gaussian fitting of two design variables case (T2).
6.3. Inverse design
As there are two design variables in this case, the K parts should be lines rather than discrete points in the variable space.The solution of K parts is designed to be contour lines in the MSR contour map with original MSS design. As can be seen from Fig.16,the two contour maps of MSR are corresponding to the subfigures of Fig.14.Both of them have 7 contour lines;furthermore,values of related two contour lines(shown in the colour scales) are very close.

Table 3 Levels of Gaussian fitting performance based on R2.5
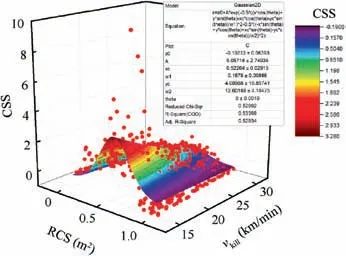
Fig. 15 CSS results with initial MSC in T2.
It is noted that this study utilizes quadratic polynomial fitting lines to instead the original data of contour lines (generated by contour makers in OriginPro) since the original data are plenty of points which are not convenient to be used for ID analysis. The serial numbers of 7 fitted contour lines are shown in each contour map of Fig. 16.
Then, generate 7 middle lines separately based on these fitted polynomial lines. The generation method of middle line is finding the discretized midpoints (components of the desired middle line) of two intersections which are created by the discretized and paralleled diagonals of two-four quadrants and the two corresponding contour lines.All 7 middle lines as well as their related contours are shown in Fig.17.The authors utilize these middle lines as the selection pool of new MSFs (K parts) and compare their resulting MSS designs according to CSS fitting performance.
In the ID of this two-variable case,only the MSF design of‘‘NDT=5” is considered. Namely, the new MSF divides the two-dimension variable space into two parts in which one is using the MSC ‘‘NDT=6” and the other uses a lower criterion, ‘‘NDT ≥5”. Choose the 7 middle lines as this MSF one by one followed by operating an ID cycle (calculating CSS, analysing fitting performance), all fitting data of R2and SSE can be obtained, as shown in Table 4. Lastly, calculate the F value of all these 7 designs (0.9 as R2max, and 9000 as SSEmax) and find that the best MSF design is the No. 3 contour.
Regarding the best MSF design,the final MSS distribution for T2of 1000 data points on the top view is presented in Fig.18(a).The black line is the K part of‘‘NDT=5”for this ID process,its function in the two-dimensional design variable space is shown in Eq. (9). It is the boundary of MSS for the effectiveness ‘‘NDT=5”. When the design point locates in the right bottom part, the success criterion should be‘‘NDT ≥5” rather than ‘‘NDT=6”. Fig. 18(b) gives the fitting result of CSS based on the final MSS design for T2. As the fitting R2and SSE of CSS data using the original MSC are 0.534 and 731.83439, the proposed MSS ID method gives an excellent MSS solution which has a much better fitting performance (larger R2and smaller SSE).

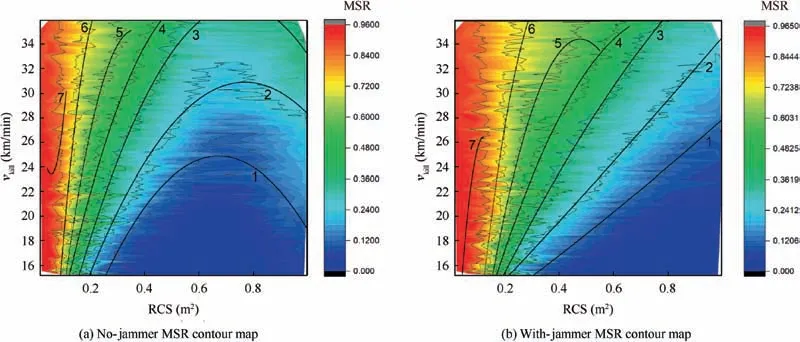
Fig. 16 Contour maps of MSR results in two-variable case.
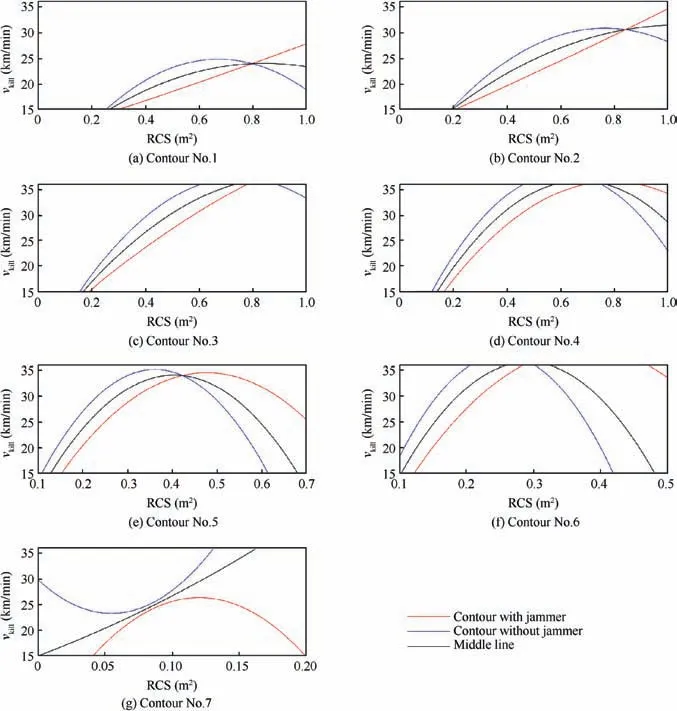
Fig. 17 Middle lines generated by contour lines as new MSFs.

Table 4 ID results based on contour map.
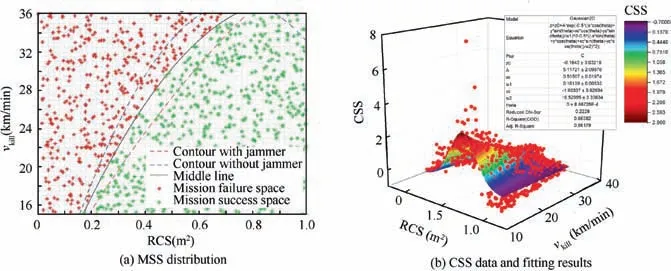
Fig. 18 Best ID of MSS for two-variable case (T2, NDT=5, Contour No. 3).
7. Conclusions and future study
This study proposes an Inverse Design method for Mission Success Space based on which Mission Success Rate of a mission scenario can be computed and Contribution to System-of-Systems of a weapon can be derived following the proposed MSS-based and CSS evaluation process.
In the simulation cases, exhaust method is utilized to validate the ID method firstly for a univariate case where one ID cycle should be exercised for every potential design after that compare their CSS fitting performance and finally choose the best one.Furthermore,two-variable case is also studied for the method validation where the K parts of MSS design are lines rather than discrete points. This ID method may not be available for every SoS Modelling and Simulation case; however,if the final data of CSS has the regularity of Gaussian distribution, Gaussian fitting as well as the method proposed should be suitable for the effectiveness analysis of mission success.
The future work will try other methods for the MSS design of two-variable case. Contour line is a useful way to give K parts for new MSF design but not the only manner. In addition, the MSS design based on multiple effectiveness indexes is also worth studying since in practice deciders usually need to consider more than one key effectiveness during the success evaluation work.
 CHINESE JOURNAL OF AERONAUTICS2020年8期
- CHINESE JOURNAL OF AERONAUTICS的其它文章
- Structural dynamic responses of a stripped solar sail subjected to solar radiation pressure
- Dynamic coefficients and stability analysis of a water-lubricated hydrostatic bearing by solving the uncoupled Reynolds equation
- Rotor airfoil aerodynamic design method and wind tunnel test verification
- A heuristic cabin-type component alignment method based on multi-source data fusion
- Effect of curing condition on bonding quality of scarf-repaired composite laminates
- Influence of uniaxial tensile pre-strain on forming limit curve by using biaxial tensile test
