NOx emissions of turbofan powered unmanned aerial vehicle for complete flight cycle
Ali DINC
College of Engineering and Technology, American University of the Middle East, Kuwait
KEYWORDS Aircraft performance;Cycle analysis;NOx emissions;Optimization;Turbofan engine;UAV
Abstract Unmanned Aerial Vehicles (UAVs) have been getting more and more popular in both civil and military arena.Similar to manned aircraft,their propulsion systems or engines emit harmful gases such as nitrogen oxides. Since UAVs have different mission profiles and operational parameters than manned aircraft,it is worthy to investigate their NOx emissions.Therefore,in this study,NOx emissions of a turbofan powered UAV for complete flight cycle was calculated and optimized within a range of altitude and speed parameters. NOx emissions were calculated based on ICAO ground test data and corrected to any speed and altitude during flight legs using both Boeing Fuel Flow Method 2 and DLR Fuel Flow Method. Total NOx emissions were calculated for complete flight cycles for different altitude and speed parameters. Numerical results were presented graphically and additionally optimization studies were conducted. Optimization studies include determination and comparison of speed and altitude for minimum NOx emissions by the two fuel flow methods and maximum loiter time achievable by UAV.
1. Introduction
Green House Gas (GHG) emissions continue to increase, and in 2010 global energy-related carbon-dioxide (CO2) emissions reached an all-time high of 30.6 gigatonnes despite the recent economic crisis.The Environmental Outlook Baseline scenario envisages that without more ambitious policies than those in force today, GHG emissions will increase by another 50%by 2050, primarily driven by a projected 70% growth in CO2emissions from energy use.1The global aviation industry produces around 2% of all human-induced carbon dioxide emissions. Aviation is responsible for 12% of CO2emissions from all transport sources,compared to 74%from road transport.2There is tremendous effort to reduce emissions from all sources, including aviation. The International Civil Aviation Organization (ICAO) has enforced emissions regulations for civil subsonic turbojet and turbofan engines (above 26.7 kN)for a defined Landing-Take Off (LTO) cycle, which is based on an operational cycle around airports.This LTO cycle is representative of a typical commercial aircraft operation as it descends from 914 m (3000 ft) on its approach path to the time it attains the same altitude during takeoff.3Charges for NOxemissions by some countries have been in place4as early as 1997 and charges have increased as regulations become more strict.5For cruise emissions, there is no regulation imposed currently, but negative impact on environment is already existent and needs to be reduced.
As emissions become more and more important in aviation,aircraft and engine designs have been driven by not only fuel burn and cost point of view, but also emissions. Aircraft and engine designs today, need to include environmental impact and assessment as well. In literature, there are some studies on this subject with different details and perspectives. In Ref.6,analysis and a multi-objective optimization of aircraft design for tradeoff between greenhouse effect and Direct Operating Cost (DOC) are performed with five geometry variables of wing configuration and two flight operational parameters.Ref. 7 studied multidisciplinary design optimization of a commercial aircraft for CO2emissions and LTO cycle NOxemissions by simultaneously considering airframe, engine and mission parameters. Ref. 8 analyzed NOx-emission levels of a Boeing 747-400 aircraft, powered by a fictitious turbofan engine model as functions of altitude, airspeed and weight.Ref. 9 investigated the tradeoff between operating cost and environmental acceptability (noise and emissions) of a commercial aircraft.In Ref.10,optimization studies are performed to compare economic and environmental performance of commercial aircraft configurations/design by trading cost and climate impact and combining altitude variation of fuel consumption,emissions rate, and emissions effects to examine the relative climate impacts of different commercial aircraft designs, as measured by the global mean temperature change resulting from 100 years of sustained aircraft operation. Ref.11 described a methodology to design a commercial aircraft to satisfy demand on a given route network with objectives of minimizing direct operating costs, CO2emissions and NOxemissions.Results of Ref.12 show that a turbofan engine optimized for minimum cruise global warming potential is characterized by lower operating pressures and temperatures than those found in a turbofan optimized for minimum cruise SFC.
In recent decades, UAVs have demonstrated to be very advantageous and successful tools in both commercial and military area.As number and type of UAVs increase in time,it is foreseen that they will replace the manned aircraft in future to some extent. There are some roadmaps on unmanned aerial systems issued by different countries. A European Aviation Vision document states that non-transport aviation missions have increased significantly and are undertaken by remotely controlled and autonomous vehicles, particularly where missions are simple and repetitive, dangerous or require long endurance. Cargo remains an important component of the payload on passenger aircraft and Unmanned Aircraft Systems (UASs) are playing an increasing role as freighters.13Many UAS roadmap documents are issued by USA in different years.Ref.14 explained that in the far term(2026-2035)of document,UAS will conduct nearly all the surveillance and C3(command, control and communications) roles. Additionally,UASs are going to conduct some sustainment/cargo missions while manned platforms support approximately 75% of the mission load. Fig. 1 shows a turbofan powered UAV called‘Global Hawk’ which is typically used for surveillance and reconnaissance mission.15
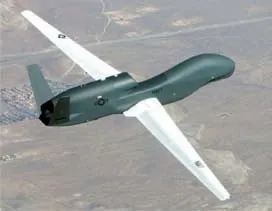
Fig. 1 Turbofan engine powered ‘Global Hawk’ UAV.15
As the number of UAVs increases and UAVs replace the manned aircraft gradually in time,their exhaust emissions will be significant contributors to environmental pollution and global warming. Since UAV designs and mission profiles(speed, altitude, etc.) are somewhat different than those of manned aircraft, their exhaust emissions need to be studied in their typical missions. The originality of this paper is that,it analyzes and optimizes the NOxemissions of a turbofan engine powered UAV during a surveillance mission at different speeds and altitudes.
2. Material and methods
2.1. Emissions
Aircraft emissions are generated by burning jet fuel with air in the engines during flight and ground operations.In general,as more fuel is burned,more emissions are likely to be produced.Main products from the combustion are carbon dioxide and water vapor (CO2and H2O), but there are also side products such as NOx, CO, SOx, HC, smoke, etc. CO2and H2O emissions are proportional to fuel flow. SOxcan be also assumed to be proportional to fuel consumption due to the existing sulphur content (almost constant) in fuel. Some corresponding fuel burn and emissions metrics are provided in Table 1 for exhaust gases directly proportional to fuel flow.16
But for other exhaust gases like NOxand CO, conditions during combustion process affect their amount of production quite a lot. In other words, their emission indices or rates mostly depend on combustor design, specific engine parameters at the combustor inlet, engine power setting and atmospheric engine inlet conditions.
2.2. Prediction for NOx emissions
Studies related with NOxemissions (prediction, minimization,optimization, etc.) can be found numerously in Refs. 17-23 For the prediction of the engine NOxemissions, the so-called‘P3T3’(compressor discharge pressure and temperature)methods are commonly used. These methods rely on proprietaryand complex engine performance models or data for ‘P3T3’values. A variety of ‘P3T3’ NOxprediction models are available in literature. However, test data for some aircraft engine emissions are available and issued by ICAO based on the ground test data of the engines as given in Table 2.24Those data are usually used for calculation of LTO cycle emissions.Prediction of cruise emissions is more complex. ICAO ground test data(Table 2)and predictions by‘P3T3’models cannot be used directly and they need to be correlated for any non-zero altitude and flight speed. ‘P3T3’ models with altitude and speed correlation can be a solution to the problem, but this requires again proprietary and complex engine performance models and data. Simpler but considerably accurate methods were developed in time. ‘Boeing Fuel Flow Method 2’(BFFM2)25,26and ‘DLR Fuel Flow Method’ (DLR FFM)27are the most commonly used ones available in literature.
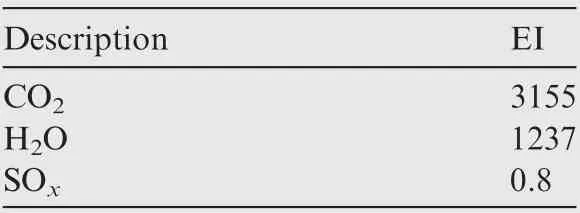
Table 1 2004 year Emissions Indices(EI) (g/kg fuel).16
Those two methods can be used to calculate emissions under any flight condition, based on ICAO ground test data.These methods are advantageous due to their simplicity and inexpensive computational time using mainly publicly available ICAO test data which can generally be found in Ref. 24 BFFM2 method was developed by Boeing to model engine emissions under non-reference conditions including cruise at any altitude and gives a reasonable approximation, especially for NOxemissions (in the order of 10% to 15%) compared to the results of complicated ‘P3T3’ method.28Later, Euro control has implemented a slightly modified version of the Boeing 2 method due to a mistake within the published Boeing 2 specific humidity calculation.29A detailed study and implementation of NOxprediction by using both BFFM2 and DLR FFM are given in Ref.30 and it has very valuable information including the NOxemissions measurements during flight of 5 different commercial aircraft and 7 different turbofan engines. It also has the BFFM2 and DLR FFM calculations to compare the estimated values of emissions with the real test data. It has also useful information such as flight speed and altitude during flight with specific aircraft and engines (10 flight test cases total) which can be used to repeat the calculations and practice BFFM2 and DLR FFM as validation cases.In fact, one of the flight test cases and NOxprediction results of Ref.30 was selected to validate the methodology used in this paper.This validation case is presented in the next section.
The total emission for ENOxper mission cycle can be calculated by Eq.(1),31after NOxemission indices(EIj,NOx)are predicted by BFFM2 or DLR FFM at each mission segment.

where ENOxrepresents the total NOxemission of aircraft per mission (kg); nethe number of engines per aircraft; tjtime in mode j (s); j engine mode in mission segment (idle, takeoff,climb, cruise, approach, etc.); Wfjfuel flow in mode j (kg/s);EIj,NOxNOxemission index in mode j (g/kg fuel).
Emissions are heavily dependent on engine rating (%power) as given by ICAO data.24Therefore, it is important to estimate engine rating at every point during flight. One way to do that is to estimate the aerodynamic drag of UAV and available engine thrust at a given flight point by running the code. The ratio of drag to available engine thrust simply gives the engine rating to overcome the drag. Obviously, drag cannot be bigger than available engine thrust, and in such cases, code makes a warning to reduce the speed or altitude(given as input) for a possible flight. Engine power rating (%power demand of UAV) during flight can be defined by

where EPR is engine power or thrust rating (%), D the drag force (kN) acting on UAV, and Tathe maximum turbofan engine thrust available (kN) in flight conditions.
In order to find EPR in Eq.(2),detailed calculations of lift,drag forces and available engine thrust calculations were performed in each phase of the flight.A three-dimensional simplified geometry (consists of basic shapes e.g. cylinder, half sphere, oblique cone for fuselage and flat plates for wing and tails) was assumed for the geometry of the UAV as depicted in Fig.232.For the aerodynamic lift L and drag force D calculations of UAV, the following formulas were used33:

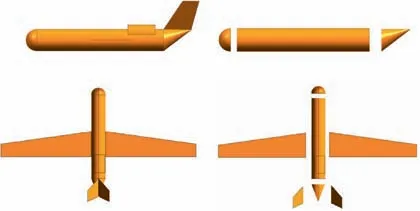
Fig. 2 A simplified UAV geometry32.

Table 2 ICAO data for AE3007A2 engine.24
Lift force formula consists of air density (ρ), flight speed(V), lift coefficient (CL) and wing area (S). It is normally assumed that lift force equals the instantaneous weight of UAV during cruise and loiter. At a given speed and altitude of UAV, lift coefficient can be calculated by

Drag force calculation is similar to lift formula,except that it has drag coefficient. Drag coefficient (CD) has two parts,namely parasite (zero lift) drag (DD0) and lift-induced drag:

In above equations, CD0is parasite (zero lift) drag coefficient; Cfeequivalent skin friction coefficient; Swetthe total wet area of UAV;S wing area;CDdrag coefficient;AR aspect ratio;e Oswald efficiency.Typical equivalent skin friction coefficients are given in Ref. 33 and for this study it was assumed to be (0.0035).
In order to calculate available thrust Ta, specific fuel consumption,total temperature and total pressure values at engine stations and emissions, detailed parametric turbofan cycle analysis was added to the code as a subroutine. Ref. 34 was used in general for turbofan engine cycle analysis, with the exception of burner exit temperature utilization. Although Ref. 34 used stator outlet temperature as a design parameter,Ref.35 recommended burner exit temperature to be accounted as design parameter and this approach was used in this study.Having a turbofan subroutine internally, is one of the main advantages of UAV sizing and performance calculation code.
2.3. Boeing fuel flow method 2
Methodology of using BFFM2 is explained below as a summary.25,29
Step 1. Get engine ground test data from ICAO database.This data is available in Ref. 24 for many turbofan engines above 26.7 kN(6000 lb)thrust.ICAO data includes NOxemission index (g/kg fuel), thrust setting (%), and fuel flow (kg/s)which will be used for BFFM2.
Step 2. Fuel flow correction for ICAO data. Fuel flow(kg/s) obtained in Step 1 will be corrected with some factors.These multiplication factors are 1.01, 1.013, 1.02 and 1.1 for takeoff (100%), climbout (85%), approach (30%) and idle(7%) thrust respectively. The reason for that is ICAO data was obtained during static engine ground testing without any aircraft installation effect or loss. Therefore, these correction factors are for the compensation of aircraft installation effects.
Step 3. Plot NOxemission index (EINOx) of ICAO versus corrected fuel flow obtained in Step 2.A curve fit for this plot(may be log-log plot)will give an estimation equation for any value of fuel flow.
Step 4. Now, for any given or measured fuel flow during flight, use the following equation to correct fuel flow for altitude and speed:

where Wffis corrected fuel flow factor,Wffuel flow,δ the ratio of ambient pressure over sea level pressure,θ the ratio of ambient temperature over sea level temperature, and Ma flight Mach number.
Step 5. In order to determine the reference emission index oxides of nitrogen (REINOx), use the curve fit equation obtained in Step 3 by inserting corrected fuel flow Wff(Step 4) to the equation.
Step 6. Reference NOxemission index (REINOx) obtained in Step 5 needs to be corrected in order to find final NOxemission index (EINOx) by utilizing the equation below:

where SH is the specific humidity. Calculation of specific humidity was later updated by Eurocontrol due to a mistake within the published BFFM2 specific humidity calculation.29Suggested specific humidity calculation by Eurocontrol was used in this study and details can be found in Ref. 29
Step 7. Total NOxEmission can be found by Eq. (1) given earlier.
2.4. DLR fuel flow method
Calculation method and steps for DLR FFM are similar to BFFM2 with some differences.27,30Steps 1-3 are the same.However, in Step 4, the following formulas will be used:

where θ=Ti/T0and δi=Pi/P0.Tiand Piare temperature and pressure at engine air intake respectively and are calculated from the ambient values by

In Step 6, the following equation will be used (all the remaining steps are the same as BFFM2):

2.5. Validation Case
In Ref.30,both calculated and measured values of NOxemissions during flight were presented for 10 different cases. In order to validate the methodology used, one of the cases was selected to follow the calculations and compare with the results of Ref. 30 Therefore, Case 9 was selected as validation case,namely B747-200B aircraft with CF6-50E2 turbofan engines.Steps 1-6 were applied for both BFFM2 and DLR FFM.EINOxresults are found to be 15.719 for BFFM2 and 15.861 for DLR FFM, whereas a value of 15.8 was given for both methods in Ref. 30 Therefore, results are within 0.5% with the results of Ref. 30 After this validation case, the same methodology was applied to the turbofan engine used in‘Global Hawk’ UAV.
2.6. UAV and turbofan engine sizing code
In Ref. 32, as a previous work, a genuine UAV and turbofan engine sizing code was developed, which uses more than 100 inputs which are defined as UAV and turbofan engine design parameters. Deviation in results of the genuine code for UAV weight and size is about±1.5%with respect to‘Global Hawk’ data available in literature. Similarly, ‘AE3007’ turbofan engine cycle parameters were calculated by the code and were compared to the results of GasTurb35which is a commercial engine cycle analysis software.Maximum deviation for ondesign calculations (for each mission point) is ±1% with respect to GasTurb calculations. Baseline UAV data for this study is given in Table 336,37.
The flight cycle or mission profile assumed for this study is shown in Fig.3.An operational radius(distance to loiter location)of 2222 km(1200 nautical miles)and cruise/loiter altitude of 15 km are assumed for a sample mission.A total of 11 mission points are defined including engine start, idle, taxi, takeoff, climb, cruise, loiter, return cruise, descent and landing.
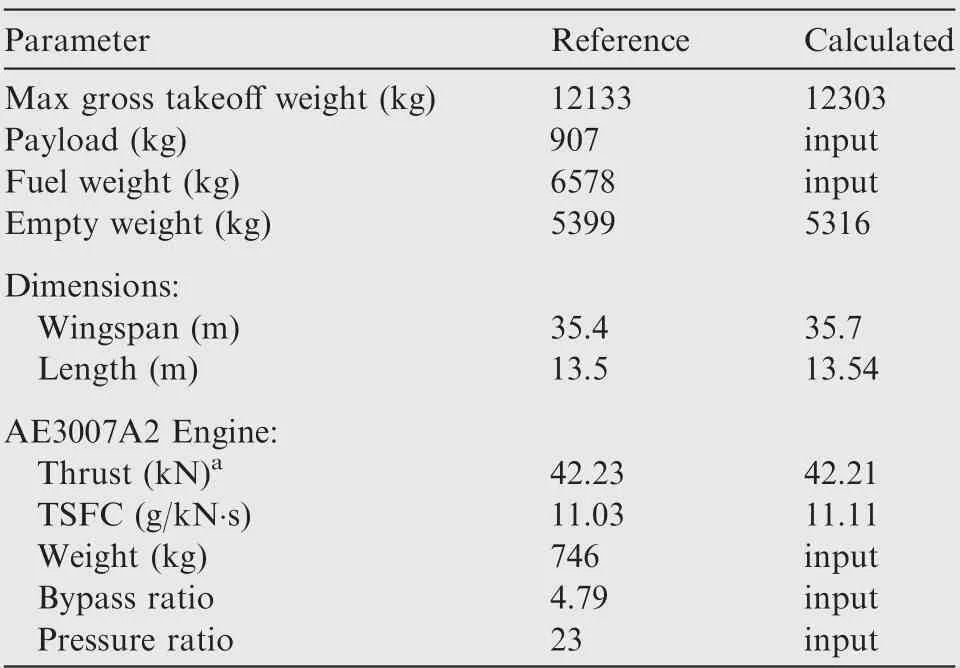
Table 3 RQ-4A and engine data.36,37
In this study, the genuine code was modified by adding NOxemissions prediction methods namely BFFM2 and DLR FFM at every design point of the UAV during the flight cycle. In this way, the code gained the capability to estimate NOxemissions of UAV engine at any given altitude and speed.
2.7. Remarks
In this study,NOxemissions calculation model does not include any formulation with respect to NOx-Ozone interaction,Ozone depletion/formation and NOxglobal warming potential.
3. Results and discussion
In this study, NOxemissions at every mission point of the UAV were analyzed for different flight altitude and airspeed(Mach number) by a genuine code. To calculate emissions at a flight point,we should also calculate the EPR(engine power rating (%) or % power demand) of UAV during flight which was defined by Eq. (2). For this reason, EPR was calculated at different altitude and Mach number and is given in Fig. 4.Since the thrust of turbofan engine decreases as altitude increases,at higher altitudes UAV demands more thrust rating up to 100% until it reaches the service ceiling. It can be observed from Fig. 4 that UAV has the lowest engine power demand at 9 km and the highest at 16 km. Additionally, it can be seen in Fig. 4 that the increased speed of UAV is also demander of more engine power,although there is a minimum drag speed at every altitude.Lower speeds than minimum drag speed mean approaching to stall speed and produce higher drag (more engine power rating). This data and trend were used during analysis of NOxemissions during flight, because NOxemissions depend very much on engine power rating(%).
3.1. Calculation of NOx emission indices
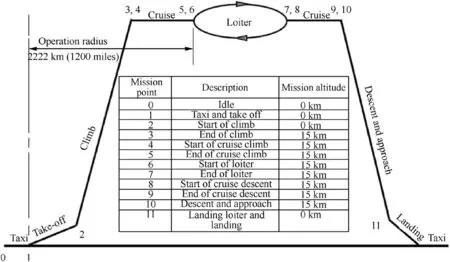
Fig. 3 Assumed flight cycle for turbofan powered UAV.
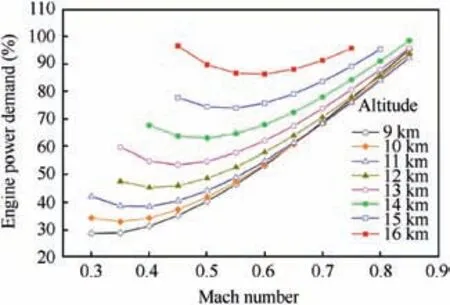
Fig. 4 Engine power demand of UAV during loiter.
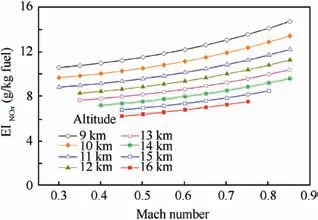
Fig. 5 NOx emission index calculated by ‘Boeing fuel flow method 2’ for 100% power.
The code was run many times to obtain NOxemission indices for a range of flight altitude and airspeed parameters. NOxemission indices are calculated by both BFFM2 and DLR FFM as mentioned previously. In order to obtain results for NOxemissions, the code was run for flight altitude between 9 km and 16 km with 1 km increments and for airspeed between 0.2 and 0.9 Mach number with 0.1 Mach number increments which make 15×8 cases to run. Therefore 120 cases were run to provide data for Figs.4-10 to present analytical solutions before optimization. Figs. 5 and 6 show NOxemission index (g/kg fuel) calculated by BFFM2 and DLR FFM for 100%power,respectively.Figs.5 and 6 have similar appearance and trend,although some small deviations exist in magnitudes of emission indices. These two figures show that NOxemission indices increase as Mach number increases and as altitude decreases. Altitude effect is mainly because of change in atmospheric temperature and pressure. Cooler and lower pressure air means lower NOxproduction. Mach number affects the dynamic pressure and consequently total pressure and total temperature under the engine inlet conditions.Higher speeds mean higher total pressure and total temperature in engine causing higher NOxproduction. Those comments are also true when we consider ‘P3T3’ (compressor discharge total pressure and total temperature) methods, and NOxemission indices are directly proportional to ‘P3’ and‘T3’.
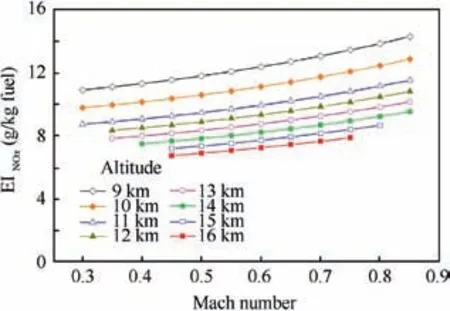
Fig. 6 NOx emission index calculated by ‘DLR fuel flow method’ for 100% power.
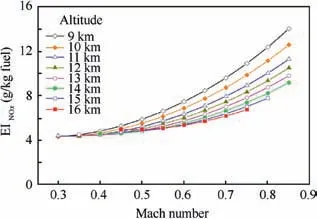
Fig. 7 NOx emission index calculated by ‘Boeing fuel flow method 2’ at loiter engine power demand.
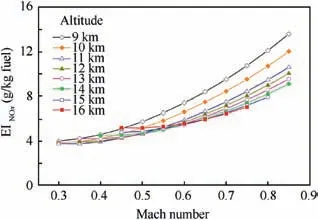
Fig. 8 NOx emission index calculated by ‘DLR fuel flow method’ at loiter engine power demand.
When NOxemission indices were calculated for engine power rating other than 100%(Figs.7 and 8),they look somewhat different than Figs. 5 and 6 (for 100% power). Figs. 7 and 8 actually show the emission indices calculated at engine power (%) demand of UAV during loiter (given in Fig. 4).Fig. 7 depicts the results of BFFM2 and Fig. 8 illustrates the results of DLR FFM for NOxemission indices. Figs. 7 and 8 exhibit similar trends since their formulations are similar.At this point, it is important to compare Figs. 5 and 7 as engine power rating affected the magnitude of NOxemission indices considerably.In Fig.7,at slower speeds(Mach number 0.3-0.4) NOxemission index is around 4.5-5 for all altitude values whereas in Fig. 5 (EPR 100%) it is in the range of 6-11. In fact, NOxemission indices are close to minimum when speed is less than 0.45 Mach for any altitude. However, for moderate (Mach number 0.5-0.6) and higher speeds (Mach number 0.7-0.8), the altitude needs to be higher for lower NOxemissions.
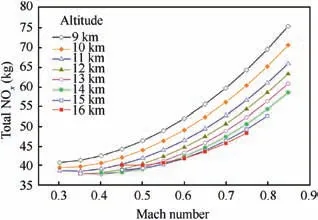
Fig. 9 Total mission NOx emission (kg) calculated by ‘Boeing fuel flow method 2’.
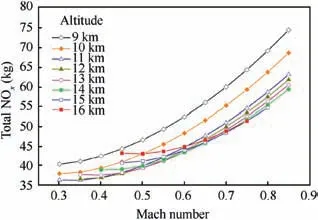
Fig. 10 Total mission NOx emission calculated by ‘DLR fuel flow method’.
Finally,total NOxemission was calculated for the complete flight cycle from ground start to landing. Again both BFFM2 and DLR FFM are used for calculation. Results are given in Figs. 9 and 10. These two figures show that in general higher speeds result in higher NOxproduction. There are optimum speeds for minimum NOxvalue at every altitude. Optimum speeds are closer to lower end of Mach number range (0.35-0.45 Mach).Another inference which can be made from Figs.9 and 10 is that higher altitudes are generally good for low NOxproduction due to cooler air entry to the engine; however lower altitudes are preferable due to lower engine power demand (EPR) or thrust rating (see Fig. 4). Although trends are similar, there are differences between Figs. 9 and 10 due to different methods used.
3.2. Optimization studies
In addition to the calculations given in previous section, the genuine code was configured to optimize the NOxemissions and/or loiter time of UAV during complete flight cycle.Table 4 shows the results of 3 different cases in which objectives to be minimized or maximized are different. Results of Cases 1, 2 and 3 are in parallel with Figs. 9 and 10. In fact, optimum points shown in Table 4 are more accurately calculated versions of Figs. 9 and 10 by optimization subroutine.
In Case 1, loiter time was selected to be maximized in the given interval of altitude and Mach number. Maximum loiter(surveillance) time at target area was found to be 25.38 h at 14.84 km altitude and 0.43 Mach number, with 38.80 and40.27 kg of total NOxproduction as per BFFM2 and DLR FFM respectively.
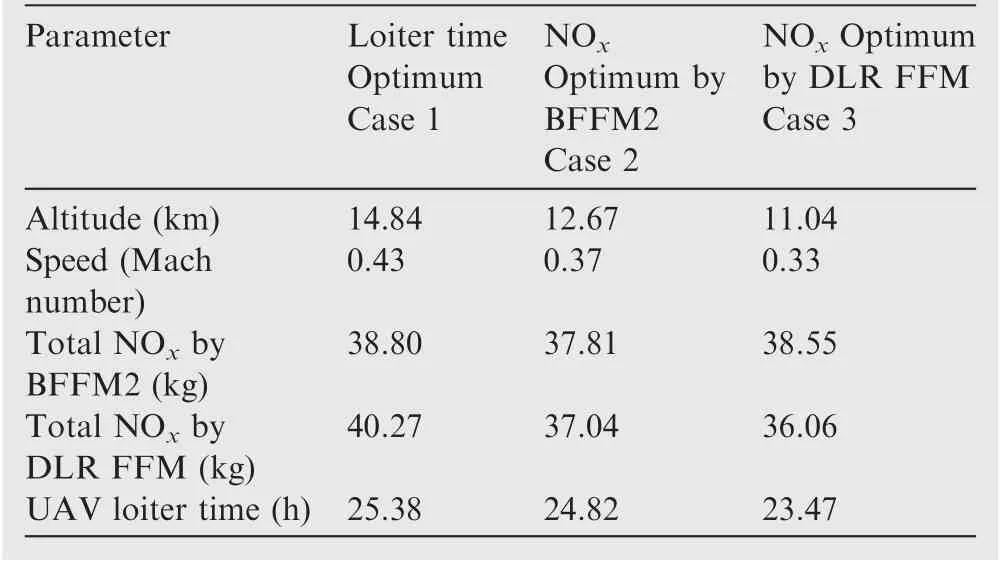
Table 4 Optimization results for maximum loiter time and minimum NOx emissions.
In Case 2, objective function was selected to minimize the total NOxproduction during all flight cycle, namely ground run, taxi, takeoff, climb, cruise to target area, loiter (surveillance) at target area, cruise back, descent, landing of UAV as per BFFM2 in the given interval of altitude and Mach number.Minimum total NOxproduction as per BFFM2 was calculated to be 37.81 kg at 12.67 km altitude and 0.37 Mach number. Total NOxas per DLR FFM is 37.04 kg and loiter time at target area was found to be 24.82 h.
In Case 3, objective function was selected to minimize the total NOxproduction during all flight cycle as per DLR FFM. Loiter time dropped to 23.47 h and total NOxproduction as per DLR FFM is 36.06 kg in minimum condition at 11.04 km and 0.33 Mach number. However, total NOxproduction as per BFFM2 is 38.55 kg.
4. Conclusions
The aim of this study was to calculate and optimize the total amount of NOxemissions which are produced by a turbofan engine powered UAV in a representative flight cycle. This is done for a long endurance UAV loitering more than 24 h at surveillance altitude. The following items can be concluded from this study:
(1) UAV operations which are getting widespread can be optimized for minimum NOxemissions for selected parameters.
(2) In general, at slower speeds NOxproduction is lower due to lower engine inlet total temperature which increases with flight Mach number.
(3) Higher altitudes decrease the NOxdue to lower atmospheric temperatures.
(4) Lower engine power rating decreases the NOxif the UAV does not require 100% power under flight conditions.
(5) Higher speeds generally increase the engine power rating due to increased aerodynamic drag.
(6) Higher altitudes generally increase the engine power rating due to less density of air and thus decrease thrust.
(7) As a combination of above items, there is a minimum NOxproduction point at certain altitude and speed for UAV as an optimized condition.
Acknowledgement and disclaimer
The views and opinions expressed in this article are those of the author and do not necessarily represent the official policy or position of any affiliated institution or company.
 CHINESE JOURNAL OF AERONAUTICS2020年6期
- CHINESE JOURNAL OF AERONAUTICS的其它文章
- A novel variable structure multi-model approach based on error-ambiguity decomposition
- Multi-block SSD based on small object detection for UAV railway scene surveillance
- A new online modelling method for aircraft engine state space model
- Cross-sectional deformation of H96 brass double-ridged rectangular tube in rotary draw bending process with diあerent yield criteria
- Application of a PCA-DBN-based surrogate model to robust aerodynamic design optimization
- Numerical exploration on the thermal invasion characteristics of two typical gap-cavity structures subjected to hypersonic airflow
