An adaptive sequential experiment design method for model validation
Ke FANG, Yuchen ZHOU, Ping MA
Control and Simulation Center, Harbin Institute of Technology, Harbin 150080, China
KEYWORDS Adaptive sequential experiment design;Credibility distribution function;Gaussian process model;Metamodeling;Model validation
Abstract Efficient experiment design is of great significance for the validation of simulation model with high nonlinearity and large input space. Excessive validation experiment raises the cost while insufficient test increases the risks of accepting an invalid model.In this paper,an adaptive sequential experiment design method combining global exploration criterion and local exploitation criterion is proposed. The exploration criterion utilizes discrepancy metric to improve the space-filling property of the design points while the exploitation criterion employs the leave one out error to discover informative points.To avoid the clustering of samples in the local region,an adaptive weight updating approach is provided to maintain the balance between exploration and exploitation.Besides, the credibility distribution function characterizing the relationship between the input and result credibility is introduced to support the model validation experiment design. Finally,six benchmark problems and an engineering case are applied to examine the performance of the proposed method.The experiments indicate that the proposed method achieves satisfactory performance for function approximation in accuracy and convergence.
1. Introduction
Simulation model is developed to replace the complicated physical system for performance analysis,design optimization,evaluation, et al. Model validation is defined as the process of determining the degree to which a model is an accurate representation of the real world system from the perspective of the intended use of the model.1-3The model is valid means that it behaves similar to the real world system for any effective input.The increasing of validation experiments will enhance the confidence in using the computational model as well as reduce the risks of using an invalid model to some extent. However,extensive experiments may lead to the sharp increase in cost,which complex simulation model development is not able to afford. Thus, to guarantee the credibility and usability of the computational model, restrict the sample scale and avoid the risks of accepting an incredible model should be taken into account simultaneously in model validation experiment design.
Recent model validation researches focus on how to measure the similarity between model behavior and real system behavior.4-6While the studies of how to design experiment for model validation are limited.Blattnig et al.7proposed that the validation experiment is executed only at a finite number of sample points because of the high cost of running of highfidelity system.It is of great significance to predict the credibility of simulation result at any points other than the validation points. Aeschliman and Oberkampf8proposed that the experiment design for Computational Fluid Dynamics(CFD)model validation should capture the essential physics, including all relevant physical modeling data and initial and boundary conditions required by the code. Trucano et al.9stated that it is not appropriate to leave the design of validation experiments to experimenters. The life prediction is important for the reliable design. Collecting life testing data for life prediction model validation under nominal stress levels is timeconsuming and costly. Ao et al.10studied how to design the optimal testing stress levels and the number of tests at each stress level for model validation. The above studies provide general guidance or experiment design method for a specific model.
The experiment design methods are classified into two categories: One Shot Experiment Designs (OSED)11and Sequential Experiment Designs (SED). When using OSED, sampling scale is defined in advance and the design scheme is generated at once following certain criteria (distance criteria, projective criteria, orthogonal criteria, et al). Since the simulation responses are not considered in OSED, the design schemes are available for any other systems.
SED is a flexible incremental sampling method for metamodeling or function approximation. Compared to OSED,SED iteratively select new point using the information from previous iterations and it is not required to predetermine the sample size, which is beneficial for avoiding over-sampling and under-sampling. Yao et al.12designed a gradient-based sequential sampling method for metamodeling of radial basis function neural network. Yang et al.13proposed a fast incremental Latin hypercube design method based on graph theory.However,the above SED approaches only considered one certain kind of information and failed to make full use of the information from the previous metamodeling.
Adaptive Sequential Experiment Design (ASED) is a more promising sampling method.Deschrijver et al.14proposed that an effective ASED approach should contain two conflicting parts: local exploitation and global exploration. Local exploitation focus on choosing the sample points in regions which may have higher prediction error or uncertainty (called interesting regions or informative regions).Global exploration attempts to select points in the regions with few samples and is helpful to reduce the risk of local clustering of design points.Jones et al.15proposed an Expected Improvement criterionbased ASED method (EI-ASED) for the approximation of nonlinear and multimodal functions.EI-ASED minimizes prediction response to do local exploitation while maximizes prediction variance to do global exploration. Mackman,16Picheny,17and Herna´ndez-Lobato18et al.extended the searching criterion of EI-ASED from different perspective. Garud et al.19designed a smart sampling algorithm (CD-ASED) by combining the crowding distance metric (global exploration)and departure function (local exploitation). Although there are some ASED methods proposed, the model validation experiment design has its unique characteristics which should take into account in the experiment design.
It is a difficult task to design experiment and validate the simulation model characterized by high nonlinearity and large input space.7-10To resolve this problem, the credibility distribution function characterizing the relationship between the input and result credibility is introduced to support the model validation experiment design and an efficient sequential experiment design method, termed discrepancy criterion and leave one out error-based ASED (DL-ASED), is proposed. DLASED maximizes a novel discrepancy criterion to do global exploration and maximizes the leave one out error to discover the informative point in local region. An adaptive weight updating approach is designed to balance the local exploitation and global exploration.
This paper is organized as follows. In Section 2, the problem in model validation experiment design is firstly discussed.Then, in Section 3, DL-ASED is proposed. In Section 4, the performance of ASED method is evaluated with six benchmark problems and an engineering case.Finally,Section 5 presents conclusion about the proposed DL-ASED method for model validation.
2. Problem formulation
The complex simulation model or real world system is defined as a function:

where x= [x1,x2,···,xm]Tdenotes the input vector in input space X and y= [y1,y2,···,yn]Tdenotes the output vector in output space Y. m and n denote the dimensions of input and output, respectively. Simulation model fsimis credible means that for arbitrary input x ∈X, the corresponding response ysimof simulation model fsimcan imitate the output yobsof real world system or a high-fidelity system fobs.
The result credibility c of simulation model is defined as the similarity between simulation response fsim( x) and real world system output fobs(x ).Various similarity metrics can be utilized to measure the result credibility.4-6In general, the result credibility is a value in[0,1].When the credibility is 1,the simulation model output is fully credible. Fig. 1 reveals some important definitions. The region where the result credibility at any input point exceeds the acceptable threshold cTis named credible region while the rest region in input space is named incredible region. The simulation model can be safely used in credible region since the result achieves satisfactory accuracy.
Considering the validation experiments are usually conducted on a finite number of sample points,the credibility distribution function is introduced to characterize the relationship between the model input and result credibility.
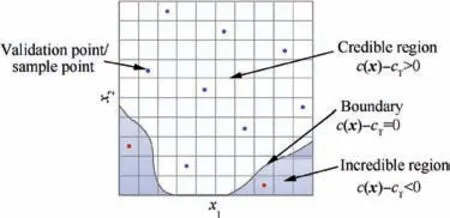
Fig. 1 Validation point, credible region and incredible region.
Definition 1. A function h:x ∈X↦c=h(x )∈C is called the credibility distribution function of fsimon X if it can maps x to a credibility value c in credibility space C ⊆R.
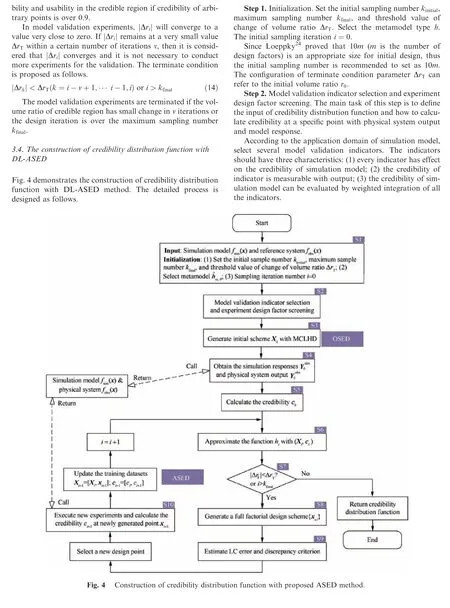
Credibility distribution function provides feasible guidance for the model validation experiment design.An important concern in the design of model validation experiments is how to make a tradeoff between sample scale and risks of insufficient test. When the credibility distribution function accurately describes the boundary between credible region and incredible region, it is appropriate to terminate the validation experiments.
Fig. 2 reveals a framework of model validation with sequential experiment design. Firstly, conduct experiments on engineering system and simulation model respectively with newly generated design point xi+1. Meanwhile, collect the system output and simulation response data. Then, calculate the result credibility c(xi+1) using the collected data. Thirdly,update the credibility distribution function c=h (x ) with the expanded training samples using parameter optimization algorithm. Finally, evaluate the new credibility distribution function. If the terminal condition is satisfied, then stop sequential validation experiment; otherwise, select the next experiment point according to the existed samples and credibility distribution function.
To construct a credibility distribution function, a series of sample points X= [x1,x2,···,xk] should be selected carefully.The numerical model and engineering system are executed to obtain the corresponding output and calculate the credibility vector c= [c1,c2,···,ck].The construction of credibility distribution function is to find an appropriate function ^h with the input-output data such that ^h can imitate the behavior described by the training data by some performance measures.The construction of credibility prediction model is similar to the metamodeling process. Thus, the method proposed in this paper is also effective for metamodeling.
Approximate function or metamodel types, function parameters, training samples should be considered in the construction of credibility distribution function.The generation of credibility distribution function may refer the following formula20.

where Λ denotes the metalmodel quality evaluation function;ω denotes arbitrary optional approximate function in function space W; θ denotes the parameter vector of ω in parameter space Q; ε denotes the loss function of the metamodel ^hω,θ;(X ,c) denotes the training samples.
ASED iteratively selects new design points by maximizing the weighted combination of global exploration value and local exploitation value.

where α denotes the weight of local exploitation and it is updated according to an adaptive strategy discussed in next section; xi+1denotes the new points in the (i +1)th sampling iteration; l (x ,Xi) and g( x ,Xi) denote the exploitation value and exploration value of candidate point x in design space D respectively; Xidenotes the set of existed points before the(i +1)th iteration.
Local exploitation focuses on the regions with potential to improve the prediction accuracy. Global exploration expects to improve the space filling property and reduces the risk of local clustering of design points.Through the tradeoff between global exploration and local exploitation, a global metamodel may be constructed.
In this work,we develop an adaptive sampling method that differs from the current approaches in three aspects. First, the support points characterized by neighboring property and sustaining property, is introduced to estimate the exploration value rather than using all the existed points to calculate the criterion in some other methods. Second, a novel discrepancy criterion is designed to accurately measure the exploration value of the alternative samples. Third, an adaptive approach is designed to update the weight in sequential experiment design.
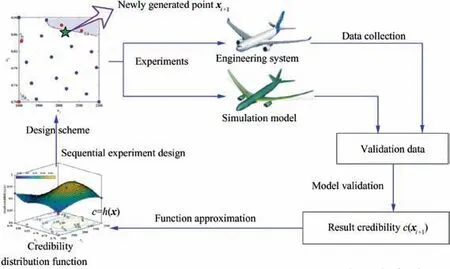
Fig. 2 A framework of model validation with sequential experiment design.
F6-Schwefel function (SW)

4.1.2. Test scheme
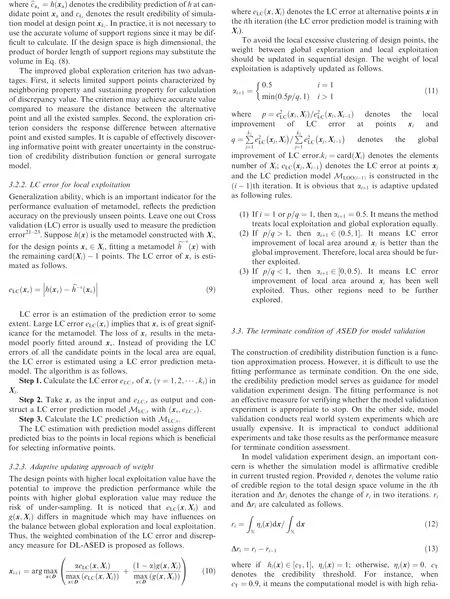
Although there are various kinds of metamodel38-41proposed,Gaussian Process model(GP)16,17,42,43is extensively used in function approximation. The proposed DL-ASED method is compared with EI-ASED,15CD-ASED,19Space Filling-based SED(SF-SED), gradient-based SED(GR-SED).SF-SED is a pure global exploration-based SED method and the alternative point with smaller Audze-Eglais (AE)criterion44is selected as the new sample. GR-SED is a pure local exploitation-based SED approach and the candidate point with maximum gradient is chosen as the next design point.
MSE (Mean Square Error) and MAbE (Maximum Absolute Error) are used to measure the global fitting performance and local exploitation performance respectively. For each function,a design scheme with 10,000 points is randomly generated and the responses are calculated as independent samples for the performance evaluation.
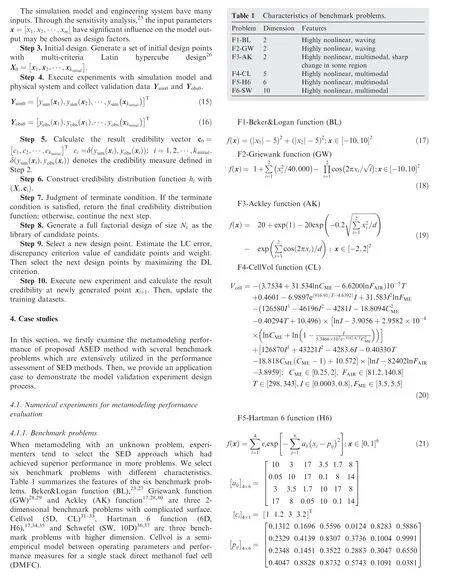
Table 2 shows the sampling configurations for the six benchmark problems. The initial sample size is set as 10 m.For 2D problems, a large sequential number is chosen(90 m); whereas for the test functions with high dimensions,the sequential number is set as 50 m because the alternative design point searching and parameter optimization are time consuming. Each sequential process is replicated 30 times.
4.1.3. Result and discussion
Table 3 reveals the average GP modeling result with five SED approaches for six benchmark problems and the best performance is highlighted in bold. The notations Average and STD denote the average and standard deviation values of MSE or MAbE over 30 runs. Fig. 5 depicts the change curve of average MSE in sequential sampling process (Fig. 6).
From Table 3 and Fig. 5, we can draw the following conclusions:
(1) The proposed DL-ASED method achieves superior performance in all the six test cases except H6 function.Smaller average MSE and average MAbE value indicate that, the discrepancy criterion and LC criterion of DLASED are effective to improve the fitting performance in both global design space and local area.
(2) Compared with selected SED methods,average MSE of DL-ASED converges fast,which means DL-ASED is an efficient SED method to build high performance metamodel with few samples.Besides,DL-ASED is with better stability because the STD of MSE and MAbE of DL-ASED are lower than that of other methods.
(3) Three ASED methods perform better than SF-SED and GR-SED. The sample points of GR-SED are easy to accumulate in some steep areas of response surface since all the benchmark problems are characterized by nonlinear and multimodal.SF-SED cannot discover the points which may be beneficial for the improvement of metamodeling accuracy in some interesting regions.Thus,global exploration and local exploitation are both essential for searching promising design points.
4.2. An engineering experiment of model validation with ASED methods
4.2.1. Background and configuration
MEBSM is a multi-fidelity EMRG (electromagnetic railgun)ballistics simulation model and is developed for the simulation-based striking performance evaluation of EMRG system.26,45Fig. 6 reveals the structure of EMRG ballistics simulation model according to the solving process.41CFD is employed to calculate the aerodynamics coefficients in the aerodynamics model of the High Fidelity Model(HFM)fHFM. Although fHFMis accurate, the program is sophisticated and the computational cost is expensive. The Low Fidelity Model(LFM) fLFM, which estimate the aerodynamics coefficients with a simplified coefficients table,is extensively utilized in the performance evaluation. It is difficult to guarantee fLFMis completely valid in the entire input space.Thus,we conduct the sequential experiment to validate LFM.
Table 4 shows the range of six input parameters. The high fidelity model is served as a reference model. The shooting range yx-range, the displacement in the cross-range direction yz-range,terminal velocity yterminlvelocityis selected as the indicators for model validation. The credibility at specific validation points x is calculated by the following equation.

In the sequential experiment, an approximate model c=h (x ) is constructed to describe the relationship between the input parameters and result credibility of LFM.The initialsample number and maximum sequential sample number is set as 10 m and 30 m respectively. The terminate condition is as follows

Table 2 Sampling configurations for six benchmark functions.
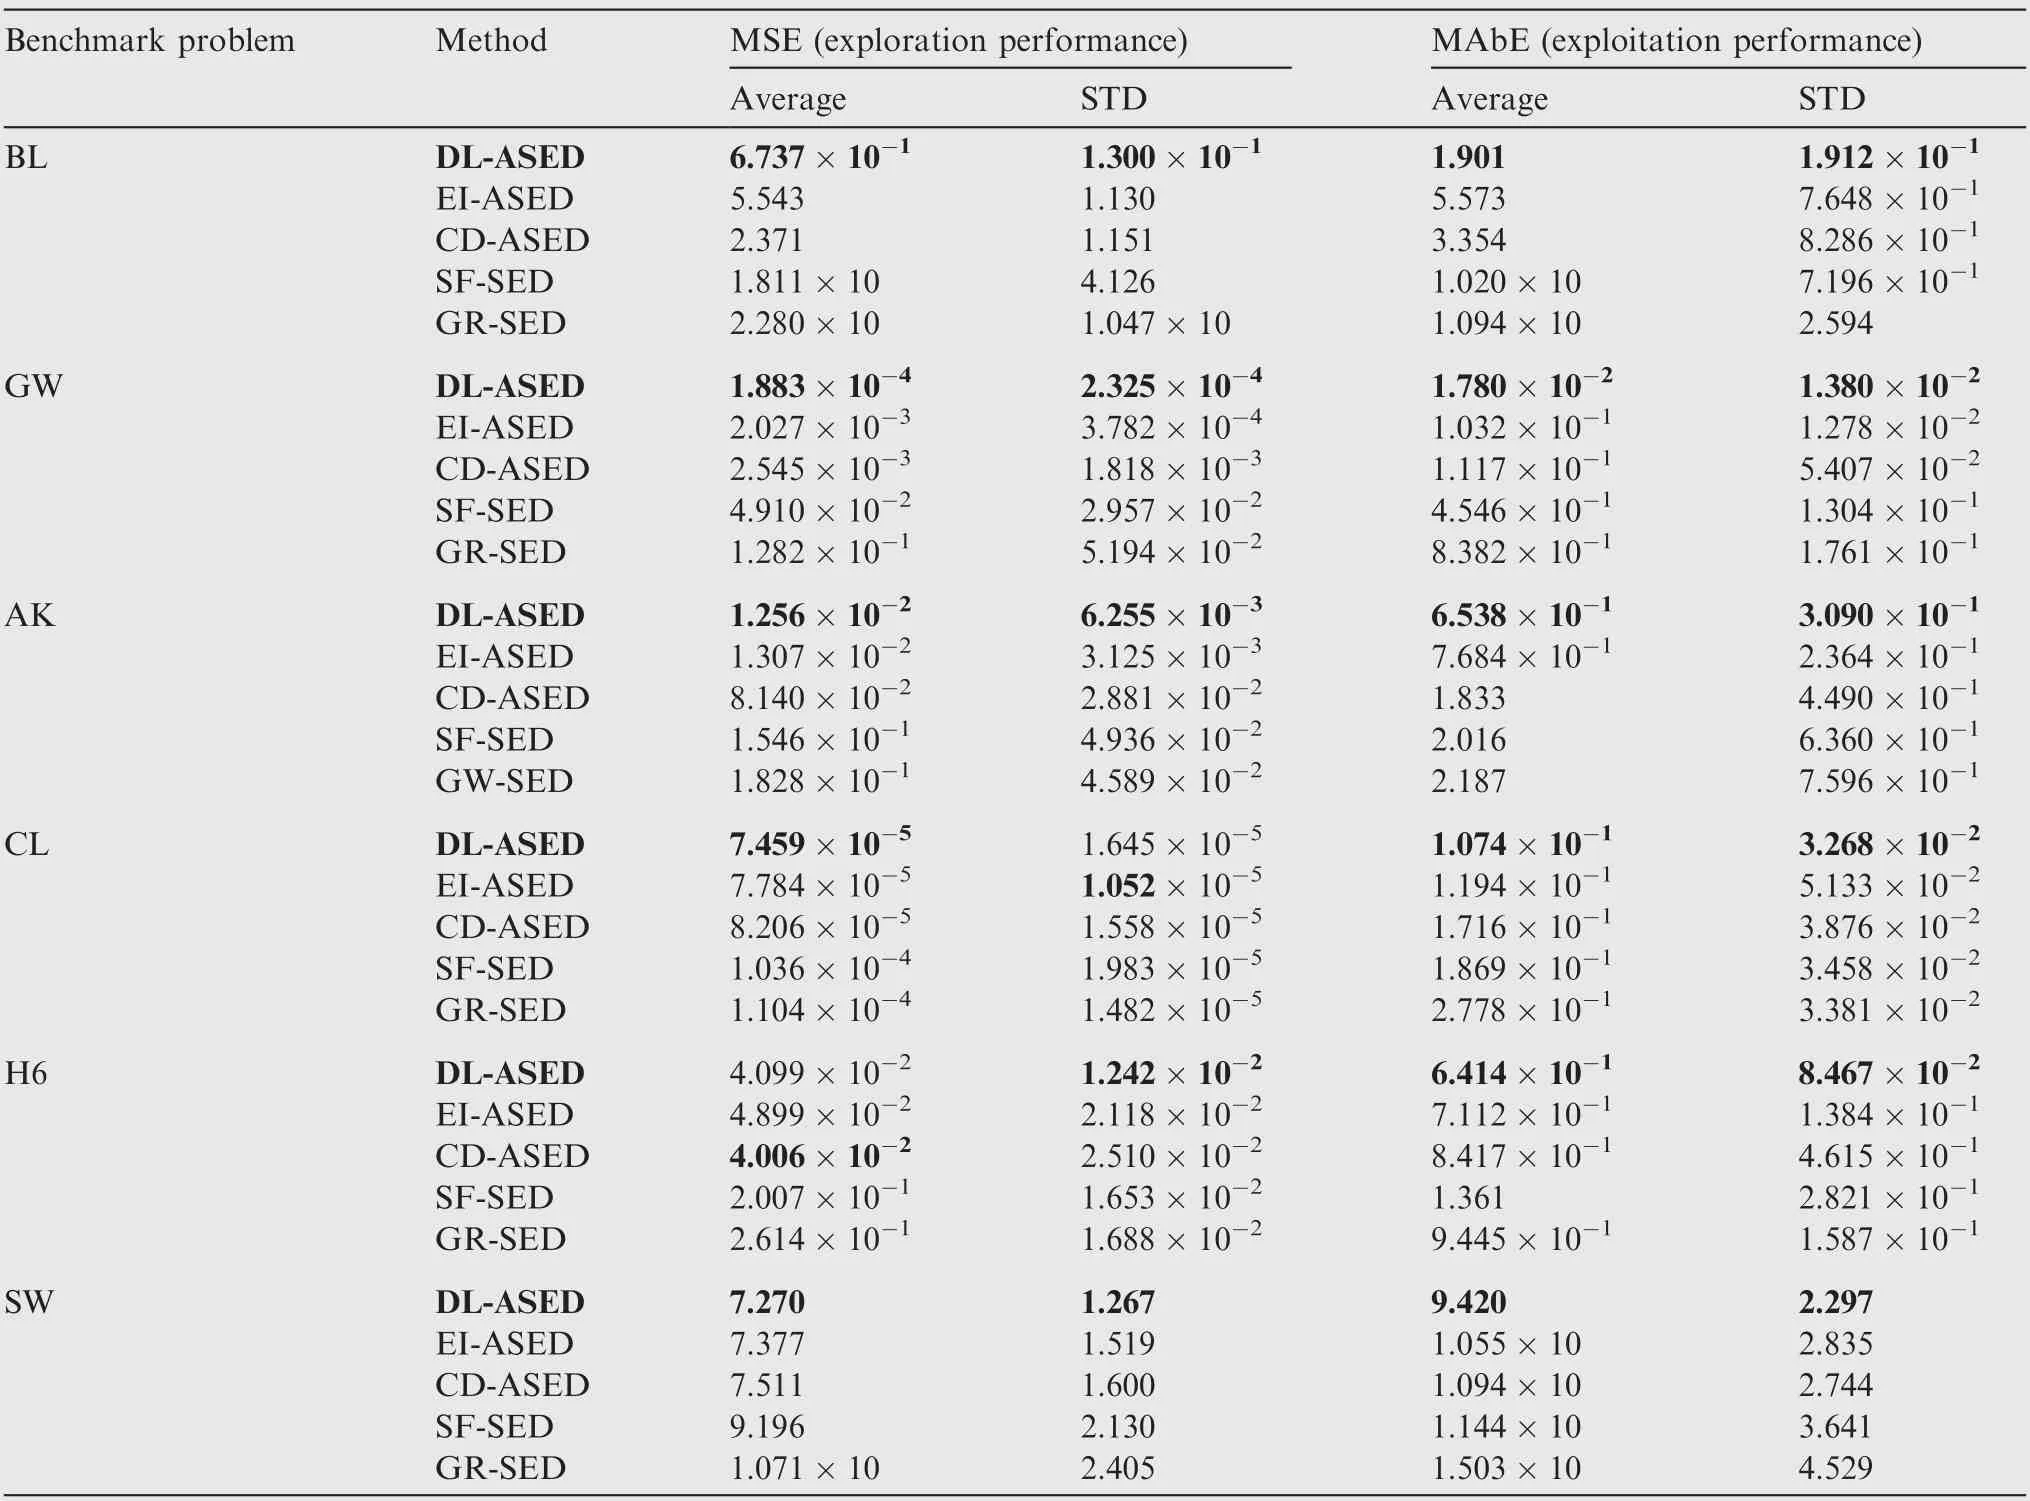
Table 3 GP modeling results with five SED approaches for six benchmark problems.

where r0denotes the volume ratio of credible region calculated with initial credibility prediction model. The model validation experiment is terminated if the volume ratio of credible region has small change in 10 iterations or the design iteration is over maximum sampling number 30 m.GP model is selected as the approximation function.
4.2.2. Result and discussion
The proposed DL-ASED method is compared with EI-ASED and CD-ASED. The change curve of rk(volume ratio of credible region) and Δrk| | (change of volume ratio of credible region) are illustrated in Fig. 7 and Fig. 8 respectively.Although DL-ASED is stopped at the 114th iteration because Δrk| | is lower than 0.001r0from 105th to 114th iteration. The DL-ASED experiment is continued until the iteration reaches the maximum sampling number to find the convergent value of rk.
It is observed that rkof DL-ASED converges fast and remains stable after 114th iteration. In addition, Δrk| | of DLASED is lower than 0.001r0after 114th iteration which means the increasing of new samples will not improve the fitting performance of credibility distribution function significantly as well as the ratio of credible region. Although EI-ASED and CD-ASED reach the terminate condition at 133nd and 131st iteration, rkdoes not converge completely. Compared with EI-ASED, the experiment efficiency is improved by 14.29%.
Volume ratio of credible region is an indicator for measuring the usability of LFM. According to the validation experiment, the LFM of MEBSM is valid in about 91% region of entire input space. In the application of MEBSM, lowfidelity trajectory simulation model can be safely used to generate massive data for performance evaluation if the sample point is in the 91% credible region; otherwise, LFM should be restricted used and can be replaced by high-fidelity trajectory simulation program for simulation. The credibility distribution function provides a feasible manner to predict the result credibility of LFM at arbitrary sample point.
5. Conclusions
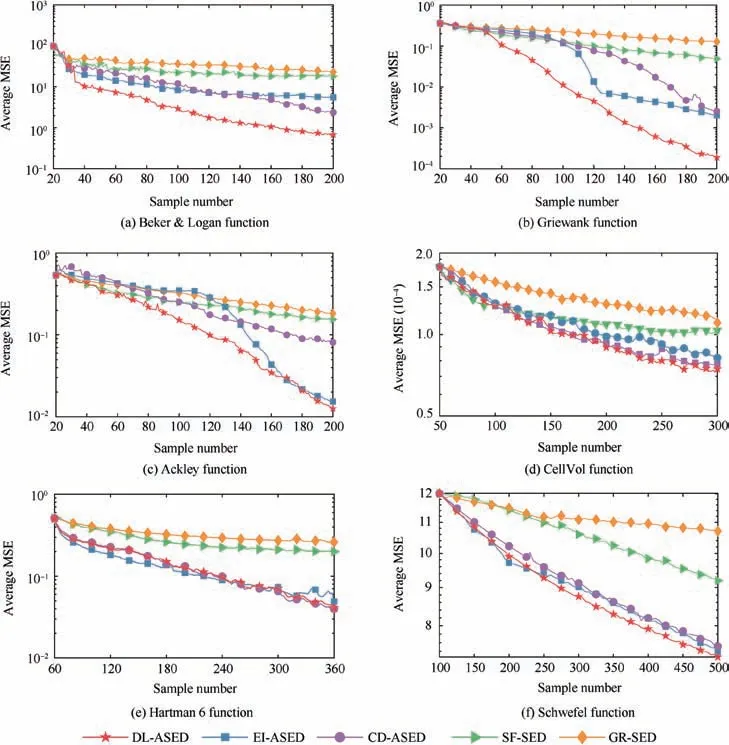
Fig. 5 Average MSE.
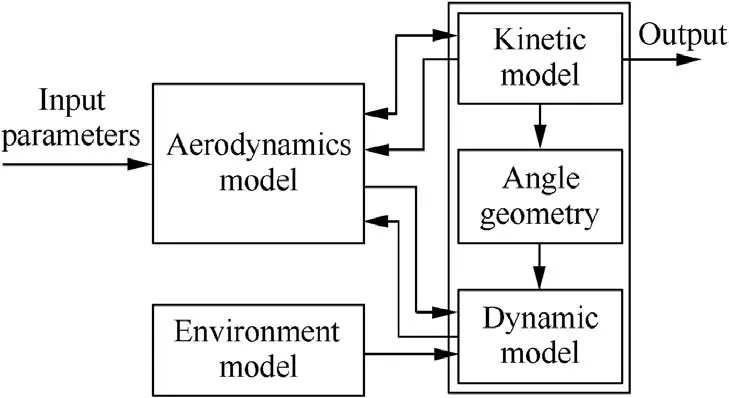
Fig. 6 EMRG ballistics simulation model.
It is a difficult task to design experiment for model validation owing to test cost and high nonlinearity of simulation model.This paper presents a DL-ASED method for the approximation of credibility distribution function. It selects new points by maximizing the weighted sum of the discrepancy criterion and LC error.The discrepancy criterion,incorporating the distance and response difference between candidate points and existed samples, is beneficial for selecting points characterized by space-filling property.The LC error is used to exploit interesting local region and discover informative points for improving the metamodeling accuracy. Furthermore, the weight updating approach can automatically keep the balance between global exploration and local exploitation.The performance of DL-ASED is compared with some existing ASED approaches on six benchmark problems and an engineering case. The result reveals that DL-ASED performs better in accuracy and efficiency.
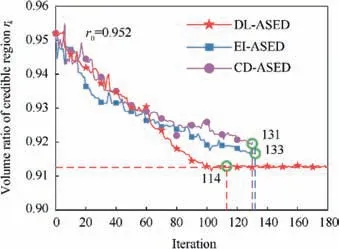
Fig. 7 Change curves of rk.
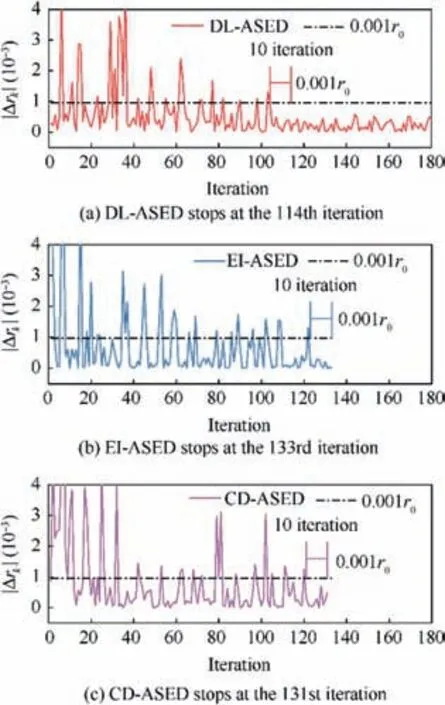
Fig. 8 Change curves of Δrk| |.
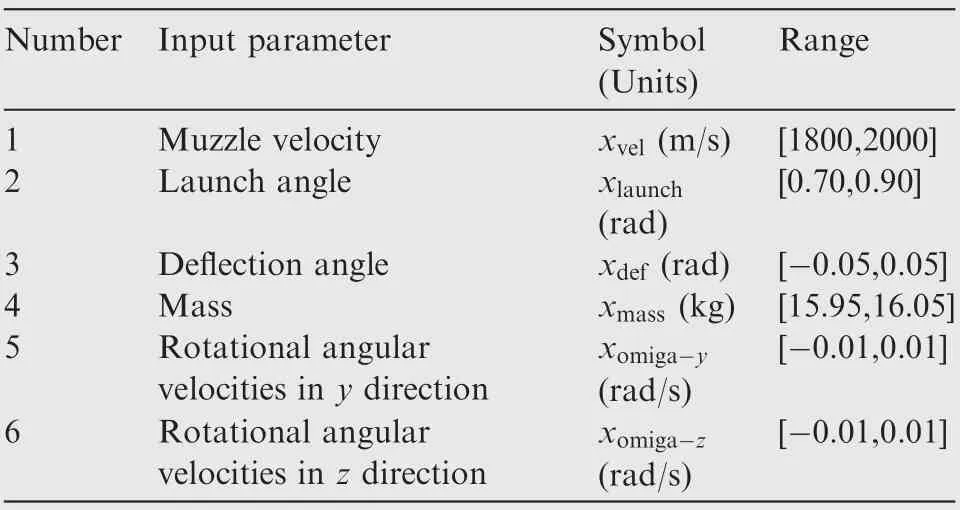
Table 4 Range of input parameters.
Acknowledgements
The authors are grateful to the anonymous reviewers for their constructive comments of the manuscript.This study was supported by the National Natural Science Foundation of China(No. 61627810).
 CHINESE JOURNAL OF AERONAUTICS2020年6期
- CHINESE JOURNAL OF AERONAUTICS的其它文章
- A novel variable structure multi-model approach based on error-ambiguity decomposition
- Multi-block SSD based on small object detection for UAV railway scene surveillance
- A new online modelling method for aircraft engine state space model
- Cross-sectional deformation of H96 brass double-ridged rectangular tube in rotary draw bending process with diあerent yield criteria
- Application of a PCA-DBN-based surrogate model to robust aerodynamic design optimization
- Numerical exploration on the thermal invasion characteristics of two typical gap-cavity structures subjected to hypersonic airflow
