Numerical simulation of compression corner flows at Mach number 9
Amjad A. PASHA, Khalid A. JUHANY
Department of Aerospace Engineering, King Abdulaziz University, Jeddah 21589, Saudi Arabia
KEYWORDS Boundary layer;Expansion fan;Heat transfer;Hypersonic flows;Separation length;Shock-unsteadiness model;Shock wave;Turbulence model;Turbulent Prandtl number
Abstract A hypersonic vehicle encounters a wide range of conditions during its complete flight regime. These flight conditions may vary from low to high Mach numbers with varying angles of attack. The near-wall viscous dissipation associated with flows at combined high Mach and Reynolds numbers leads to significant wall heat transfer rates and shear stresses. The shock wave/boundary-layer interaction results in a flow separation region, which commonly augments total pressure losses in the flow and lowers the efficiency of aerodynamic control surfaces such as fins installed on a vehicle. The standard turbulence models, when used to resolve such flows, result in incorrect separation bubble size for large separated flows.Therefore,it results in an inaccurate aerodynamic load, such as the wall pressures, skin friction distribution, and heat transfer rate. In previous studies,the application of the shock-unsteadiness correction to the standard two-equation kω turbulence model improved the separation bubble size leading to an accurate pressure prediction and shock definition with the assumption of constant Prandtl number.In the present work,the new shock-unsteadiness modification to the k-ω turbulence model is applied to the hypersonic compression corner flows. This new model with variable Prandtl number is based on the model parameter,which depends upon the local density ratio. The computed wall pressures, heat flux and flow field are compared to the experimental data. A parametric study is carried out by varying compression deflection angles,free stream Reynolds number and wall temperatures to compute the flow field and wall data accurately, particularly in the shock boundary layer interaction region. The new shockunsteadiness modified k-ω model with variable Prandtl number shows an accurate prediction of initial pressure rise location,pressure distribution in the plateau region and heat flux in comparison to the standard k-ω model.
1. Introduction
The Shock-Wave/Turbulent Boundary-Layer Interactions(SWTBLI)in hypersonic vehicles encounter an aerothermodynamic environment,characterized by strong shocks interacting with the boundary layer,therefore generating high surface viscous heat dissipation which imparts high heat transfer rate to the vehicle walls.1-5The hypersonic flows are characterized by a peak rise in surface pressure and heat flux,particularly when a shock is strong to reverse the boundary layer, causing flow separation. The separated flow reattaches downstream and gives rise to a local peak wall pressure, skin friction and heat flux which could be far in surplus in comparison to the attached boundary layers.1,2The movement of fins or control surfaces to maneuver the launch vehicles and scramjets results in SWTBLI. The separation bubble results in the loss of control surface performance and drops the air intake effectiveness of scramjets inlets.The flow unsteadiness generated because of shock-induced boundary-layer separation may result in fluctuating side loads in propulsive nozzles.3The flow separation resulting from SWTBLI not only causes localized loads but also influences the aerodynamics of the vehicle and is responsible for high mechanical and thermal loads on the structure,which must be predicted accurately in order to support the vehicle design processes. Therefore, predicting the SWTBLI flows and understanding how to control them is a critical technology area for the development of the supersonic and hypersonic propulsion vehicles.A large amount of experimental and numerical results on the SWTBLI in two-dimensional flows have allowed a better consideration of the character played by the key parameters involved in the SWTBLI process.4-17
The hypersonic vehicle during its flight covers a wide range of conditions. The vehicle can fly at different angles of attack from low to high Mach numbers at varying Reynolds numbers and wall temperatures.18-25The flow separation bubble,accompanying with shock/boundary-layer interactions, generally leads to augmented energy losses in the system and degrades the efficiency of the aerodynamic maneuver.2The fluid flow unsteadiness in SWTBLI, which is a result of property fluctuations upstream of the shock wave, can cause additional undesirable problems.26-33It is observed that the higher deflection angles lead to a larger separation bubble size due to an increased pressure rise across shock waves. The computed and experimental results indicate that the cooling wall increases the boundary layer resistance to flow separation at hypersonic speeds over compression corner flows.18,19,24,34The wall cooling lowers the sonic line within the boundary layer which in turn limits the upstream influence and increases the intensive exchange and transfer of mass within the turbulent boundary layer. The intense fluid properties fluctuations within the turbulent boundary-layers result in a significant exchange of momentum and energy, and therefore, delay separation location in comparison to the laminar boundary layers in adverse pressure gradient flows.18
The hypersonic flows at very high Reynolds numbers are dominated by turbulence.35The numerical simulations, coupled with experimental validation,have shed considerable light on the flow dynamics in the SWTBLI flows.2Presently,Direct Numerical Simulations (DNS) and Large Eddy Simulations(LES) are limited to the detailed flow field investigations for low Reynolds number SWTBLI flows. Considerable time and resources are required to compute even low Reynolds number SWTBLI flow fields using a DNS approach with the available state-of-the-art computational facilities.36Although the DNS and the LES have gained a success to predict the wall pressure, they have limitations in the prediction of the skin friction and heat transfer data in the SWTBLI flows,especially in the separation and the reattachment regions.The reasons for these limitations are not reported by the researchers.16,37-40In the present investigation, a RANS based approach, along with a two-equation turbulence model is used to compute the hypersonic SWTBLI flows.
The Reynolds-Averaged Navier-Stokes (RANS) formulations and their variants were successfully used to compute the compression corner flows.2,8,9,13,41The simulations conducted by Coakley and Huang42were performed using standard k-ω and k-ε turbulence models for 34° compression corner flow at Mach number 9.22.These standard models predicted initial pressure rise location later than experiments and have led to a smaller separation region. The computations done by Coratekin et al.43using different one- and twoequation turbulence models for Mach number 9.22 flow over 38° compression corner flows, illustrated that all the models predicted initial pressure rise far downstream and overpredicted peak heat transfer rise by 50% in comparison to the experiments.Similar observations of SWTBLI flows have been made in the computations.42,44-51Many modifications have been used to improve the SWTBLI predictions at supersonic and hypersonic Mach numbers.Rumsey47used compressibility corrections to improve heat flux in SWTBLI compression corner flows, concluded that the compressibility modifications to the turbulence model deteriorate the SWTBLI region,and recommended not to use it in the computations. Therefore, compressibility corrections are not applied in current simulations.Wilcox46revisited k-ω turbulence model with stress limiter and applied it to compute hypersonic shock-wave boundary layer interaction region at Mach number 11.An improvement in the initial pressure rise location and wall pressure distribution is observed in comparison to the standard k-ω form without the limiter.However,the heat flux is overpredicted by 50%in the reattachment region in comparison to the experiments by both the compressibility and stress limiter turbulence model modifications. Zhang and Gao52computed shock/boundarylayer interactions over 9°-20.5° double wedge configuration at Mach number 8. A compressibility correlation is implemented using a two-equation k-ω Shear Stress Transportation(SST)turbulence model.53The computed pressure distribution and the velocity boundary layer profile showed bettercomputed results using the modified transition model to the experimental data.Zhang et al.54improved the heat flux values in the shock/boundary-layer interaction region over an axisymmetric cone-cylinder-flare body at Mach number 7 using modified k-ω SST turbulence model. The modification eliminated the unphysical increase of the turbulent quantities across a shock wave and enhanced the accuracy of the aerothermal prediction. Using a simplified correlation-based SST model,Xia and Chen55improved the wall pressure distribution in SWTBLI over double wedge geometry at hypersonic Mach number.Overall,it is pragmatic that the standard turbulence models envisage a farther downstream position for the pressure rise position leading to a smaller separation bubble when compared to the experiments. The standard turbulence models were likely formulated without accounting for the important shock unsteadiness effect caused by the upstream turbulent boundary-layer fluctuations.56Also, the outcomes of the turbulence model modifications are not based on the flow physics and can vary from one test case to others in the SWTBLI flows.
In the SWTBLI flows, the shock unsteadiness is instigated by the interface of upstream turbulent fluctuations with the shock wave. Sinha et al.56computed the disparities of the Turbulent Kinetic Energy (TKE) across a normal shock wave using a baseline two-equation k-ε turbulence model and related the computed results with the simple linear analysis and the DNS data. It was noted that the amplification of TKE across a normal shock wave is higher when compared to the linear analysis and the DNS results. He applied the shock unsteadiness correction in the k-ε model framework to the isotropic homogeneous turbulence flow interacting with a normal shock wave. The modification was proposed to the standard k-ε model to remove the unphysical increase of TKE amplification across a shock.Firstly,the turbulent eddy viscosity term in the production of the TKE is made to zero close to the shock wave in the shock unsteadiness model. Secondly, a shock unsteadiness parameter is constructed based on the normal Mach number to the shock wave.This parameter is multiplied to the eddy viscosity, in order to bound the production of TKE to lower values. The calculated changes of the TKE and turbulent dissipation rate across the normal shock using the shock unsteadiness model agreed close to the results of the linear analysis for different flow Mach numbers. In the following work, Sinha et al.57applied the modification to the standard k-ε, k-ω and Spalart-Allmaras turbulence models to solve the supersonic compression corner flows. Later, it was extended to an oblique shock impingement, cone-flare, and single-fin configuration SWTBLI flows.58-61The shock-unsteadiness modification has shown an improvement in the prediction of the flow field and wall pressure data.Limited heat flux computations with constant turbulent Prandtl number were presented in order to show the improvement in comparison to the standard models. Subsequently, the shock-unsteadiness modification was applied with variable turbulent Prandtl number model62,63which showed improvement in heat flux results in comparison to the modification with constant turbulent Prandtl number to the SWTBLI flows. Overall, the shock unsteadiness modification improved the separation shock location,wall pressure,and heat flux distribution,and matched the experimental data better than the original model.
In this article,the shock-unsteadiness modified k-ω model63with a variable Prandtl number model is applied to compute the experimental test cases over two-dimensional compression corner hypersonic flows.64-67The study involves a parametric study with varying deflection angles, Reynolds number, and wall temperatures. When the test conditions were selected for the present investigation,the focus was on flows at high Mach number and large deflection angles which result in high shock strengths and strong flow interactions and steep property gradients.These test conditions would undoubtedly check out the quality, robustness, and accuracy of the algorithm. In earlier computations,57-61the shock-unsteadiness modification was applied using the average values of the shock-unsteadiness parameter, which, in turn, was calculated based on the local Mach number normal to the shock wave with constant Prandtl number assumption. In a more recent work related to oblique shock impingement studies, the shock-unsteadiness modification was implemented based on the local values of the strength of the shock wave and variable Prandtl across the shock wave.62,63The new version of shock-unsteadiness modified kω turbulence model63has improved the heat transfer rate when compared to its standard version and the former shockunsteadiness modified model.57
The ability of the turbulence model to predict the extent and position of peak aero-thermodynamic load is essential to the development of hypersonic space vehicles. The focus of the present work is to predict the heat transfer rates in the hypersonic SWTBLI compression corner flows by implementing the new version of shock-unsteadiness modified k-ω turbulence model63which readily accounts for the variation of turbulent Prandtl number.The computed flow-field,wall pressure, and heat flux data are systematically compared with the available experimental results.64-67Also, the computed skin friction results are presented for the test cases selected from the experiments.One of the reasons why the present investigation is selected in this study is because of the steep gradients and high shock strength arising from the high Mach number which makes it more challenging for a computational code.However, the dissociation is insignificant for the selected low enthalpy conditions in the experimental shock-tunnel which makes it suitable for comparison to the current numerical code that does not include any chemistry.
In this article,the next section describes the model configuration details and flow conditions for different test cases as contained in experiments,64-67followed by a summarized description of the numerical methodology and a brief description of the shock-unsteadiness k-ω turbulence model.Next,the computed results using the standard k-ω turbulence model68and the shock-unsteadiness modified k-ω turbulence model63as applied to the strongest interaction case with Mach number Ma∞=9.22 and the deflection angle of 38°are discussed.Following this, the computed results using a modified k-ω turbulence model for different ramp deflection angles, Reynolds number, and wall temperatures are presented and duly compared to the experimental data.Finally,the important findings from present work and the proposals for future work are contained as a conclusion.
2. Analysis
2.1. Experimental data
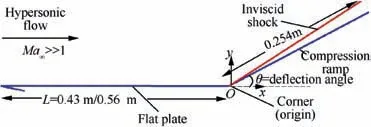
Fig. 1 Geometric configuration of compression corner used in present computations.
The experiments were conducted at the imperial college gun tunnel to investigate the hypersonic SWTBLI flows for a two-dimensional wedge-compression corner, as shown in Fig.1.The test model had a sharp plate,followed by a trailing compression ramp instrumented for heat flux and pressure measurements. It was conducted with Nitrogen gas as the working fluid. The experiments were conducted first by Elfstrom64,65with a flat plate of the length of L=0.43 m to obtain wall pressure measurements. Coleman and Stollery66,67used a flat plate of the length of L=0.56 m to measure heat flux measurements in the shock/boundary-layer interaction region. The compression ramp length was 0.254 m, as shown in Fig. 1. The plate-ramp model was 0.178 m wide where the wall end effects were assumed to be negligible.For the surface pressure measurements, pressure tapings at 2.54×10⁻³m intermissions laterally on the model centreline were associated with the strain-gauge transducers to measure surface pressure.An electric resistance component fixed to the model,heated the surface temperatures in the range from 295 K to 770 K with a possible variation of±10 K differential on the plate and ramp.The plate and ramp were instrumented along the centreline with closely spaced thin-film platinum on a glass surface temperature gauge. The signals were converted to measure the heat-transfer rate by electrical analog circuits,and the outputs recorded on Oscilloscopes. These experimental data were reported in terms of non-dimensional pressure pw/p∞, and non-dimensional heat transfer qw/q∞for different ramp deflection angles. Deflection angles starting from 15° with attached flow case, to a 30° ramp angle case giving an incipient separation region to a fully separated flow past the ramp angles of 34°and 38°,were simulated in the tunnel.The flow conditions for these test cases detailing ramp deflection angles, unit Reynolds numbers and temperatures are shown in Table 1.
2.2. Numerical methodology
The two-dimensional RANS equations are solved for the mean flow.36The code is based on the finite volume technique and can run on parallel machines.69The standard two-equation turbulence models: standard k-ω of Wilcox68with production limiter53and shock-unsteadiness modified k-ω model63are used in the numerical computations. The turbulence models do not include any compressibility correction. The compressibility corrections are empirical,and the consequences of these adjustments differ from one situation flow to another.The outdated compressibility modifications in the form of pressure dilatation terms and dilatation dissipation alter the incoming boundary layer and result in small values of skin friction as compared to the experimental data before the interaction region.70Also, compressibility corrections in dissipation rate and pressure dilatation correlation are found to have only minor effects on the SWTBLI region.71Wilcox46reported that the revisited k-ω turbulence model with compressibility corrections deteriorates the SWTBLI region for hypersonic flows at Mach number 9 and recommended not to use it. For hypersonic Mach numbers, more than 5 compressibility corrections result in erroneously lower values of eddy viscosity,and hence,give significantly lower values of heat flux and skin friction.72Thus, such compressibility effects are not included in the present numerical simulations.The numerical technique is secondorder accurate, and the inviscid fluxes are calculated using a modified form of Steger-Warming flux splitting method.73The implicit method is used to reach a steady-state solution.74
A structured Cartesian mesh is used in the numerical simulations. The grid is exponentially stretched normal to the surface, clustering more points near the wall. Also, the grid is stretched in either direction from the corner exponentially.The present computations use the truncated grid computational domain only in the immediate vicinity of the compression corner, with the inlet boundary layer profile boundary-condition. Separate simulations are performed over a flat plate under the same conditions as experiments to extract this boundary layer profile.The freestream conditions for both the k-ω models used in the simulations over the flat plate are:ω∞=U∞/L and k∞=0.01ν∞ω∞, where ν is the kinematic viscosity, U∞is the free stream velocity, and L=1 m is a characteristic length.53Along the plate and ramp surface, the boundary conditions used are viscous, no-slip conditions, u=v=∂p/∂y=0 and constant wall temperature. The turbulence quantities at the wall53are taken as k=0 and ω=60νw/(β1Δy12). Here, β1=3/40 and Δy1is the perpendicular distance to the grid point near the surface.At the top and exit planes, an extrapolation boundary condition is allocated.
Based on the grid convergence study, as shown in Fig. 2, a grid size of 500×400 is used in the current simulations with 500 points in the flow direction and 400 points normal to it.The grid is exponentially stretched normal to the wall with the first grid at 1×10⁻⁷m from the wall. A wall unit of y2+<1.0 is obtained in the whole domain for this grid. It is observed in Fig. 2(a) and (b) that the location of separation point shifts upstream and the location of peak surface pressure rise at reattachment point shifts downstream with refining grid points in both directions. The skin friction variation shows that the separation region increases with the increase in the number of grid points from 300×200 to 600×500. The CFL numbers up to 40 are used in our computations. The compression ramp deflection angles, Reynolds numbers, and wall temperatures are varied to simulate hypersonic shock turbulent boundary-layer interaction flows starting from fully attached to incipient separation and so on to separated flows as shown in Table 1.In the experiments,64-67a free stream temperature of T∞=64.5 K was set, which corresponds to a reservoir temperature of 1070 K with a total flow enthalpy equal to 1.2 MJ/kg at Ma∞=9.22. Based on this data, we assume a specific heat ratio of 1.367 in our numerical simulations. Holden et al.75observed that the shock tunnel produces freestream hypersonic flows with insignificant dissociations for a total enthalpy below 5 MJ/kg. Therefore, the shock structure,surface heat flux and pressure distributions in the current simulations are not strongly influenced by local flow chemistry.Hence, a constant value of the gas constant equal to 297 J/(kg·K) and a constant specific heat at constant pressure equal to 1098 J/(kg·K) is used in the present numerical simulations with nitrogen gas as a working fluid.The free stream and wallviscosities are assumed to be temperature-dependent and are calculated using Sutherland’s law.35The heat flux is calculated using Fourier’s law of heat conduction.35

Table 1 Variation of different parameters for compression corner viscous flow test cases.64-67
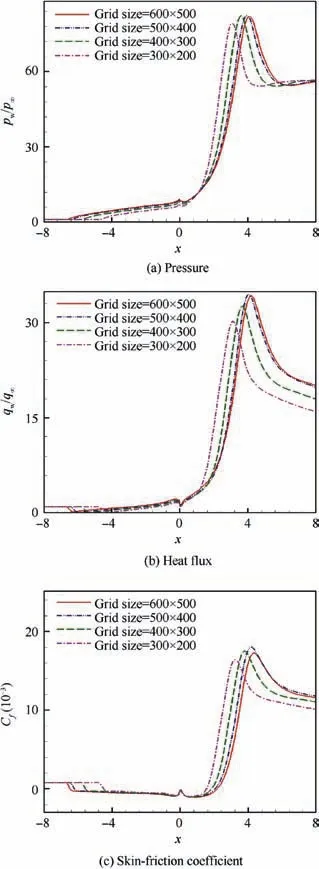
Fig. 2 Grid convergence study in terms of surface for θ=38°,Ma∞=9.22, Re1∞=4.7×10⁷ m-1 and Tw=295 K using shock-unsteadiness modified k-ω model.63
2.3. Shock-unsteadiness k-ω model
Sinha et al.56studied the homogeneous turbulence interacting with a normal shock wave and observed that the unsteady shock motion dampens the amplification of turbulent kinetic energy k across a shock. The following alteration to the production of TKE term across a shock wave is constructed based on the linear analysis results.

The coupling between the unsteady shock motion and the upstream velocity fluctuations is characterized by b′1which represents the damping effect. Ma1nrepresents the upstream shock-normal Mach number calculated in the frame of reference that is motionless with respect to the shock. The shockunsteadiness modification is functional in the k-ω framework57by multiplying the eddy viscosity, μT=ρ-k/ω, of the standard model by the factor,


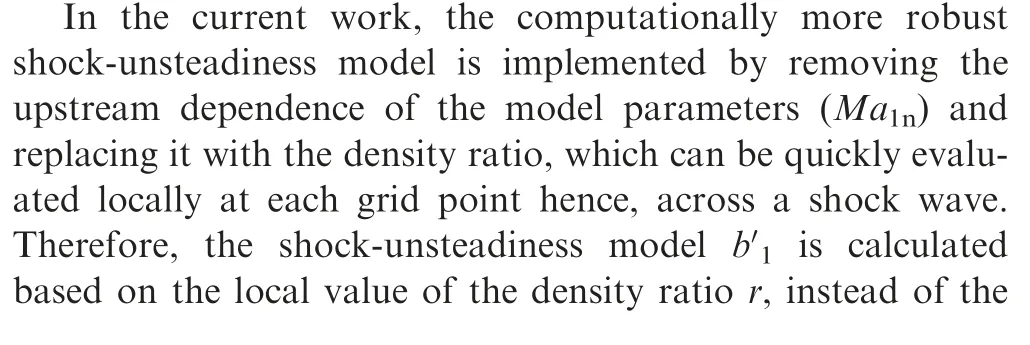

2.4. Numerical comparison of standard and shock-unsteadiness turbulence models
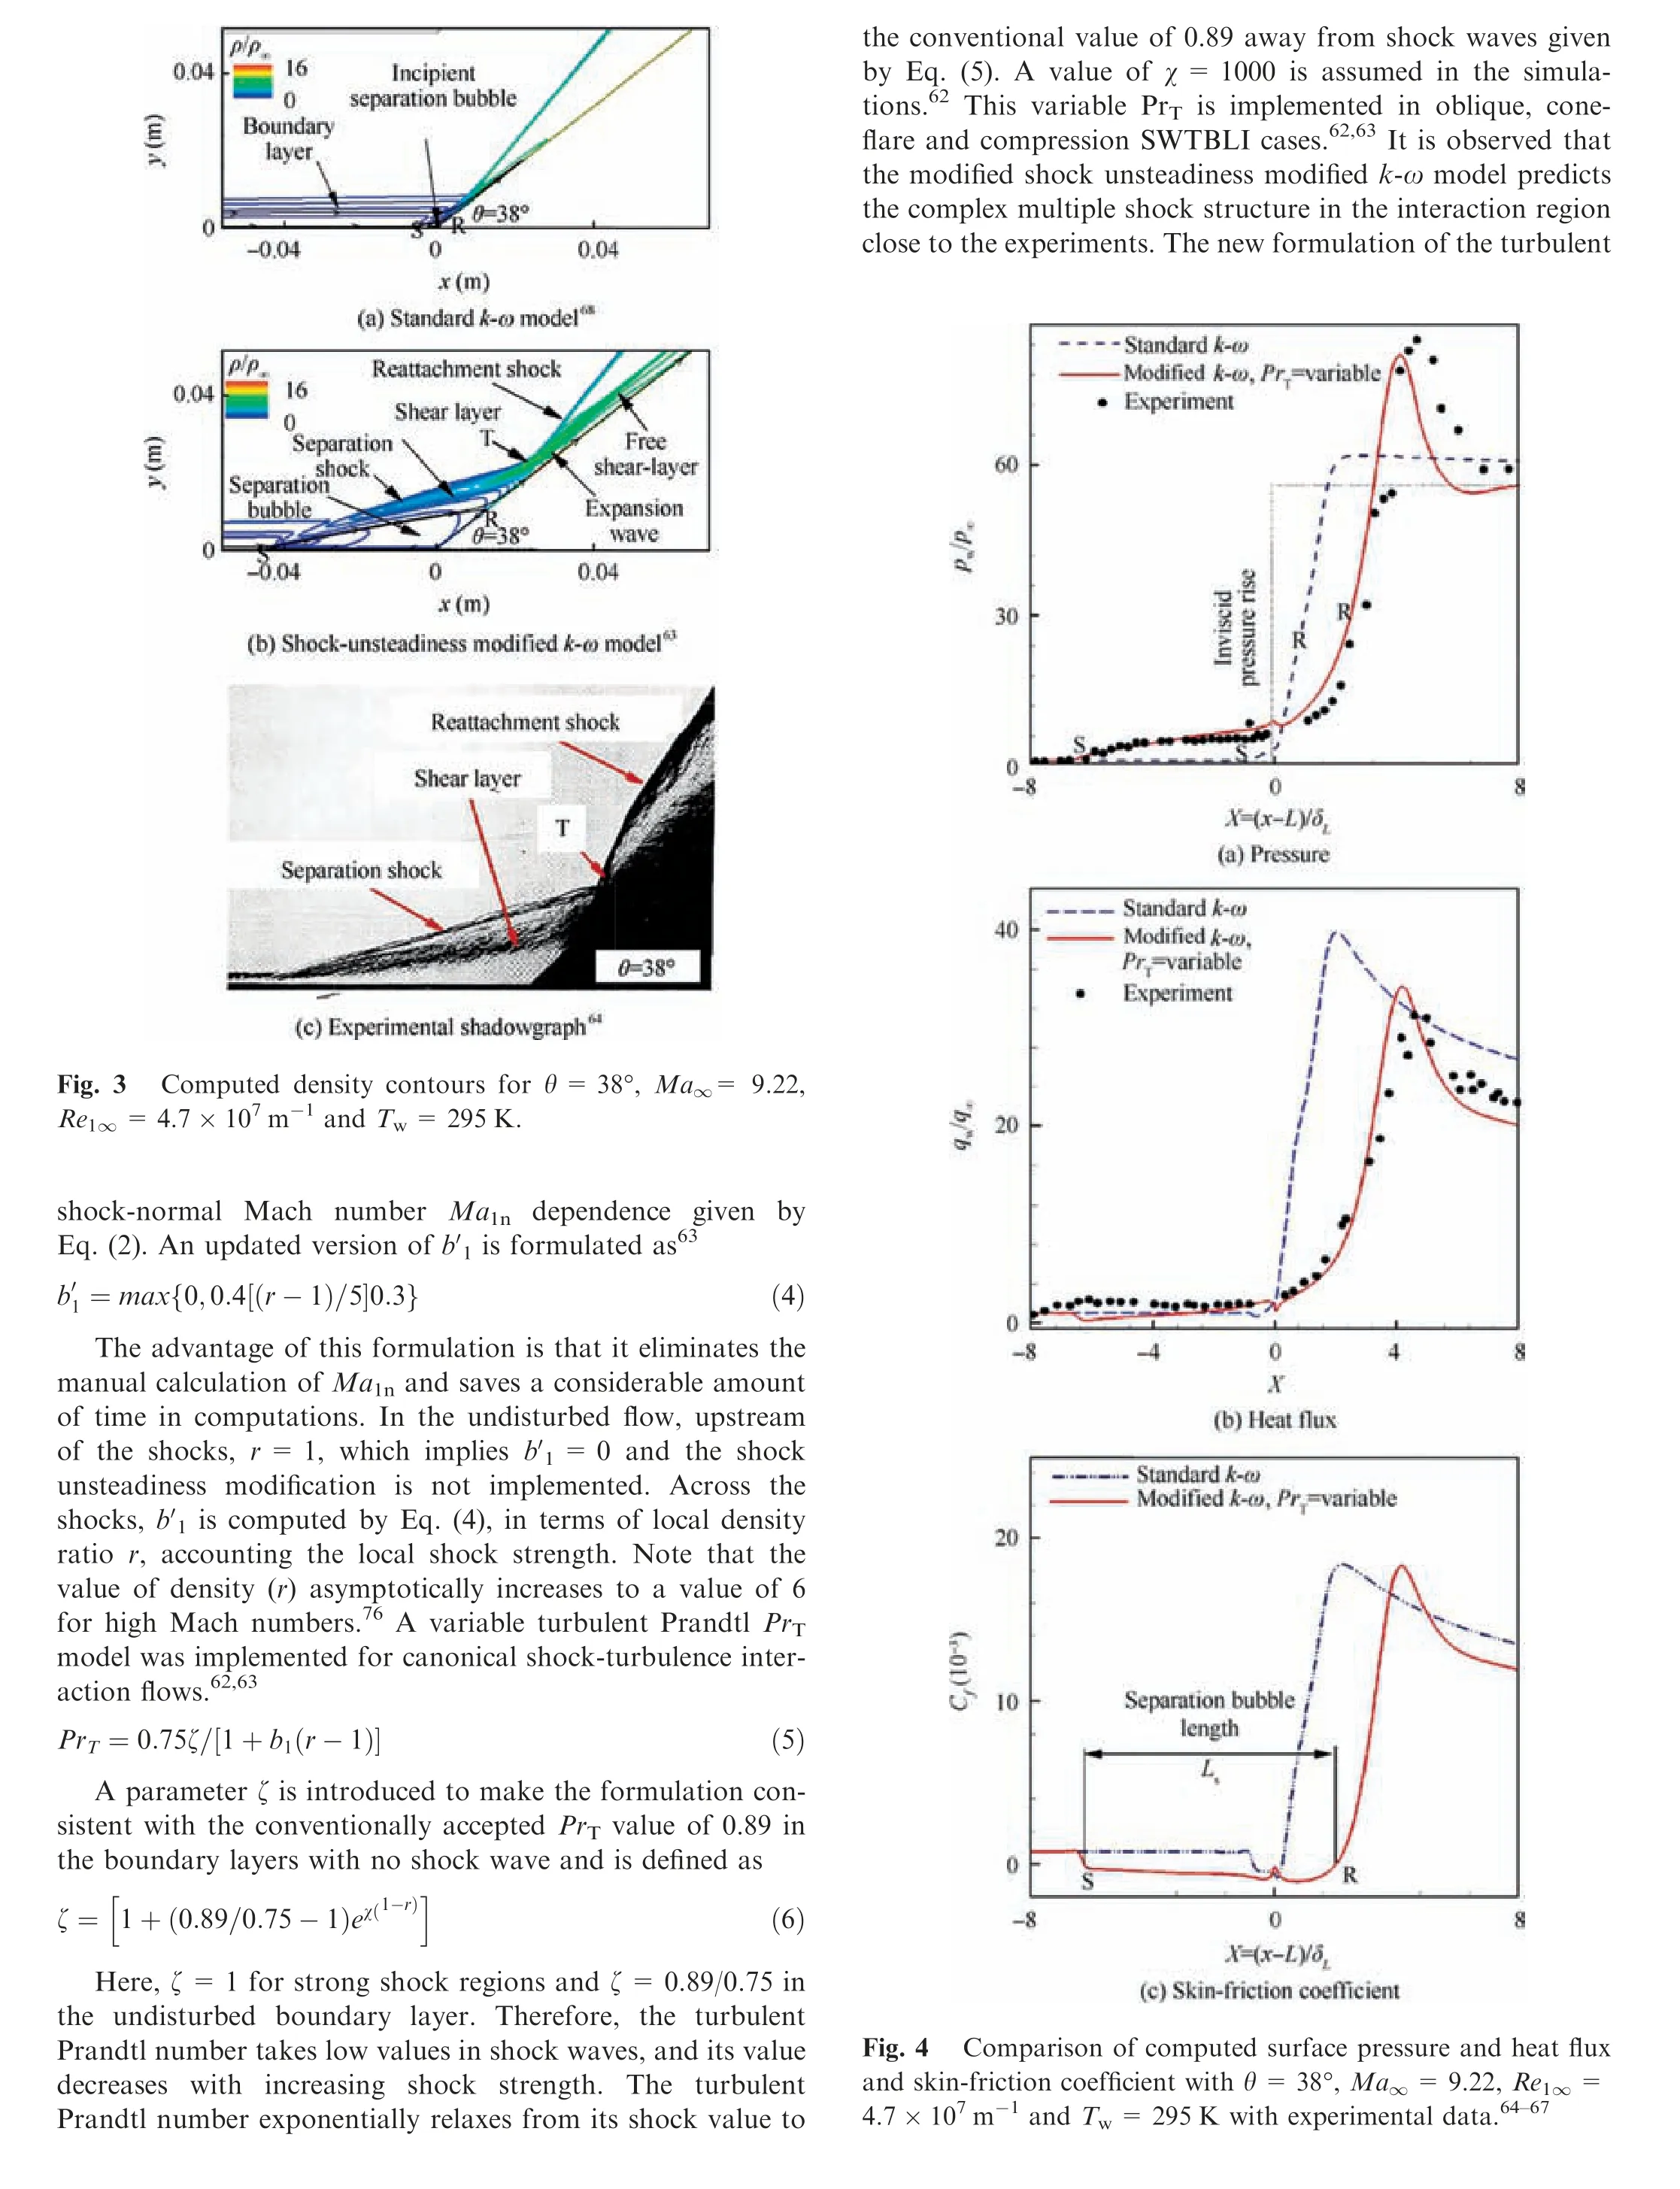
In this section, two different turbulent models, namely the standard Wilcox’s k-ω model68and Sinha’s shock unsteadiness modified k-ω model63are applied and tested in their ability to predict the quality of flow field, wall pressure and heat flux in SWTBLI region with large separation bubble. Fig. 3 shows a comparison of the computed normalized density contours results with the experiments for Mach number 9.22 and ramp angle of 38°, a difficult test case to simulate and to predict accurately,as it supports a very strong compression at the corner. The higher shock strength results in a larger size of the SWTBLI region.
The computed results using the standard k-ω model in Fig. 3(a) shows that the upstream turbulent boundary-layer on the plate interacts with the corner shock to predict a small flow separation in comparison to the experimental shadowgraph depicted in Fig.3(c).It is because the standard k-ω overamplifies the turbulent kinetic energy across the corner shock wave, and hence, pushes the separation point location (S) further downstream when compared to the experiments. The experimental wall pressure in Fig. 4(a) rises at separation region S, develops a plateau in the separation region and shoots to large values downstream of the reattachment region,R just below the shock-shock interaction. Here, the xcoordinate is normalized with the length of the plate, L up to the hinge(see Fig.1)and with the boundary-layer thickness calculated at the hinge length of the compression corner. The standard model predicts the initial pressure rise location far downstream at X =-0.7 as compared to the experiments. A prediction of the smaller separation size in Fig. 3(a) results in a wrong shock structure as compared to the experimental shadowgraph in Fig. 3(c). The shock-shock interaction region is predicted just downstream of the corner and causes a peak pressure beneath it, which is ahead as compared to the experiments. Also, the peak pressure is under-predicted. The heat flux in Fig. 4(b) is normalized with a value obtained on a flat plate. The initial rise in heat flux is predicted downstream of the interaction region in comparison to the experiments. The peak value is predicted upstream at X =2 as compared to the experimental peak at X =4.5. The skin friction, Cfplot in Fig.4(c)shows a small separation bubble length.The length of the separation bubble is measured between the separation and reattachment points where the Cfis zero. A peak value of Cfis predicted at X =2.2.
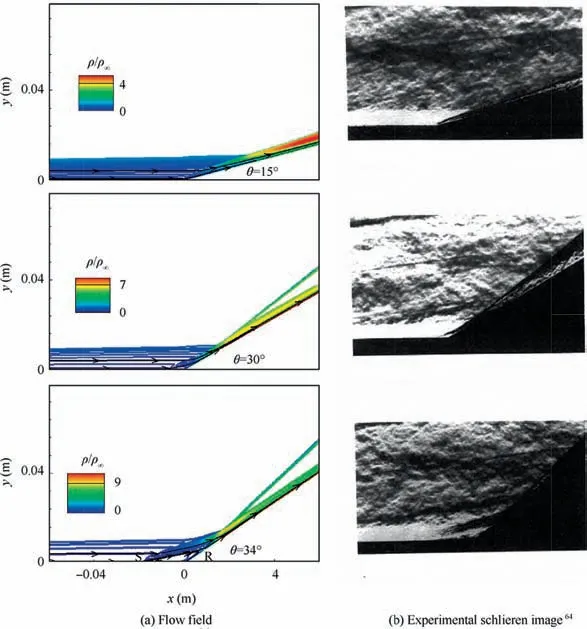
Fig. 5 Comparison of computed flow field with experimental schlieren image65 with θ=34°, 30° and 15° at Ma∞=9.22, Re1∞=4.7×10⁷ m-1 and Tw=295 K.
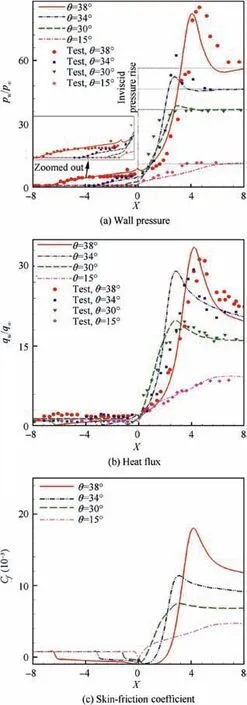
Fig. 6 Computed wall pressure, heat flux and skin-friction with θ=38°, 34°, 30° and 15° at Ma∞=9.22, Re1∞=4.7×10⁷ m-1 and Tw=295 K, compared with experimental data.64-67
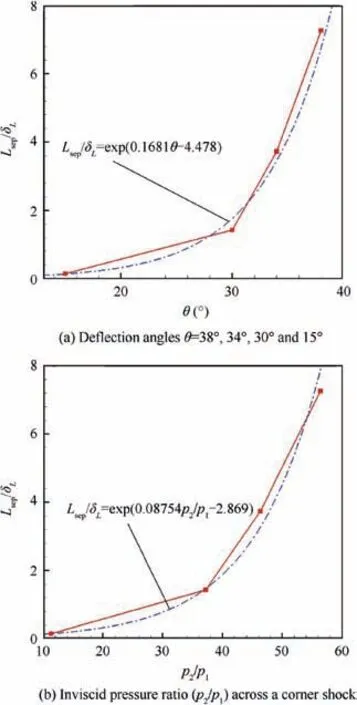
Fig.7 Variation of computed normalized separation bubble size with deflection angles θ=38°, 34°, 30° and 15° and inviscid pressure ratio (p2/p1) across a corner shock.
In contrast to the standard k-ω case, the computations using the shock-unsteadiness modified k-ω model in Fig. 3(b)result in a larger separation bubble size and hence resemble closely to the experimental shadowgraph in Fig. 3(c), when comparing attributes such as the separation shock length,shear-layer, separation bubble size, and triple location T. The shock-unsteadiness correction dampens the turbulent kinetic energy across the shock and causes the flow to separate earlier matching the experimental initial pressure location, as shown in Fig. 4(a) (X=-6.2). Also, the pressure plateau region matches well with the experimental data between X =-6.2 and 0 due to correct separation shock inclination.The separation shock and reattachment shock interact to form an expansion fan and a free shear layer at the triple location T,as shown in Fig. 3(b). The type-VI shock-shock interaction77at T causes a peak pressure to rise at X =4. This value is much higher as compared to the inviscid value due to the continuous rise of pressure across compression waves after R to reach a peak value below the separation shock andreattachment shock interaction at T.The computed peak pressure is closer to the experiment peak pressure location at X =4.7 as compared to the standard k-ω model. The intersection of these two shock waves would result in a strong shock region.Hence,the static pressure at the surface reaches a peak value behind this shock-shock interaction region and then drops rapidly across expansion fan at X =4 at T to a value close to the inviscid value. There is a stronger shock-shock interaction observed in the experimental shadowgraph in Fig. 3(c) as compared to computations. The stronger interaction is depicted by the bending away of reattachment shock from free flow direction. This strong interaction may result in extra peak pressure at X =4.7 as compared to the computed weaker shock-shock interaction in Fig. 3(b) at X =4.The pressure overshoots at shock-shock interaction are primarily a hypersonic phenomenon.66The shock-unsteadiness modified k-ω model implementation with Prandtl number variation (see Eq. (4)) matches the heat flux close to the experiments in the interaction region, as shown in Fig. 4(b). The peak heat flux is predicted at X =4 as compared to the experimental value at X =4.6. The variation in Cfvalues in Fig. 4(c) shows a larger separation bubble in comparison to the k-ω model. A peak value of Cfis predicted at X =4.2.

Table 2 Variation of unit Reynolds number.
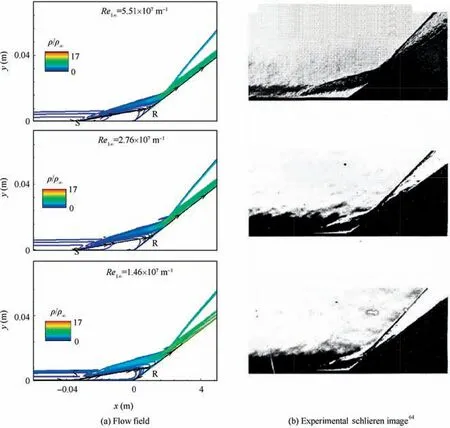
Fig.8 Comparison of computed flow field with experimental schlieren image64 with θ=36°at Ma=9,Tw=295 K and different Re1∞of 5.51×10⁷ m-1, 2.76×10⁷ m-1 and 1.46×10⁷ m-1.
2.5. Variation of deflection angles
A computational study is also carried out to investigate the influence of a change in the deflection angle for the experimental conditions of Ma∞= 9.22, Re1∞=4.7×10⁷m-1and Tw=295 K. According to a method of characteristics, a simple uniform flow when deflected through a ramp angle would lead to an inviscid pressure rise across the compression corner oblique shock with an increase of the deflection angle. Fig. 5 shows a qualitative comparison between the computed density contours and the corresponding Schlieren images(density gradient). As expected, an adverse pressure gradient rise across a shock increases the extent of the separation region as the ramp angle is increased from 15° to 34°. The computed flow field shows good agreement with the experimental Schlieren image,especially the separation bubble size. The normalized wall pressure variation in Fig. 6(a) shows that the computed initial pressure rise location shifts upstream with respect to the compression corner with higher deflection angles. The modified kω model shows good agreement in the prediction of initial pressure location and pressure plateau region with all the deflection angles. The peak pressure location at X =3.2 for 34° matches well with the experiments; however, its absolute value is underpredicted.The intermediate interaction case with a deflection angle of 30° shows as incipient flow separation at the corner in Fig. 6(a), which matches the observation of the small separation bubble shown in Fig. 5(a) and the observed separation bubble is shown in the Schlieren image in Fig.5(b).
This is interesting since the experimental wall pressure data in Fig. 5(a) does not capture the separation plateau, perhaps due to the experimental data resolution when compared to the small bubble size. The weakest interaction case with a deflection angle of 15° shows an attached flow and a good match is found between the computations and experimental flow field in Fig. 5 and wall pressure in Fig. 6(a). The computed heat flux in Fig.6(b)shows good agreement with experiments. The peak heat flux location is predicted upstream of their experimental counterparts in all the separated flow cases.Also,the computed values at this location are under-predicted for 30° to 34°. A good match is found for the attached flow with experiments. The skin friction in Fig. 6(c) shows that the separation bubble size Lsepincreases with an increase of θ. An increase of 50% in Lsepis observed by varying θ from θ=34°to 38°.The variation of Lsepin Fig.7 shows an exponential increase of Lsepwith an increase of θ and p2/p1.Here,1 and 2 correspond to upstream and downstream conditions of an oblique shock (see Fig. 1). An approximate estimation is established between Ls/δLand θ,p2/p1in Fig.7 and can be utilized to calculate the separation bubble size for intermediate deflection angles at Mach number of 9.22.
2.6. Variation of Reynolds number
In this case study, the unit Reynolds number, Re1∞,is successively increased by about 50% each time by merely doubling the free stream density, as shown in Table 2. The experiments show that raising the Re1∞consistently increased the separation region to a small extent, as depicted by Schlieren image in Fig.8(b).A similar observation is made for higher deflection angle θ=38° in the experiments65and the variation is dramatic as compared to the current case with θ=36°. The current computed flow field in Fig.8(a)shows the same trend and matches shock structure well with the experimental Schlieren images with varying Re1∞.
An increase in Re1∞results in the shifting of initial wall pressure location upstream of origin in Fig. 9(a), thereby,increasing the separation bubble length, Lsep, as shown in the skin friction distribution in Fig. 9(c). The increase in bubble size is accompanied by a decreasing skin friction coefficient in the incoming boundary layer. The computed wall pressure distribution in the separation region characterized by a plateau region and pressure rise region just downstream of origin shows a perfect match with experiments. The computed and measured pressure does indeed show a jump,but the overshoot in the experiment is in sharp contrast to measurements. An increase in the magnitude of the wall pressure overshoot with an increase of Re1∞is observed both by computations and experiments in Fig. 9(a). The peak wall pressure is observed to increase with an increase in Re1∞due to stronger shockshock interaction generated by the larger separation region.The computed peak pressure location is observed upstream in comparison to experiments for all Re1∞. The range of Re1∞based on the boundary layer thickness is below 105in which viscous effects dominate the turbulent boundary layer.The computed momentum thickness increases by 20% with a decrease in Re1∞from 5.51×10⁷m-1to 1.46×10⁷m-1.Also, a decrease in Re1∞in the same range is accompanied by an increase in skin friction coefficient Cfby 40% before the interaction region for X <-5.5, as depicted in Fig. 9(c),and thus, making the incoming boundary layer less prone to separation. As a result, a higher value of Re1∞in the range examined here shows an increase in the length of the separation bubble. The results are also consistent with the free interaction theory5that holds for the range of Re1∞discussed in this case. An increase in the peak values of Cfproximate to X =3.2 is consistent with the observed higher values of Cfwith a decrease of Re1∞as discussed before. A similar trend in an increase in peak values of heat flux is found in Fig. 9(b) with lower values of Re1∞.
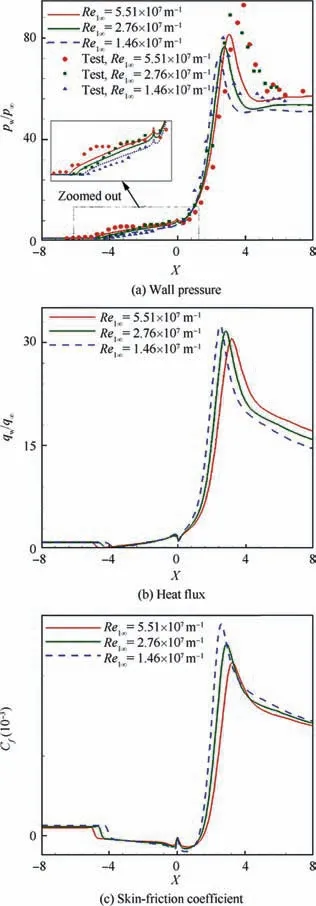
Fig. 9 Computed wall pressure, heat flux and skin-friction with deflection angle of 36°at Ma=9,Tw=295 K and different Re1∞of 5.51×10⁷ m-1, 2.76×10⁷ m-1 and 1.46×10⁷ m-1 compared with experimental data.64-67
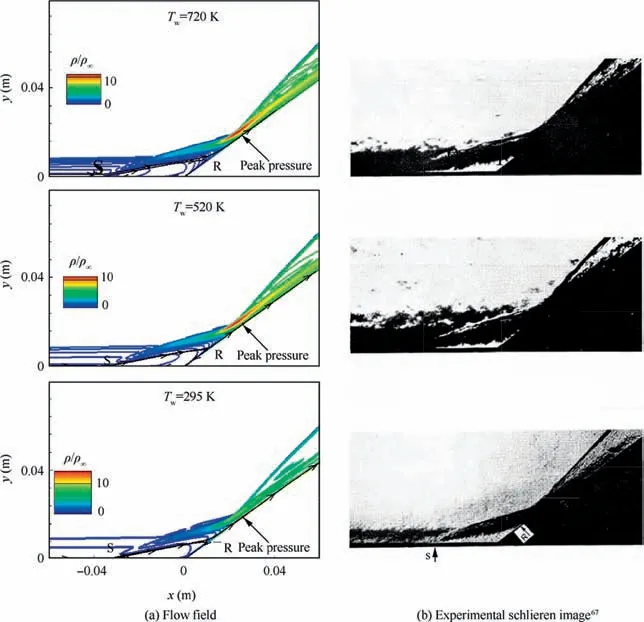
Fig.10 Comparison of computed flow field with experimental schlieren image67 with θ=36°at Ma∞=9.22,Re1∞=5.51×10⁷ m-1 and different Tw of 295 K, 520 K and 720 K.
2.7. Variation of wall temperature
In this case study, the wall temperature is varied from 295 K to 720 K for θ=36° at Ma∞=9.22 and Re1∞=5.51×10⁷m-1. Fig. 10 shows normalized density contours for different values of wall temperatures where the extent of separation bubble resulting from shock boundary layer interaction is depicted by separation, S and reattachment point, R. As observed in Fig. 10, the effect of the increase in the wall temperature Twwithin the range of experiments on the extent of the separation zone is not significant. As the wall becomes hotter from 295 K to 720 K, the extent of the separation bubble size becomes larger. This trend is observed in the shifting of separation point, S downstream in wall pressure variation and skin friction plots in Fig. 11.
It is observed that the peak value of wall pressure and skin friction at the reattachment location R, increases as the wall temperature increases. When the wall temperature is increased from 295 K to 720 K, the skin friction coefficient decreases, and the subsonic layer part of the incoming boundary layer increases due to an increase in the local speed of sound. Therefore, as the wall is heated, the separation point, S, shifts upstream due to the adverse pressure gradient across a shock wave, as shown in Fig. 11(a),thereby resulting in a larger separation bubble length, as indicated in Fig. 11(b). There is a good match between the computed wall pressure and experiments at different wall temperatures. The magnitude of the peak wall pressure and skin friction at the shock-shock interaction region (see Fig. 10) increases with an increase in wall temperature in Fig. 11. A similar trend is observed using the standard kω model for the same test cases.24
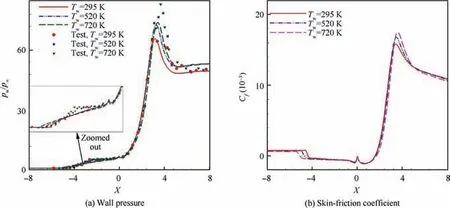
Fig.11 Computed wall pressure and skin-friction with θ=36°at Ma∞=9.22,Re1∞=5.51×10⁷ m-1 and different Tw of 295 K,520 K and 720 K, compared with experimental data.64
3. Conclusions
Reynolds averaged based Navier-Stokes computations are conducted on two-dimensional compression corners supporting hypersonic flows. This investigation intended to identify the shock-unsteadiness effects by appropriately modifying the k-ω turbulence model, which uses the immediate density values across the shock wave instead of the more general Mach number values across the shock.The results from the modified k-ω turbulence model were examined against the traditional kω turbulence model in the presence of the measured data. It was abundantly clear in almost all the results obtained that the modified k-ω turbulence model, which also incorporates a Prandtl number adjustment across the shock, leads to a definite improvement in prediction.
In the current work,it is learned that as the deflection angle is increased from θ=15°to θ=38°the length of the separation bubble increases proportionately. Consistent with the increase in the size of the bubble, it was found that pressure distribution signal, heat flux, and skin friction increased in the interaction region. Similarly, it was found that the bubble size increases as the Reynolds number is increased from Re1∞=1.46×10⁷m-1to Re1∞=5.5×10⁷m-1. Peak pressures triggered by strong shock interactions within the separation region remained consistent with the underlying activity in the sense that the highest values were recorded for the largest Reynolds number. Up to the peak values, both the skin friction and heat transfer values for the lowest Reynolds number were notably highest. Beyond the peak region, however, the roles seemed to invert possibly due to the strength of the laminar flow before the peak where the highest skin friction values are duly and rightly recorded for the lowest Reynolds number.After the strong shock interaction captured by the peak values,the flow possibly becomes turbulent,leading to lower skin friction values.For the temperature effects,it was noted that peak pressure and skin friction increase as the temperature rises from 295 K to 720 K. The separation bubble again increases in size as the separation point location shifts upstream with heating. The match between the computed wall pressure and the experiment is quite good at the three-wall temperatures.Other than investigating the effects of unsteady shock on a more exact three-dimensional model. The future studies will include the effect of the upstream total temperature fluctuations in SWTBLI regions.
Acknowledgments
This work was technically and financially supported by the Deanship of Scientific Research (DSR), King Abdulaziz University, Jeddah, under grant No. DF-043-135-1441. The authors would like to thank the High-Performance Computing Center (Aziz Supercomputer) (http://hpc.kau.edu.sa) for extending facilities to perform numerical simulations. The authors would also like to thank Professor Krishnendu Sinha from the Department of Aerospace Engineering, Indian Institute of Technology Bombay for his kind help. Our special thanks are given to Professor Mahmood Khalid for his support during current research work.
 CHINESE JOURNAL OF AERONAUTICS2020年6期
- CHINESE JOURNAL OF AERONAUTICS的其它文章
- A novel variable structure multi-model approach based on error-ambiguity decomposition
- Multi-block SSD based on small object detection for UAV railway scene surveillance
- A new online modelling method for aircraft engine state space model
- Cross-sectional deformation of H96 brass double-ridged rectangular tube in rotary draw bending process with diあerent yield criteria
- Application of a PCA-DBN-based surrogate model to robust aerodynamic design optimization
- Numerical exploration on the thermal invasion characteristics of two typical gap-cavity structures subjected to hypersonic airflow
