基于穗光谱指数的水稻产量预测
蒋琴素,成琪璐,徐礼根,周启发
(1.浙江大学 农业与生物技术学院,浙江 杭州310058; 2.浙江大学 生命科学学院,浙江 杭州310058)
水稻是全球23亿农民的主要生活来源[1],全球85%的水稻分布在亚洲[2]。在水稻生产中,产量预测对于农业决策的成功具有重要意义[3]。谷类作物产量预测的常用方法是分析测定产量的构成组分,如穗形态、单位面积穗数、单穗粒数、千粒重、营养转运与分布等[4-7]。这种方法通常费时费力,而光谱遥感方法可快速和低成本地分析植物产量相关性状[8]。归一化差值指数(normalized vegetation index,NDVI)是应用最为广泛的作物估产植被指数[9-13],然而,该指数具有内在缺陷(信号饱和)和多源误差[14]。近年来,光化学反射指数(photochemical reflectance index,PRI)越来越多地用于反演作物的光合效率,在反演绿色生物量方面的表现也较好[15]。然而,应用PRI进行作物产量预估的研究仍十分有限[16-21]。在水稻光谱估产研究中,冠层光谱反射的应用最为广泛[22-24],作物冠层光谱测定方便,能反映群体信息,但受土壤背景影响大。近年来,有少量研究试图用叶片光谱反射直接进行水稻估产[3]。水稻地上部顶端孕育带有花序的穗[25],水稻穗部NDVI和PRI对供氮水平的响应比较灵敏,同时,氮素状况是决定水稻产量的关键因子之一[26]。陈维君等[27]的研究结果表明,mSR705、mND705和PRI等指数可用于估算穗的色素含量,可作为水稻成熟度的监测指标。因此,水稻穗部植被指数具有估产潜能。水稻穗部的色素含量显著低于叶片,不存在红波区域的信号饱和问题,而且,水稻穗部性状与产量的相关性比叶片性状更直接。迄今尚无利用穗部植被指数进行水稻估产的研究报道,本研究旨在探索通过穗部植被指数进行水稻估产的可行性。
1 材料与方法
1.1 试验材料
以水稻常规品种浙粳22和杂交品种两优培九为试验材料,生育期分别为140、145 d左右。
1.2 试验方法
于2015年6—10月在浙江大学实验农场(30°14′ N,120°10′ E)进行田间试验。土壤为沙壤土(pH 7.2),含有机碳12.2 g·kg-1、交换性磷6.5 mg·kg-1、交换性钾38.6 mg·kg-1、全氮1.4 g·kg-1。设置3个氮水平(0、120、240 kg·N hm-2,分别以N0、N1和N2表示),完全随机区组设计,3次重复。小区面积为4.76 m × 4.68 m,株行距为0.18 m × 0.17 m。50%氮肥(尿素)用作基肥,35%施于分蘖期,15%施于抽穗期。于2015年6月10日播种,7月9日移栽,10月28日收获。
1.3 光谱测定
移栽后第95、98、101天,每小区取1株水稻带回实验室测定光谱。从稻株中随机取倒2叶1片和主茎上的穗1枝,用带积分球(Model LI- 1800,LiCor Inc.,Lincoln,NE,USA)的FieldSpec野外光谱仪(Analytical Spectral Devices,Boulder,CO,USA)测定其在350~2 500 nm的反射光谱,测定时探头对准叶片和穗的中心点,每次测定前进行白板校正。
1.4 光合色素含量测定
光谱测定后,立即取0.20 g叶片和0.50 g穗进行光合色素含量测定。用体积比为4.5∶4.5∶1的丙酮∶乙醇∶水混合液提取,按照Chen等[28]的方法测定叶绿素和类胡萝卜素含量。
1.5 产量测定
收获时每小区取1 m2水稻,测定穗长、每穗粒数、千粒重和籽粒产量。
1.6 数据处理
绘制光谱曲线,对光谱特性进行目视解译。NDVI和PRI分别根据Rouse等[29]和Peuelas等[30]的公式计算。用SPSS 16.0进行方差分析,并计算变量间的相关系数。植被指数与产量间的关系用线性、幂、指数和对数方程拟合,选取具有最高决定系数(R2)的回归方程式为最佳关系式,并计算回归方程式的均方根误差(root mean square error,RMSE)。
2 结果与分析
2.1 水稻产量组分与产量
如表1所示,浙粳22和两优培九的产量均随施氮水平的增加而提高,证明氮素状况是产量的决定因素之一。杂交稻两优培九穗长、穗粒数、籽粒产量均极显著(P<0.01)高于常规品种浙粳22。
表1三个施氮水平下供试水稻的产量构成及籽粒产量
Table1Yield components and grain yield of rice grown under three N levels (n=3)

品种Genotypes氮水平Nlevel/(kg·hm-2)穗长Paniclelength/cm穗粒数Grainsperpanicle千粒重1000grain-weight/g籽粒产量Grainyield/(kg·hm-2)ZJ22017.2±0.3B174±4B26.3±0.2A6054.2±100.3B12016.8±0.4B188±3B26.1±0.1A7002.2±143.4B24016.8±0.3B191±2B26.2±0.1A7196.3±72.0BLYPJ024.4±0.9A196±7A26.6±0.1A6906.4±48.5A12024.8±1.0A225±6A26.2±0.2A8062.2±133.3A24024.5±0.7A254±5A25.9±0.1A9617.7±253.7A
ZJ22,浙粳22;LYPJ,两优培九。相同供氮水平下,同列数据后无相同大写字母分别表示差异极显著(P<0.01)。
ZJ22, Zhejing 22; LYPJ, Liangyoupei 9. Values without the same uppercase letters at the same N level are significantly different atP<0.01.
2.2 叶片和穗的光谱特征
图1表明,在由叶绿素主导的可见光区域,叶片的反射光谱在550 nm附近有尖锐的绿峰,而穗的反射光谱中此绿峰消失,这可能与穗叶绿素含量较低有关。另外,在由叶片结构主导的近红外区域,穗在970和1 180 nm附近的反射谷明显比叶片深,而在由水分主导的短波红外区域,二者的光谱特性相似。
2.3 植物光合色素与光谱指数间的关系
水稻叶片叶绿素含量(图2)比穗叶绿素含量(图3)高1个量级左右。叶片和穗的叶绿素含量均随施氮水平的提高而提高,而叶片和穗的类胡萝卜素含量随施氮水平的变化不显著。两优培九与浙粳22的叶片叶绿素含量差异不显著(P>0.05),但两优培九穗的叶绿素含量极显著(P<0.01)高于浙粳22。比较图2和图3的结果可发现,穗的叶绿素和类胡萝卜素含量均极显著(P<0.01)低于叶片。
表2表明,叶片和穗的NDVI均与叶绿素含量、叶绿素/类胡萝卜素呈极显著(P<0.01)正相关,而且穗部的相关性高于叶片。叶片和穗的PRI与叶绿素含量、叶绿素/类胡萝卜素也呈极显著(P<0.01)正相关,而且PRI与叶绿素/类胡萝卜素的相关性明显强于NDVI,这与前人的研究结果相符[16-18]。由于PRI可测量绿峰两侧的相对反射,因此,可用来指示叶绿素/类胡萝卜素以及光合效率[15]。
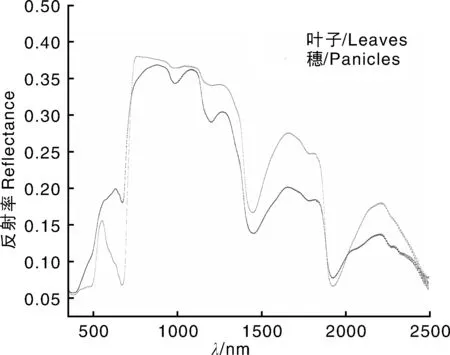
图1 水稻叶片和穗的平均反射光谱(n=54)Fig.1 Mean (n=54) reflectance spectra of leaves and panicles in rice plants
方差分析结果表明,品种、氮素水平和生育时期对NDVI、PRI均有显著影响(表3)。由表4
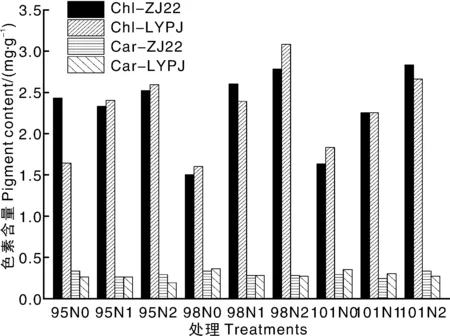
X轴中95、98和101分别表示移栽后95、98和101 d,N0、N1和N2分别表示N水平为0、120、240 kg·hm-2。Chl和Car分别表示叶绿素和类胡萝卜素,ZJ22和LYPJ分别表示浙粳22和两优培九。图3同In X axis, 95, 98 and 101 represented 95, 98 and 101 d after transplant, respectively, and N0,N1 and N2 represented 0, 120 and 240 kg·hm-2 N level. Chl and Car represented chlorophyll and carotenoid, respectively, while ZJ22 and LYPJ represented Zhejing 22 and Liangyoupeijiu, respectively. The same as in Fig. 3图2 不同氮水平下两个水稻品种的叶片色素含量Fig.2 Chlorophyll and carotenoid contents in rice leaves of two genotypes rice grown under three N levels

图3 不同氮水平下两个水稻品种的稻穗色素含量Fig.3 Chlorophyll and carotenoid contents in rice panicle of two genotypes rice grown under three N levels
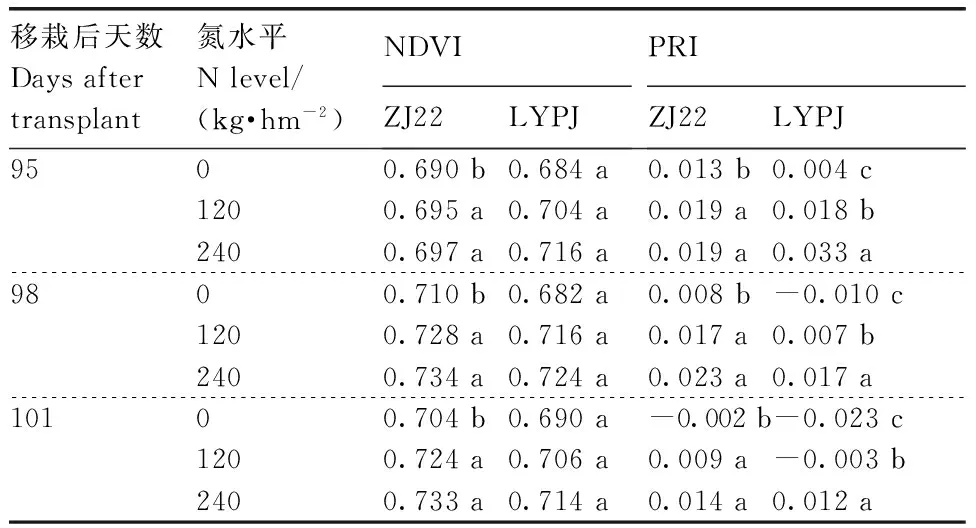
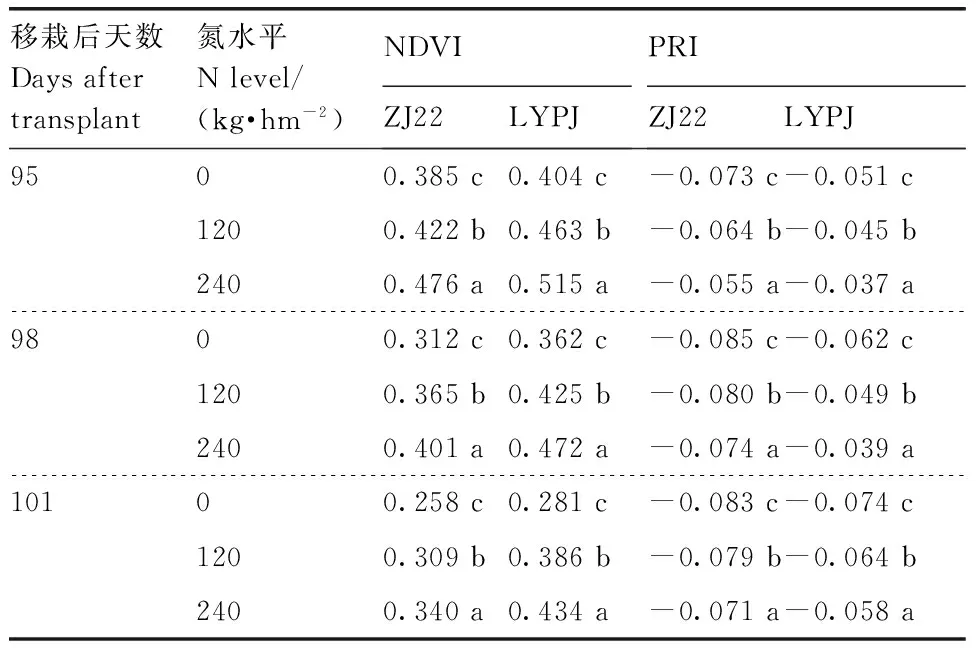
可知,叶片和穗的NDVI与PRI均随着氮水平增加而增加,本研究结果与Zhou等[26]的研究结果相符。两优培九的叶片NDVI在3个氮水平间差异不显著(P>0.05);浙粳22的叶片NDVI在3个氮水平下有差异,处理N0显著(P<0.05)低于处理N1和N2,处理N1和N2差异不显著(P>0.05)。3个氮水平下两优培九的叶片PRI差异均显著(P<0.05);浙粳22的叶片PRI与叶片NDVI相似,处理N0显著(P<0.05)低于处理N1和N2,处理N1和N2差异不显著(P>0.05)。两优培九、浙粳22的穗NDVI和PRI在3个氮水平间的差异均显著(P<0.05)(表5)。
表6为基于NDVI和PRI的产量预测结果。叶片指数-产量间最佳关系式为线性方程式或指数方程式,而穗NDVI-产量和穗PRI-产量的最佳关系式均为指数方程式。叶片NDVI和穗NDVI可分别解释1%~40%和56%~64%的产量变异,而叶片PRI和穗PRI可分别解释38%~61%和69%~77%的产量变异。叶片NDVI和PRI预测产量的RSME分别为873.4~1 125.0、723.3~889.4 kg·hm-2,而穗NDVI和PRI预测产量的RSME分别为681.7~743.1、515.0~637.8 kg·hm-2,表明穗光谱指数对产量的预测精度高于叶片光谱指数。其中,用移栽后101 d的穗PRI预测产量,精度最高,其RMSE为515.0 kg·hm-2,R2=0.77(n=18)。
表2水稻叶片和穗光谱指数与色素含量的相关性
Table2The correlation coefficients between the vegetation indices (VIs) and the pigment concentrations in the rice leaves and panicles(n=54)

植被指数Vegetationindices叶绿素Chlorophyll叶片Leaf穗Panicle类胡萝卜素Carotenoid叶片Leaf穗Panicle叶绿素/类胡萝卜素Chlorophyll/Carotenoid叶片Leaf穗PanicleNDVI0.56**0.71**-0.240.42**0.54**0.63**PRI0.60**0.73**-0.55**0.170.72**0.82**
*和**分别表示在0.05和0.01水平显著相关。下同。
* and ** were significantly correlated at 0.05 and 0.01 levels, respectively.The same as below.
表3叶片和穗光谱指数的方差分析
Table3The ANOVA results of the rice leaf and panicle vegetation indices

来源Sourcesdf叶片Leaf穗PanicleNDVI的F值FvaluesforNDVI叶片Leaf穗PaniclePRI的F值FvaluesforPRI叶片Leaf穗Panicle品种Genotype114.177*25.352***11.134**238.135***N水平Nlevel2217.552***25.996***34.091***31.814***生育时期Date224.540*35.072***22.467***79.074***Genotype×Nlevel224.685*1.6845.891**0.849Genotype×Date222.3411.3623.737*2.750Nlevel×Date440.1130.3130.4501.158Genotype×Nlevel×Date440.6850.5830.3211.350误差Error3636总和Total5454
***表示在0.001水平差异显著。
*** represented significant differences at levels ofP<0.001.
表4两个水稻品种叶片在不同时期不同氮水平下的NDVI和PRI
Table4Leaf NDVI and PRI in two genotypes rice plants grown under three N levels at different dates
移栽后天数Daysaftertransplant氮水平Nlevel/(kg·hm-2)NDVIZJ22LYPJPRIZJ22LYPJ9500.690b0.684a0.013b0.004c1200.695a0.704a0.019a0.018b2400.697a0.716a0.019a0.033a9800.710b0.682a0.008b-0.010c1200.728a0.716a0.017a0.007b2400.734a0.724a0.023a0.017a10100.704b0.690a-0.002b-0.023c1200.724a0.706a0.009a-0.003b2400.733a0.714a0.014a0.012a
相同移栽天数同列数据后无相同小写字母的表示差异显著(P<0.05)。下同。
Date marked by no same letters within the same colunn after the same transplantation days indicated significant difference atP<0.05. The same as below.
表5两个水稻品种穗在不同时期不同氮水平下的NDVI和PRI
Table5Panicle NDVI and PRI in of two genotypes rice plants grown under three N levels at different dates
移栽后天数Daysaftertransplant氮水平Nlevel/(kg·hm-2)NDVIZJ22LYPJPRIZJ22LYPJ9500.385c0.404c-0.073c-0.051c1200.422b0.463b-0.064b-0.045b2400.476a0.515a-0.055a-0.037a9800.312c0.362c-0.085c-0.062c1200.365b0.425b-0.080b-0.049b2400.401a0.472a-0.074a-0.039a10100.258c0.281c-0.083c-0.074c1200.309b0.386b-0.079b-0.064b2400.340a0.434a-0.071a-0.058a
表6基于水稻叶片和穗光谱指数的产量预测结果
Table6Rice grain yield prediction equations based on leaf vegetation indices and panicle vegetation indices
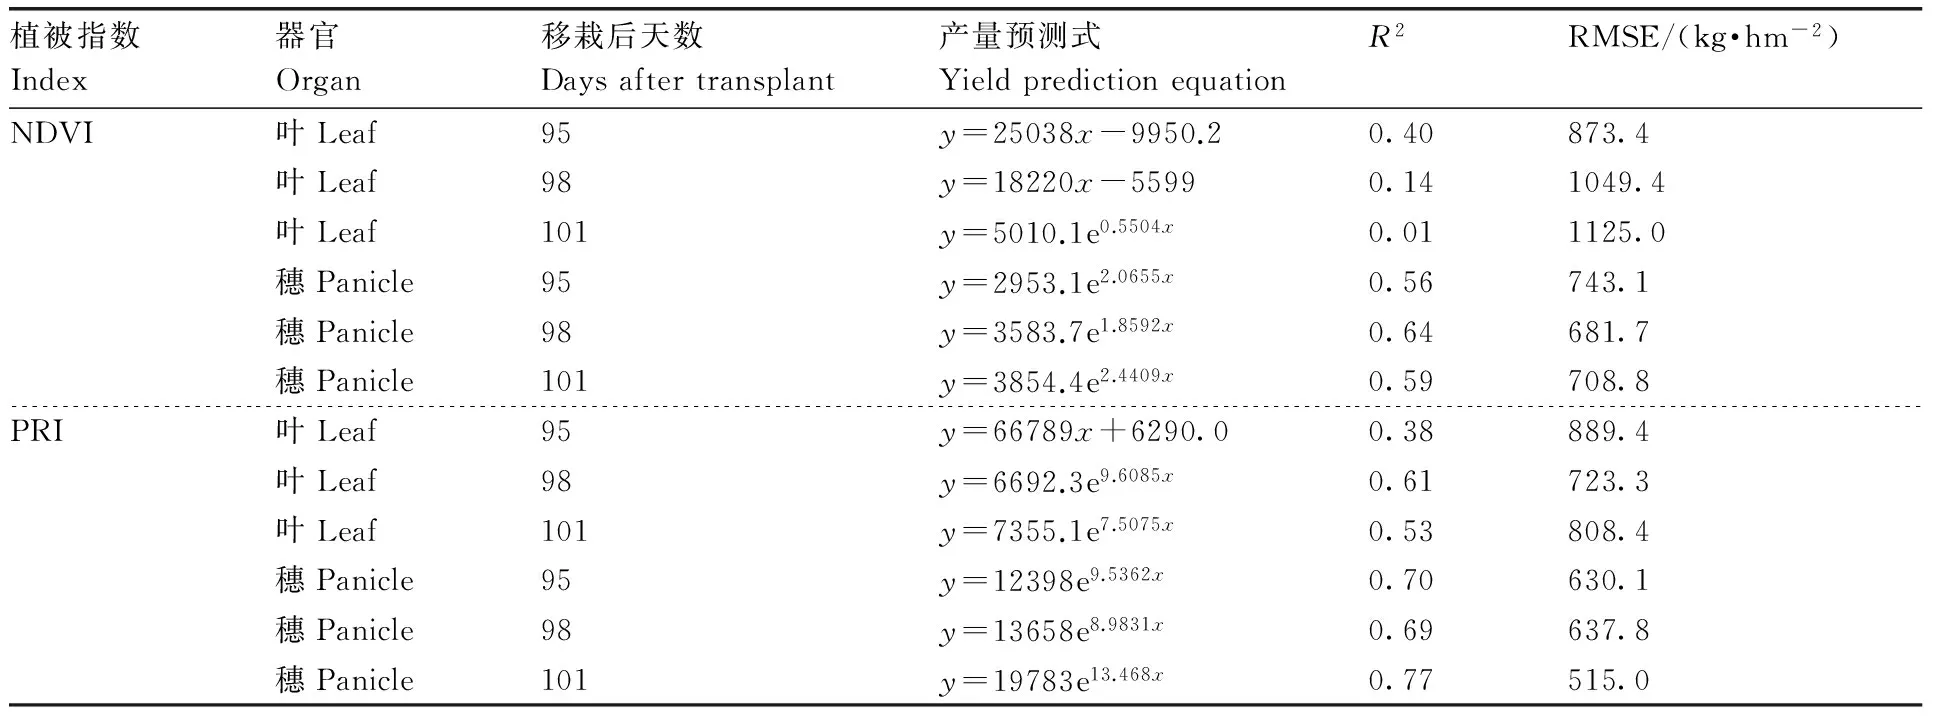
植被指数Index器官Organ移栽后天数Daysaftertransplant产量预测式YieldpredictionequationR2RMSE/(kg·hm-2)NDVI叶Leaf95y=25038x-9950.20.40873.4叶Leaf98y=18220x-55990.141049.4叶Leaf101y=5010.1e0.5504x0.011125.0穗Panicle95y=2953.1e2.0655x0.56743.1穗Panicle98y=3583.7e1.8592x0.64681.7穗Panicle101y=3854.4e2.4409x0.59708.8PRI叶Leaf95y=66789x+6290.00.38889.4叶Leaf98y=6692.3e9.6085x0.61723.3叶Leaf101y=7355.1e7.5075x0.53808.4穗Panicle95y=12398e9.5362x0.70630.1穗Panicle98y=13658e8.9831x0.69637.8穗Panicle101y=19783e13.468x0.77515.0
3 结论与讨论
水稻穗的反射光谱曲线中出现绿峰缺失现象,与叶片光谱指数相比,穗光谱指数与叶绿素含量、叶绿素/类胡萝卜素间的相关性更强,能更准确地区分氮素水平,因此,可用于水稻产量预测。叶片NDVI和PRI预测产量的RSME分别为873.4~1 125.0、723.3~889.4 kg·hm-2,而穗NDVI和PRI预测产量的RSME分别为681.7~743.1和515.0~637.8 kg·hm-2。在中高浓度的叶绿素条件下,叶片反射在675 nm附近区域出现饱和[31],这可能是叶片光谱指数区分氮素水平效果不佳的原因。穗的叶绿素含量低,不会出现信号饱和问题。由于氮素状况是决定产量的关键因子之一,穗光谱植被指数在产量预测方面的表现可能优于叶片光谱植被指数。本研究还表明,在3个测产时期(移栽后95、98、101 d)中,用移栽后101 d的穗PRI预测产量的精度最高,这可能是因为在移栽后101 d穗的叶绿素含量较低(0.05~0.13 mg·g-1),能更敏感地指示水稻产量。目前,人工水稻测产方法主要是测量水稻产量性状(如株数、穗部形态、每穗粒数、千粒重等),通常费时费力。作物冠层光学遥感提供了一种快速而廉价的水稻测产方法,并可提供育种所需的产量相关性状的信息[8]。在先前谷类作物的光谱估产研究中,绝大多数研究聚焦于营养生长期,因此,所获取的光谱信息不能反映穗部特征。近年来有少量研究用生殖生长期的光谱进行估产,获得了较高的估产精度[8,32-33]。本研究首次尝试用单穗的高光谱特性进行水稻估产,结果表明,水稻穗部高光谱反射特征在水稻测产方面有应用潜力,能直接反映穗部结构特征和生化组成,可为品种选育提供重要技术参数。
[1] MOHANTY S. The global rice market: where is it going[J].RiceToday, 2010 (9): 42-43.
[2] ZEIGLER R S. Bringing hope: Improving lives[C]. IRRI. International Rice Research Institutes, 2006: 7-12.
[3] ALI A M, THIND H S, SHARMA S, et al. Prediction of dry direct- seeded rice yields using chlorophyll meter, leaf color chart and GreenSeeker optical sensor in northwestern India[J].FieldCropsResearch, 2014, 161(1385): 11-15.
[4] FISCHER R A, STOCKMAN Y M. Kernel number per spike in wheat (TriticumaestivumL.): Responses to preanthesis shading[J].FunctionalPlantBiology, 1980, 7(2): 169-180.
[5] STOCKMAN Y M, FISCHER R A, BRITTAIN E G. Assimilate supply and floret development within the spike of wheat (TriticumaestivumL.)[J].FunctionalPlantBiology, 1983, 10(6): 585-594.
[6] ABBATE P E, ANDRADE F H, CULOT J P, et al. Grain yield in wheat: effects of radiation during spike growth period[J].FieldCropsResearch, 1997, 54(2/3): 245-257.
[7] ZHANG H C, WANG X Q, DAI Q G, et al. Effects of N- application rate on yield, quality and characters of nitrogen uptake of hybrid rice variety Liangyoupeijiu[J].ScientiaAgriculturaSinica, 2003,36(7): 800-806.
[8] ERDLE K, MISTELE B, SCHMIDHALTER U. Spectral assessments of phenotypic differences in spike development during grain filling affected by varying N supply in wheat[J].JournalofPlantNutritionandSoilScience, 2013, 176(6): 952-963.
[9] SHIBAYAMA M, AKIYAMA T. Estimating grain- yield of maturing rice canopies using high resolution reflectance measurement[J].RemoteSensingofEnvironment, 1991, 36(1): 45-53.
[10] GROTEN S M E. NDVI- crop monitoring and early yield assessment of Burkina Faso[J].InternationalJournalofRemoteSensing, 1993, 14(8): 1495-1515.
[11] HARRELL D L, TUBAA B S, WALKER T W, et al. Estimating rice grain yield potential using normalized difference vegetation index[J].AgronomyJournal, 2011, 103(6):1717-1723.
[12] MERONI M, MARINHO E, SGHAIER N, et al. Remote sensing based yield estimation in a Stochastic framework- Case study of durum wheat in Tunisia[J].RemoteSensing, 2013, 5(2): 539-557.
[13] KOWALIKA W, DABROWSKA- ZIELINSKAA K, MERONIB M, et al. Yield estimation using SPOT- VEGETATION products: A case study of wheat in European countries[J].InternationalJournalofAppliedEarthObservationandGeoinformation, 2014, 32(10): 228-239.
[14] GOBRON N, PINTY B, VERSTRAETE M M. Theoretical limits to the estimation of the leaf area index on the basis of visible and near- infrared remote sensing data[J].IEEETransactionsonGeoscience&RemoteSensing, 1997, 35(6): 1438-1445.
[15] GARBULSKY M F, PEUELAS J, GAMON J, et al. The photochemical reflectance index (PRI) and the remote sensing of leaf, canopy and ecosystem radiation use efficiencies: A review and meta- analysis[J].RemoteSensingofEnvironment, 2011, 115(2): 281-297.
[16] APARICIO N, VILLEGAS D, CASADESUS J, et al. Spectral vegetation indices as nondestructive tools for determining durum wheat yield[J].AgronomyJournal, 2000, 92(1): 83-91.
[17] VILLEGAS D. Usefulness of spectral reflectance indices as durum wheat yield predictors under contrasting Mediterranean conditions[J].InternationalJournalofRemoteSensing, 2003, 24(22): 4403-4419.
[18] UNO Y, PRASHER S O, LACROIX R, et al. Artificial neural networks to predict corn yield from compact airborne spectrographic imager data[J].Computers&ElectronicsinAgriculture, 2005, 47(2): 149-161.
[19] STRCHAN I B, PATTEY E, SALUSTRO C, et al. Use of hyperspectral remote sensing to estimate the gross photosynthesis of agricultural fields[J].CanadianJournalofRemoteSensing, 2008, 34(3): 333-341.
[20] YE X J, SAKAI K, SASAO A, et al. Estimation of citrus yield from canopy spectral features determined by airborne hyperspectral imagery[J].InternationalJournalofRemoteSensing, 2009, 30(18): 4621-4642.
[21] LIU J G, PATTEY E, MILLER J R, et al. Estimating crop stresses, aboveground dry biomass and yield of corn using multi- temporal optical data combined with a radiation use efficiency model[J].RemoteSensingofEnvironment, 2010, 114(6): 1167-1177.
[22] CASANOVA D, EPEMA G F, GOUDRIAAN J. Monitoring rice reflectance at field level for estimating biomass and LAI[J].FieldCropsResearch, 1998, 55(1/2): 83-92.
[23] CHANG K W, SHEN Y, LO J C. Predicting rice yield using canopy reflectance measured at booting stage[J].AgronomyJournal, 2005, 97(3): 872-878.
[24] SWAIN KC, THOMSON S J, JAYASURIYA H P W. Adoption of an unmanned helicopter for low- altitude remote sensing to estimate yield and total biomass of a rice crop[J].TransactionsoftheASABE, 2010, 53 (1): 21-27.
[25] DE DATTA S K. Principles and practices of rice production[M].[2017- 01- 11]. New York: Wiley, 1981.
[26] ZHOU Q F, WANG J H. Leaf and spike reflectance spectra of rice with contrasting nitrogen supplemental levels[J].InternationalJournalofRemoteSensing, 2003, 24 (7): 1587-1593.
[27] 陈维君, 周启发, 黄敬峰. 用高光谱植被指数估算水稻乳熟后叶片和穗的色素含量[J]. 中国水稻科学, 2006, 20(4): 434-439.
CHEN W J, ZHOU Q F, HUANG J F. Estimating pigment contents in leaves and panicles of rice after milky ripening by hyperspectral vegetation indices[J].ChineseJournalofRiceScience, 2006, 20(4): 434-439. (in Chinese with English abstract).
[28] CHEN L, HUANG J F, WANG F M, et al. Comparison between back propagation neural network and regression models for the estimation of pigment content in rice leaves and panicles using hyperspectral data[J].InternationalJournalofRemoteSensing, 2007, 28 (16): 3457-3478.
[29] ROUSE J W J, HAAS R H, SCHELL J A, et al. Monitoring vegetation systems in the great plains with erts[J].NasaSpecialPublication, 1974, 351:309.
[31] THOMAS J R, GAUSMAN H W. Leaf reflectance vs. leaf chlorophyll and carotenoid concentrations for eight crops1[J].AgronomyJournal, 1977, 69(5): 799-802.
[32] APARICIO N, VILLEGAS D, CASADESUS J, et al. Spectral vegetation indices as nondestructive tools for determining durum wheat yield[J].AgronomyJournal, 2000, 92(1): 83-91.
[33] PRASAD B, CARVER B F, STONE M L, et al. Potential use of spectral reflectance indices as a selection tool for grain yield in winter wheat under great plains conditions[J].CropScience, 2007, 47(4):1426-1440.

