Diagnosis System for Parkinson’s Disease Using Speech Characteristics of Patients and Deep Belief Network
Ali H.Al-Fatlawi, Sai Ho Ling, and Mohammed H. Jabardi
1 Introduction
Parkinson’s disease (PD) is a serious disease that targets people after the age of 60 years[1].It is a degenerative disorder of the central nervous system of the humans and affects most of its functions. Mostly, it may be subject to genetic and environmental factors[2]. In 2013, PD was presented in 53 million people globally[3], it is vital to analyse and investigate this disease deeply.
Bradykinesia (slowness of movement), rigidity, tremor, and poor balance[4-7]are considered as the primary motor symptoms of PD. Clinically, the main pathological characteristic of PD is the cell death in the brain where these cells are producing the Dopamine which is the chemical neurotransmitter carrying information from a nerve cell to another. Dopamine is an organic chemical of the catecholamine and phenethylamine families that plays a major role in the brain and allows the brain to interact efficiently in controlling the feeling, behavior, awareness, body movement and speech ability of the humans[8]. Most of the PD patients have problems with their speeches due to the cell death. Their voices can be soft, rapid, and illegible. Subsequently, vocal impairment is one of the early signs and symptoms of PD[9]because 90% of Parkinson’s patients suffer from vocal impairment[10].Thus, analysing the speech characteristic of patients with PD is a very crucial factor to diagnosis the PD[11,12].
Through a set of tests in the verbal glibness, we can see that the major problems noticed in Parkinson’s patients are in their pronunciations and voices[13]. Thus, one of the obvious signs of the PD patients is their unclear and not understandable speech in addition to having difficulty inpronouncing the words. Although it has many signs that can classify a Parkinson’s patient, there is no definitive test to diagnosis the Parkinson’s patients. Moreover, it was difficult to diagnose the PD at an early stage. Furthermore, the diagnosis of PD can be based on the patient’s medical history, neurological examination capacity and symptoms suffered by the patient[1].
The distinguishing and analysing of the patients’ speech characteristic are considered to be an effective early detection algorithm of PD[14]. Recently, intelligent computational technologies have been investigated to diagnosis the PD, such as neural networks (NNs) and data-mining algorithms[15].To classify the voices of Parkinson’s patients, a number of data-mining methods such as Random Forest, Ada-Boost and K-NN are presented[16]. Bhattacharya et al.[16]concluded that the K-NN is the best one among these three methods and the overall accuracy of 90.26% is achieved.
Furthermore, Support Vector Machines (SVMs) are used in diagnosing the PD[17],and the classification accuracy is 93.33%. In this approach, Genetic Algorithm is used to select the impacted feature and SVM is used to classify the patterns.
A dataset[18-20]created by Max Little from University of Oxford is widely used to test the accuracy of diagnosis system for PD using speech. This dataset is composed of a range of voice measurements from 31 people including 23 with PD and eight healthy people. In [18], three different probabilistic neural networks (PNN) are investigated to diagnose the PD.These three PNN procedures are hybrid search (HS), Monte Carlo search (MCS) and incremental search (IS). The accuracy of HS is 81.28%, MCS is 80.92% and IS is 79.78%.Furthermore, there are four algorithms namely Decision Tree, Regression, Data Mining Neural (DMneural) and Neural Networks are conducted[19], and their accuracies are 84.3%, 88.6%, 84.3% and 92.9% respectively. It can be seen that the neural network is the most efficient method.
Lastly,[20] applied this dataset on nine data-mining algorithms: Bayes Net, Naïve Bayes, Logistic, Simple Logistic, KStar, ADTree, J48, LMT and Random Forest. In their experiment, the best algorithm was the Random Forest with an accuracy of 90.26%. In this paper, we use the same dataset which has been used in [18-20] to diagnose the PD but with deep belief network (DBN).
DBN is a type of neural network which is built as a generative graphical model containing a stack of processing layers. The key features of the DBN are their structure and their modelling techniques. These networks can model the data in two levels of processing. The lower layers can handle the low level of characteristics while the higher layers process a higher order of data[21].The generative model of the DBN and its ability in handling nonlinear data effectively have promised to be the dominant form of machine learning in analysing the speech signals[21]. These advantages in addition to its higher capacity for the parameters that are gained by containing many nonlinear hidden units[22], motivate us to adopt this technology in our works. In this paper, DBN has been presented as an efficient solution to handle the features of the voices and classify the patient status with higher accuracy compared with other studies.
This paper is organised as follows: In section 2, the method of the deep belief network is described.The experimental results and discussion are given in Section 3. In this section, a case study with 31 people is provided to show the merit of DBN. A comparison with different existing technologies is also presented. A conclusion is drawn in Section 4.
2 Method: Deep Brief Network
DBN is a multiple processing layers to model high-level abstraction in data with complex structure[23]. These processing layers are connected to each other with connection weights but without any link within the same layer. Therefore, it is a generative graphical model, consisting of multiple layers of hidden units[24]. There are two training stages for DBN: i) unsupervised learning and ii) supervised learning. DBN can be designed as a construction of Restricted Boltzmann Machines (RBM) that are stacked on each other and trained separately. In this pre-training stage, unsupervised learning is adapted to learn the DBN. It divides the network into groups of stacked sub-networks, each of them includes two processing layers. Basically, this operation is performed to solve the problems that are associated with selecting random values in initialising the connection weights and providing the network with pre-trained weights. Greedy Layer-Wise unsupervised training algorithm[25]is chosen in this process.
RBM is a generative stochastic of neural network that can be learned based on a probability model by using unsupervised learning technique. The general architecture of RBM is shown in Fig.1. RBM composes two processing layers, i.e., visible layer and hidden layer. These layers are connected together to allow the construction and reconstruction processes with no connection between the units of the same layer[26]. The visible layer (v) consistsivisible units (v1,v2,…,vi) to process the features of pattern which are entering the network as unlabeled data while the hidden layer (h) containsjhidden units (h1,h2, …,hj) with binary values which receive their data from the visible units and can reconstruct them.
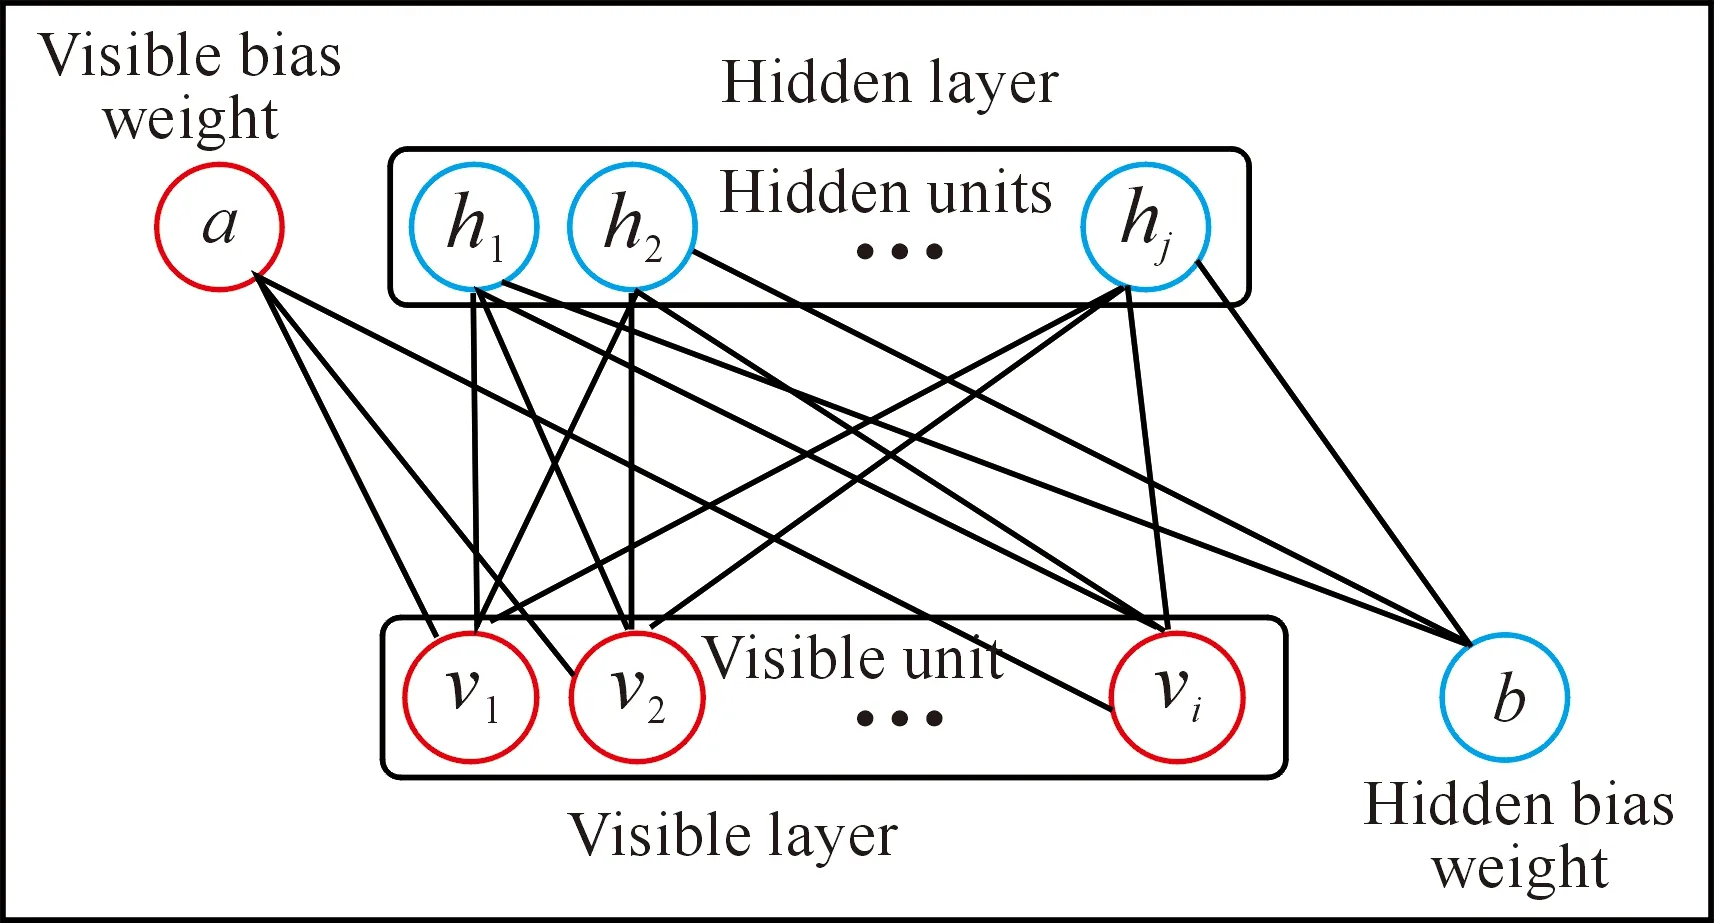
Fig.1GeneralarchitectureofRBM.
All the visible units communicate with the hidden units as a bidirectional matrix of weight (Wij) associated symmetrically, in addition to the visible bias (ai) and hidden bias (bi)[24,27]. In most problems, such as speech classification, the data of the patterns are continuous nonlinear values (not binary). Although DBN is designed to manipulate binary data, it can also deal with the real input data in the visible layer with a particular way. In order to manipulate the real values, independent Gaussian noise functions can be used instead of the binary visible units[26]. Thus, the energy functionE(v,h) can be written as Equation (1):
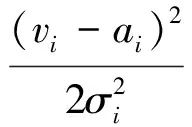

(1)
whereσiis the standard deviation of the Gaussian noise for visible uniti.All input data is normalised to have zero mean and unit variance.
However, when both of the visible and the hidden units are Gaussians, then the learning process will become more complicated. Thus, the individual activities are held close to their means by quadratic containment terms with coefficients determined by the standard deviations of the assumed noise levels[26]. Then, the energy function is modified asshown in Equation (2)[28]:

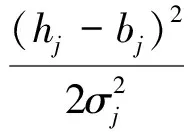
(2)
In this paper, the contrastive divergence (CD) algorithm is used to optimise the network’s parameter (connection weights). Generally, the learning in the RBM focuses on calculating three primary factors: i) unbiased sample of the hidden unit (negative phase), ii) unbiased sample of the state of a visible unit (positive phase), and iii) final matrix of connection weights. The following procedure is describing the steps that are followed to implement this algorithm with RBM.
(1) Calculating the probabilities of hidden units and sample their vectors from training sample according to Equation (3). Then, computing the outer product ofvandh(positive phase).
P(hj=1)=f(bj+∑viwij)
(3)
(2) Sampling the reconstruction vectorv′ of the visible unit from the vectorh. Then resampling the hidden activationsh′. (Gibbs sampling step)as indicated in Equation (4).
P(vi=1) =f(ai+∑hjwij)
(4)
(3) Calculating the outer product ofv′ andh′ (negative phase).
(4) Updating the matrix of weight rule according to Equation (5):
(5)
whereφis a learning rate.
(5) Update the visible bias (ai) and hidden bias (hi) as written in Equation (6) and Equation (7) wheref(·) is a logistical activation function and shown in Equation (8).
a=a+f(v-v′)
(6)
b=b+f(h-h′)
(7)
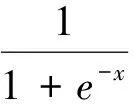
(8)
A general architecture of DBN is shown in Fig.2. In this figure, it can be seen that DBN is divided into multiple RBM networks. The first RBM is a construction of the visible and the first hidden layer. Then the second RBM is built from communicating the first hidden layer and the second hidden layer and so on.
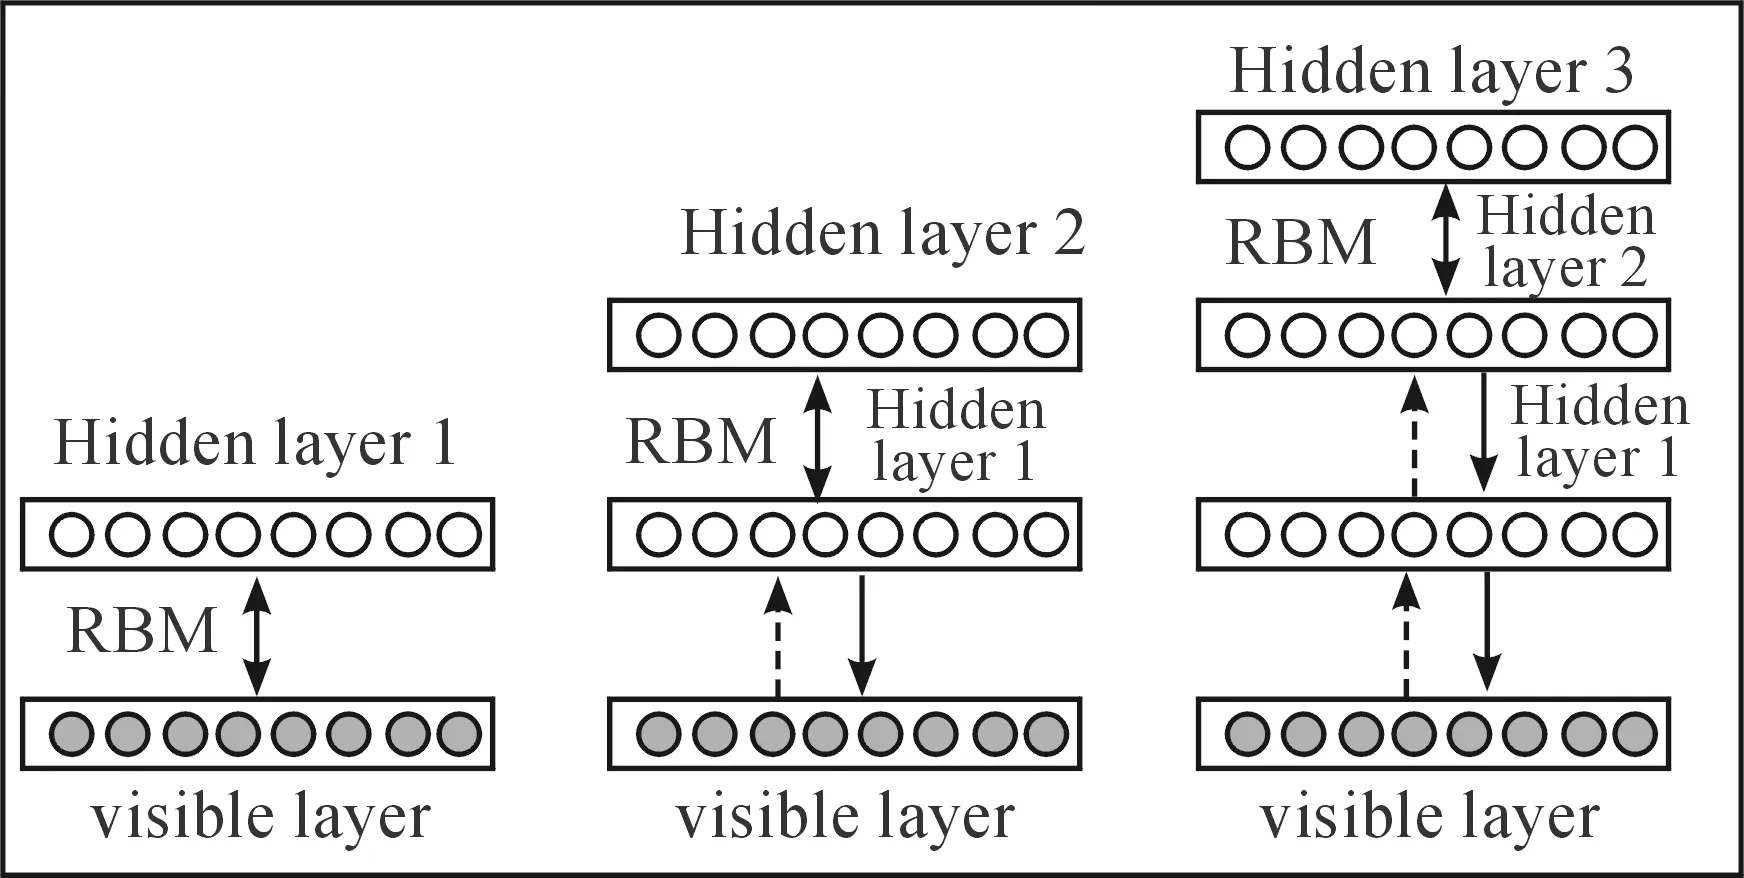
Fig.2GeneralarchitectureofDBN.
After applying the above algorithm on each RBM in the network and optimising its parameters, the first training stageis completed. Then, the second stage is to fine tune the pre-trained network using supervised learning method[24].In this paper, we use the back-propagation algorithm to fine tune the DBN. Being a supervised learning method, labeling the data is essential with this algorithm, pairs of training data (input and its corresponding target vector) are needed to be provided to the classifier[29,30].
3 Results and Discussion
3.1 Experimental setup
In this paper, a Parkinson’s dataset is adopted to illustrate the performance of DBN to diagnosis the PD. This dataset collected by Max Little of the University of Oxford, in collaboration with the National Centre for Voice and Speech, Denver, Colorado[31]and the speech signals are recorded by a telemonitoring device.In this dataset, 31 people are volunteered including 23 people with PD and 8 healthy people. It extracted the voice features of samples from 195 subjects. 16 attributes (features) for each sample are considered in this paper, and which are briefly described in Table 1. All the attributes are real value and therefore they are normalised to have zero mean and unit variance in order to fit the proposed work. The output of the data set is a binary output where the “1” represents the PD subject,and “0” represents the healthy subject.
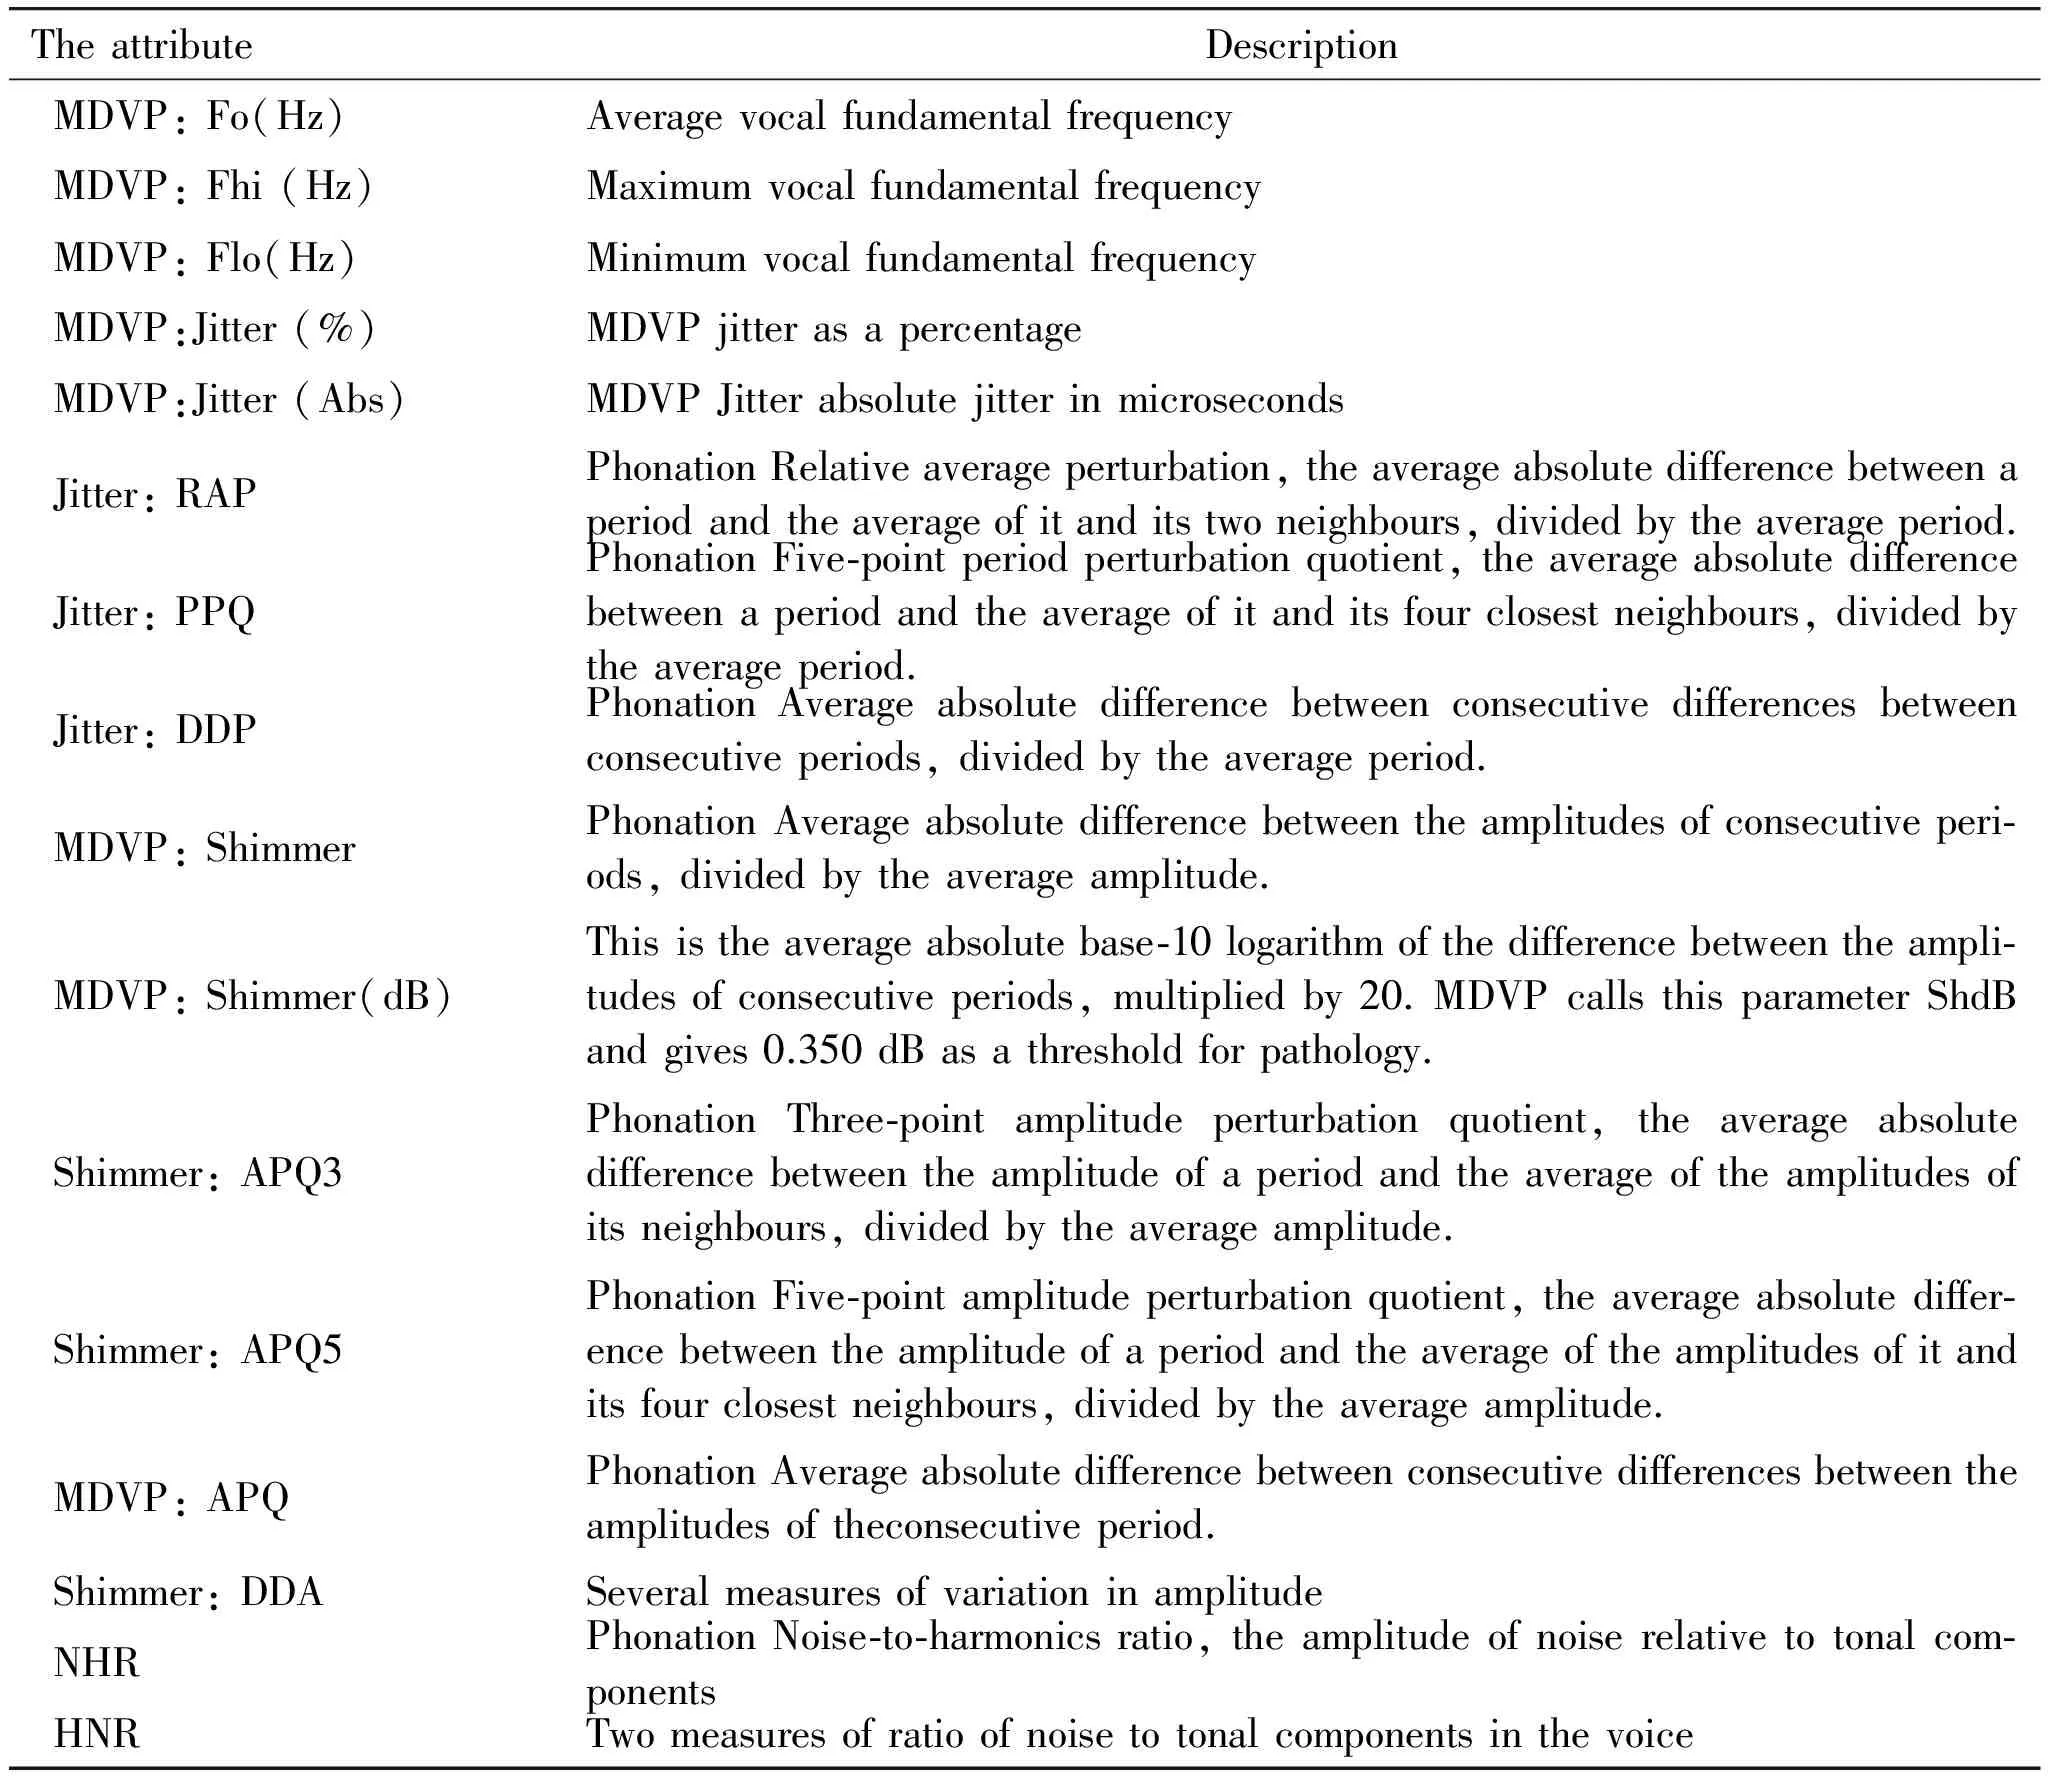
Table 1 Brief description of the dataset’s attributes.
In this work, we aim to design an efficient diagnosis system for PD using a DBN and the main contribution is to optimise the DBN to reach the best classification results. To achieve this contribution, the methodology of the paper is divided into two tasks.The first task is to determine the best structure that can lead to the highest applicable accuracy. The second task is optimising the connection weights to attain the best applicable classification with the lowest mean square error.
The overall structure of the proposed system is illustrated in Fig.3. It can be seen that the network has been conceived as a stack of two Restricted Boltzmann Machines. The first layer is the visible layer which receives the features of the patterns (inputs) to be manipulated in multiple processing layers. By considering 16 of the attributes (features), the number of the units in the visible layer is 16. As the system will classify the pattern into one of two probabilities, either healthy (0) or sick (1), only one unit is required in the output layer. The layers between the visible and the output are called hidden layers, and they have the major role in processing the data and getting the best classification results.
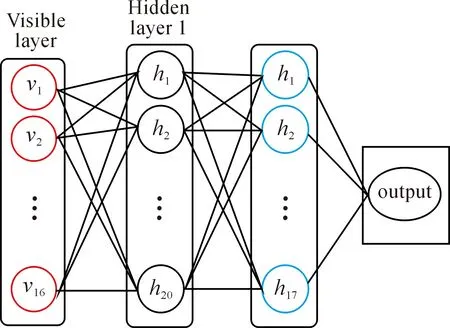
Fig.3 The overall structure of the proposed system.
3.2 Results
To identify the performance of the proposed method by using the dataset, we divided the samples into two groups of data. The first group is the training samples that is accounted for 74% of the total samples. The remaining samples will be used for testing.
In the first training process, unsupervised learning operation takes its place in optimising two RBMs that are stacked on top of each other. The number of iterations of this unsupervised training is 25000.The initial weightsof RBMs for the connection lines between the visible layer and the first hidden layer and also between the first hidden layer and the second hidden layer are trained and determined. During the training the process and after learning the first RBM, its output enters as an input to the second RBM. By means, the two networks have been trained asynchronously. Therefore, they need to be tuned to handle the input data in an efficient mode by using the supervised learning method. The back propagation has been used to fine-tune the two RBMs with each other and also to tune them with output layer. Mean Square Error (MSE) is used as a measure of the performance of the network during the training procedure to reach the minimum error.
After 8700 iterations of supervised learning, the MSE reached its steady state rate. The number of the neurons in each hidden layer one of the uncertain issues has a significant impact on the efficiency of the classification operation.
Deciding the number of the hidden layers and the number of units in each of these layers is not an easy task because it is changing based on the problem and nature of the data. Although many studies have presented different solutions to determine that, there is no definitive method to decide these values. Hinton et al.[26]points out that the number of the training cases and their dimensionality and redundancy can contribute in determining the number of these units. In this direction, training cases with high redundancy needs big sets, and fewer parameters are required because using more parameters can lead to an overfitting[26]. In fact, there is no optimal value, and the selection often depends on the trial and error technique within a particular range. To calculate the number of the hidden layers in the network, many studies suggest that the process may start with one layer then add another and stop before reaching the overfitting while others argue that network with three[32]or two hidden layers are enough to handle most types of the problems.
In the proposed design, a structure of two hidden layers is the best choice to present high accuracy with no overfitting.For the first hidden layer, the examined numbers were from 32 hidden units (double of the number of the visible units) to 8 units (half of the hidden units). Based on the experiment results tabulated in Table 2, we can see that 20 hidden units in the first hidden layer and 17 units in the second hidden layer are the best consideration to attain a higher accuracy (94%).
During the testing phase, the system has been examined by using another set of patterns (testing set). It succeeded in classifying 47 patterns out of 50 in the testing set and failed with three patterns only. Therefore, the overall accuracy of the system is 94%. This percent is good enough to generate a reliable system that is able to diagnosis the patients.
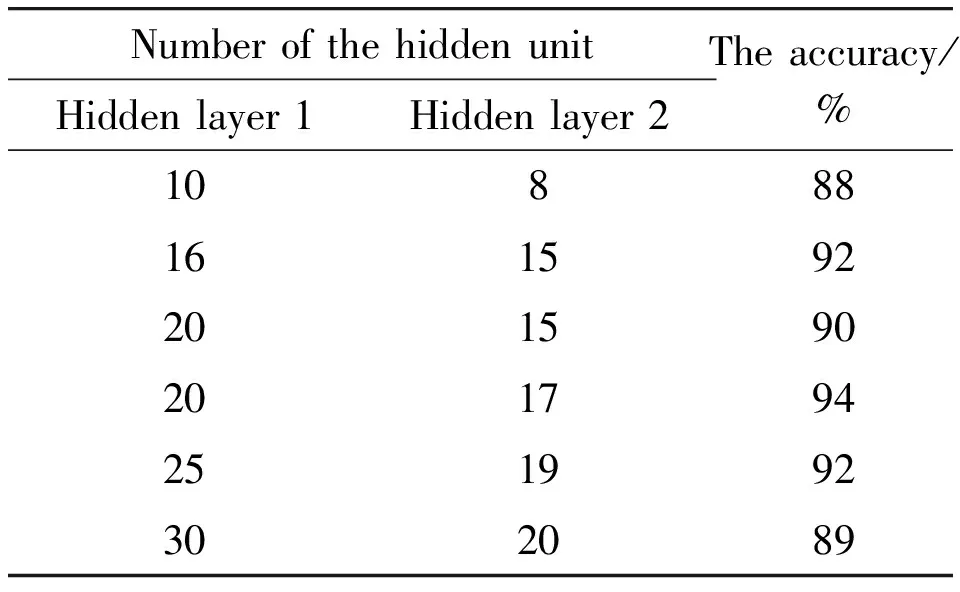
Table 2 The accuracy of the system with different units number.
For comparison purpose, different existing technologies[20-22]are also tested, and the results are tabulated in Table 3. It shows that the performance of the DBN is better than those of the methods.
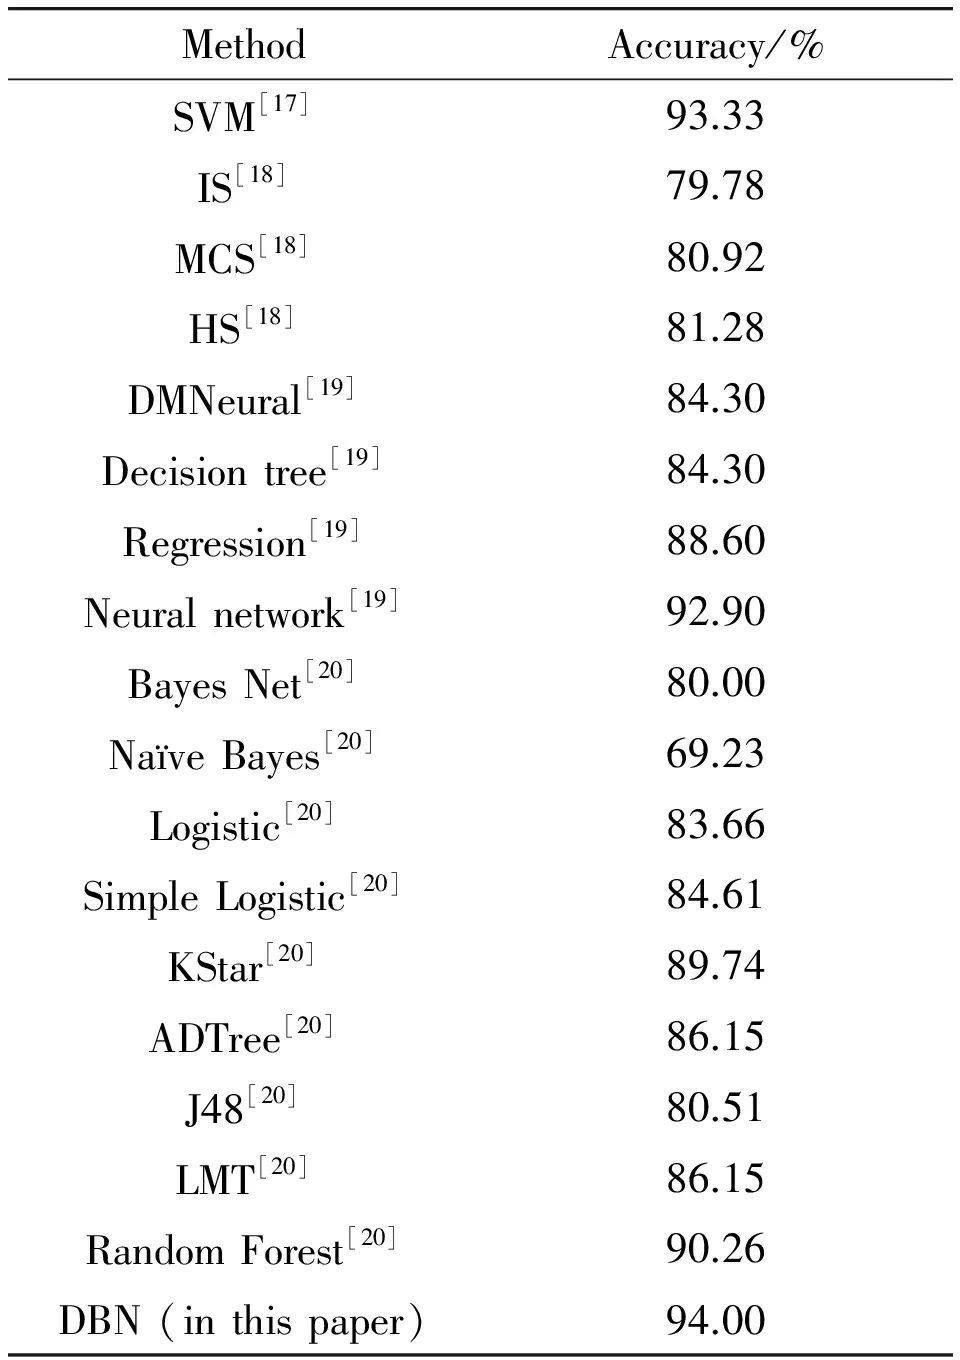
Table 3 Comparison of the accuracy of the proposed work and previous works by applying the same dataset.
3.3 Discussion
This paper aims to produce an automatic system to diagnosis the PD and specify their health status. We use a dataset that has been published on the UCI website. Many researchers worked on this dataset and applied it in classification and regressing processes. By comparing the results of this work with those from other papers that utilised the same data, this paper achieves the best performance and accuracy. In [18], three probabilistic neural networks (PNN) have been used to classify that data. Its models are hybrid search (HS), Monte Carlo search (MCS) and incremental search (IS). The highest result for that paper doesn’t exceed 81.28%. Moreover, 8 algorithms have been applied to classify the data by Sriram et al.[20], but their accuracies were below 90.26%, while the accuracy of [20] reached 92.9% by using the neural networks with the same data. Finally, Gil et al.[17]used the SVM and achieved an accuracy of 93.33%.On the other hand, the proposed system surpasses all of these works by achieving 94% accuracy when it was tested with the validation and test sets.
4 Conclusion
In this paper, an efficient diagnosis system for Parkinson’s disease using the deep belief neural network (DBN) is presented. Through recognising the voice of patients, the onset of Parkinson’s disease can be diagnosed. To illustrate the efficiency of the DBN, a case study with dataset published in [31] is investigated, and the result indicates that the deep belief network gives an improvement for diagnosis with 94% accuracy. This result shows that DBN has succeeded in reaching the highest accuracy with this dataset.
Although the proposed work has achieved the highest accuracy among all the methods and techniques that used the same dataset, 94% recognition rate needs some enhancements. High accuracy means more reliable and robust system. Therefore, one of the future directions is improving the recognition rate of the system to be closer to 100% of correct classification. One of the possible techniques that can improve the results is using the genetic algorithm in determining some uncertain parameters during the design such as the number of the hidden neurons and the learning rate.
The proposed system can determine whether the person is sick or in good health. Although this is the primary objective of the most diagnosis systems, more information about the degree of the sickness is expected to be introduced by such systems. Therefore, this can be identified as a limitation of the proposed work that needs to be considered. As a future work, the produced system can be developed to give a score for Parkinson’s patients that can measure the degree of the harming instead of only classifying them into healthy and patient.
[1]S.K.Van Den Eeden, C.M.Tanner, A.L.Bernstein, R.D.Fross, A.Leimpeter, D.A.Bloch, and L.M.Nelson, Incidence of Parkinson’s Disease: Variation by Age, Gender, and Race/Ethnicity,AmericanJournalofEpidemiology, vol.157, no.11, pp.1015-1022, 2003.
[2]S.Lesage and A.Brice, Parkinson’s disease: from monogenic forms to genetic susceptibility factors,HumanMolecularGenetics, vol.18, no.R1, pp.R48-R59, 2009
[3]T.Vos, R.M.Barber, B.Bell, A.Bertozzi-Villa, et al., Global, regional, and national incidence, prevalence, and years lived with disability for 301 acute and chronic diseases and injuries in 188 countries, 1990-2013: a systematic analysis for the Global Burden of Disease Study 2013,TheLancet, vol.386, no.9995, pp.743-800, 2015.
[4]L.Cunningham, S.Mason, C.Nugent, G.Moore, D.Finlay, and D.Craig, Home-Based Monitoring and Assessment of Parkinson’s Disease,IEEETransactionsonInformationTechnologyinBiomedicine,vol.15, no.1, pp.47-53, 2011.
[5]Z.A.Dastgheib, B.Lithgow, and Z.Moussavi, Diagnosis of Parkinson’s disease using electrovestibulography,Medical&BiologicalEngineering&Computing, vol.50, no.5, pp.483-491, 2012.
[6]S.Marino, R.Ciurleo, G.Di Lorenzo, M.Barresi, S.De Salvo, S.Giacoppo, A.Bramanti, P.Lanzafame, and P.Bramanti, Magnetic resonance imaging markers for early diagnosis of Parkinson’s disease,NeuralRegenerationResearch, vol.7, no.8, pp.611-619, 2012.
[7]G.Rigas, A.T.Tzallas, M.G.Tsipouras, P.Bougia, E.E.Tripoliti, D.Baga, D.I.Fotiadis, S.G.Tsouli, and S.Konitsiotis, Assessment of Tremor Activity in the Parkinson Disease Using a Set of Wearable Sensors,IEEETransactionsonInformationTechnologyinBiomedicine, vol.16, no.3, pp.478-487, 2012.
[8]J.Jankovic and E.Tolosa,Parkinson’sDiseaseandMovementDisorders.Lippincott Williams & Wilkins, 2007.
[9]J.Duffy,Motorspeechdisorders:Substrates,differentialdiagnosis,andmanagement.St.Louis, MO: Mosby-Year Book, Inc, 2005.
[10] J.A.Logemann, H.B.Fisher, B.Boshes, and E.R.Blonsky, Frequency and cooccurrence of vocal tract dysfunctions in the speech of a large sample of Parkinson patients,JournalofSpeechandHearingDisorders, vol.43, pp.47-57, 1978.
[11] D.A.Rahn, M.Chou, J.J.Jiang, and Y.Zhang, Phonatory impairment in Parkinson’s disease: evidence from nonlinear dynamic analysis and perturbation analysis,JournalofVoice, vol.21, no.1, pp.64-71, 2007.
[12] S.Sapir, J.L.Spielman, L.O.Ramig, B.H.Story, and C.Fox, Effects of intensive voice treatment (the Lee Silverman Voice Treatment [LSVT]) on vowel articulation in dysarthric individuals with idiopathic Parkinson disease: acoustic and perceptual findings,JournalofSpeech,Language,andHearingResearch, vol.50, pp.899-912, 2007.
[13] N.Caballol, M.J.Martí, and E.Tolosa, Cognitive dysfunction and dementia in Parkinson disease,MovementDisorders, vol.22, no.S17, pp.S358-S366, 2007.
[14] W.Froelich, K.Wróbel, and P.Porwik, Diagnosing Parkinson’s disease using the classification of speech signals,JournalofMedicalInformatics&Technologies, vol.23, pp.187-193, 2014.
[15] A.Khemphila and V.Boonjing, Parkinsons disease classification using neural network and feature selection,WorldAcademyofScience,EngineeringandTechnology, vol.64, pp.15-18, 2012.
[16] I.Bhattacharya and M.P.S.Bhatia, SVM classification to distinguish Parkinson disease patients, inProceedingsofthe1stAmritaACM-WCelebrationonWomeninComputinginIndia, Coimbatore, India, 2010.
[17] D.Gil and M.Johnson, Diagnosing parkinson by using artificial neural networks and support vector machines,GlobalJournalofComputerScienceandTechnology, vol.9, pp.63-71, 2009.
[18] M.Ene, Neural network-based approach to discriminate healthy people from those with Parkinson’s disease,AnnalsoftheUniversityofCraiova-MathematicsandComputerScienceSeries, vol.35, pp.112-116, 2008.
[19] R.Das, A comparison of multiple classification methods for diagnosis of Parkinson disease,ExpertSystemswithApplications, vol.37, no.2, pp.1568-1572, 2010.
[20] T.V.Sriram, M.V.Rao, G.S.Narayana, D.Kaladhar, and T.P.R.Vital, Intelligent Parkinson Disease Prediction Using Machine Learning Algorithms,InternationalJournalofEngineeringandInnovativeTechnology(IJEIT), vol.3, no.3, pp.212-215, 2013.
[21] A.R.Mohamed, G.Hinton, and G.Penn, Understanding how deep belief networks perform acoustic modelling, inProceedingsof2012IEEEInternationalConferenceonAcoustics,SpeechandSignalProcessing(ICASSP), 2012, pp.4273-4276.
[22] A.R.Mohamed, G.E.Dahl and G.Hinton, Acoustic Modeling Using Deep Belief Networks,IEEETransactionsonAudio,Speech,andLanguageProcessing, vol.20, no.1, pp.14-22, 2012.
[23] L.Deng and D.Yu, Deep learning: methods and applications,FoundationsandTrendsinSignalProcessing, vol.7, no.3-4, pp.197-387, 2014.
[24] G.E.Hinton and R.R.Salakhutdinov, Reducing the Dimensionality of Data with Neural Networks,Science, vol.313, no.5786, pp.504-507, 2006.
[25] Y.Bengio, P.Lamblin, D.Popovici, and H.Larochelle, Greedy layer-wise training of deep networks,Advancesinneuralinformationprocessingsystems, vol.19, pp.153, 2007.
[26] G.Hinton, A practical guide to training restricted Boltzmann machines,Momentum, vol.9, pp.926, 2010.
[27] G.E.Hinton, Training Products of Experts by Minimizing Contrastive Divergence,NeuralComputation, vol.14, no.8, pp.1771-1800, 2002.
[28] A.H.Al-Fatlawi, H.K.Fatlawi and S.H.Ling, Recognition physical activities with optimal number of wearable sensors using data mining algorithms and deep belief network, inProceedingsof39thAnnualInternationalConferenceoftheIEEEEngineeringinMedicineandBiologySociety(EMBC), Jeju Island, South Korea, 2017, pp.2871-2874.
[29] A.Al-Fatlawi, S.H Ling, and H.K Lam, A Comparison of Neural Classifiers for Graffiti Recognition,JournalofIntelligentLearningSystemsandApplications, vol.6, pp.94-112, 2014.
[30] M.H.N.Jabardi and H.Kaur, Artificial Neural Network Classification for Handwritten Digits Recognition,InternationalJournalofAdvancedResearchinComputerScience, vol.5, no.3, pp.107-111, 2014.
[31] M.A.Little, P.E.McSharry, E.J.Hunter, J.Spielman, and L.O.Ramig, Suitability of Dysphonia Measurements for Telemonitoring of Parkinson Disease,IEEETransactionsonBiomedicalEngineering, vol.56, no.4, pp.1015-1022, 2009.
[32] G.E.Hinton, S.Osindero, and Y.W.Teh, A fast learning algorithm for deep belief nets,Neuralcomputation, vol.18, no.7, pp.1527-1554, 2006.
 CAAI Transactions on Intelligence Technology2017年4期
- CAAI Transactions on Intelligence Technology的其它文章
- An Efficient Approach for The Evaluation of Generalized Force Derivatives by Means of Lie Group
- Magnetic Orientation System Based on Magnetometer, Accelerometer and Gyroscope
- A Mixed Reality System for Industrial Environment: an Evaluation Study
- Visual Navigation Method for Indoor Mobile Robot Based on Extended BoW Model
- Proposal of Initiative Service Model for Service Robot
- A Lane Detection Algorithm Based on Temporal-Spatial Information Matching and Fusion
