A Mixed Reality System for Industrial Environment: an Evaluation Study
Andrea F.Abate, Michele Nappi, Fabio Narducci, and Stefano Ricciardi
1 Introduction
A good idea or a new technology has to wait for the right conditions to fully show the advantages they may bring to everyday life. This is already happened many times and in many fields in the past, and is happening right now to mixed/augmented reality technologies that, after the first visionary intuition by Ivan Sutherland[1]back in 1968, have been an unfulfilled promise for more than three decades. However, this scenario is changed over the last years.
Augmented Reality (AR) based applications have progressively become more diffused and affordable. Consequently, the potential of mixed reality, for the big enterprise and the mass market as well, could be now unleashed.This favorable situation is tightly linked to the increased computing power and image processing capabilities now available in most computers as well as by cost reduction of “AR related” devices, as shown by the Oculus Rift HMD (Head Mounted Displays) and its tracking system. In this context, it is worth mentioning the more recent Crystal Cove[2]for which cheap and effective video see-through options are already available. Last but not the least, we have seen the birth of new wearable AR systems whose epitome is the Google Glass[3]or Microsoft Hololens[4]. In this context, the new generation of smartphones and tablets, featuring multiple sensors (gyroscopes, accelerometers, GPS, electronic compass, high resolution cameras, etc.), connections and enough processing power is a perfect candidate for becoming a portable and affordable AR platform. Apart from the marketing induced hype, the potential of AR/MR technologies still has to be assessed in terms of measurable advantages, particularly for demanding industrial applications requiring a prolonged usage of hardware and software components in a challenging environment.A high level of precision is required when co-registering virtual objects to the corresponding real counterparts that can be even very small and/or very close to other visual features. In this kind of scenario (which can be considered very common), an error in the order of a few millimeters may even lead to serious interpretation errors that could compromise the on-going intervention. Only a few studies involving small groups of people have been conducted on this topic to date. To this regard, the paper analytically evaluates and discusses the application of this technology to the field of industrial maintenance and technical training, by gathering objective and subjective data about the performance of AR-assisted servicing compared toordinary practice during real industrial procedures (which typically involve locating and interacting with small parts like switches, screws, led indicators, connectors, etc). To this aim, we designed and developed an AR systemable to precisely co-register virtual info to real equipment while providing,step-by-step, the correct sequence of visual aids and hints. The experiments reported later on, have been strictly performed within a real industrial environment, involving only real technicians or specialized personnel to assure the maximum depending ability of the results and they feature, to the best of the our knowledge, the largest number of subjects considered so far in such a kind of testing. We also exploited the most referenced and acknowledged metrics available in literature for both objective and subjective user evaluation, providing a comprehensive and detailed view of the experience the users had on the system.
The rest of this paper is organized as follows. Section 2 resumes the related work analyzing what have been done in the field. Section 3 describes the proposed MR-assisted servicing system, while Section 4 reports how the system assessment has been performed and Section 5 thoroughly analyzes the results achieved and discusses them in detail. Finally, Section 6 draws some conclusions and provides directions for future research.
2 Related Work
A number of studies have investigated the topic of mixed or augmented reality in industrial contexts in the last two decades.
Project ARVIKA[5]promoted the progress of AR technologies in the automotive and aerospace industries since 2002, focusing specifically on the power and process plants, as well as on machine tools and production gear. An AR system for the inspection of power plants was proposed by Klinker et al.[6]and an AR solution aimed to increasing the efficiency of nuclear powerplants while reducing human errors by means of more effective maintenance interventions was presented by Shimoda et al.[7]. AR-based scene filtering, revealing information hidden by an occluding object, was developed by Mendez et al.[8]to enhance interesting info or to suppress distracting elements.The use of AR in automotive industry is the main focus of the work by Pentenrieder et al.[9]aimed at improving both car design and manufacturing by planning production lines and workshops, analyzing interfering edges and verifying parts and their dimensional variance.
AR may also be useful for outdoor activities like shown by Still et al.[10]which proposed to exploit this technology for displaying geographical information system’s data for a more effective planning or surveying of underground infrastructure. Even aerospace industry can benefit from AR interfaces for reducing or preventing production or assembly errors as represented in the work by De Crescenzio et al.[11]. For different reasons, in any of the contexts considered, the need for an accurate and robust 6DOF tracking of user’s Co-registration of virtual objects with the surrounding environment is a crucial aspect of AR indeed. A wide range of technologies has been exploited for this purpose so far (optical, ultrasonic, magnetic, etc.), though, currently, there is no general solution available. Nevertheless, each of the various tracking approaches available today could be suitable to a particular applicative context, depending on indoor or outdoor usage, size of operating volume, presence or absence of ferromagnetic materials and electromagnetic fields, etc. Among the aforementioned methodologies, optical tracking is generally recognized as the only tracking methodology featuring non-invasive and accurate co-registration[12]either in the marker-based[7,13]or the markerless[14-17]variants. In this paper, the test-bed system is based on a multi-marker tracking algorithm that resulted suited to the characteristics of the target environment, including the presence of small components and the proximity of intense electromagnetic fields.
Regarding industrial applications of mixed reality, the computing and visualization hardware also plays a relevant role in the effectiveness of the whole system. Today, new-generations of smart phones and tablets seem ready for AR[18-22], but when the interaction requires a physical contact with the surrounding environment, the user may experiment a stressful experience since the user is forced to hold the device with one hand while operating with the other hand behind the devices screen.
MR systems are rarely evaluated in rigorous forms when applied to a real world scenarios[23]. Majority of proposals aim at demonstrating the suitability of the approach in the field of interest and/or the performance of the tracking method in terms of precision and real-time response. The implication that the MR systems has on the user’s understanding of the augmented scene and the gaining in his/her ability to accomplish a task that has been less explored and discussed in the literature. Several difficulties make such a goal hard to achieve: the users can move freely in the working environment and they do not necessarily sit in front of a PC; they talk during the interaction, movements that users could do to accomplish a task are almost unpredictable[24]. More significantly, the user interacts with the augmented scene by using his/her hands. As a consequence, occlusions occur quite often making the tracking method more prone to failure and formal analysis even harder to get[25,26]. Practically, it means that the experimental platform needs to provide a way of filtering the effects introduced by users’ freedom of motion and interaction in order to avoid biases in the analysis of the data.Goldie et al.[27]is one of the few works in the literature that present a formal study of an augmented reality application.
The idea of the proposed work is to demonstrate how effectively an augmented reality map helps users to traverse a maze. Forty participants were involved in the experimentation. The authors observed that in AR treatmentthe participants were able to find the exit of the maze in an amount of time significantly shorter than without augmented reality. However, the significance of the work is in the design of the experimental framework rather than in the outcomes of the research. To assess strengths and drawbacks of MR systems, quantitative analysis is particularly useful. However, without a good collection of qualitative data, the analysis result is incomplete[28].The work by Henderson and Feiner[29-31]is unquestionably considered the most complete and accurate experimental evaluation of a Mixed Reality system so far. Eighteen elementary steps of a maintenance procedure were used to design the testing session. Even if only six participations were recruited (among graduated students), quantitative and qualitative data have been wisely merged to infer conclusions on the real benefits of augmented reality in industrial environment. On the same direction, the extensive works by Schwerdtfeger[32-34]formally demonstrate the limitations of HMD based visualization by several user studies, either in laboratory conditions or real industrial scenarios. Wang and Dunston[35]used the NASA TaskLoad Index[36]to discuss the benefits of collaborative design through augmented reality. Smailagic et al.[37-39]introduce the VuMan project for rapid prototyping of Wearable Computers, focusing on comparisons of custom designs versus off-the-shelf.
The proposed work tries to address several important challenges supported by objective and subjective data analysis. Among many others, the design of cognitive models, managing input from multiple sensors, and foreseeing the user’s need are just a few examples of the issues they face. The studies mentioned above provide valuable insights on the usage of MR technologies in working contexts. On the other hand, the conclusions come from the observations of the behavior of a very small set of participants, which often collects casual users rather than experienced subjects. Experts in a specific field are generally more accustomed to standard or well-established intervention procedures. In turn, this could imply that opinions about a MR system by students/random users and experts do not necessarily agree. We believe that without involving the final target of users in the experimentation might reduce the chances of a negative bias in the evaluation but it also significantly reduces the value of the achieved results. With such an assumption in mind, we exploited the lessons learned from the state-of-the-art to select and design a comprehensive collection of quantitative and qualitative measurements. The final aim is to test the impact of MR-based maintenance in a real industrial scenario and involving real technicians to assess the maturity of the technology and its actual suitability to the chosen context.
3 System Architecture
The target environment selected for this study is an industrial rack that is part of a radar antenna control system[40]. There are two main reasons for this choice. On the one side, this kind of equipment is rich of small components (switches, screws, led indicators, connectors, etc.), some of which having dimensions of a few millimetres and often resulting in being positioned very close to each other. This scenario provides a visually challenging operating environment able to stress the MR guidance system. On the other side, a radar site represents a complex mission-critical system that is strictly structured in terms of engineering standards and operating procedures providing a useful reference for bench marking the proposed approach versus conventional computer-aided-training.
The whole test bed system developed for this study is schematically depicted in Fig.1.
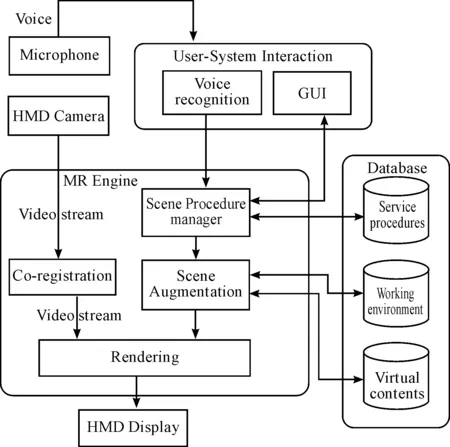
Fig.1Theoverallmixedrealitysystemarchitecture.Itshowsthemainsoftwarecomponentsofthesystem,whicharetheMRengine,theUIInterfaceandtheDatasets.TheMRengineisinchargeofalloperationsthatdealwithtrackingoftheuserandtheaugmentationofthescene,achievedviaARToolkit.TheinteractiontakesplacebyavocalcommandinterfacebyMicrosoftSpeechPlatform,whichallowstheuserfreetomoveintheworkingenvironment.Finally,thedatasetsstoreallmaintenanceproceduresandCAD-likerepresentationofthedevicestobeaugmentedtogetherwithall3Dvirtualtoolsandaids.
It consists of three main components. The Mixed Reality Engine (MRE) is devoted to users head tracking, scene augmentation/rendering and maintenance procedures management. The User System Interface captures users vocal commands and provides speech recognition and synthesis capabilities enabling hands-free interaction. It has been achieved by using the Microsoft Speech Platform*https://msdn.microsoft.com/en-us/library/office/hh361572(v=office.14).aspx., which provides a comprehensive set of development tools for managing the Speech Platform Runtime in voice-enabled applications. Features the ability to recognize spoken words (speech recognition) and to generate synthesized speech (text-to-speech or TTS) to enhance users’ interaction. The Maintenance Database is the main repository for the representation of the working environment, the graphics contents and the maintenance procedures.
The user is required to wear a video-based see-through HMD, and a backpack-contained PC, before the assisted servicing procedure could start.This solution was preferred to a tablet-based setup because of the average duration of a maintenance/repair procedure (holding the mobile device by hand for prolonged time would make the user experience particularly uncomfortable).The MR Engine has been developed under Quest 3D graphics programming environment including ARToolkit*https://www.hitl.washington.edu/artoolkit/., a well-known open source AR specific software library. The tracking system developed for the experimental study is based on optical markers for estimating the users’ head position and rotation by means of robust-planar-pose estimation algorithm[41]. More precisely, a multiple markers solution has been exploited, thus achieving a more robust and accurate tracking using reasonably smaller markers. Average user-(augmented)object distance, overall tracking volume, and camera’s focal length and resolution, represent important factors to be considered when designing markers configuration as many of them depend on the particular operating environment. To this regard, the test bed includes a set of six 44 cm sized markers (see Fig.2) provides an optimal tracking coverage of approximately 60×60×60 cm corresponding to an average co-registration error below 2 mm (at an average distance camera-to-markers of 50 cm). The marker set is easily scalable by adding other markers, which enlarge the tracking volume. In multi-marker tracking, the relative position of each marker refers to a known absolute reference system. The benefit of such a solution is that the approximated estimate of cameras position/orientation equally depends on all markers. However, the markers that are better detected and tracked reduce the overall co-registration error thanks to a strategy based on the weighted average of each of the contributions according to a reliability index specific to each marker and to the number of recognized markers. Typically, even a small error in estimating the rotational component of camera-based tracking may possibly cause a co-registration error (a visible misalignment between virtual and real) as the distance from the tracked point increases. For this reason, the origin of the absolute reference system (respect to which the position of any virtual content is expressed) is deliberately located in the geometric center of the marker-set. Additionally, a Kalman filter[42]is also applied to smooth out raw tracking data, contributing to further reduce tracking noise. Finally, a specific graphical interface enables to manually compensate small misalignments possibly due to mechanical attachment of see-through camera onto the HMD. Each of the six degrees of freedom and other camera parameters can be manually fine-tuned.
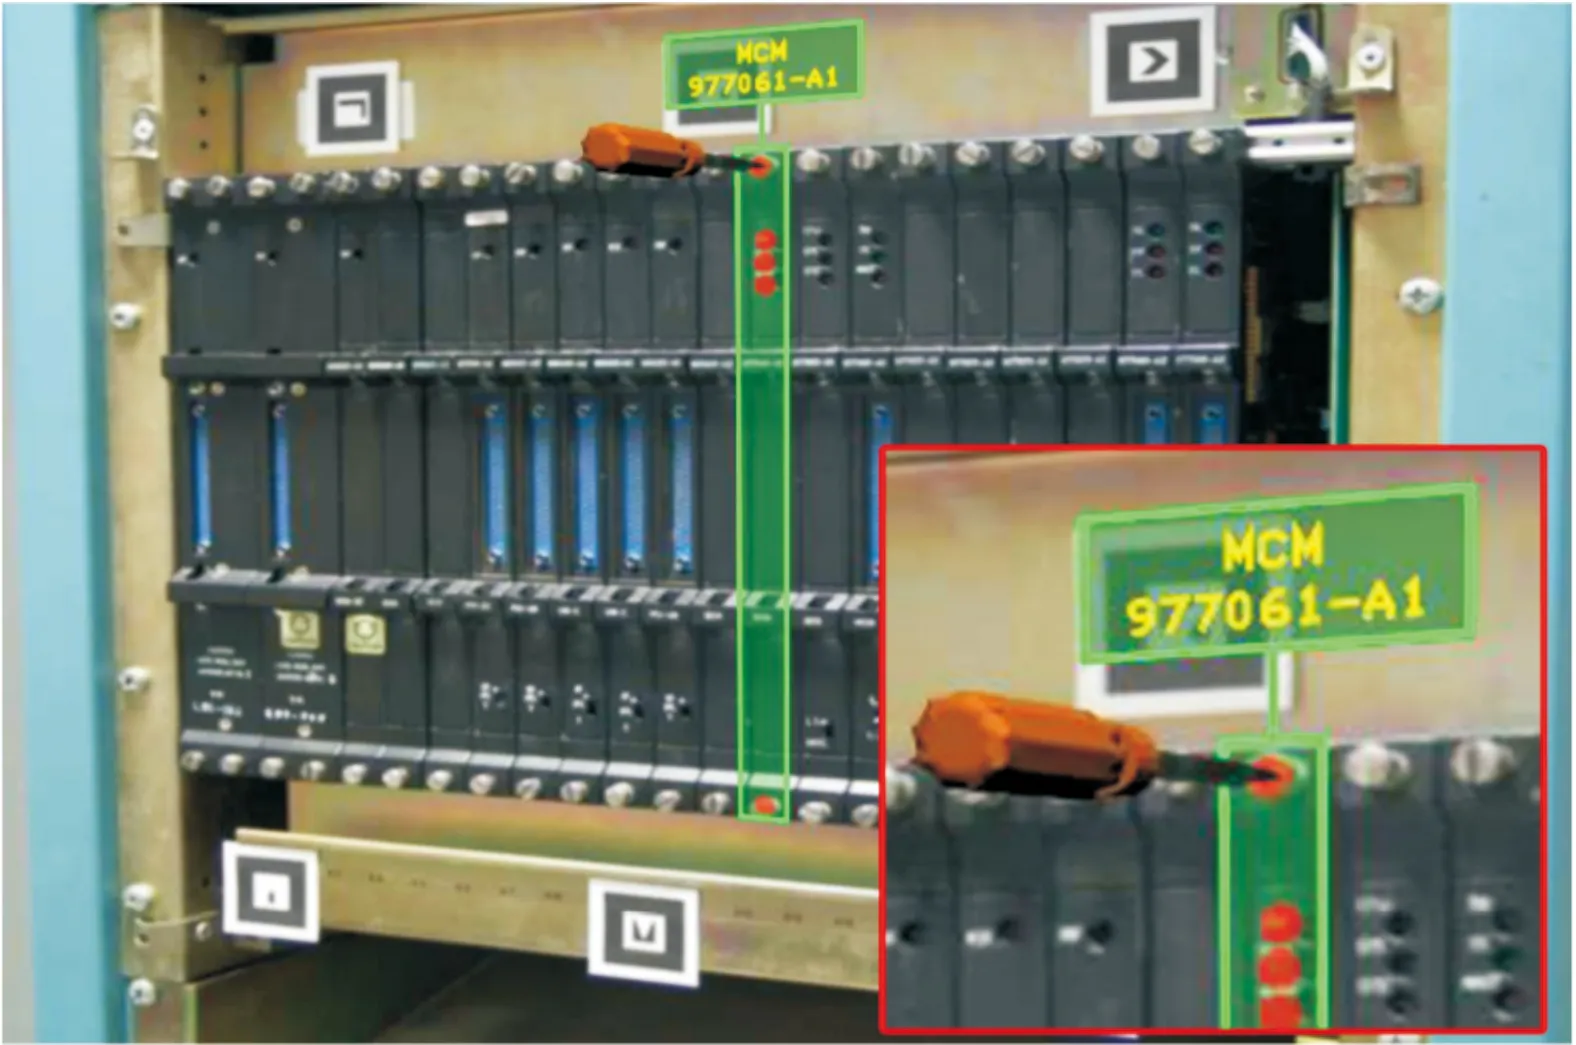
Fig.2Arackcontainingmanyelectronicboardsaugmentedbymeansoftextlabelsandvirtualtools.Theinsetimageshowsamagnifiedviewofthevisualaids,highlightingthesmallamountofco-registrationerror.
Scene augmentation is achieved thanks to a formal representation of both real environment and graphics asset based on XML. An XML database has been built indeed, consisting of a collection of files which contain spatial info to accurately locate each physical object of the working environment within the co-registered 3D space. More in detail, an environment description file stores the three-dimensional position of any equipment (e.g. an industrial rack) and all of the related components (e.g. the devices contained in the rack) by associating specific tags. Similarly, for any single device, a specific description file contains a list of all the relevant features associated to it (e.g. connectors, screws, switches, warning lights, etc). Based on these descriptors, the MR engine, assembles a virtual scene via a DOM XML parser. Xpath language is used to query the application database to retrieve the required data. The MR engine also performs another important task, besides scene augmentation: it handles maintenance procedures, by representing each of them as a deterministic finite automaton (DFA). Through this approach, each maintenance step is represented by a particular state, while its connections define the execution order. The DFA results are particularly suitable for modeling both simple and complex maintenance procedures in a simple, readable and verifiable way. The DFA representation of a particular procedure is converted to a XML file (compliant to S1000D standard[43]) where the tags define the states of the automaton. Any possible path through the automaton defines a procedure file. By this method, a single XML procedure file defines a particular execution order in a particular maintenance procedure. At runtime, this file is progressively parsed, and in every moment the user can switch to the next or previous task by means of the vocal interface.
The hardware used in our test bed includes a laptop PC, powered by an Intel I7 processor and Nvidia GeForce 9 series graphics board and a Silicon Micro ST1080 HMD, equipped with two 19201080 native LCD displays. A Logitech C910 webcam, mounted on the HMD, captures the surrounding environment at 640800 pixels to keep the processing time reasonably low to achieve a minimum frame rate of 30 fps. The camera was mounted over the headset in a central position aligned with the users’ sight axis.
4 User Study
Mixed Reality can be means of enhancing, motivating and stimulating learners’ understanding of certain events[44,45]. This is particularly true if assuming a high control of known drawbacks like the resolution of the augmented contents, the field of view of the visualization device, the weight of the HMD and so on. In fact, they have an impact on the usability as well as on the user’s performance and understanding of the scene[46].
Compared to other fields of research, in AR/MR environments no common guidelines exist to objectively assess the benefits and the performance of users while using the application. The study by Kim in 2012[28]shows how much significantly varies the amount of papers in the literature among those that deal with the issues of AR/MR in different fields (e.g., education, tourism, industrial and so on). According to that survey, the percentage of papers in 2011 that propose a formal analysis with a number of users greater than 24 reaches only 16.4% (the survey remarks that, according to the central limit theorem, a population is statistically enough large when its size is above 30 subjects). To the best of our knowledge, the trend remained unchanged over the recent years with only few examples in the literature[47]. Moreover, restricting the research to the papers in the literature that propose the use of augmented reality in industrial fields, the percentage mentioned above drops off dramatically. Table 1 lists some of the papers in the literature that deal with issues to be generally addressed in industrial fields. As we can see, when the domain experts are involved in the experimentations (marked with label users in the Participant column), the evaluation results are collected and discussed with limited details. Often, like reported in the work by Schwald et al.[48]and by Comport et al.[15](first two rows in the table), the analysis is solely focused on tracking accuracy and robustness ignoring human and/or cognitive/physical aspects that play a significant role when human users are involved.
As anticipated in the introduction, this study aims at formally analyzing both the feasibility and the limitations of MR applied in industrial fields, with a specific focus on the maintenance and training. We compared our MR framework with the most diffused way of performing maintenance, i.e. consulting electronic technical manuals. We focused the research on engineers in the field of naval and land systems. The recruitment of participants was carried out with the goal of selecting both specialized technicians and not. A preliminary interview with each participant took place to assess the level of confidence with the topics and the applications of Augmented Reality. In such a way, we were able to deliberately discard experienced engineers from the testing sample, thus arriving at the selection of forty participants (including novices and trained technicians) representing the target of users for the proposed system. When dealing with comparative testing, it is arather common improved performance by the same user in treatments following the first one, independently from the difficulties of this last one and or it treatments are similar or not. Known as memory-effect, this condition has impacts on the significance of the data. We therefore divided the samples into two distinct and uniformly distributed populations of users, of twenty subjects each. The first group was involved in MR treatment while the second one was asked to accomplish the maintenance procedure by using a digital version of a classic instruction manual. A NASA TLX (Task Load IndeX) questionnaire completed and concluded the testing session. It was common at all participants in both groups and was used to collect further feedback on effort and acceptability of the prototype system.
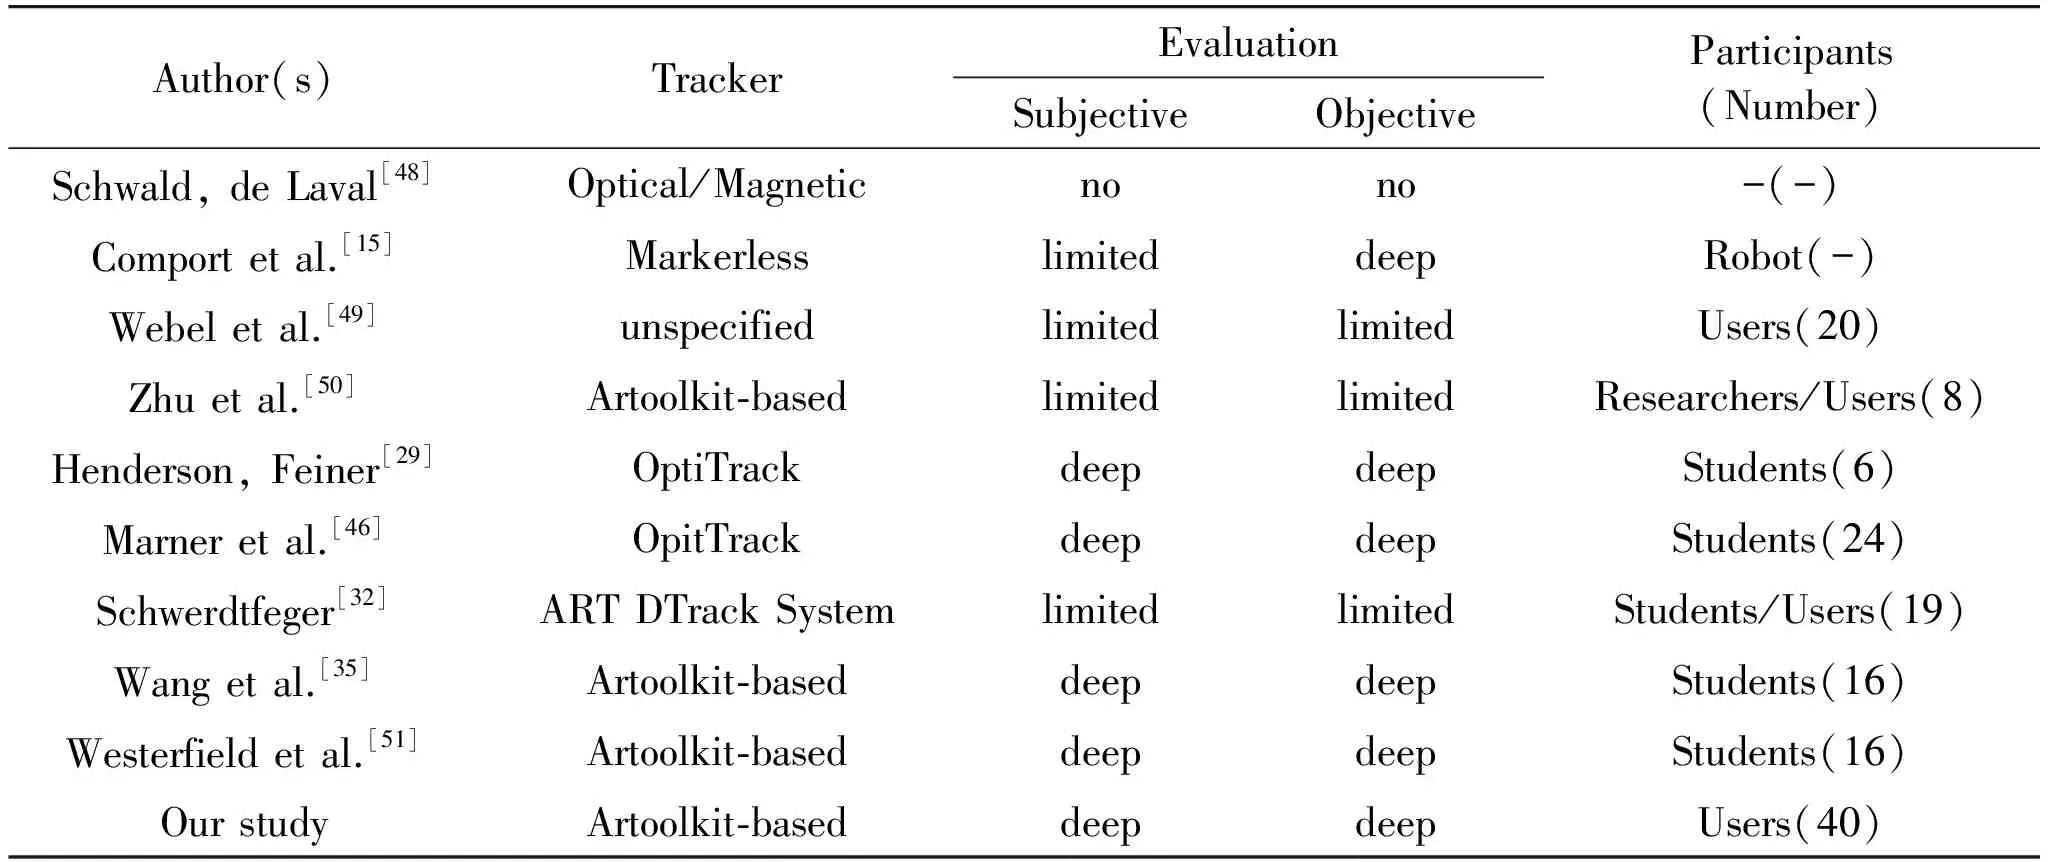
Table 1 Augmented Reality systems to maintenance tasks. A comparison of the comprehensiveness of the proposed evaluation.
4.1 Task
In order to achieve the most reliable evaluation of the MR system, the sequence of steps used in the experimentation consisted of a collection of simple maintenance tasks, common to a broad range of maintenance procedures. Twelve basic tasks composed of the testing procedures are summarized in Table 2. The order of the steps has not been correlated to any specific maintenance procedure, rather it represents a random sequence of operations. In other words, we avoided to use any known maintenance procedure which could determine a gap in performances by novices and trained participants. Most of the recruited participants have no significant knowledge and practice with augmented reality systems, but there were all engineers in the field of maintenance. Choosing a random sequence ensured that no memory effects could affect the statistical significance of the results. The industrial rack used during the experimentation is shown in Fig.3. The figure also reports the points of interest, which are numbered in accordance to the steps of the testing sequence. The same procedure was used in both treatments thus achieving a fair comparison and making the analysis of the data easier.
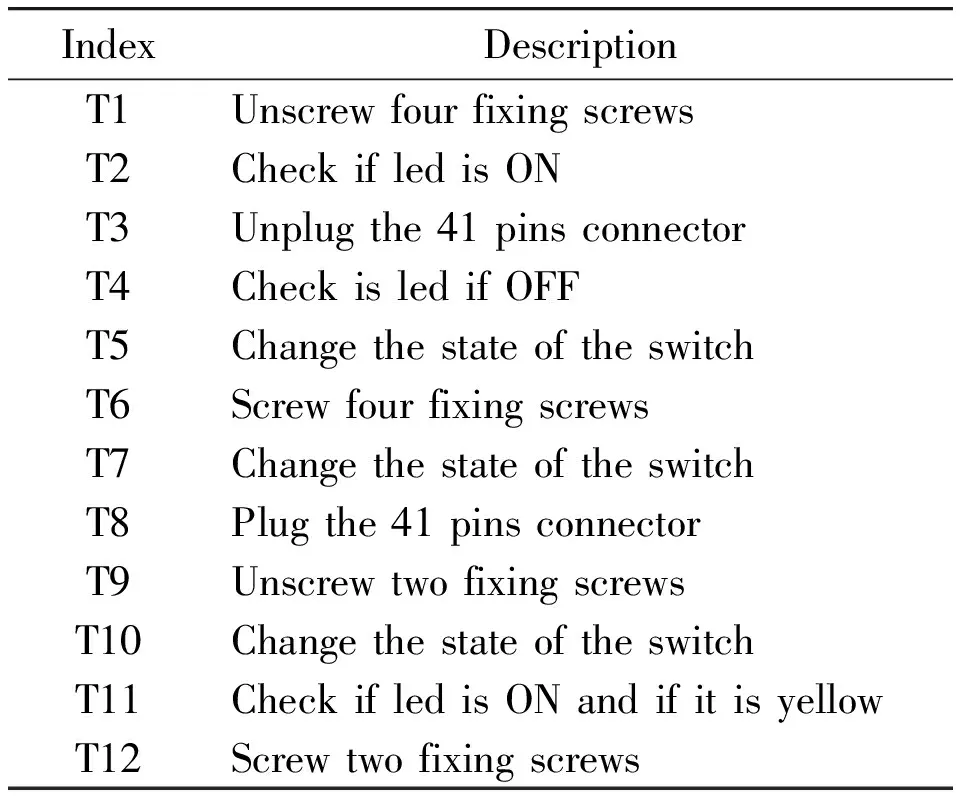
Table 2 The sequence of elementary tasks of the maintenance procedure used for testing.
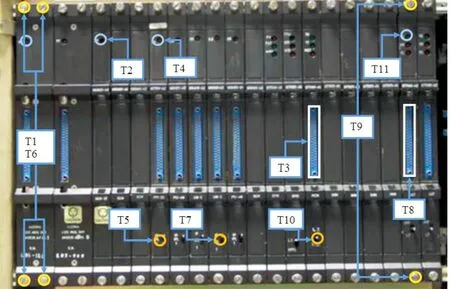
Fig.3 Front panel of the rack involved in the experiments. Each label shows the point of interest of the corresponding task.
4.2 Experiments
The experiments consisted of two different treatments designed to take place in a real industrial environment, including all the involved external factors.
For the sake of brevity, hereinafter MR (mixed reality) will refer to treatment in mixed reality and TM (technical manual) will refer to the other treatment. In MR the participants worn the HDM and benefit from an augmented view of the scene by means of labels, graphics and virtual tools. In TM, the participants were asked to perform the procedure by using a digital version of a paper manual. The step-by-step instructions of the testing sequence in Table 2 were displayed on a monitor beside the working area. Although the testing procedure was the same in both treatments, we took into account the wide disparity among the two visualization systems and the presentation of the actions to perform. Therefore, we designed the contents shown on the supporting monitor in TM treatment with a layout similar to that in the MR treatment (see Fig.4).
4.3 Testing methodology
Once the participants were recruited and the testing procedure was defined, we planned the design of the trials of each testing session in both treatments and how to record data during the session to be statistically analyzed later.
The experimental session has been divided into four main stages.
(1) Introduction
Before starting the testing session, all participants in both treatments were informed about the purpose of the testing and the challenges. Of course, any significant information was provided on how data should have been collected during the experiment. This precautionary measure was taken to avoid that the participants could stress their performance thus impacting on the reliability of the final results.
(2) Training
After introducing the goal of the experimentation, all participants were invited to get familiar with the device they were facing. In MR treatment, the subjects were asked to wear the HMD and earphones. Some trials followed to assess the proper working of the system. In TM treatment, the participants were asked to wear a cap equipped with the same camera used for tracking in MR treatment. This has been done to ensure a fair analysis of movements between these two treatments. In both cases, the subjects were allowed free to examine the industrial rack and they were asked to perform a trial maintenance step, which was not correlated to the testing sequence of steps.
(3) Experiment
The testing session started. In each session, two types of data were collected: 6DOF data from the head tracking and the time of completion of the procedure. During the testing session, the users were free to interact in any direction and from any perspective view. They were standing in front of the rack all the time. In both treatments, a synthesized speech accompanied each task. All participants were left on their own during the time to complete the testing procedure and no support was provided. Their behavior during the experiment was observed from a distance.
(4) Questionnaire
The last stage of the experimentation consisted in an interview. The subjects were asked to fill in a form containing the NASA TLX indices in form of a questionnaire. In addition, doubts or recommendations to improve the system by all participants were recorded. This last information, together with the statistical analysis of NASA ratings, were also considered to further deepen the analysis of users’ perception of the system in these two different experiments.
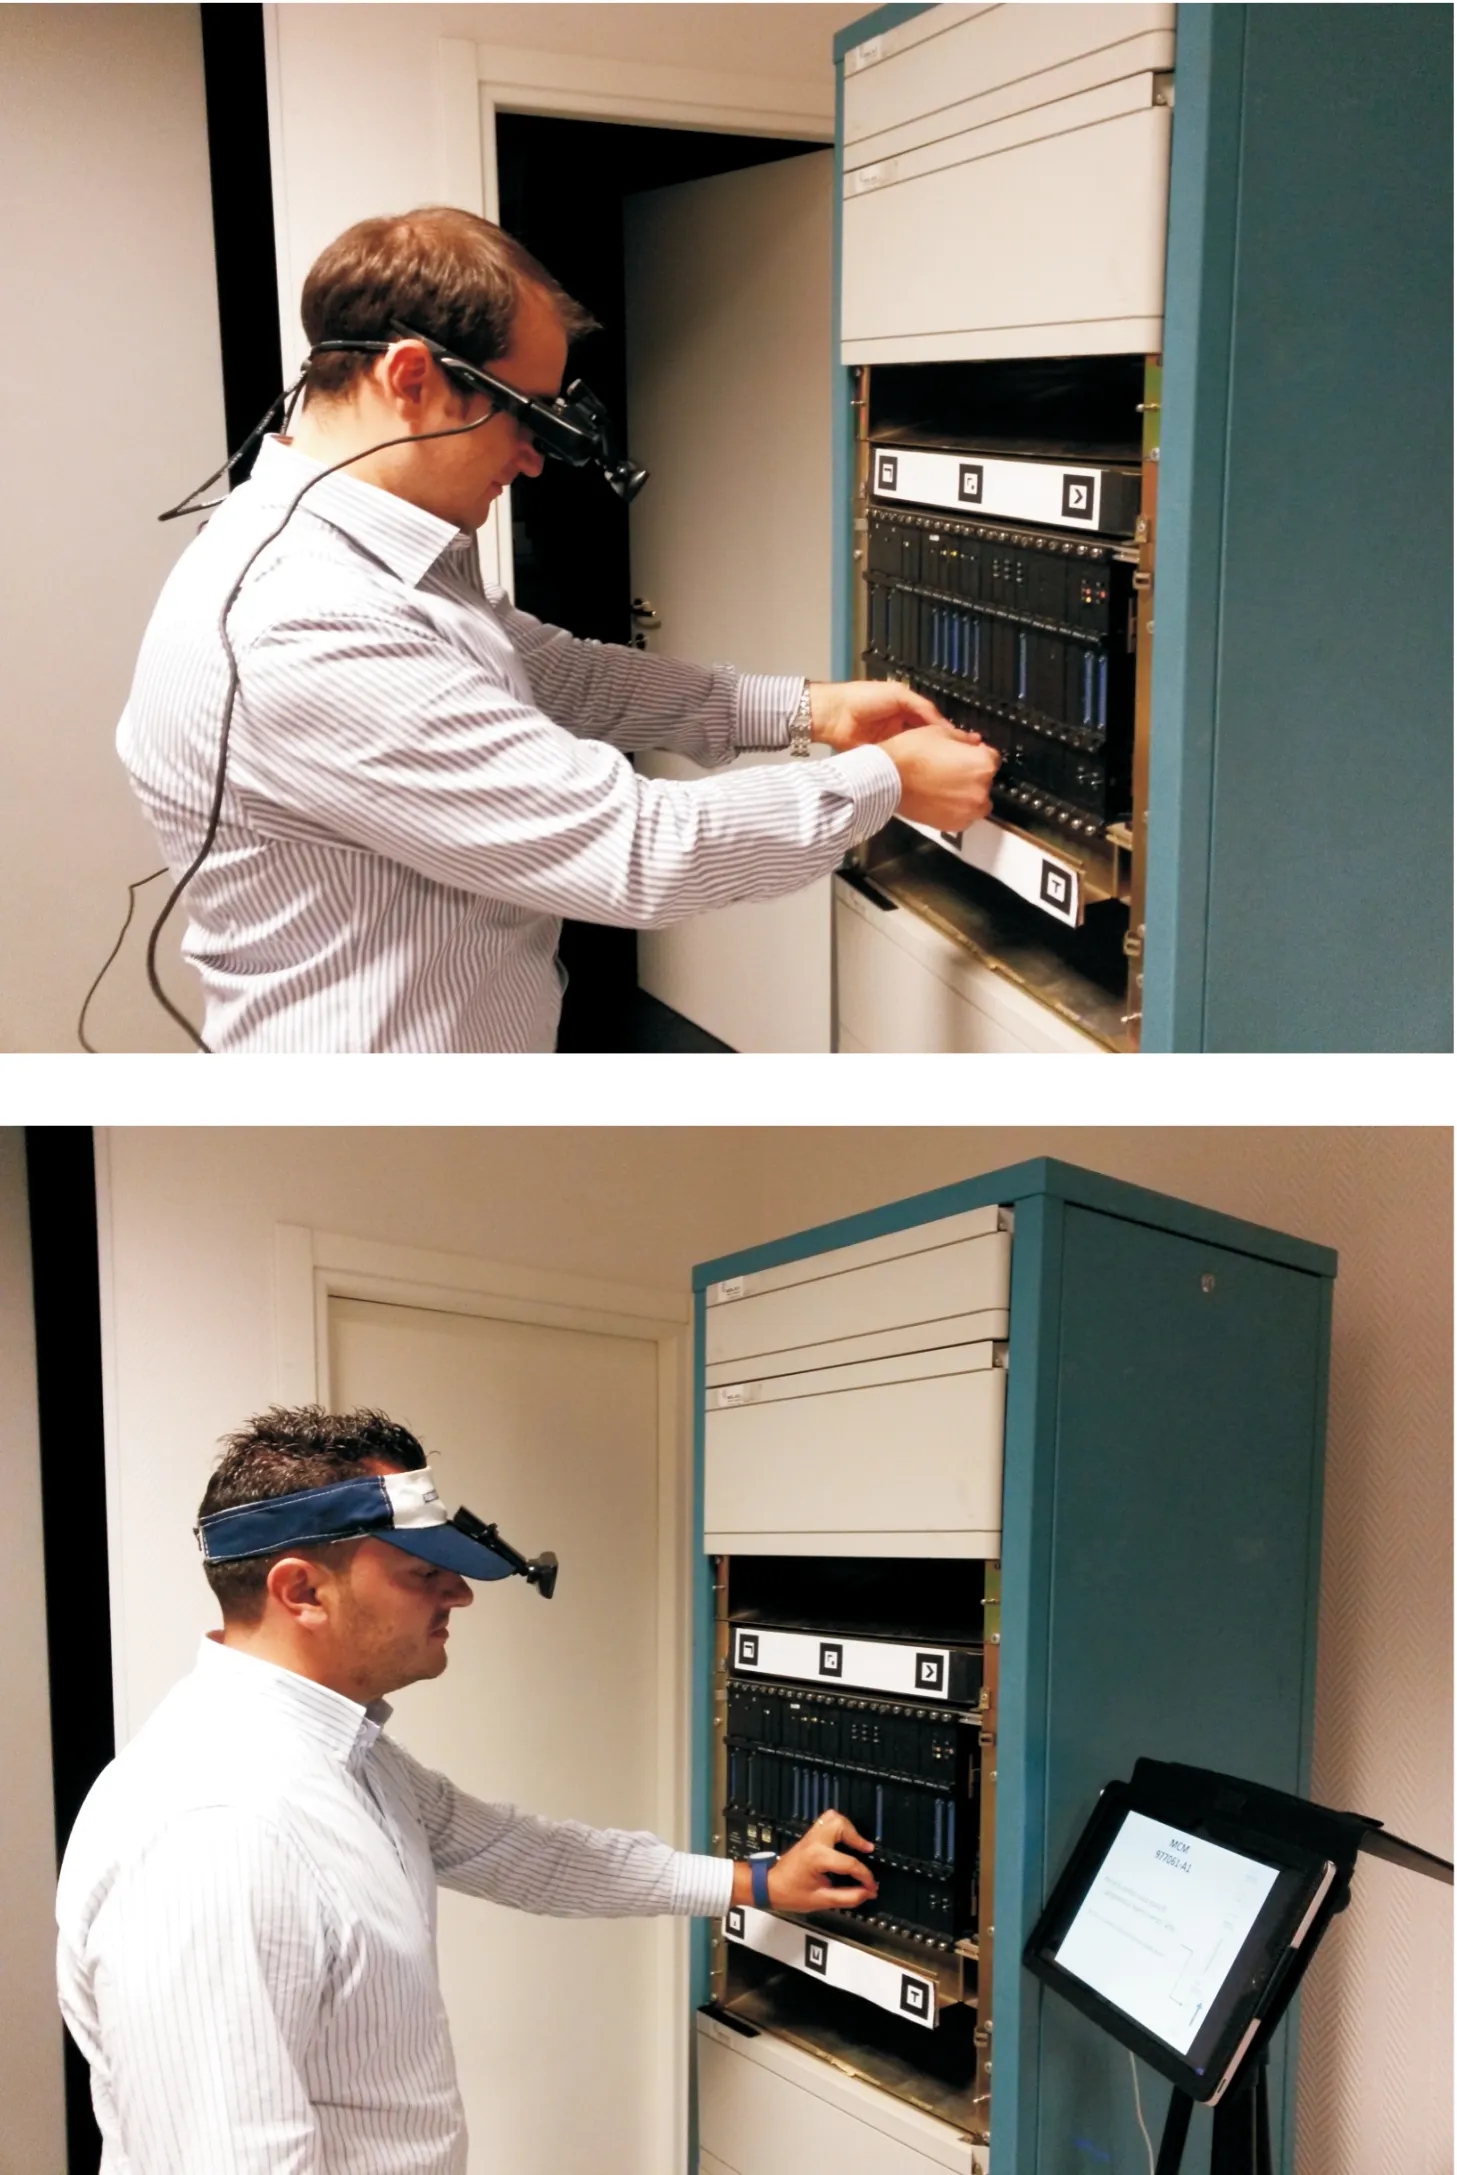
Fig.4 Two participants during the testing session in MR treatment (left) and in TM treatment (right).
5 Analysis and Discussion of Results
5.1 Post-processing
Once the testing sessions were completed, we post processed the tracking data to make possible a fair statistical comparison. The post processing consisted in a filtering of the data to remove the effects on the unexpected events, which are detailed below. The filtered data are then normalized to make them comparable.
The following lines briefly report the most relevant issues arisen during the experiments and the adopted countermeasures. As discussed in section 3, common RGB cameras acquiring at 30 fps (frame per second) have been exploited. Although such a refresh rate suits the expectations of several uses, it is insufficient when dealing with fast and quick 3D movements of user’s head, particularly for pitch and yaw rotations. What happens in such conditions is an intense interpolation among successive frames acquired from the camera sensor which is responsible for a strong blurring in the video stream. The smoothed edge of the acquired frame significantly compromises the detection and tracking of the markers in the scene. To cope with that, all tracking failures were annotated and analyzed later. By the observation of users’ movement records, however, the class of tracking failures related to frame interpolation was populated by tracking losses below 0.5 seconds in time. In such cases, a linear interpolation is suitable enough to restore the continuity of the motion curves. Less frequently, more prolonged tracking failures occurred, varying from few seconds up to 15 seconds with isolated point of tracking success. This happened when users, being free to move during the testing session, pushed the tracking system to its limits with the view axis almost tangential to the marker surface. Although rarely happened, the presence of such gaps in motion curves has been compensated by the valid tracking points that were used as anchor for a spline interpolation to get an approximation of the original curves. A typical Kalman filter[42], working in background during, was also used to predict the users’ movements and therefore to compensate the erroneous cases when occurred.
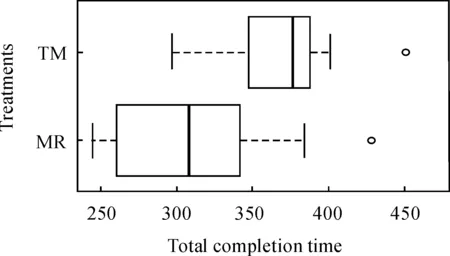
Fig.5 Time spent in seconds to complete the maintenance sequence in MR and TM treatments.
In a considerably high number of instances, vocal commands have been a source of trouble for the users. In many cases the users did not pronounce the commands loud thus making necessary to repeat one or two (and sometimes even more) times the same command to go forward in the testing procedure. In other (rare) cases, the participant forgot the vocal command to pronounce. Naturally, these conditions affected both the motion curves and the time of completion of the particular task. Since this work is not focused on specific usability issues of human-computer interfaces, we filtered out the impact of such conditions from the data.
Similarly, in few cases, an external support has been provided to the participants. The testing platform assumed that the subjects involved in the experiment should not receive any help or advice. However, some participants let the screwdriver drop while trying to interact with screws. In such cases, the tool was collected from the ground on behalf of the participant. In order to remain consistent with the experimentation, the effect of such a condition on motion curves and time was removed when occurred.
Finally, it is worth remarking that after data filtering and normalization, one outlier per treatment was detected and removed from the samples. This means that the analysis has been carried out on a sample size of 38 participants (19 subjects per treatment).
5.2 Time of completion
Time completion per each step of the testing maintenance procedure was recorded in both treatments. The data has been analyzed by using a two tailed Student test on the total completion time. The distribution of the populations in both treatments was normal (Shapiro-Wilk test[52],p-valuewas 0.1003 in MR and 0.1741 in TM).
To test the total completion times, the null hypothesis is: H0a, the difference in terms of time of completion in MR and TM treatments is not statistically significant.
The null hypothesis was discarder withp= 0.0001 when the total time of completion was considered (|T0|=|-4.3407| >T(0.025,36)=2.0281,p=0.0001),thus confirming the significance of the two average times of completion.
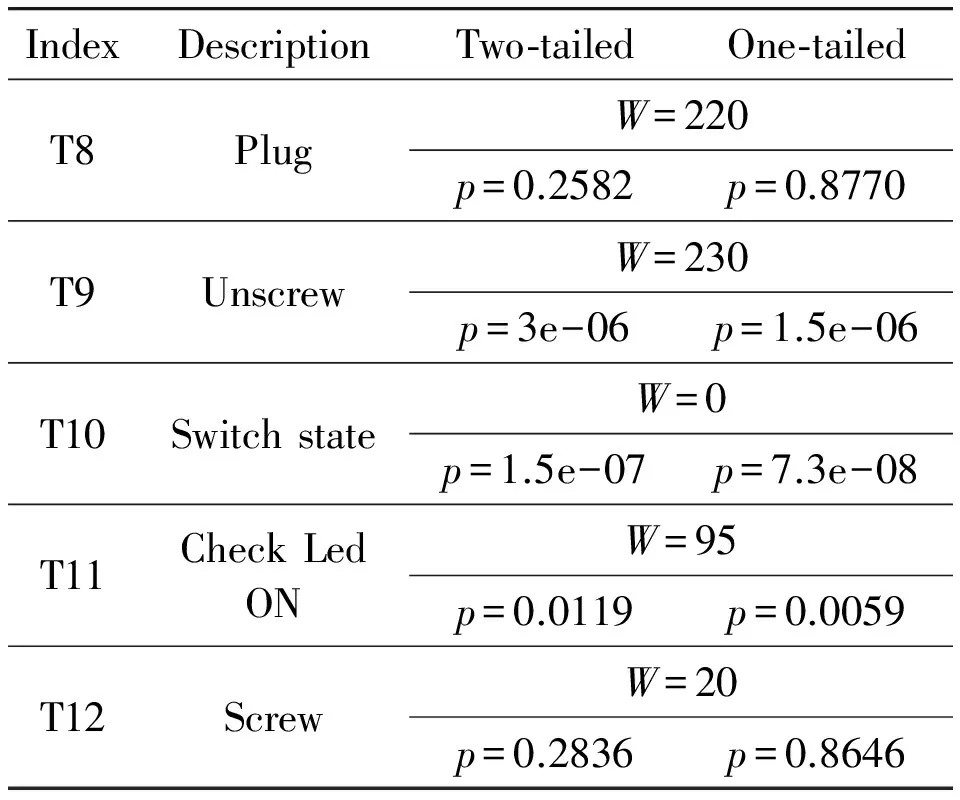
Although from an overall viewpoint, the statistical results confirmed the evident shorter time to complete the procedure in MR (see the boxplot in Fig.5), a deeper analysis was carried out on single tasks. The aim was to infer further considerations about the difficulties of some tasks that led to a waste of time in MR treatment (see section 5 for details). The tasks of the testing procedure do not require the same level of interaction, e.g., detecting a led and checking if it is on or off is clearly easier than using a screwdriver to tighten a screw. In fact, many participants in MR experienced a feeling of frustration when they were asked to use the screwdriver. Table 3 reports on a compact but exhaustive form the results of the statistical analysis carried out on time of completion per single task in both treatments (most of the data was not normally distributed, thus the Mann-Whitney test[53]was used). Looking closely, there is a correspondence for two-tailed test and one-tailed version per single task (H0b: the mean completion times in MR is significantly less than that in TM). Such a result confirms that the subjects in MR reported a mean time of completion shorter than in TM. This is particular true for task T10 for which all the participants in MR completed the task earlier than all subjects in TM (a value ofW= 0). Rows in gray in Table 3 highlight the tasks for which the test failed, accepting the null hypothesis H0a. Observing the tasks, each one of them required a kind of interaction which was affected by the vision through the HDM in MR. The reliability of this result has been also confirmed by the conclusion inferred from the interviews (reported in section 5.6). Reasonable causes for such hardware-dependent problems can be identified in:
(1) The limited field of view and resolution of the webcam;
(2) The lack of experience with MR environments;
(3) The limited perception of the distance related to the lack of stereoscopic vision.
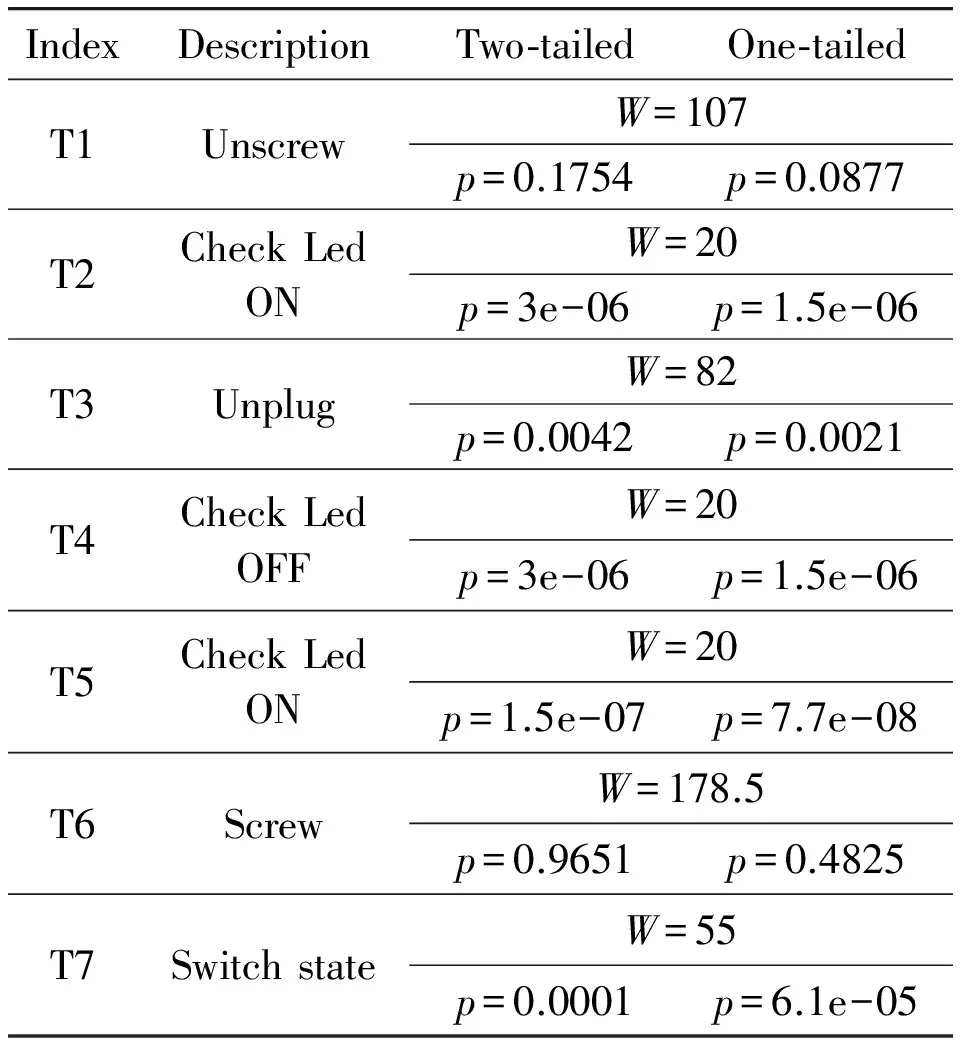
Table 3 Analysis of the time of completion per single task of the testing procedure.
Continue table 3
5.3 Motion analysis
In both treatments, the participants were standing in front of the industrial rack all the time. However, they could also move in any direction and were free to perform each task of the procedure as they preferred letting them to complete the procedure as much comfortably as possible. This decision had indeed a significant impact on the continuity of the tracking data curves (as discussed in section 5.1). Once tracking data are filtered and normalized, we analyzed the motion curves of translation and rotation to infer the conclusions on the behavior of the subjects in both treatments.
Referring to translational data, the plot in Fig.6 provides a compact overview of the users’ head movements for the XYZ axes separately in MR (on the left) and TM treatment (on the right). The curve in black represents the mean movement computed on motion curves of all subjects in the testing sessions. Comparing each couple of mean curves per single axis, it can be noticed that significantly wide sideways movements have been observed in TM compared to MR on X-axis. The subjects in the TM treatment exhibited a more uncontrolled behavior which can be explained by the need of consulting the digital manual in TM treatment placed beside the rack. The evidence of such a result is also confirmed by the difference in a standard deviation of MR (equal to 8.21) and in TM (equal to 12.86).
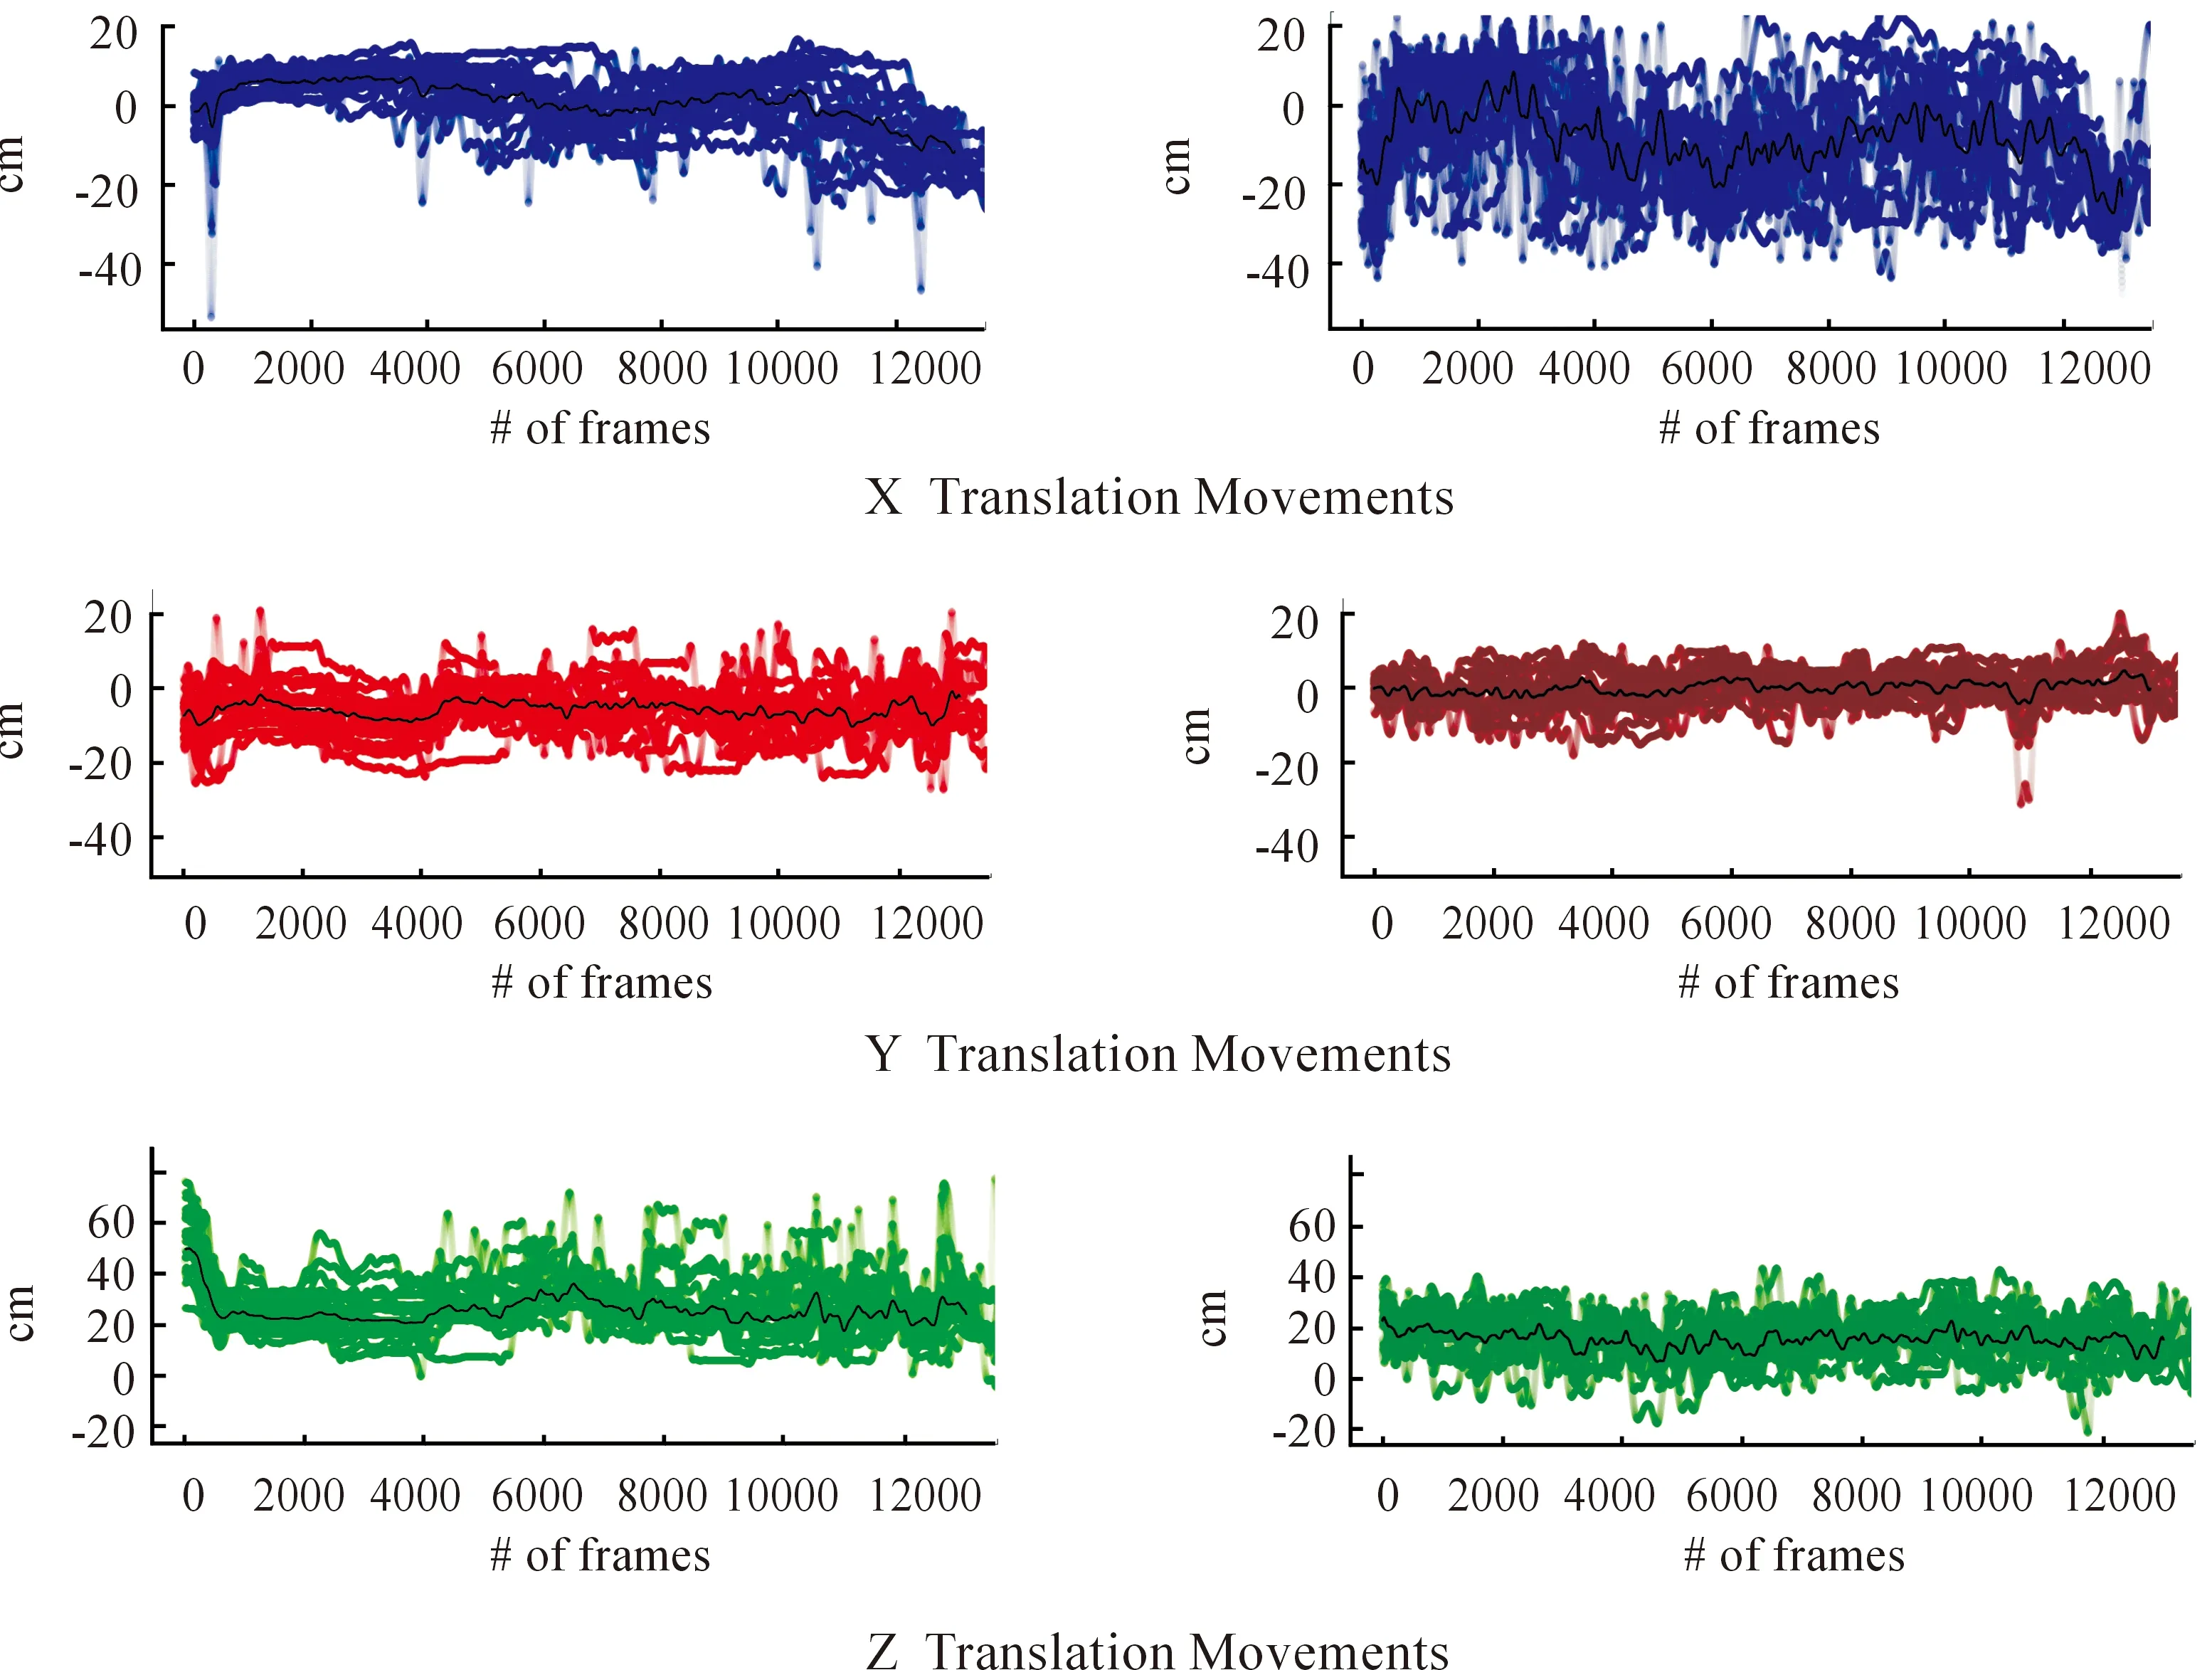
Fig.6 From top to bottom, the motion curves of all subjects in both treatments on XYZ translational axes. For each row of plots, the MR treatment is on the left and the TM on the right. Position points are in centimeters.
The movements on Y-axis have been preventively normalized considering the difference of the subjects in height. The behaviors are totally comparable if considering the mean movements in both treatments. Such a result was expected since the participants were not asked to kneel down in any action needed to perform the testing procedure. A mean standard deviation in MR equals to 5.30, which is slightly higher than that (4.16) in TM(being 1.27 times higher in MR compared to TM).
Similarly, backward and forward movements on Z axis achieved comparable results in both treatments. On average, the subjects in TM were again more stationary than in MR (standard deviation for MR is 1.24 times that of TM, being equal to 9.40 and 7.52 in MR and TM respectively). Reasonably, the implication of such differences for Y and Z axis is related to the limited field of view (FOV) of the HMD worn by subjects in MR. Subjects in TM, who could account on naturally wide FOV of human eyes, were allowed to look at the entire rack without movements.
Translational motion curves enable to infer conclusions on the effort and the physical load needed to complete a task. Conversely, the sole analysis of the rotational movements of the users’ head is not as significant as the translational ones. It is not sufficient to estimate the focus of the attention during the testing sessions. However, the combination of translational and rotational movements can be effectively used to such a goal. By merging the movements curve by both rotation and translation, we achieved a good approximation of the users’ focus during the experiment. Of course, the analysis of the focus is not as accurate as the one obtained by using an eye-tracker. However, according to the goals of the proposed work, this approach has been proved to be meaningful to the case study considered. Fig.7 provides a unified plot showing the area of rack surface observed during the experimental trials in MR and TM treatment. In MR treatment (on the left in figure), we observe the presence of dense and compact areas where the attention was concentrated. On the other side, in TM, we can observe a very confused and widespread behavior with extreme and re-iterated movements beyond the working area. This last one is a direct (and expected) consequence of using the digital manual showing the maintenance steps placed beside the rack. Even ignoring such a component from the acquired data, it remains a strong and broad concentration of points that can be explained in the attempt of subjects in TM of looking for the proper intervention point on rack.

Fig.7 Mean observed point during the maintenance procedure in MR treatment (left) and in TM treatment (right). The behavior by subjects in MR is well confined in the servicing region on the rack, while participants’ in TM treatment exhibited a significantly more confused behavior with ample motions on the X axis. Data has been preventively normalized.
The observations drawn from the analysis of translational and rotational movements serve as a basis of discussion to introduce the analysis of movements: velocity and the estimated length of the path of attention covered during the interaction with the rack in the compared treatments (which are presented in next sections 5.4 and 5.5). They in turn can be used to discuss the mental and physical demand of the testing session to finally assess the effects of mixed reality approaches to maintenance.
5.4 Velocity analysis
The analysis of translation and rotation movements was useful to compare and infer considerations about the attitude of all participants in both kind of experimental trials. Indeed, to properly draw conclusions on physical and mental demand, the analysis of velocity of movements becomes crucial. It allows in fact to achieve more meaningful results, especially as time to complete the testing procedure goes by. Linear and angular velocity have been estimated by matching the space travelled with the time of completion of each step of the testing procedure. In Fig.8, the density plots have been used to visually grab the significance of the peaks (and the distribution around them) in mean velocity in both treatments per each translation and rotation axis. In most of the cases, it can be seen a mean value of velocity in MR significantly shorter than in TM. Only for Y-axis translation velocity and pitch rotation velocity, the peaks are almost similar to each other in both treatments. Two-tailed Student-test per pair of observations was performed to evaluate the statistical significance for such differences.
The null hypothesis can be formulated as follows: H0c, the difference in mean velocity between MR and TM treatments is not statistically significant.
As anticipated for velocity on Y-axis translation and pitch rotation, the insignificance of the means is confirmed by the statistical test. In fact, the null hypothesis is accepted for Y-axis velocity withp=0.4903 (T0=| -0.6969|<2.0281*The t-distribution with α=0.05 and 36 as degree of freedom, that is T(0.025,36).) and for pitch rotation velocity withp=0.2610 (T0=|1.1419|<2.0281). The response of the statistical test again confirmed the motivations made in section 5.3 about Y and Z movements. Participants were not asked to kneel down during the testing sessions. Rather, they stayed all the time in front of the rack thus limiting the need of wide and quick movements along the Y axis. About the pitch velocity, the MR treatment gave the participants an immediate way of localizing the points of interest making negligible the amount of pitch rotations of the head needed. On the other side but with a different explanation, the wider FOV of human eyes allowed participants in TM to locate the point of intervention without rotating the head but just moving the eyes.
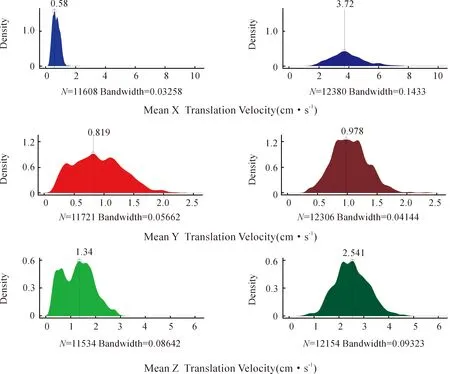
Fig.8 Mean velocity of movement in both treatments (from left to right for MR treatment and TM treatment) in form of density plot. Significant differences in mean are observed in translational velocity on X-axis. N indicates the number of samples representing the frames where the data could be collected. The bandwidth is a function of the density itself, computed by the density estimator, whose value indicates the optimal approximation of the distribution of the data.
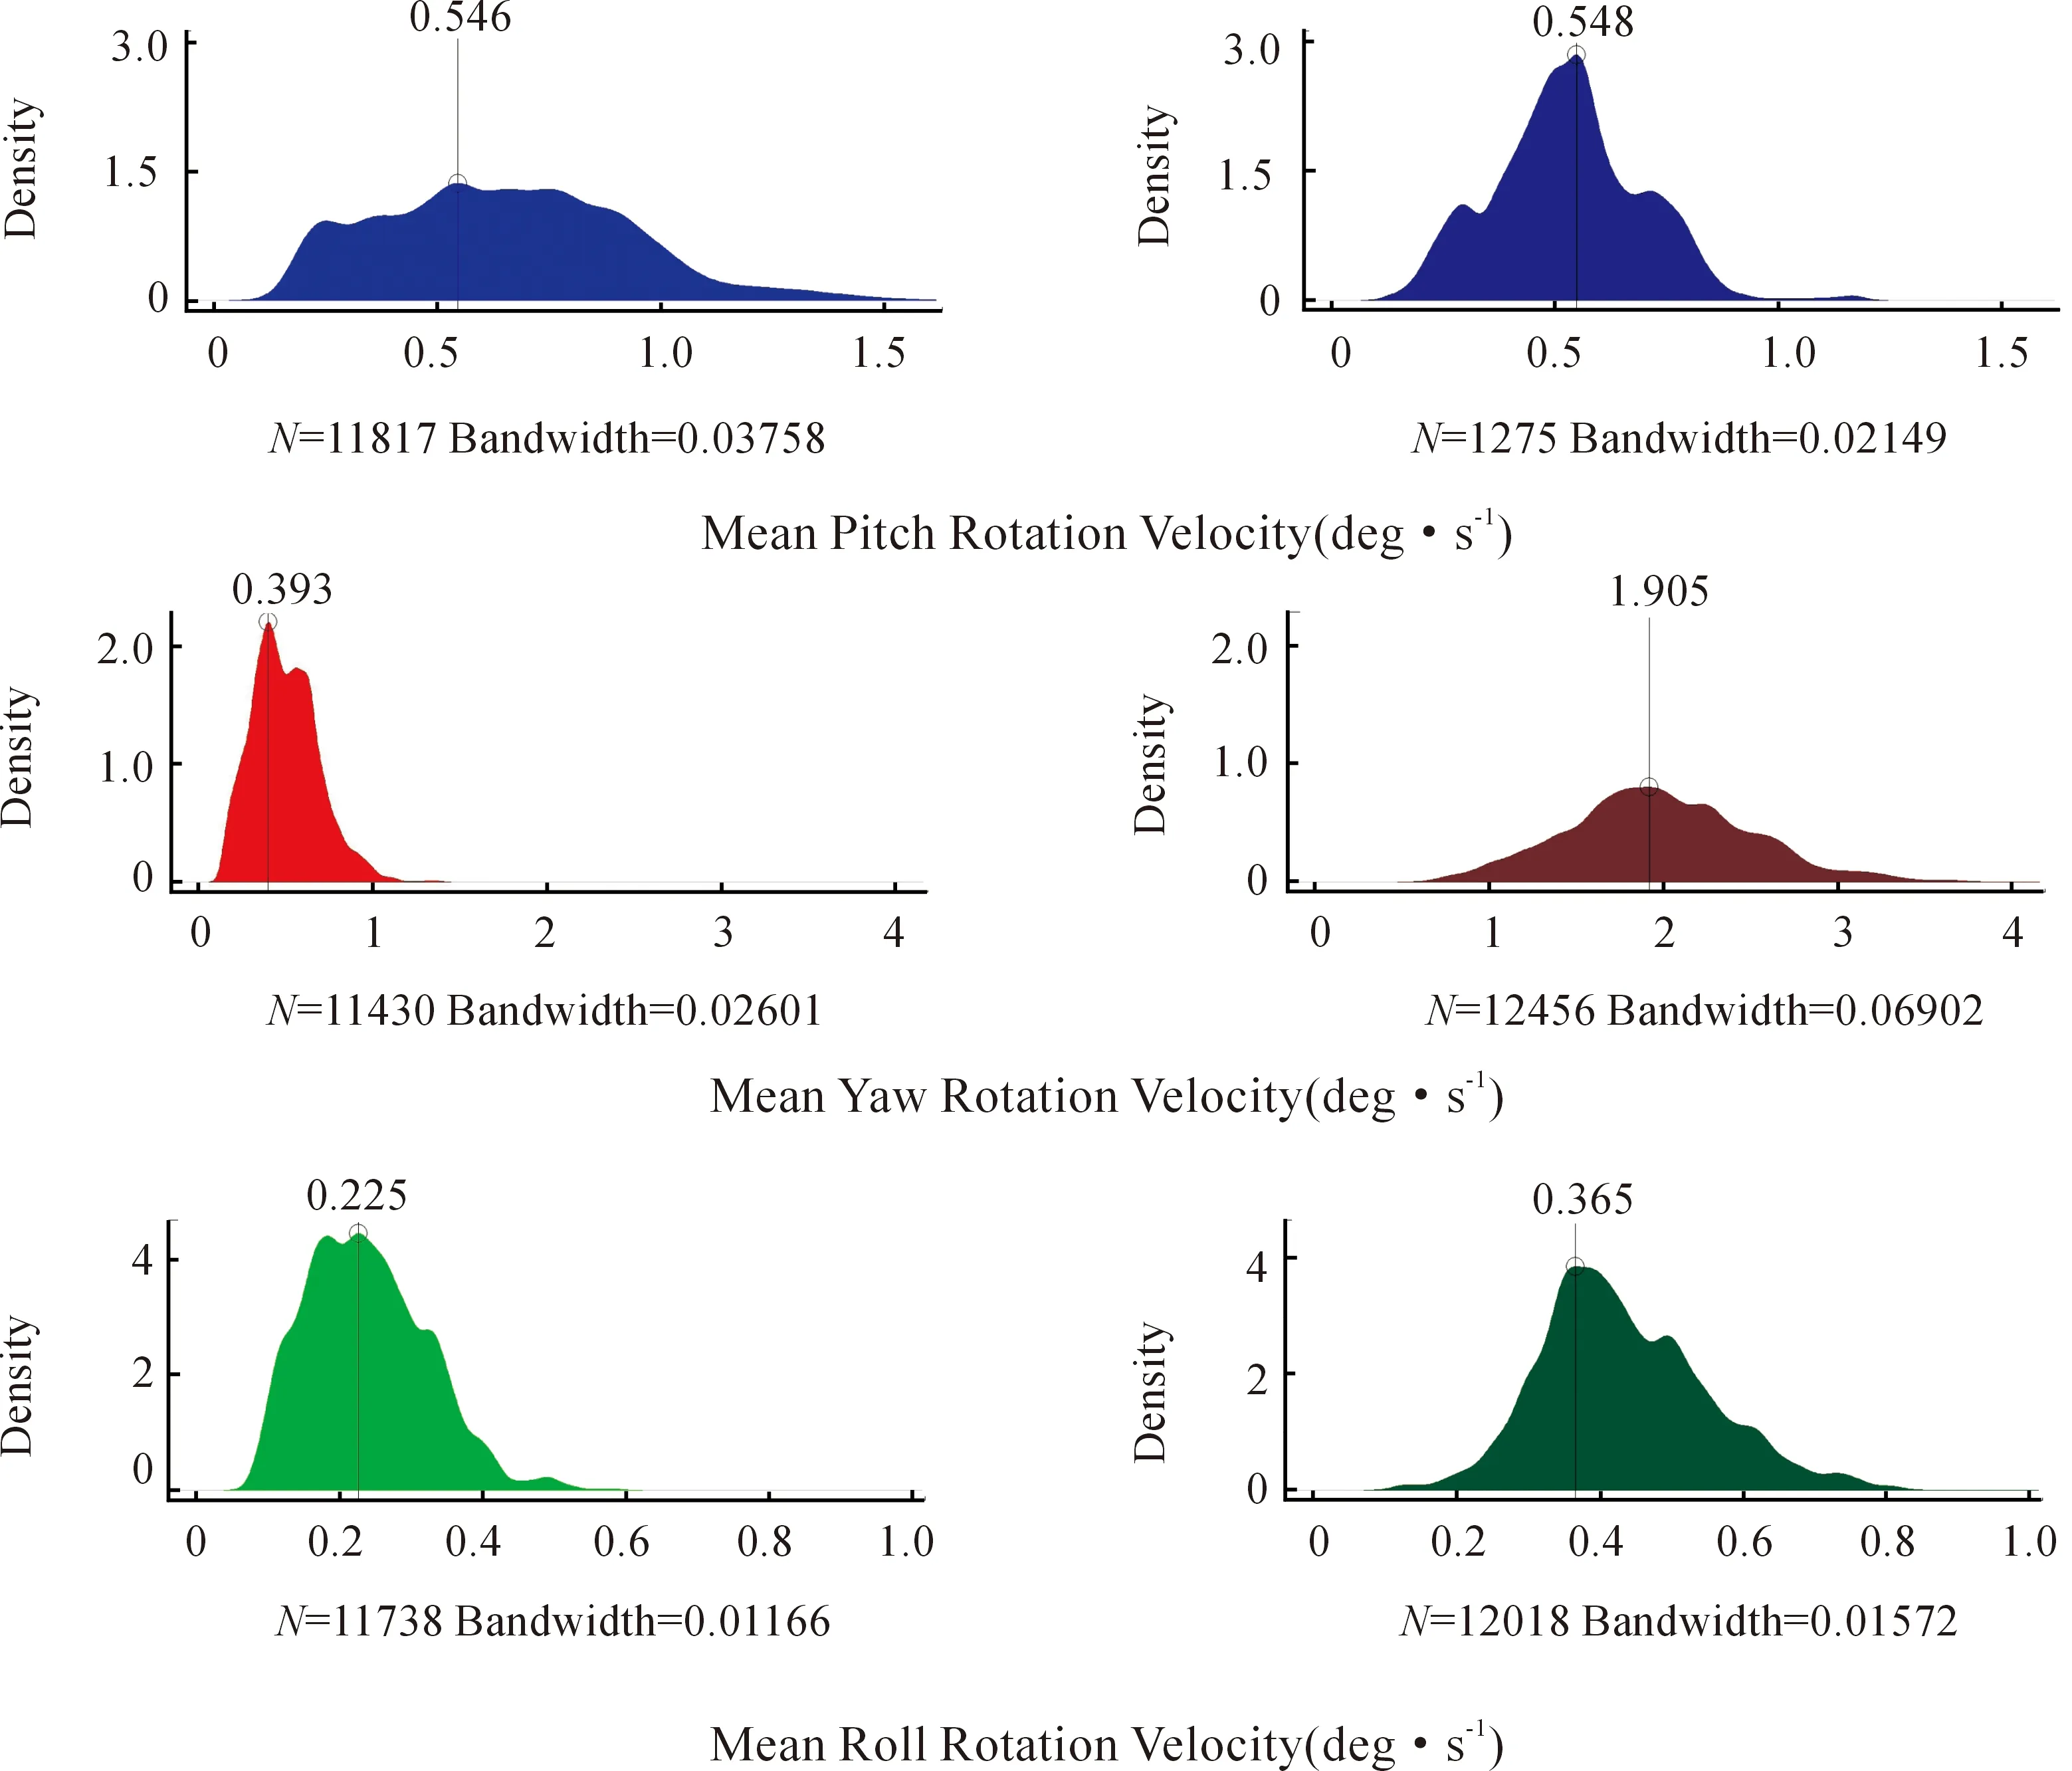
Fig.9 Mean velocity of rotation in both treatments (from left to right for MR treatment and TM treatment) in form of density plot. Significant differences in mean are observed in the rotational velocity on Y-axis. N indicates the number of samples representing the frames where the data could be collected. The bandwidth is a function of the density itself, computed by the density estimator, whose value indicates the optimal approximation of the distribution of the data.
Except for those two velocities, the results of the t-test allowed to reject the null hypothesis in all other cases. Table 4 summarizes the results achieved. Translational X and Z-axis velocities resulted in significantly lower MR than in other treatments. Particularly significant is the translation velocity on X axis, for which the subject in TM exhibited a mean velocity 6.4 times higher than that in mixed reality treatment. As a consequence of such a result, the effort to complete the maintenance procedures increasingly in complexity grows more quickly in TM than in MR. However, the physical load of wearing the HMD in MR treatment should also be considered. Section 5.7 provides the details to this regard.
5.5 Analysis of covered space
Since 6DOF tracking data provides information on movements in a 3D space, we exploited them to infer the length of the ideal path of attention followed by all subjects in both treatments. It was achieved by using the orientation of the head orientation (i.e., the projection of the points of interest on a two-dimension Cartesian plane, corresponding to the surface of the rack). The boxplot in Fig.10 compares these two treatments under this point of view. On average, the difference between these two treatments is particularly evident in the boxplot (a statistical test can only confirm such a result*The null hypothesis that there is not a significant difference in the mean length of the paths is completely rejected with T0=|-8.2755|>2.1009, p=1.5079e-07.. The bar plot in Fig.11 makes even clearer how significantly the mean behavior differs between these two experiments. The length of the longest path in MR (in other terms, the best performance among all subjects) resulted in 40% shorter than the length of the shortest path in TM (the best subject in this last case).
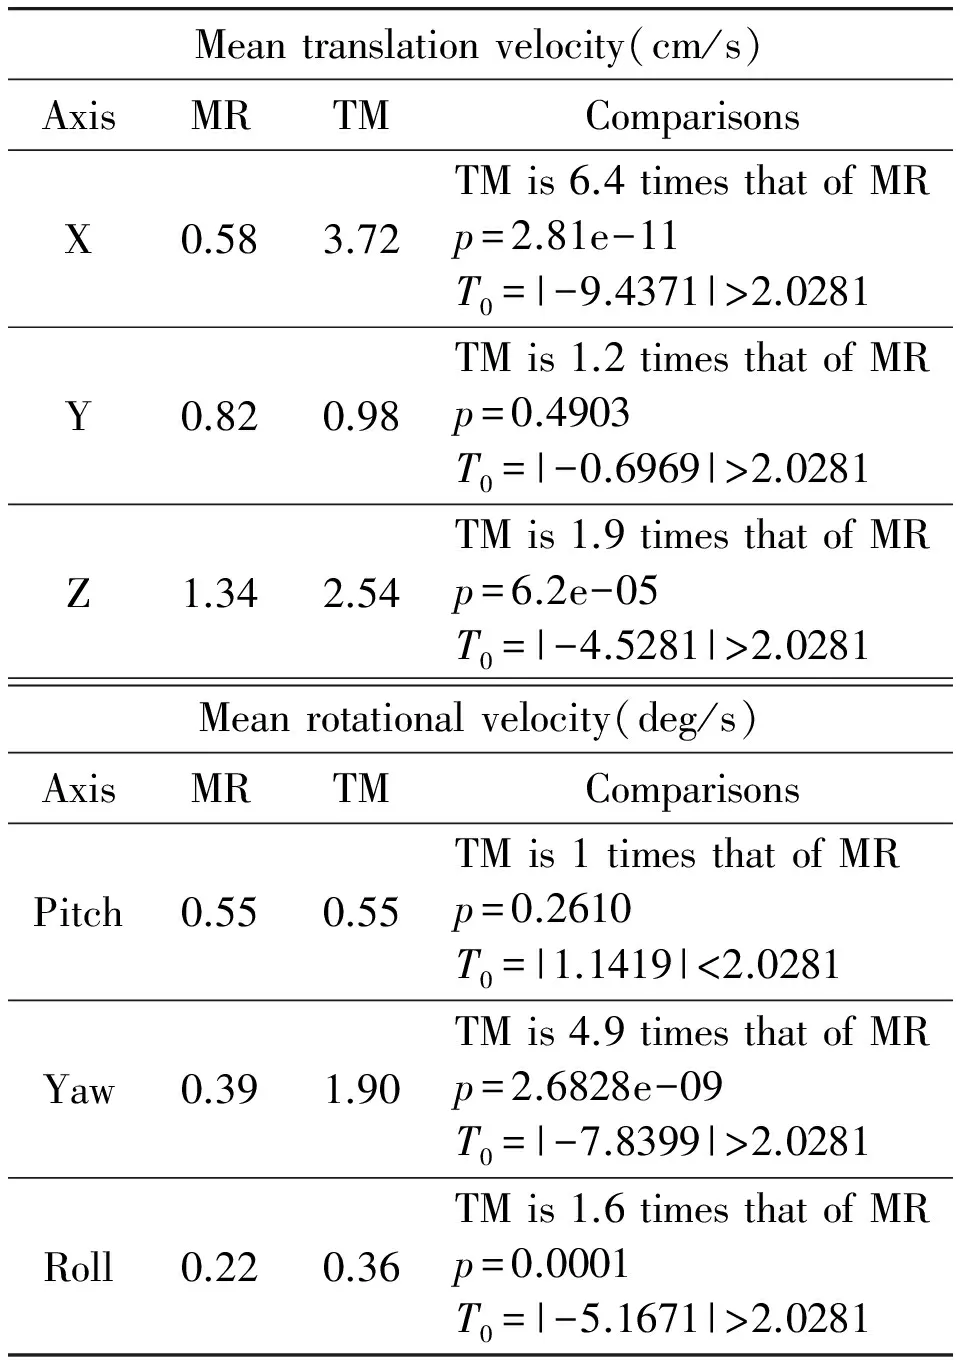
Table 4 Mean translation (top) and rotation (bottom) velocities in MR and TM treatments. The table summarizes the translational and rotational velocity observed in the two experiments and compare them to understand the significance of MR over TM. The p value is the probability value of the comparison of the event to accept or reject the null hypothesis.
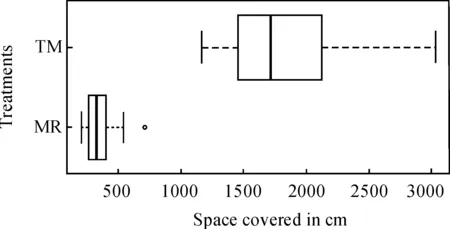
Fig.10 Barplot showing the statistical significance between the mean length of the paths drawn by head rotation in MR and TM treatments.
5.6 User evaluation
To evaluate the personal feelings and expectations of each participant, a NASA TLX questionnaire[36]was provided at the end of the testing session. NASA-TLX is a multi-dimensional scale (consisting of six twenty-point rating scales) designed to obtain workload estimates from one or more operators while they are performing a task or immediately afterwards. The overall workload was evaluated by exploiting the raw task load index analysis[54]. Fig.12 shows the average scores for each point of the questionnaire and Table 5 summarizes the statistical analysis on them. Two-tailed Mann-Whitney test was used to analyze the rating at each point in the two treatments. The null hypothesis is:H0d, the difference on average rating between two treatments is not statistically significant.
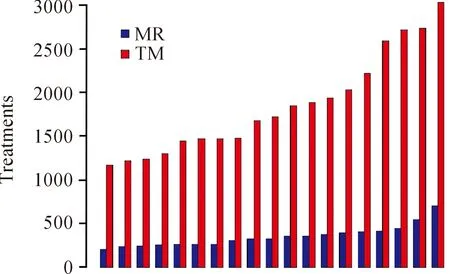
Fig.11 The boxplot shows the estimated length of the paths traversed by each subject in MR and TM experiments, blue and red respectively. Results are sorted, left to right, from the best to the worst performance in both treatments.
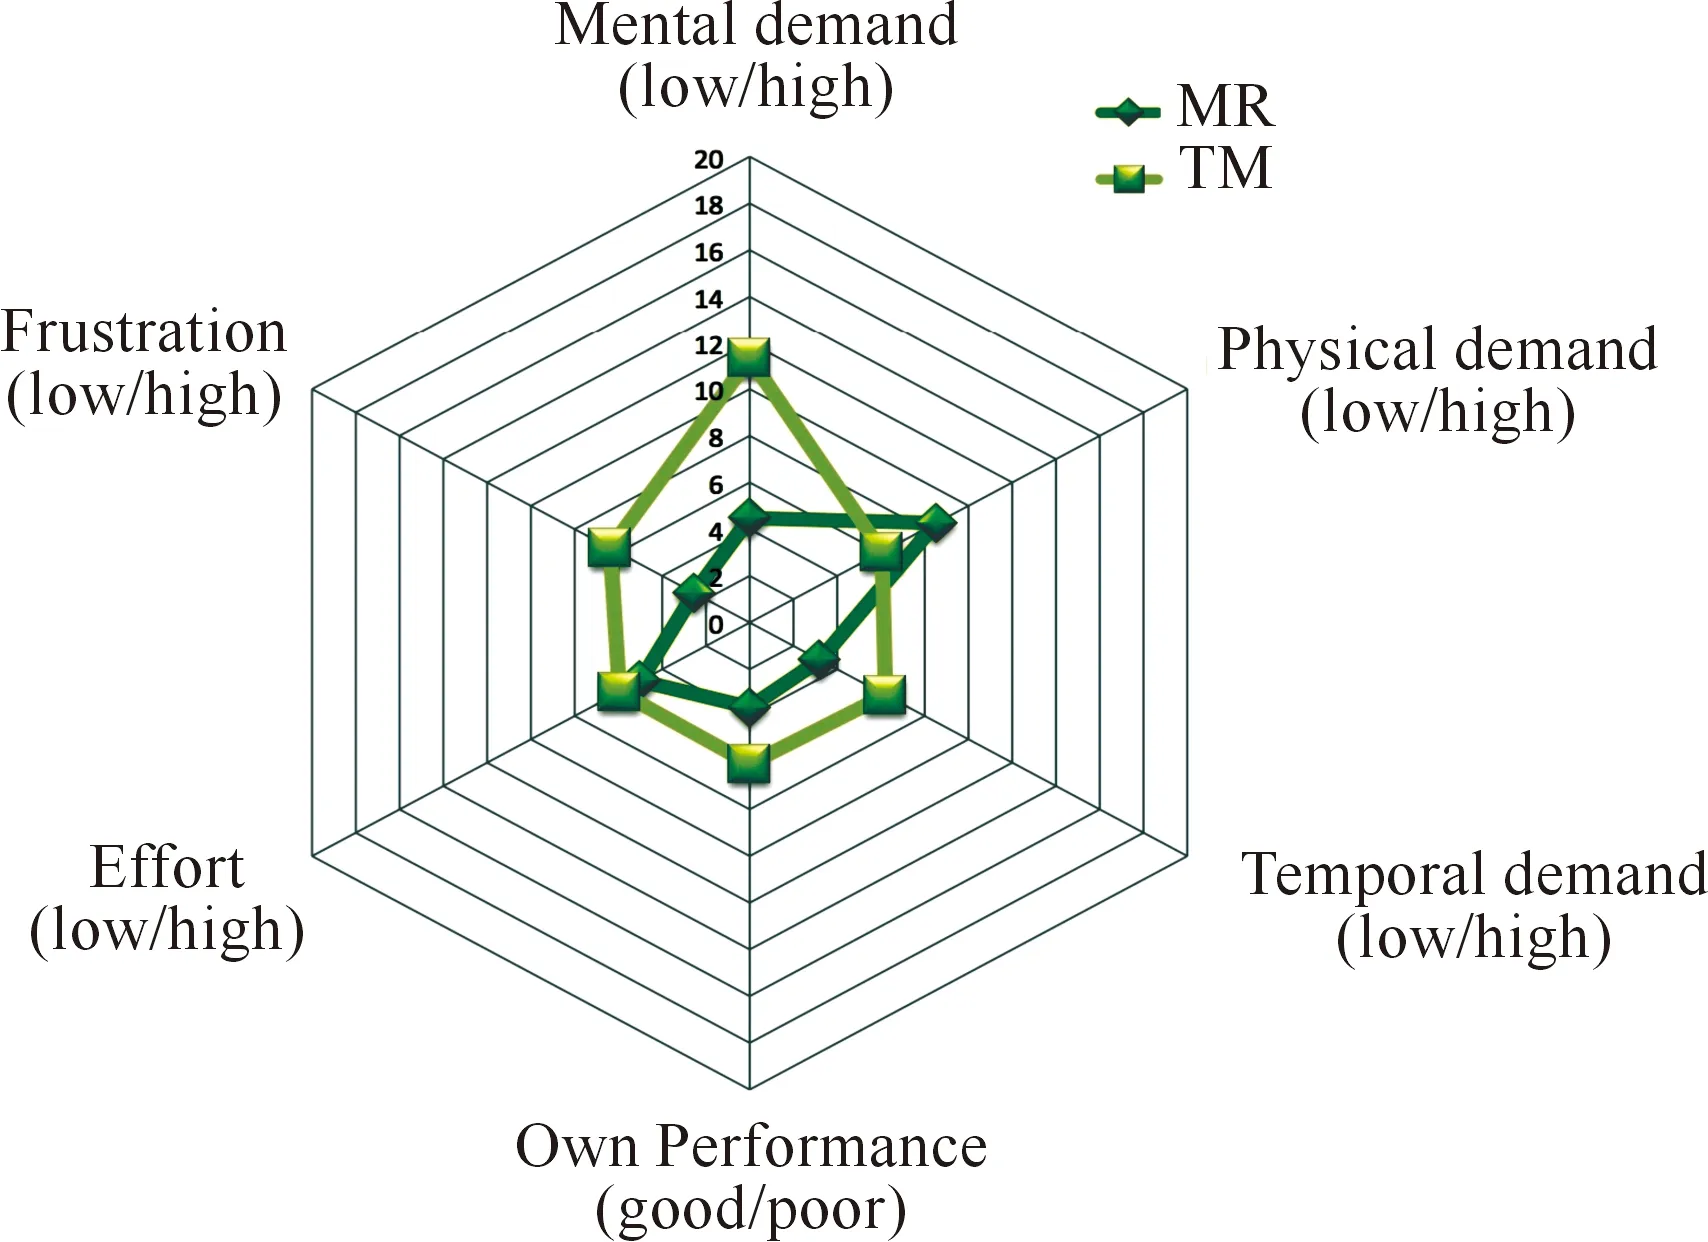
Fig.12 shows the NASA TLX indices rating in form of hexagons. The hexagon for MR is almost totally inscribed in the one for TM treatment. Only one exception is represented by the physical demand for which, indeed, the statistical difference among treatments resulted is not significant.
When using individual rating systems, a big number of samples to avoid bias in the results is generally required. In our case, the limited size of the statistical population makes difficult to draw strong conclusions on qualitative data of the experimentation. We therefore supported the numerical ratings with collecting the personal considerations discussed by each participation by means of an informal talk which took place at the end of the trial. The intention of the talks was twofold. As just discussed, from one side, it supported the analysis of the questionnaire ratings. On the other side, it created a more colloquial condition which let subjects to be free to express their opinions and doubts about the systems and their performance.
In Fig.12, two hexagons are formed by connecting average scores achieved at each one of the six questions of the questionnaire for MR and TM experiments. It can be seen that the hexagon in MR is almost completely inscribed in the other one. The exception is represented by the physical demand of MR which resulted in slightly higher than in TM. However, the difference did not result statistically significant, as reported in the second row of the Table 5 withp=0.0808.
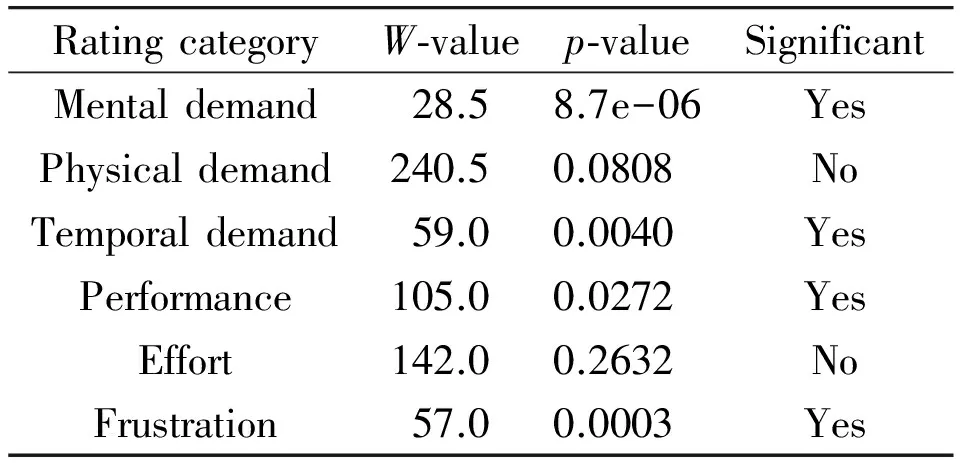
Table 5 NASA TLX indices in two experiments and the statistically significance by comparing the mean rating by participants.
Regarding the others, the null hypothesis H0dwas completely rejected for four indices, i.e., mental and temporal demand, performance and frustration. The statistical significance of difference for mental demand in treatments is encouraging because it is a further confirmation that MR reduced the mental effort required to understand the procedure. Also, the outcomes of the informal talks validated these conclusions. Many participants in MR granted augmented visual aids an efficient way to support the user’s understanding of the working environment.
In terms of frustration, meaning the index that measures the level of stress and discouragement to perform the steps of the testing procedure, the analysis was in favor of the mixed reality system. Similar consideration can be made by observing the result for temporal demand. In this last case, the difference on average was statistically significant thus rejecting the null hypothesis. However, a high number of subjects in the MR treatment experienced a negative feeling about the time spent in each step of the testing procedure. Each one of them was accompanied by a synthesized speech describing the task to perform. Interestingly, this feature was considered as a weakness of the mixed reality system. The debriefing revealed, in fact, that many participants waited the end of the speech of the vocal assistant even when the visual augmented aids were considered sufficient to understand the task to perform. As a consequence, the time to complete the tasks where this condition happened could have been even shorter in MR. This result has indeed a double benefit. It can be considered as an insight to improve the human computer interaction paradigm. Moreover, it provides clear evidences that the total time required to complete the whole testing procedure would have been even shorterin MR. Concerning the performance index, which expresses the feeling that the testing procedure was completed without errors, the majority of subjects in both treatments were satisfied by their work as of a good level. However, the statistical difference was significant (p= 0.0272) thus suggesting that even if all subjects were as much satisfied by their performance in MR as in TM, in the first treatment they were the more.
5.7 Further observations
The conclusions inferred from the analysis of the physical demand in MR treatment seemed to contradict the benefits of mixed reality applications discussed in the literature 2. However, the analysis of the movements, both in terms of amplitude and velocity, resulted in significantly smaller in MR compared to TM. This is reasonable to assume that the complex maintenance procedures, which inevitably require more time to be completed, produce a higher physical load in TM than in MR. The informal talk was useful to understand the reasons behind such a result. Fourteen of twenty participants considered the HMD too uncomfortable to wear by complaining an excessive weight concentrated on the nose. We recall that we used the Silicon Micro HMD (refer to the section about the architecture of the system 3) for the good resolution of the displays. From the inspection of the design of the HMD, we realized that it could be a source of trouble for the users in this sense. So that, an elastic headband was added to the aim of balancing the weight of the device on user’s head. Unfortunately, the extra camera mounted to enable the mixed reality view of the scene made the HMD even heavier. As a consequence, many participants in the MR expressed a feeling of discomfort by wearing the HMW, implying a physical demand rating equivalent in mean to that in TM.
6 Conclusion
We presented a comprehensive system for AR-based assistance to servicing and repair procedures in industrial environments. The proposed mixed reality system was compared to an alternative guidance solution relying on conventional computer based manuals. The experimentation, which was carried out on a total number of forty participants, collected and analyzed both quantitative and qualitative data to the aim of formally assessing the benefits and the limitations of mixed reality in the field of maintenance. Even though some of the results could be considered non-surprising, they have been obtained in a real industrial environment involving a high number of real engineers compared to previous works in literature.
The results of the experimental analysis confirm the significance of the difference in mean time of completion of a testing maintenance procedure among the participants involved in a mixed reality to those involved in current traditional methods. In addition, the number and amplitude of movements of user’s head also resulted significantly different in the two treatments. This result, together with the lessons learnt from the NASA TLX questionnaire, was particularly useful to draw some considerations about the real physical load of mixed reality systems and the factors which negatively affects the user’s performance. The results reported in this study have to be considered as a starting point toward really usable MR system for the maintenance and training. Ergonomic and usability issues are still from being comprehensively explored, in particular the engineering and design of see-through HMDs. However, recent trends by giants like Samsung, Sony, Microsoft (to many mention a few of them) are shedding light on feasible engineering of wide field-of-view and light HMDs. Similarly, promising results collected by emerging startups (Oculus was a pioneer in this sense) also seem feeding this field of the research that let reasonable believe that the practical advantages of MR technology have not been totally explored.
Acknowledgement
We gratefully acknowledge Selex ES division of Leonardo S.p.A. for its support throughout the experiments conducted within this study.
[1]I.E.Sutherland, A head-mounted three dimensional display, inProceedingsoftheDecember9-11, 1968,FallJointComputerConference,PartI,AFIPS’68 (Fall,partI), ACM, New York, NY, USA, 1968, pp.757-764.
[2]http://www.oculus.com
[3]https://www.google.com/glass
[4]H.Chen, A.S.Lee, M.Swift, and J.C.Tang, 3D collaboration method over hololens and skype end points, inProceedingsofthe3rdInternationalWorkshoponImmersiveMediaExperiences, ACM, 2015, pp.27-30.
[5]W.Friedrich, Arvika-augmented reality for development, production and service, inProceedingsofInternationalSymposiumonMixedandAugmentedReality(ISMA), 2002, pp.3-4.
[6]K.Kiyokawa, M.Billinghurst, B.Campbell, and E.Woods, An occlusion capable optical see-through head mount display for supporting co-located collaboration, inProceedingsofTheSecondIEEEandACMInternationalSymposiumonMixedandAugmentedReality, 2003, pp.133-141.
[7]Z.Bian, H.Ishii, H.Shimoda, H.Yoshikawa, Y.Morishita, Y.Kanehira, and M.Izumi, Development of a tracking method for augmented reality applied to NPP maintenance work and its experimental evaluation,IEICETransactionsonInformationSystems, vol.E90-D, no.6, pp.963-974, 2007.
[8]E.Mendez, D.Kalkofen, and D.Schmalstieg, Interactive context-driven visualization tools for augmented reality, inProceedingsofIEEE/ACMInternationalSymposiumonMixedandAugmentedReality(ISMAR), 2006, pp.209-218.
[9]K.Pentenrieder, C.Bade, F.Doil, and P.Meier, Augmented reality-based factory planning - an application tailored to industrial needs, inProceedingsof6th IEEE and ACM International Symposium on Mixed and Augmented Reality (ISMAR), 2007, pp.31-42.
[10] G.Schall, E.Mendez, E.Kruijff, E.Veas, S.Junghanns, B.Reitinger, and D.Schmalstieg, Handheld augmented reality for underground infrastructure visualization,PersonalandUbiquitousComputing, vol.13, no.4, pp.281-291, 2009.
[11] F.De Crescenzio, M.Fantini, F.Persiani, L.Di Stefano, P.Azzari, and S.Salti, Augmented reality for aircraft maintenance training and operations support,IEEEComputerGraphicsandApplications, vol.31, no.1, pp.96-101, 2011.
[12] P.Fua and V.Lepetit, Vision based 3d tracking and pose estimation for mixed reality,EmergingTechnologiesofAugmentedRealityInterfacesandDesign,pp.43-63, 2005.
[13] D.Wagner, T.Langlotz, and D.Schmalstieg, Robust and unobtrusive marker tracking on mobile phones, inProceedingsof7thIEEE/ACMInternationalSymposiumonMixedandAugmentedReality(ISMAR), 2008, pp.121-124.
[14] M.Maidi, M.Preda, and V.H.Le, Markerless tracking for mobile augmented reality, inProceedingsofIEEEInternationalConferenceonSignalandImageProcessingApplications(ICSIPA), 2011, pp.301-306.
[15] A.Comport, E.Marchand, M.Pressigout, and F.Chaumette, Real-time markerless tracking for augmented reality: the virtual visual servoing framework,IEEETransactionsonVisualizationandComputerGraphics, vol.12, no.4, pp.615-628, 2006.
[16] G.Klein and D.Murray, Parallel tracking and mapping for small ar workspaces, inProceedingsofthe2007 6thIEEEandACMInternationalSymposiumonMixedandAugmentedReality(ISMAR), IEEE Computer Society, Washington, DC, USA, 2007, pp.1-10.
[17] R.A.Newcombe, S.Lovegrove, and A.Davison, Dtam: Dense tracking and mapping in real-time, inProceedingsofIEEEInternationalConferenceonComputerVision(ICCV), 2011, pp.2320-2327.
[18] C.Liu, S.Huot, J.Diehl, W.Mackay, and M.Beaudouin-Lafon, Evaluating the benefits of real-time feedback in mobile augmented reality with hand-held devices, inProceedingsoftheSIGCHIConferenceonHumanFactorsinComputingSystems,CHI’12, ACM, New York, NY, USA, 2012, pp.2973-2976.
[19] D.W.F.van Krevelen, and R.Poelman, A survey of augmented reality technologies, applications and limitations,TheInternationalJournalofVirtualReality, vol.9, no.2, pp.1-20, 2010.
[20] T.Langlotz, H.Regenbrecht, S.Zollmann, and D.Schmalstieg, Audio stickies: Visually-guided spatial audio annotations on a mobile augmented reality platform, inProceedingsofthe25thAustralianComputer-HumanInteractionConference:Augmentation,Application,Innovation,Collaboration,OzCHI’13, ACM, New York, NY, USA, 2013, pp.545-554.
[21] A.Shatte, J.Holdsworth, and I.Lee, Mobile augmented reality based context-aware library management system,ExpertSystemswithApplications, vol.41, no.5, pp.2174-2185, 2014.
[22] J.Y.Lee, D.W.Seo, and G.Rhee, Visualization and interaction of pervasive services using context-aware augmented reality,ExpertSystemswithApplications, vol.35, no.4, pp.1873 - 1882, 2008.
[23] A.Dünser, R.Grasset, and M.Billinghurst,Asurveyofevaluationtechniquesusedinaugmentedrealitystudies, Human Interface Technology Laboratory New Zealand, 2008.
[24] C.Bach and D.L.Scapin, Obstacles and perspectives for evaluating mixed reality systems usability,ActeduWorkshopMIXER, IUI-CADUI, vol.4, 2004.
[25] F.Narducci, S.Ricciardi, and R.Vertucci, Enabling consistent hand-based interaction in mixed reality by occlusions handling,MultimediaToolsandApplications, vol.75, no.16, pp.9549-9562, 2016.
[26] A.F.Abate, F.Narducci, and S.Ricciardi, An Image Based Approach to Hand Occlusions in Mixed Reality Environments, inProceedingsof6thInternationalConferenceonVirtual,AugmentedandMixedReality.DesigningandDevelopingVirtualandAugmentedEnvironments(VAMR), 2014, pp.319-328.
[27] B.Goldiez, A.Ahmad, and P.Hancock, Effects of augmented reality display settings on human way finding performance,IEEETransactionsonSystems,Man,andCybernetics,PartC:ApplicationsandReviews, vol.37, no.5, pp.839-845, 2007.
[28] S.J.J.Kim, A user study trends in augmented reality and virtual reality research: A qualitative study with the past three years of the ISMAR and IEEE VR conference papers, inProceedingsofInternationalSymposiumonUbiquitousVirtualReality(ISUVR), 2012, pp.1-5.
[29] S.Henderson and S.Feiner, Exploring the benefits of augmented reality documentation for maintenance and repair,IEEETransactionsonVisualizationandComputerGraphics, vol.17, no.10, pp.1355-1368, 2011.
[30] S.Henderson and S.K.Feiner, Augmented reality in the psychomotor phase of a procedural task, inProceedingsof10thIEEEInternationalSymposiumonMixedandAugmentedReality(ISMAR), 2011, pp.191-200.
[31] S.Henderson and S.Feiner, Evaluating the benefits of augmented reality for task localization in maintenance of an armored personnel carrier turret, inProceedingsof8thIEEEInternationalSymposiumonMixedandAugmentedReality(ISMAR), 2009, pp.135-144.
[32] B.Schwerdtfeger, R.Reif, W.Günthner, and G.Klinker, Pick-by-vision: there is something to pick at the end of the augmented tunnel,VirtualReality, vol.15, no.2-3, pp.213-223, 2011.
[33] B.Schwerdtfeger, R.Reif, W.Günthner, G.Klinker, D.Hamacher, L.Schega, I.Bockelmann, F.Doil, and J.Tumler, Pick-by-vision: A first stress test, inProceedingsof8thIEEEInternationalSymposiumonMixedandAugmentedReality(ISMAR), 2009, pp.115-124.
[34] R.Reif, W.A.Günthner, B.Schwerdtfeger, and G.Klinker, Pick-by-vision comes on age: Evaluation of an augmented reality supported picking system in a real storage environment, inProceedingsofthe6thInternationalConferenceonComputerGraphics,VirtualReality,VisualizationandInteractioninAfrica,AFRIGRAPH’09, ACM, New York, NY, USA, 2009, pp.23-31.
[35] X.Wang and P.Dunston, Comparative effectiveness of mixed reality based virtual environments in collaborative design, inProceedingsofIEEEInternationalConferenceonSystems,ManandCybernetics(SMC), 2009, pp.3569-3574.
[36] S.G.Hart and L.E.Staveland, Development of nasa-tlx (task load index): Results of empirical and theoretical research,AdvancesinPsychology, vol.52, pp.139 - 183, 1988.
[37] A.Smailagic, D.P.Siewiorek, R.Martin, and J.Stivoric, Very rapid prototyping of wearable computers: A case study of vuman 3 custom versus off-the-shelf design methodologies,DesignAutomationforEmbeddedSystems, vol.3, no.2-3, pp.219-232, 1998.
[38] A.Smailagic and D.P.Siewiorek, A case study in embedded-system design: the vuman 2 wearable computer,IEEEDesign&TestofComputers, no.3, pp.56-67, 1993.
[39] A.Smailagic and D.Siewiorek, Application design for wearable and contextaware computers,IEEEPervasiveComputing, vol.1, no.4, pp.20-29, 2002.
[40] A.F.Abate, F.Narducci, and S.Ricciardi, Mixed reality environment for mission critical systems servicing and repair, inProceedingsofInternationalConferenceonVirtual,AugmentedandMixedReality, 2013, pp.201-210.
[41] G.Schweighofer and A.Pinz, Robust pose estimation from a planar target,IEEETransactionsonPatternAnalysisandMachineIntelligence, vol.28, no.12, pp.2024-2030, 2006.
[42] R.E.Kalman, A new approach to linear filtering and prediction problems,JournalofFluidsEngineering, vol.82, no.1, pp.35-45, 1960.
[43] http://www.s1000d.net/.
[44] Z.Pan, A.D.Cheok, H.Yang, J.Zhu, and J.Shi, Virtual reality and mixed reality for virtual learning environments,Computers&Graphics, vol.30, no.1, pp.20-28, 2006.
[45] Y.Blanco-Fernndez, M.Lpez-Nores, J.J.Pazos-Arias, A.Gil-Solla, M.Ramos-Cabrer, and J.Garca-Duque, Reenact: A step forward in immersive learning about human history by augmented reality, role playing and social networking,ExpertSystemswithApplications, vol.41, no.10, pp.4811 - 4828, 2014.
[46] M.Marner, A.Irlitti, and B.Thomas, Improving procedural task performance with augmented reality annotations, inProceedingsofIEEEInternationalSymposiumonMixedandAugmentedReality(ISMAR), 2013, pp.39-48.
[47] N.Gavish, T.Gutiérrez, S.Webel, J.Rodríguez, M.Peveri, U.Bockholt, and F.Tecchia, Evaluating virtual reality and augmented reality training for industrial maintenance and assembly tasks,InteractiveLearningEnvironments, vol.23, no.6, pp.778-798, 2015.
[48] B.Schwald and B.De Laval, An augmented reality system for training and assistance to maintenance in the industrial context,JournalofWSCG, vol.11, no.1-3, 2003.
[49] S.Webel, U.Bockholt, T.Engelke, N.Gavish, M.Olbrich, and C.Preusche, An augmented reality training platform for assembly and maintenance skills,RoboticsandAutonomousSystems, vol.61, no.4, pp.398 - 403, 2013.
[50] J.Zhu, S.K.Ong, and A.Y.C.Nee, An authorable context-aware augmented reality system to assist the maintenance technicians,TheInternationalJournalofAdvancedManufacturingTechnology, vol.66, no.9, pp.1699-1714, 2012.
[51] G.Westerfield, A.Mitrovic, and M.Billinghurst, Intelligent augmented reality training for motherboard assembly,InternationalJournalofArtificialIntelligenceinEducation, vol.25, no.1, pp.157-172, 2015.
[52] P.Royston, Remark as r94: A remark on algorithm as 181: The w-test for normality,AppliedStatistics, vol.44, no.4, pp.547-551, 1995.
[53] M.Hollander, D.A.Wolfe, and E.Chicken,Nonparametricstatisticalmethods, John Wiley & Sons, 2013.
[54] K.C.Hendy, K.M.Hamilton, and L.N.Landry, Measuring subjective workload: when is one scale better than many?,HumanFactors:TheJournaloftheHumanFactorsandErgonomicsSociety, vol.35, no.4, pp.579-601, 1993.
 CAAI Transactions on Intelligence Technology2017年4期
- CAAI Transactions on Intelligence Technology的其它文章
- Mobile Robot Indoor Dual Kalman Filter Localization Based on Inertial Measurement and Stereo Vision
- A Lane Detection Algorithm Based on Temporal-Spatial Information Matching and Fusion
- Proposal of Initiative Service Model for Service Robot
- Visual Navigation Method for Indoor Mobile Robot Based on Extended BoW Model
- Diagnosis System for Parkinson’s Disease Using Speech Characteristics of Patients and Deep Belief Network
- Magnetic Orientation System Based on Magnetometer, Accelerometer and Gyroscope
