
Dynamic alarm prediction for critical alarms using a probabilistic model☆
2016-05-30 12:54JianfengZhuChunliWangChuankunLiXinjiangGaoJinsongZhao
Jianfeng Zhu *,Chunli Wang Chuankun LiXinjiang Gao Jinsong Zhao
1 Sinopec Research Institute of Safety Engineering,Qingdao 266071,China
2 State Key Laboratory of Chemical Engineering,Department of Chemical Engineering,Tsinghua University,Beijing 100084,China
1.Introduction
Alarm systems play a significant role in the safe management of large industrial plants.Typically,alarm systems are installed in distributed control systems(DCSs).However,with the advance of hardware and software,itis much easierto measure almostevery process variable so thatmore alarmsare configured to monitorthe process,though some alarms are not useful to operators.This makes the alarm system inef ficient,which is a significant cause of industrial incidents and serious accidents.For example,the explosion and fires at the Milford Haven Refinery in the UK,which caused 48 million GBP of plant damage plus major production loss,could be prevented by the operating staff.They failed to do this partly because they faced a continuous barrage of alarms for a 5 h period leading to the accident[1].
Over the past few decades,alarm management has attracted a lot of attention among researchers.Two recommended standards of alarm management,i.e.,EEMUANo.191[1]and ISA 18.2[2],are released to provide guidance for design,implement,and maintain a well performing alarmsystem.In EEMUAstandard,a five levelmodelofalarm system performance is suggested,ranging from“overloaded”atthe bottom,through“reactive”,“stable”and “robust”,to “predictive”as the highest level of performance,as shown in Fig.1.Each level is defined according to a set of three primary key performance indicators,i.e.,average alarm rate,maximumalarm rate,and percentage oftime thatalarmratesare outside ofacceptability target.As mentioned in the EEMUA,improving alarm system performance is a hierarchical task,since each performance level will be fully achievable only if all elements of the preceding levels are accomplished.In order to improve from one performance level to the next,appropriate techniques should be applied at each level.Several widely used univariate alarm analysis and processing techniques[1–4],such as alarm rationalization,delay-timer,deadband and shelving,are suggested in the two standards.Under steady operating conditions,the alarm rate can be effectively reduced to a manageable level with these techniques.However,alarm systems could be managed to “stable”level at the best even if these techniques work well unless advanced techniques are used.
Advanced techniques for improving alarm system performance include multivariate alarm analysis and processing,alarm system visualization,and alarm flood analysis.Multivariate statistics process control methods,such as principal component analysis,are widely used for fault diagnosis and could reduce false and missed alarms to improve the performance of alarm system[5].Event correlation analysis approaches are discussed in[6,7]and attempt to directly detect the connection among alarm tags based on alarm data[8,9].A series of visualization tools to represent historical alarm data have been proposed in[10–13],including high density alarm plots,alarm similarity color maps,and run length distribution plots,which could help operators find the real problem in the alarm system accurately and swiftly.The parallel coordinate technique is a good practice on process data visualization,which aligns many process variables in a single coordinate[14].A modified Smith–Waterman algorithm is proposed to calculate a similarity index of alarm floods,which is a data driven method for root cause analysis of historical floods and for incoming flood prediction[15].

Fig.1.Performance levels(on 10 min time base)[1].
However,little attention focuses on alarm prediction,especially for critical alarms,which are most crucial for the safety of processes.If incoming alarms can be predicted earlier and more accurately,the operator could have more time to response to the alarms and take appropriate actions,especially during plant upset.In this paper,an alarm data driven probabilistic model based on the n-gram model is proposed to dynamically predict the probability of alarm occurrence,especially for critical alarms.An industrial case study is presented to verify the proposed model.
2.Background
2.1.Alarm sequence
There are two types of data that are informative and accessible resources for alarm management:process data and alarm data.Process data are process variable measurements at periodic intervals.They are usually stored in a database and used formodelidentification,controller design and so on.Alarm data are a setof textmassages generated by the DCS and stored in the alarm log in a chronological order.Alarm data are usually raised based on process data.When a process variable exceeds a predefined alarm limit,an alarm is triggered and an alarm massage is generated to notify the operator to take appropriate actions.Alarm data have different formats in different DCSs.In general,an alarm massage includes the following common attributes,tag name,time stamp,tag identifier,alarm priority and so on.The tag identifier usually includes “HI(High)”,“LO(Low)”,“HH(HighHigh)”,“LL(LowLow)”and“IOP(Input Open)”.The tag name plus tag identifier represents what type of alarm occurs,and the time stamp represents when it occurs.In the following parts of the paper,an alarm is defined by“tag name.tag identifier”.Alarms are ordered by the time stamp as an alarm sequence,=w1w2...wT,where wirepresents an alarm and T represents the time order.A typical alarm sequence is illustrated in Table 1.There are totally 5 types of alarms:x1.HI,x2.LO,x3.HH,x4.HI,and x5.LL.Every row represents an alarm.For instance,the first row means that the alarm of x1.HI occurs at 1 s.The alarm sequence is denoted as[x1.HI,x2.LO,…,x3.HH].
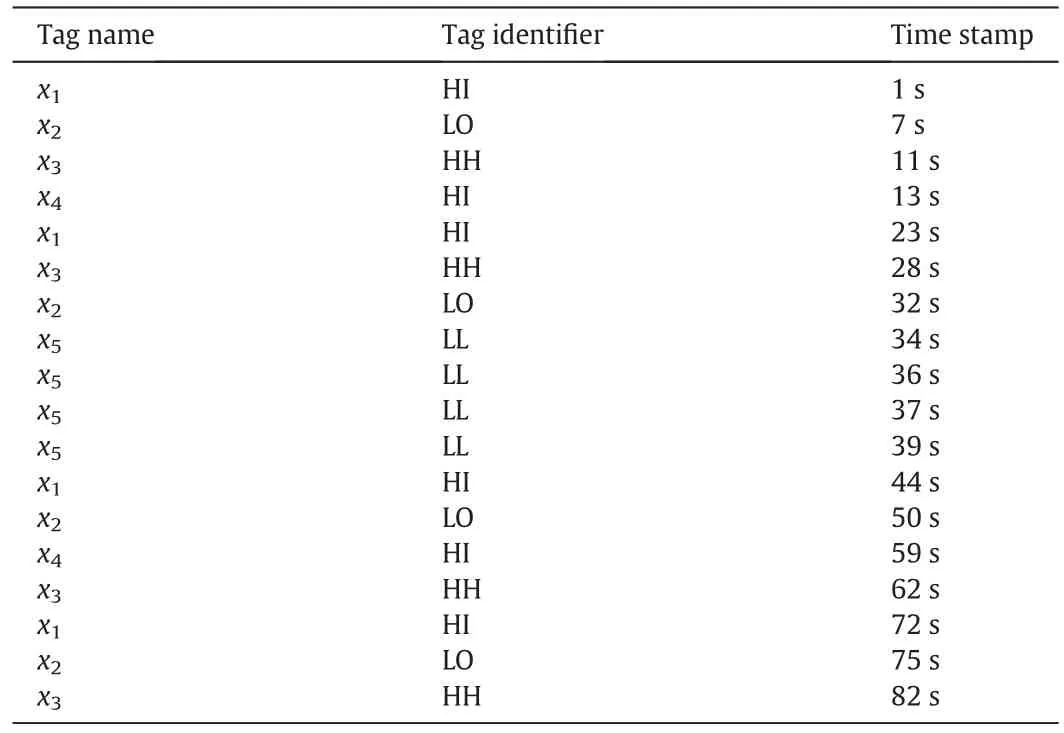
Table 1 A typical alarm sequence
In the alarm sequence,chattering alarms,i.e.the same alarm raising and clearing repeatedly over a period of time,are the most common form ofnuisance alarm.They cause nuisance to the operator because repeated annunciations of the same alarm are of little significance to the operator.In this paper,chattering alarms are identified by a quantitative measure based on run length distribution,which is developed in[16].An example of chattering alarms in Table 1 is alarm x5.LL,which arises at 34,36,37,and 39 s.The technique of dealing with chattering alarms is single line annunciation,which is introduced in EEMUA No.191.The basic idea is to merge the alarms with the same alarm type to eliminate chattering alarms.
2.2.Brief introduction of the n-gram model
The n-gram model technique has found successful applications in the area of biological sequence data analysis[17]and statistical natural language processing[18,19],e.g.,language model and part-of-speech tagging.Moreover,the n-gram model has the potential to be applied to a broader range including alarm data processing,which is studied in this paper.
The n-gram model is a type of probabilistic models,which follows the Markov assumption and uses an n-1 order Markov model.Herein an n-gram model is trained by alarm training sequences and then used for dynamically predicting the probability of specified critical alarm given previous alarms in a sequence.
We define the state spaceΣto be allalarm types in the alarm system.Itcan be denoted asΣ={alarm1,alarm2,…,alarmK},where alarmKis an alarm type,such as x1.HI in Table 1.An alarm sequence is defined as follows:
where wiis an alarm,namely wi∈ Σ,and i means that wiis the i th occurrence in the alarm sequence.
For an n-grammodel,the parameters to be estimated are conditional probabilities.Since the number of alarm types is K and the order of model is n,the n-gram model has O(Kn)parameters.Given the alarm training data,which are a set of alarm sequences,the parameters can be estimated using the method of maximum likelihood estimation(MLE)as follows,

whereis the joint probability of the alarm sequence,is the number of times that the sequence is seen in the alarm training data.
The problem of data sparseness will exist in MLE.MLE assigns a probability of zero to unseen alarm sequences and the probability of an n-gram involving unseen alarms will be zero.It is very unlikely that we will see all of alarm sequences in the training data.However,it would be a severe form of over fitting if we predict that a particular alarm sequence is totally impossible just because we happen not to see it in the alarm training data.Thus MLE alone is not a sufficiently good estimator and smoothing technique,which decreases the probability of seen alarm sequences and leave a little bit of probability for unseen alarm sequences.
Some smoothing techniques[20],such as good-turing smoothing,deleted interpolation,back-off,and Kneser–Ney smoothing,have been proposed to assign proper probabilities to alarm sequences not seen in the alarm training data.In this paper,the method of Kneser–Ney smoothing is applied.The Kneser–Ney n-gram model is defined to be recursively back-off to the Kneser–Ney(n−1)-gram model and is estimated as

where δ is a fixed discount parameter,δ ∈[0,1],is the number of unique alarms that follow the historyin the training data,pKN(wi)is the unigram model,and N1+(•wi)is the number of unique alarms that are followed by wi.
After the estimation of n-gram model,dynamic alarm prediction for specified critical alarm can be implemented.
3.A Probabilistic Model for Alarm Prediction
The probabilistic modelto predictthe alarm occurrence dynamically is described as follows.
(1)Preprocess alarm sequences stored in the alarm training logs.Typically,the alarm training logs are large enough and usually contain alarm records in the period of previous half a year.First,transform raw alarm data into corresponding alarm sequences with proper formatmentioned in this paper.Then,eliminate nuisance alarms,such as chattering alarms discussed above.
(2)Train an n-gram model for the training alarm sequences.Maximum likelihood estimation combined with the Kneser–Ney smoothing technique is used.
(3)Predict the probability of the monitored alarm occurrence in the next interval dynamically,given the previous alarms based on the n-gram model.In general,the monitored alarm is safety related,that is,with critical priority level.If the prediction probability is so high that it exceeds the predefined threshold,an early warning signal will notify the operator and proper actions should be taken to prevent this alarm from occurring.
A simple example is introduced to illustrate the proposed model.The alarm sequence in Table 1 is used as the training data.We assume that alarm x4.HI is set at critical priority level,that is,once alarm x4.HI occurs,some abnormal situation will happen.Therefore,predicting the occurrence probability of alarm x4.HI is critical for safe operation of plant.
First,preprocess the alarm sequence.Alarm x5.LL is a chattering alarm,which arises and clears again and again in a short time interval.The technique ofsignalline annunciation is used to eliminate chattering alarms.
Second,an n-gram modelistrained.Herein,we define that n=3,i.e.,the trigram model,and the fixed discount parameter δ is 0.1.Now parameter pKN(x4.HI|x2.LO,x3.HH)is estimated as an example,which is calculated as follows:

Likewise we obtain
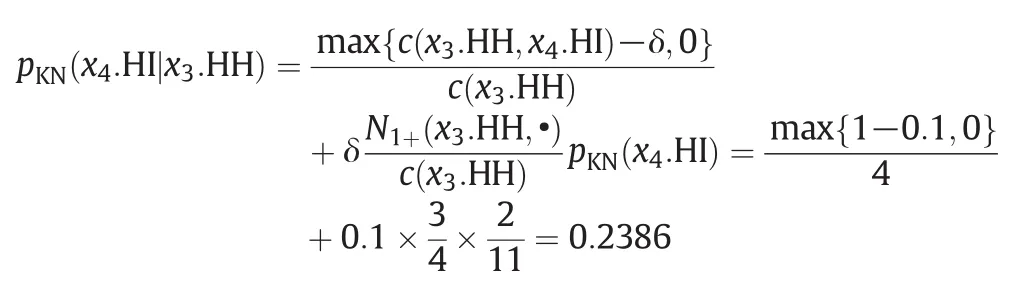
Then we obtain the parameter

Other parameters can be estimated with similar steps.After the trigram model is estimated,dynamic alarm prediction for alarm x4.HI can be implemented given real-time alarms.If the alarm sequence[x2.LO,x3.HH]occurs,according to the trigram model,the probability is 47.39%for alarm x4.HI to occur next.With more alarms entering,the occurrence probability of x4.HI will be updated dynamically.
4.An Industrial Case Study
The proposed method is applied to a cracking furnace unit in an ethylene plant.The raw alarm data were gathered from the alarm system of DCS through OPC Alarm&Event Server and stored in alarm logs.In the alarm data over a period of 6 months,there are totally 150 alarm tags and 5 different alarm identifiers,that is,“HI”,“LO”,“HH”,“LL”and “IOP”.Among more than 500 types of alarms,the coil-out temperature(COT)LL alarm,i.e.,COT.LL,is one of extremely significant alarms for process safety and quality control.Therefore,predicting the occurrence probability of COT.LL is helpful for the operator.Once the probability becomes high,the operator can take proper actions in advance to prevent an abnormal situation from happening.Dynamic alarm prediction for COT.LL using the ngram model is as follows.
The first step is to preprocess the raw alarm data.First,transform raw alarm data to corresponding alarm sequences with proper format.Then deal with nuisance alarms.The top 10 most frequent alarms,which contribute consistently with no real meaning,are calculated.If the alarm system is overloaded by a few bad alarms,they should be suppressed.In this case,the top 10 load percentage,i.e.,the total number of occurrences of the top 10 alarms as a percentage of the total number of alarm occurrences,is over 60%.After the rationalization of the alarm management team,the top 10 alarms are suppressed.In this paper,chattering alarms are identified and eliminated using the techniques discussed in Section 2.
Second,the proposed probability modelis trained with preprocessed alarm sequences.In this case,the 5-g modelis trained.Since Kneser-Ney smoothing technique is used,which uses lower-order probability to approximate higher-order one,the lower-order models are also obtained.Now an example of bigram is illustrated.Fig.2 shows a Hinton diagram of the joint distribution for alarms{001.LL,002.HI,003.LL,004.HH,005.LL,006.LL,007.LL,008.LO,009.LL.010.LL}.The numbers from“001”to “010”represent variables of pressure,temperature and feed flow in the cracking furnace unit.The Hinton diagram is a way of visualizing numerical values in a vector/matrix,popular in the neural networks and machine learning literature.The size of black squares is proportional to the value of the entry in the corresponding vector/matrix,i.e.,the joint probability of two alarms.For instance,the biggest square is the joint distribution of 005.LL and 006.LL,which means that if alarm 005.LL occurs,the next most possible occurring alarm is 006.LL.

Fig.2.A Hinton diagram of the joint distribution for alarms in case study.
Finally,with real-time alarm data entering,we can predictthe occurrence probability of alarm COT.LL,given the previous 5 alarms.In this case,the alarm test data of one week period are considered.The alarms are preprocessed by step one.Nuisance alarms are eliminated and 1500 counts of alarms remain.In the alarm test data,there are totally 24 countsforthe occurrence ofalarm COT.LL.Fig.3 shows the predicted occurrence probability of alarm COT.LL with red dots.With the threshold of 0.55,all COT.LL alarms can be predicted accurately,i.e.,the missed prediction rate is 0%.However,there are 4 counts of false prediction,i.e.,the false prediction rate is 14.3%,which could be handled with more alarm training data.From time difference statistics of two consecutive alarms in the alarm test data,the average prediction time for the occurrence of alarm COT.LL is about 3 min,i.e.,the operator will have about 3 min in advance to prevent alarm COT.LL from occurring.Table 2 shows the dynamic alarm prediction for COT.LL.Therefore,the probabilistic model is effective for predicting the next alarm occurring dynamically,especially critical alarms.
The dynamic prediction algorithmbased on the n-gram modelis good in the sense that it is easy to implement,computationally efficient to use,and accurate much ofthe time.However,itcannottake into accountlongdistance correlations between alarms,since n is typically small.This drawback may lead to inaccurate predictions when the actualprediction information is beyond the local range.In the future,we will study how to compensate for this drawback by using long-distance dependence.
5.Concluding Remarks
In this paper,a probabilistic model based on the n-gram model is proposed to predict the alarm occurrence dynamically,especially for critical alarms.The proposed model utilizes alarm data stored in the DCS to predict the probability of specified alarm.Once the probability is high,an early warning will announce to the operator and some action can be taken to prevent the alarm from occurring.Alarm data from an actual chemical process is used for validation.
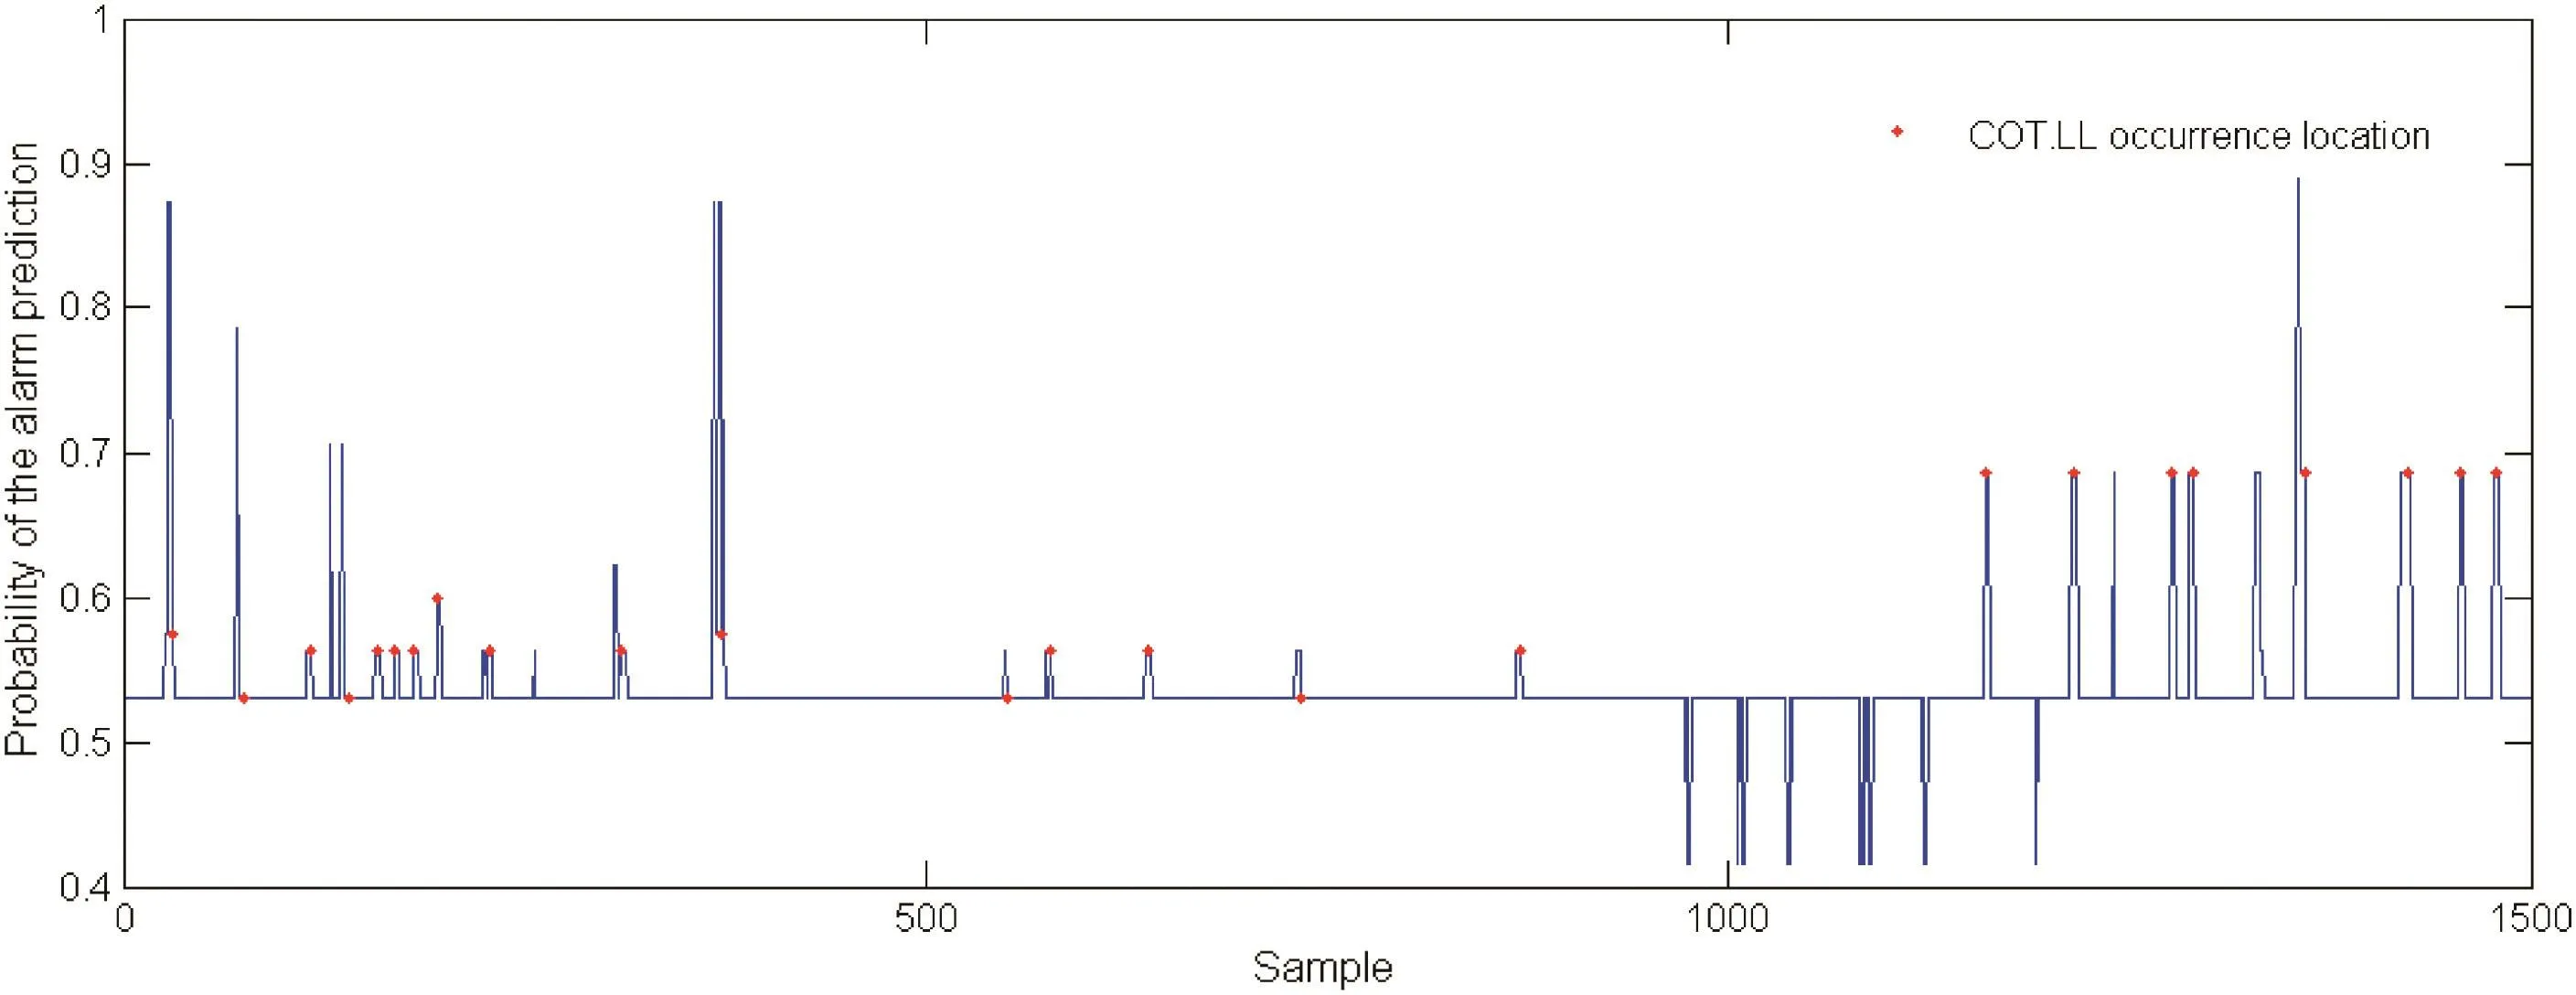
Fig.3.The probability of alarm COT.LL prediction based on the probabilistic model.

Table 2 Results of dynamic alarm prediction for COT.LL
[1]EEMUA,Alarm systems:A guide to design,management and procurement,London:EEMUA Publication No.191 Engineering Equipment and Materials Users'Association,second ed.,2007.
[2]ISA,Management of alarm systems for the process industries,Technical Reportansi/ISA-18.2-2009 International Society of Automation ISA,67 AlexanderDrive,P.O.Box 12277,Research Triangle Park,North Carolina 27709,2009.
[3]I.Izadi,S.Shah,D.Shook,T.Chen,An introduction to alarm analysis and design,Fault Detection,Supervision and Safety of Technical Processes,Barcelona,Spain 2009,pp.645–650.
[4]N.A.Adnan,I.Izadi,T.Chen,On expected detection delays for alarm systems with deadbands and delay-timers,J.Process Control 21(9)(2011)1318–1331.
[5]S.R.Kondaveeti,S.Shah,I.Izadi,Application of multivariate statistics for efficient alarm generation,Fault Detection,Supervision and Safety of Technical Processes 2009,pp.657–662.
[6]F.Higuchi,I.Yamamoto,T.Takai,M.Noda,H.Nishitani,Use of event correlation analysis to reduce number of alarms,Comput.Aided Chem.Eng.27(2009)1521–1526.
[7]X.Liu,M.Noda,H.Nishitani,Evaluation of plant alarm systems by behavior simulation using a virtual subject,Comput.Chem.Eng.34(2010)374–386.
[8]Z.Yang,J.Wang,T.Chen,On correlation analysis of bivariate alarm signals,Information and Automation(ICIA),2012 International Conference on IEEE 2012,pp.530–535.
[9]K.Ahmed,I.Izadi,T.Chen,D.Joe,T.Burton,Similarity analysis of industrial alarm flood data,Automation Science and Engineering,Trans.IEEE 10(2)(2013)452–457.
[10]F.Yang,S.L.Shah,D.Xiao,T.Chen,Improved correlation analysis and visualization of industrial alarm data,ISA Trans.51(4)(2012)499–506.
[11]S.R.Kondaveeti,I.Izadi,S.L.Shah,T.Black,T.Chen,Graphical tools for routine assessment of industrial alarm systems,Comput.Chem.Eng.46(2012)39–47.
[12]J.Zhu,Y.Shu,J.Zhao,F.Yang,A dynamic alarm management strategy for chemical process transitions,J.Loss Prev.Process Ind.30(2014)207–218.
[13]F.Yang,L.S.Sirish,D.Xiao,Signed directed graph modeling of industrial processes and their validation by data-based methods,Control and Fault-Tolerant Systems(SysTol),2010 Conference on IEEE 2010,pp.387–392.
[14]R.Brooks,R.Thorpe,J.Wilson,A new method for defining and managing process alarms and for correcting process operation when an alarm occurs,J.Hazard.Mater.115(1)(2004)169–174.
[15]Y.Cheng,I.Izadi,T.Chen,Pattern matching of alarm flood sequences by a modified Smith–Waterman algorithm,Chem.Eng.Res.Des.91(6)(2013)1085–1094.
[16]E.Naghoosi,I.Izadi,T.Chen,Estimation of alarm chattering,J.Process Control 21(9)(2011)1243–1249.
[17]H.U.Osmanbeyoglu,M.K.Ganapathiraju,N-gram analysis of 970 microbial organisms reveals presence of biological language models,BMC Bioinf.12(1)(2011)12.[18]P.F.Brown,P.V.Desouza,R.L.Mercer,V.J.D.Pietra,J.C.Lai,Class-based n-gram models of natural language,Comput.Linguist.18(4)(1992)467–479.
[19]J.Wu,S.Khudanpur,Maximum Entropy Language Modeling with Non-local Dependencies(Ph.D Dissertation)The Johns Hopkins University,2003.
[20]S.F.Chen,J.Goodman,An empirical study of smoothing techniques for language modeling,Comput.Speech Lang.13(4)(1999)359–393.
 Chinese Journal of Chemical Engineering2016年7期
- Chinese Journal of Chemical Engineering的其它文章
- Vanadium oxide nanotubes for selective catalytic reduction of NO x with NH3
- Optimal design for split-and-recombine-type flow distributors of microreactors based on blockage detection☆
- Theoreticalpredictions ofviscosity ofmethane under confined conditions☆
- Permeabilization of Escherichia coli with ampicillin for a whole cell biocatalyst with enhanced glutamate decarboxylase activity☆
- Formation of crystalline particles from phase change emulsion:In fluence of different parameters
- The effect of SiO2 particle size on iron based F–T synthesis catalysts