New approach to develop a 3D non-isothermal computational framework for injection molding process based on level set method☆
Xin Zhuang,Jie Ouyang*,Chuntao Jiang,Qingsheng Liu
Department of Applied Mathematics,Northwestern Polytechnical University,Xi'an 710129,China
1.Introduction
Injection molding is one of the most popular and useful polymer processing methods for mass producing plastic parts,which have been widely applied in many different fields such as electronic,automobile,medical technology,aerospace,and so on.The filling process is the most important stage in injection molding,and many defects ofproduct may arise during this stage,such as the filling shortage,gas traps,weld line,and flow mark.The proper selection of processing parameters is critical to obtain high quality plastic parts,that were traditionally resorted to the time consuming process oftrialand error.The numerical simulation of the filling process in injection molding has been proven to be a very valuable tool for the process engineer to predict potential defects and optimize the process conditions.It has attracted significant attention and interest from researchers.
Kim and Turng[1]and Cardozo[2]presented the development of mathematical models and numerical methods in the filling process of injection molding,from one-dimensional(1D)simulation to threedimensional(3D)analysis.Although many simulations of filling in a thin cavity based on the 2.5-dimensional(2.5D)Hele–Shaw flow approximation have been developed,these 2.5Dmodels presentseveral inherent limitations and cannot meet the requirements of simulation for high quality parts with complex geometries[3,4].Since the late 1990s,with the rapid development of numerical simulation technique,researchers have realized the importance of the full 3D numerical simulation in non-Newtonian fluids filling process of injection molding.Full 3Dsimulation cannot only accurately predictthe 3D flow behaviors within thick and complex cavities but also generate more accurate and detailed information related to the flow characteristics than that of2.5D simulation in thin cavity.Since the highly non-linear interaction between transient heat transfer,non-Newtonian fluids flow and moving interface challenges the accuracy,efficiency and stability of the full 3D filling analysis,such simulation hasn't become a commonly used tool.
In recent years,several researchers developed the full 3D numerical methods to obtain more high resolution results for injection molding.The finite element method(FEM)has been widely employed to simulate the 3D filling process because of its flexibility in dealing with complex geometries and arbitrary boundaries[5–7].Hetu et al.[5] firstly presented a 3D FEM to predict the velocity,pressure,and temperature fields along with the position of the melt interface in filling process.The flow front was captured by a pseudo-concentration method,a variation of the original volume of fluid(VOF)method and the model equations were solved using a Petrov–Galerkin(PG)method,while the rest of the equations were solved using a Galerkin formulation.Zhou et al.[6]used a 3D FEM to solve the filling process in injection molding by employing an equal-order pressure–velocity interpolation method for pressure and velocity fields and the flow analysis network(FAN)method for determining the melt front advancement.Recently,Wang and Li[7]presented an arbitrary Lagrandian–Eulerian(ALE)FEM for 3D isothermal non-Newtonian fluid flows in injection molding.However,for 3D simulation of filling process,the FEM tends to produce a large sparse matrix,which needs too much computer space and CPU time.
The boundary-element method(BEM)was widely used in cooling simulation of injection molding,and rarely used to solve the 3D filling process of injection molding.Khayat et al.[8]developed an adaptive Lagrangian 3D BEM to simulate the viscous incompressible Newtonian flow problem in polymer filling processes.However,the mesh re finement to capture the large deformation of the free surfaces could be computationally intensive,and the fundamental solution cannot be easily derived as in the case of non-linear problem.Thus,the utility of this method is severely impaired.The finite volume method(FVM)has been used extensively to solve the Navier–Stokes equations in the area of Newtonian fluid dynamics,which can utilize both time and computer space more efficiently.More importantly,the FVM applies the conservation principles to a fixed control volume,which is essential for convection dominant problems.Therefore,it has been developed to deal with the melt flow in injection filling.Chang and Yang[9]initially developed a FVM to simulate the 3D filling process in isothermal,high-viscous Newtonian fluids injection molding.Araujo et al.[10]employed a parallel FVM method to simulate the 3D non-isothermal melt filling stage in injection molding process.The interface between the melt front and gas were captured directly by the VOF method and the unstructured grids were used to deal with the complex cavity problems[9,10].However,the mesh generation tends to waste a lot of time and energy during the 3D filling simulation by using FVM based on the unstructured grids.
As previously mentioned,several numerical methods have been developed to track the moving interfaces in the filling stage.These methods are generally classified as Eulerian[3–6,9,10],Lagrangian[8],and ALE[7],depending on the selection of the referenced frame.The FAN method[3,4,6],pseudo-concentration method[5],and VOF method[9,10]have been widely used in the Eulerian framework to deal with the moving free surface in filling processes,but with lower resolution.It should be noted that the level set method introduced by Osher and Sethian[11]has been applied in various areas to capture the free interface based on Eulerian description for two-phase flow.The major virtue of the level set method is that it can handle complex topological merging and breaking naturally[12].In addition,it is comparatively easy for numerical implementation,and is more straightforward to develop in 3D space.Yang et al.[13]have simulated the 2D gas/melt interface in injection molding using the level set method[11,12,14,15].However,the 2D numerical simulation cannot give more accurate and detailed information for actual melt filling in injection molding.
This paper presents a full 3D two-phase flow model to predict the non-isothermal,non-Newtonian fluids filling process in injection molding,where the Cross-WLF model is used to describe the rheological behavior of polymer melt.Also,the governing equations for gas and melt are unified into a system namely the generalized Navier–Stokes equations,which provides a great convenience to the numerical implementation.The 3D numerical simulation is performed using an efficient and robust collocated FVM with the semi-implicit method for pressure linked equations consistent(SIMPLEC)algorithm.A high resolution level set method is employed to capture the gas/melt interface in 3D filling processes,and the domain extension method is presented to deal with the complex cavities.Two thin rectangular cavities(one of them with a cylindrical insert)are employed to verify the validity of the 3D numerical approach developed in this paper.As a more complex cavity,the melt filling process of a hemisphericalshellis also simulated with the present method.
2.Mathematical Model for 3D Filling Process
2.1.Level set equation and its re-initialization equation
Generally,3D filling process simulation requires solving the fluids flow equations and capturing the melt front interfaces at every time step until the cavity is completely filled with polymer melt.The level set function ϕ(x,t)is defined as a signed distance function,which has many good propertiesthatcan capture the interface implicitly and accurately under a velocity field u in two-or three-dimensional space.The value of ϕ(x,t)is computed to determine its zero level set at each time t on the entire computational region.For the injection molding,the melt/gas interface can be defined by the zero level sets of ϕ(x,t),that is Γ(t)={x|ϕ(x,t)=0}.We take ϕ(x,t)<0 in the gas region and ϕ(x,t)>0 in the melt region[13].The interface is captured by Hamilton–Jacobi equation based on Eulerian description of the level set function[11]:

where u is the velocity vector.However,after several or even one time step iteration,the level set function would not be a distance function any longer due to numerical diffusion.Therefore,a re-initialization process is executed directly by solving the re-initialization equation[14]:

where tPis a virtual time for re-initialization and the sign function sign(ϕ0)is defined as

whereΔx,Δy,andΔz are the grid widths along the x,y,and z directions,respectively.Furthermore,it is worth noting that the mass nonconservation issue can occur with the increase of computational time.Thus,we added a constraint in re-initialization Eq.(2)to improve the mass conservation property,and the details about this problem can be found in[14].
2.2.Governing equations
During the melt filling process,the melt flow is governed by the mass,momentum and energy conservation equations.The gasphase and the melt-phase are assumed to be immiscible and incompressible[13].The inertia is neglected due to being very small as compared with viscous force in polymer melt flow[6].For the gas–melt two-phase flow,the unified Navier–Stokes equations are

In the above equations,u,p and T denote the velocity vector,pressure and temperature,respectively.The parameters ρ,η,C and κ represent density,viscosity,specific heat and thermal conductivity,respectively.is the generalized shear rate,here d is the deformation rate tensor defined byTo avoid numerical instabilities atthe interface,the averaged materialproperties depending on ϕ are written as follows:

where Hε(ϕ)is a smoothed Heaviside function,which is defined as

whereεis the thickness ofthe interface and is usually taken as a factor of the spatial meshε=Δx.The subscripts g and m represent gas and melt phase,respectively.We use the following dimensionless variables:

where L,U and T0are the length scale,velocity scale and temperature scale,respectively.We define ξ=ρg/ρm, μ=ηg/ηm, θ=Cg/Cm, γ=κg/κm.For simplicity,the mark “*”is omitted,then ρ=ρ(ϕ)=ξ+(1−ξ)Hε(ϕ),η=η(ϕ)=μ+(1−μ)Hε(ϕ),C=C(ϕ)=θ+(1−θ)Hε(ϕ)and κ=κ(ϕ)=γ+(1−γ)Hε(ϕ).
The governing Eqs.(4)–(6)can be written in the dimensionless form as follows:

where Reynolds number Re=ρmUL/ηm,Peclet number Pe=ρmCmUL/κm,and Brinkman number Br=ηmU2/κmT0.
2.3.Cross-WLF model
The Cross model,which is the most appropriate for studying both filling and packing phases[3,13,16],is employed to assess the viscosity of the polymer melt:

where τ*is the model constant that shows the shear stress rate,from which the pseudoplastic behavior of melt starts,and n is the powerlaw index.The well-known Williams–Landel–Ferry(WLF)expression is adopted here to describe the viscosity of the melt under zero-shearrate conditions:

The parameters D1,D2,D3,A1,and A2are material constants,and each of them has its unique physical meaning.
2.4.Boundary conditions
At the inlet,the velocity component u is set to be a constant,and velocity components v=w=0.At the outlet,the homogeneous Neumann conditions is employed for u:∂u/∂n=0,where n denotes the normal direction of the outlet.On the mold walls,the no-slip boundary condition u=0 is imposed.As for the pressure boundary conditions,no-penetration boundary conditions are used for the melt,i.e.,∂pm/∂n=0.The gas in the cavity is assumed to be free to leave the mold[5],and we apply pg=0 for the cavity.
At the free surface,the surface tensions on the free interface can be neglected[5].The correct boundary conditions for the free surface are n·(Tm−Tg)=(pm−pg)·n,t1·(Tm−Tg)=(pm−pg)·n and t2·(Tm−Tg)=(pm−pg)·n,where n=(nx,ny,nz)is the unit normal vector to the free surface,while t1=(t1x,t1y,t1z)and t2=(t2x,t2y,t2z)are the unit tangential vectors to the free surface.Tg=2ηgd/Re and Tm=(2ηmd)/Re are the dimensionless gas and polymer melt contribution extra-stress tensors.The pressure,velocity and temperature boundary conditions for the free surface are pm=pg,um=ugand Tm=Tg,x∈Γ.
3.Numerical Methods
3.1.FVM discrete equations
The conservation governing equationsassociated with the initialand boundary conditions are solved by employing FVM[13,17,18]on the collocated grids.In this method,all quantities are stored at the center of the control volume,which considerably simplifies the complicated calculation procedures in full 3D filling process.The conservation Eqs.(13)–(15)can be written by a general form as follows:

where θ1,θ2,and δ are constants,Φ is the dependent variable,and SΦis the source term which contains all the terms that cannot be incorporated into the convection and diffusion terms.θ1,θ2,δ,Φ and SΦin Eq.(18)are given in Table 1.
Eq.(18)is integrated over a control volume V and the Gauss divergence theorem is used to the convective and diffusive terms to get

The final form of the 3D discretized equation over the control volume can be written as follows:

where nb denotes all neighbor cells of node P,and aPand anbare determined by the discretizing schemes of convection term and diffusion term.In addition,the first order upwind scheme is used to discretize the convective term of the energy equation,which can overcome the spatial oscillations of temperature in simulation.Central scheme is employed to discretize the diffusion terms of Eq.(18)and the convective terms of the momentum equations.In fact,the pressure gradient term in the momentum equation is a source term without anindependent equation.In this study,the SIMPLEC algorithm[17,18]is employed to improve convergence and calculate the coupled governing equations.In order to avoid the pressure–velocity decoupling while computing the face volume fluxes in the momentum equation,a momentum interpolation technique proposed by Oliveira et al.[19]is employed.

Table 1 De finition of constants and functions in the general transport Eq.(18)
3.2.Level set equation solver and domain extension method
The level set Eq.(1)and its re-initialization Eq.(2)belong to the Hamilton–Jacobi type.Attention must be paid to discretization of the convection term,which can cause much numerical error and instability in the presence of discontinuities or steep fronts[20].Therefore,high resolution spatial discretization schemes must be used to obtain suf ficiently accurate results.Jiang and Shu[21]presented a fifth-order weighted essentially non-oscillatory(WENO)scheme to discrete the spatial derivative,which is robust and efficient for solving complicated shock and flow structures.Later,Jiang and Peng[22]constructed a fifth-order WENO scheme based on the third order ENO scheme,which shared many features with the WENO scheme in[21].Extensive shock calculationshave demonstrated thatWENO scheme ismore accurate and robustthan the base ENO schemes.In this paper,the fifth-order WENO scheme presented by Jiang and Peng[22]is employed for spatial discretization ofEqs.(1)and(2).In addition,to avoid any instability and divergence in the temporal integration,a third-order total variation diminishing(TVD)Runge–Kutta scheme[13,18,22]is applied for the time discretization.Details of the WENO and TVD schemes can be found in[22].
Generally,the unstructured grids or body- fitting grids are used to deal with the irregular regions.However,the mesh generation has the expensive computational cost in 3D simulation.Nie and Armaly[23]successfully applied a domain extension method to simulate the 3D laminar forced convective flow adjacent to a backward-facing step,and the details of this method were presented in[23].Korichi and Oufer[24]employed this method to solve the heat transfer and fluid flow in a rectangular channel containing obstacles on the upper and lower walls.In recently,Li et al.[18]used this relatively simple and effective method to simulate the gas-assisted injection processes in 2D irregular cavities.Yang and Mao[25]proposed a mirror fluid method forsimulating solid– fluid two-phase flow,which is very efficientto handle the solid– fluid flow problem in complex domain.In their research,the no-slip boundary condition was enforced implicitly on solid– fluid surface segments by the mirror relations.In this work,we employ the domain extension method to deal with an irregular domain in 3D filling process simulation.The irregular computational domain is extended to the minimum cuboid in 3D which contains the solid region,the structured grids can thus be used in the entire computational domain without using unstructured or body- fitted grids.Therefore,the numerical algorithm can be implemented conveniently based on the solved parameters on the computational nodes.
We take the rectangular cavity with a cylindrical insert for an example and illustrate the implementation of the domain extension technique,as shown in Fig.1.The melt filling area is an irregular domain which bypasses the solid region(cylindrical insert).We extend the irregular fluid filling domain to a cuboid which contains the solid region(insert).Then we need to define a “shape level set”function to distinguish the solid region and the irregular computational domain:

where(x,y,z)is an arbitrary point in the cuboid,(x0,y0,z0)is the center coordinate of the cylindrical insert,and r is the cylindrical radius.It is obvious that the shape level set function satis fies the criteria:ψ(x,y,z)>0 in the melt filling area(the fluid domain)and ψ(x,y,z)<0 in the solid region.In the solid region,the dynamic viscosity is set to be a very large value for momentum equation(such as 1020),while the thermal conductivity is set to be a very small value for energy equation(such as 10−20).
4.Results and Discussion
In this section,we employ two thin rectangularcavities(one ofthem with a cylindricalinsert)to verify the validity and accuracy ofthe 3Dnumerical method and domain extension technique presented in this paper at first.Then,a more complex example is investigated:injection molding of a hemispherical shell.Numerical simulations are performed with an in-house FORTRANcomputercode on an inter core i7-4790 processor with 3.6 GHZ.The polymer material polypropylene(PP)and acrylonitrile-butadiene-styrene(ABS)are selected in this work,which are widely used in injection molding industry.The Cross-WLF modelparameters for PP[26]and ABS[27]are shown in Table 2.
In order to study the rheological properties of the two materials and assess the effect of the temperature upon the polymer viscosity,the complex viscosity variation with shear rate at different temperatures for PP and ABS is shown in Fig.2,which is the results of best fit of PP and ABS at different temperatures based upon Eqs.(16)and(17).A lower melt temperature can lead to a higher viscosity,and when the shear rate is relatively low,the temperature has a large impact on viscosity.

Table 2 Parameters of Cross-WLF model for PP and ABS
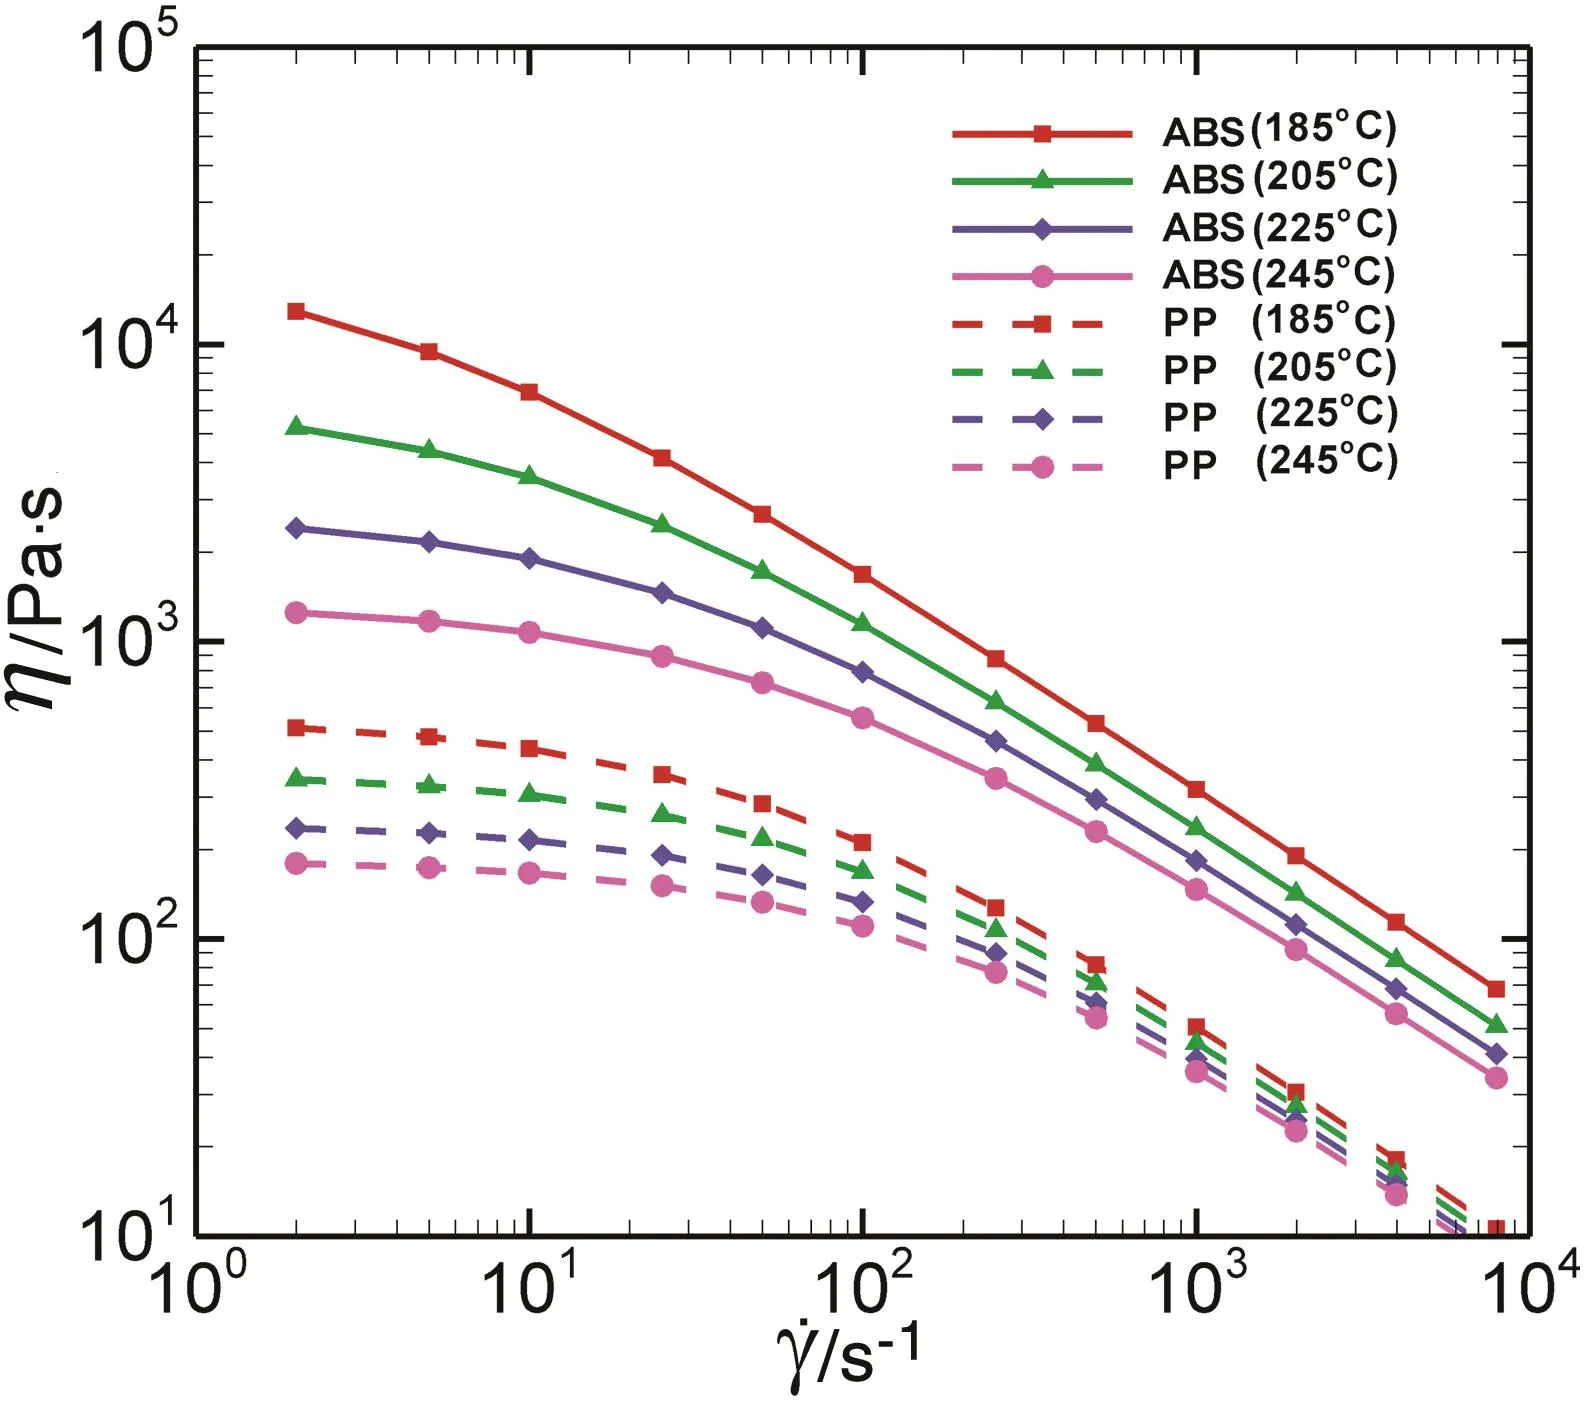
Fig.2.Viscosity versus shear rate atdifferenttemperatures based on the Cross-WLF model.
4.1.Melt filling in a thin rectangular plate
As a first test example,we consider a thin rectangular plate(20 cm×5 cm×0.5 cm),as shown in Fig.3.The initial PP melt interface is set to be a small hemisphere,and the initial injection velocity is 8 m·s−1.The inlet polymer melt temperature is set to be 500 K,while the mold temperature is 320 K.The density,specific heat,and thermal conductivity of PP melt are ρ=775 kg·m−3,C=2830 J·kg−1·K−1,and κ=0.19 W·m−1·K−1,respectively.The zero-shear viscosity of PP melt at the temperature Tmelt=500 K is η0=245 Pa ·s.The dimensionless parameters are given as Re=0.032,Pe=115434.2,and Br=1286.63,respectively.A grid of 152×52×16 is selected for this simulation.It should be noted that the length,velocity and temperature scales in this paper are chosen as L=0.01 m,U=1 m·s−1and T0=1 K,respectively.The density,specific heat,and thermalconductivity ofgas areρg=1.29 kg·m−3,Cg=1000 J·kg−1·K−1,and κg=0.024 W·m−1·K−1,respectively.Since the gas has very low viscosity,the viscosity ratio of the gas to polymer melt is assumed to be ηg/ηm=0.001.

Fig.3.Sketch map of the thin rectangular plate.
Fig.4 gives the qualitative comparison of melt fronts among the ANSYS CFX results[26],the MOLDFLOW results[26]and the present results at three time instants in filling process.It is obvious that the melt front interfaces predicted by our method are in good agreement with those obtained by using ANSYS CFX and MOLDFLOW softwares in[26].The results show that the simulation procedure used in this study can accurately predict the filling process in a 3D thin cavity.During the filling process,the melt front interfaces are mainly affected by the temperature of polymer melt.As shown in Fig.2,a lower melt temperature can lead to a higher viscosity.Thus,one of the important reasons for the change of melt front interface may be heat transfer.As Han[28]has pointed out,the melt spreads in an approximately semicircular shape in the beginning.When the melt front reaches the side mold corners near the gate,the melt front gradually changes from a semicircular shape to an almost flat shape due to small cavity thickness.The polymer melt is pushed forward until the thin rectangular cavity is completely filled with melt.

Fig.4.Comparison of melt fronts among ANSYS CFX results[26]( first row),MOLDFLOW results[26](second row)and the present results(third row)at different times:(a)t=0.05 s,(b)t=0.22 s,(c)t=0.91 s.
Fig.5 shows the melt velocity vectors at t=0.22 s and t=0.91 s on x–z plane(y=2.5 cm mid-plane)and x–y plane(z=0.25 cm midplane),respectively.It is obviously that the velocity vectors of melt change a lotwith different x values,and the velocity gradually decreases along the flow direction.In addition,the velocity decreases gradually from the center area to the mold walls,which is distributed as a parabola near the advancing flow front.The deformation of fluid elements in the flow front can have considerable effects on the molecular orientation and flow-induced stresses in injection molded products[9].
The temperature distributions at t=0.22 s and t=0.91 s on x–z plane(y=2.5 cm mid-plane)and x–y plane(z=0.25 cm mid-plane)are given in Fig.6a and b,respectively.Fig.6 indicates thatthe melttemperature is compatible to the melt velocity,which in fluences the shape of melt front.By comparing the temperature distributions at t=0.22 s and t=0.91 s on x–z plane,we can see that low temperature region near the mold walls at t=0.91 s is larger than t=0.22 s.In addition,the temperature field nearthe free surface decreases due to the convective heat transfer process between the melt and the gas.
4.2.Melt filling in a rectangular plate with an insert
In order to show the validity of the domain extension technique,we consider the complex filling process in a rectangular plate(10 cm×5 cm×0.35 cm)with an obstacle(cylindrical insert with a radius of 1 cm)at the center of the mold.The sketch map of the cavity is shown in Fig.7.The melt temperature and the mold temperature are 508 K and 353 K,respectively.The melt is injected into the mold with a velocity of 7 m·s−1.The density,specific heat,and thermal conductivity of ABS melt are ρ=960.6 kg·m−3,C=2000 J·kg−1·K−1,and κ=0.19 W·m−1·K−1,respectively.The zero-shear viscosity at melt temperature Tmelt=508 K is η0=1877 Pa·s.The dimensionless parameters are given as Re=0.005,Pe=101150.8,and Br=9879.05,respectively.
In order to test the grid convergence of the numerical method,three different grids of M1(52×27×9),M2(102×52×16)and M3(202×102×30)are used.The quantitative comparisons of velocity component u along the y-axis on the z=0.175 cm mid-plane at t=2.4 s,x=0.5 cm and x=6.5 cm using the three grids are shown in Fig.8,which verify that the numerical method has good grid convergence for simulating the complex fluid flow in irregular cavity.The grid of M2 is adopted for the subsequent simulations.
Fathi and Behravesh[29]presented an experimental method for measuring the advancement of the melt flow front during the filling stage of injection molding in the same cavity.Fig.9 gives the comparison of experimental and numerical results at different times,from which we can see that the numerical results in this work agree with the experimental results.This indicates that the level set method with the domain extension technique presented in this papercan capture the free interface accurately for complex flows in 3D irregular cavity.

Fig.5.Distributions of melt velocity vectors at(a)t=0.22 s and(b)t=0.91 s on x–z plane( first row)and x–y plane(second row).
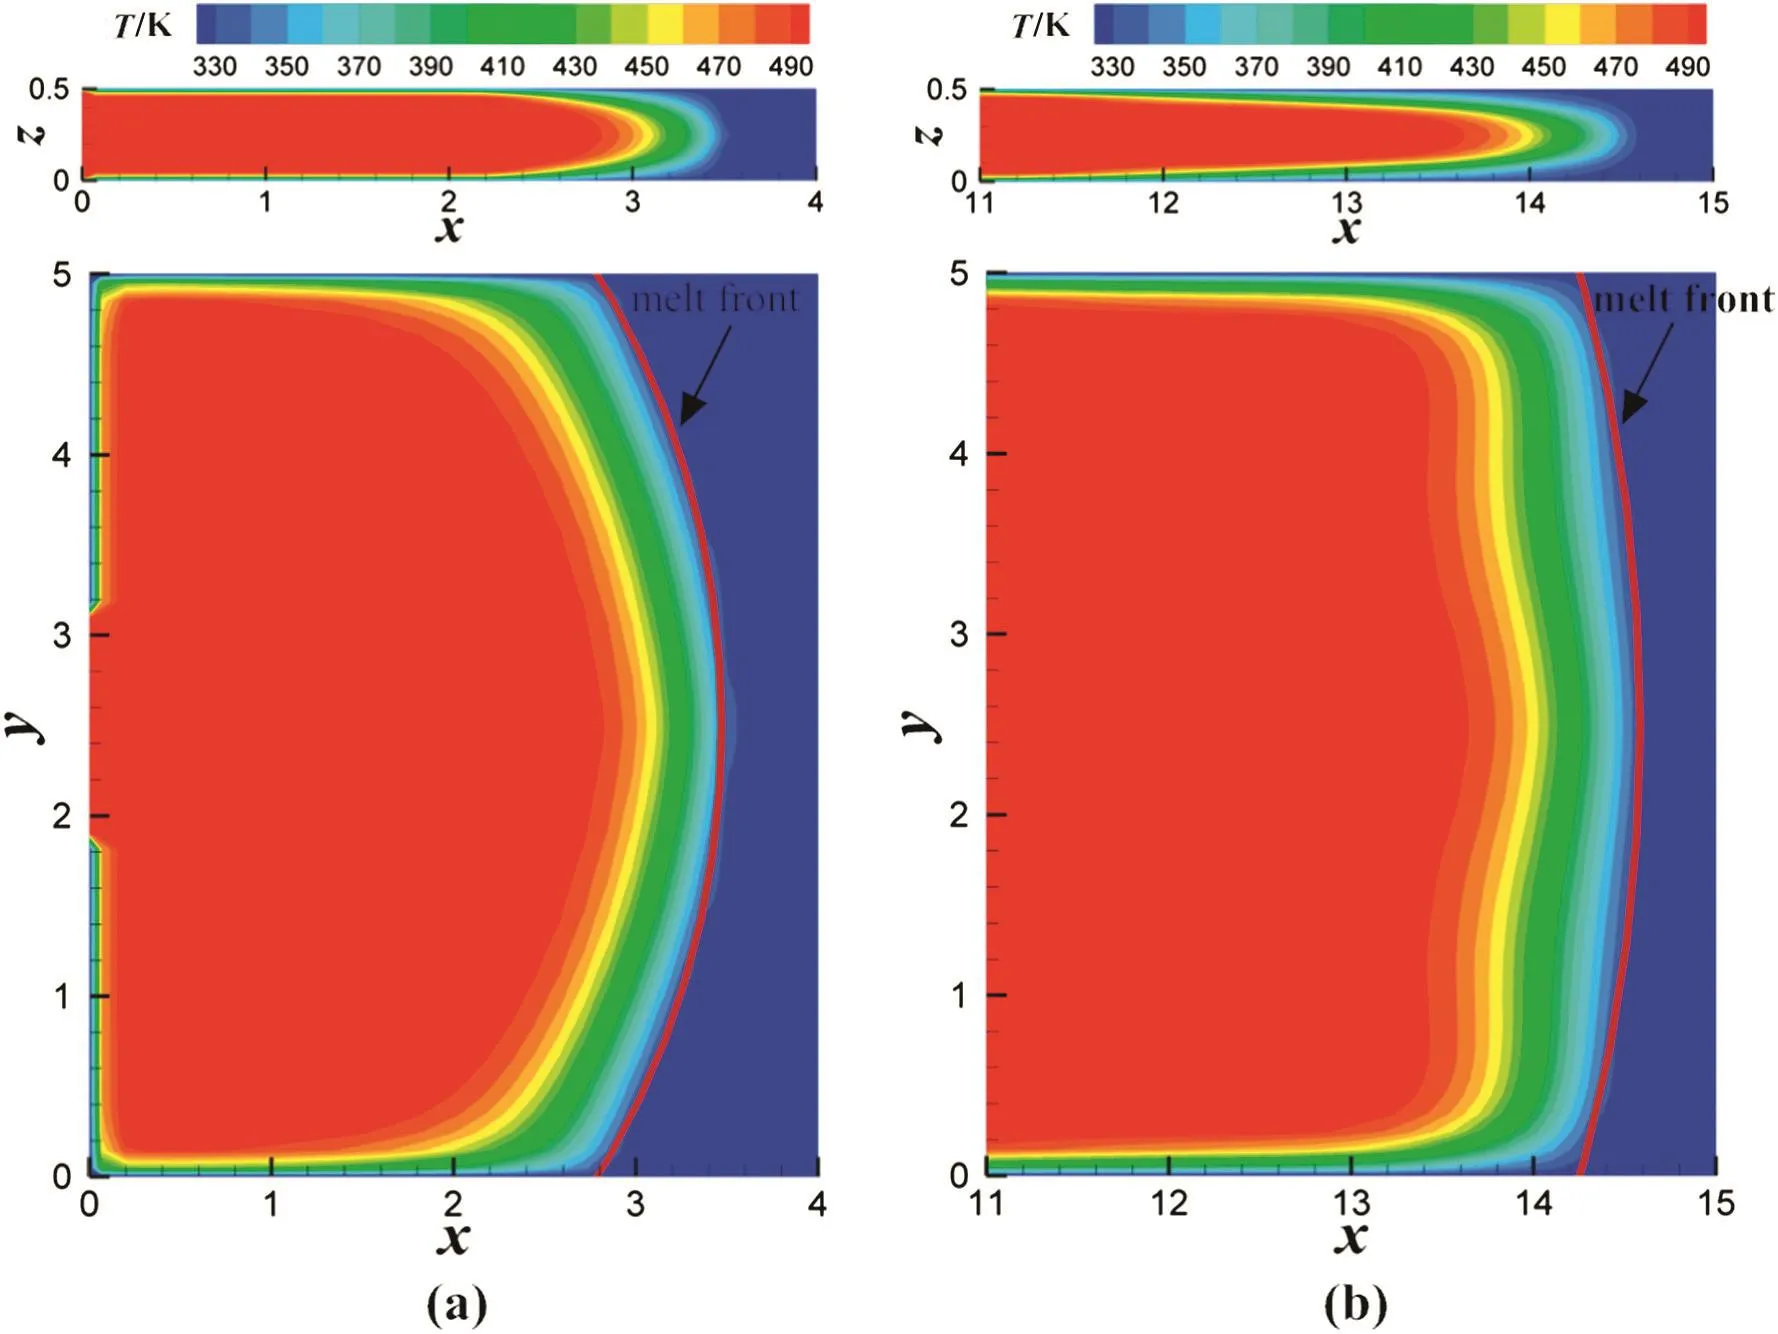
Fig.6.Distributions of temperature at(a)t=0.22 s and(b)t=0.91 s on x–z plane( first row)and x–y plane(second row).
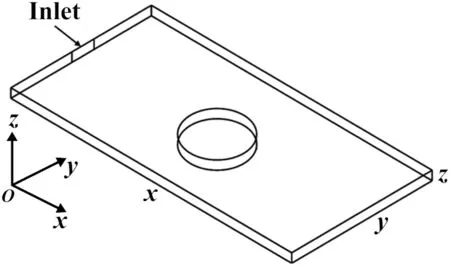
Fig.7.Sketch map of the rectangular plate with a cylindrical insert.
Itshould be noted that Fig.9 only includes the region around the cylinder.The evolution of the melt flow front during the filling process in the whole domain of the cavity is shown in Fig.10.The polymer melt is divided into two streams when it contacts the insert.After the two separated streams turn around the cylindrical insert,the two melt branches meet at the same point behind the insert and from where the weld line begins to form,which is undesirable because it has a significant effect on the mechanical properties and surface appearance of the final plastic parts[30].In addition,we can clearly see from Fig.10(c)that a small hole appears between the insert and the meet point of the two streams,which may cause gas to be trapped.However,as the injection time goes on,the hole gets smaller and smaller,as shown in Fig.10(d).The very small hole is finally filled with melt and the two streams of melt reunion into one stream,and the melt moves forward until the mold is completely filled.The simulation results confirm the conclusion of Fathiand Behravesh[30].In order to improve the properties of products,we have to effectively eliminate the gas trap and enhance the weld line strength by designing reasonable mold structure and choosing appropriate processing parameters.
Fig.11 shows the distributions of the melt velocity vectors on x–y plane(z=0.175 cm mid-plane)around the insert at t=1.7 s and the horizontal melt velocity u on y–z plane in various cross-sections:x=1,3,5,7,9 cm at the end of filling,respectively.As can be seen from Fig.11,the velocity field changes obviously and the melt velocity is very small in front and at the back of the insert,as well as near the solid walls due to the effects of cooling from the cylinder and mold walls.In addition,the velocity of the melt is zero between the insert and the meeting pointofthe two streams at t=1.7 s,this region is filled with gas.The 3D simulation procedure is available for predicting the complex flow behaviors of polymer melt in filling process.
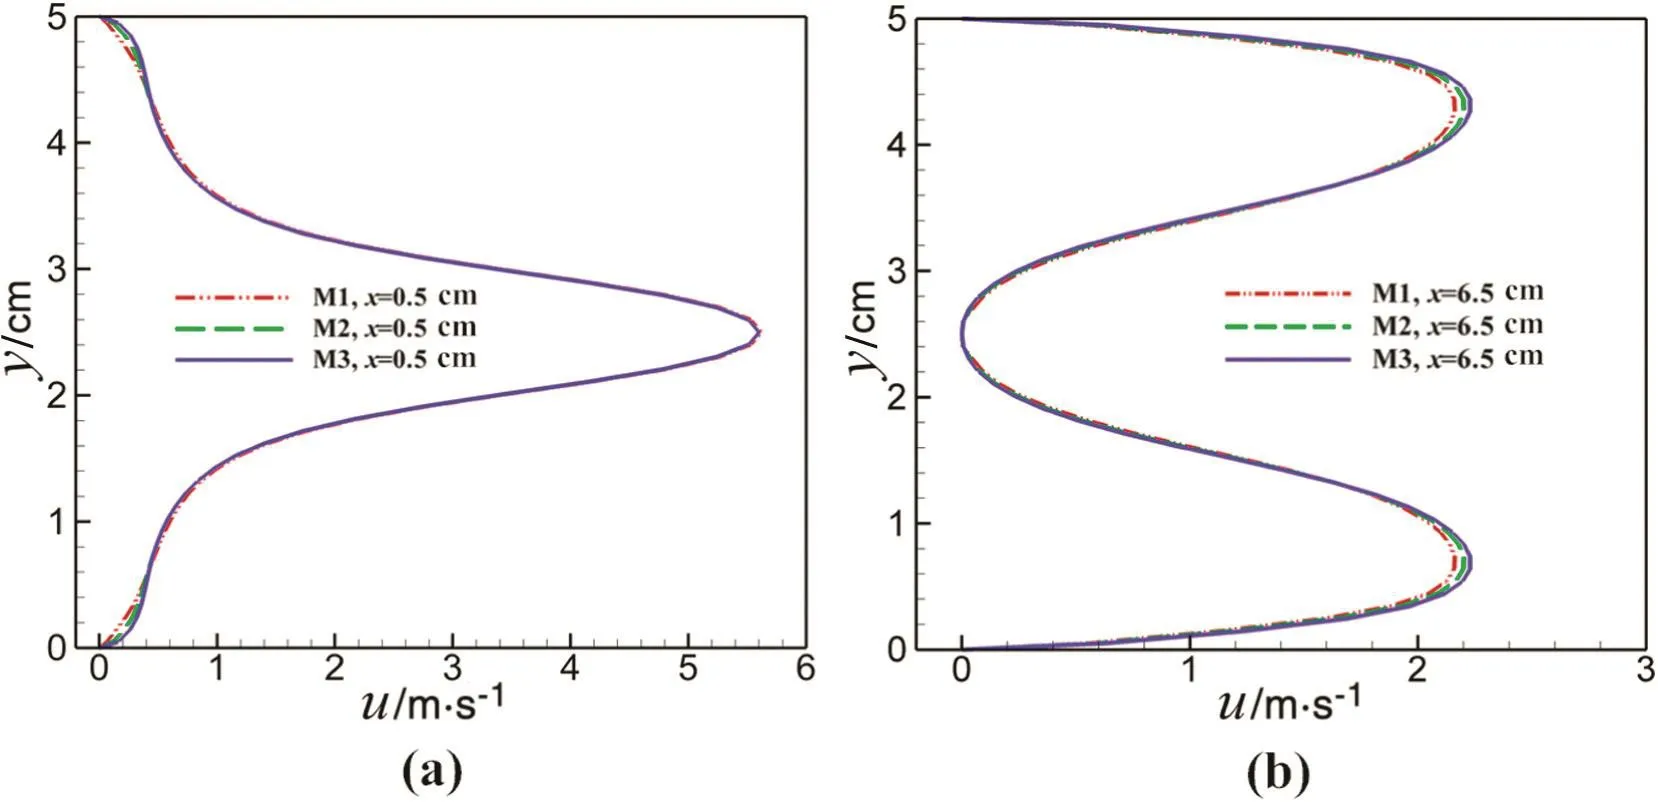
Fig.8.Convergence analysis for u at(a)x=0.5 cm and(b)x=6.5 cm with different grids.
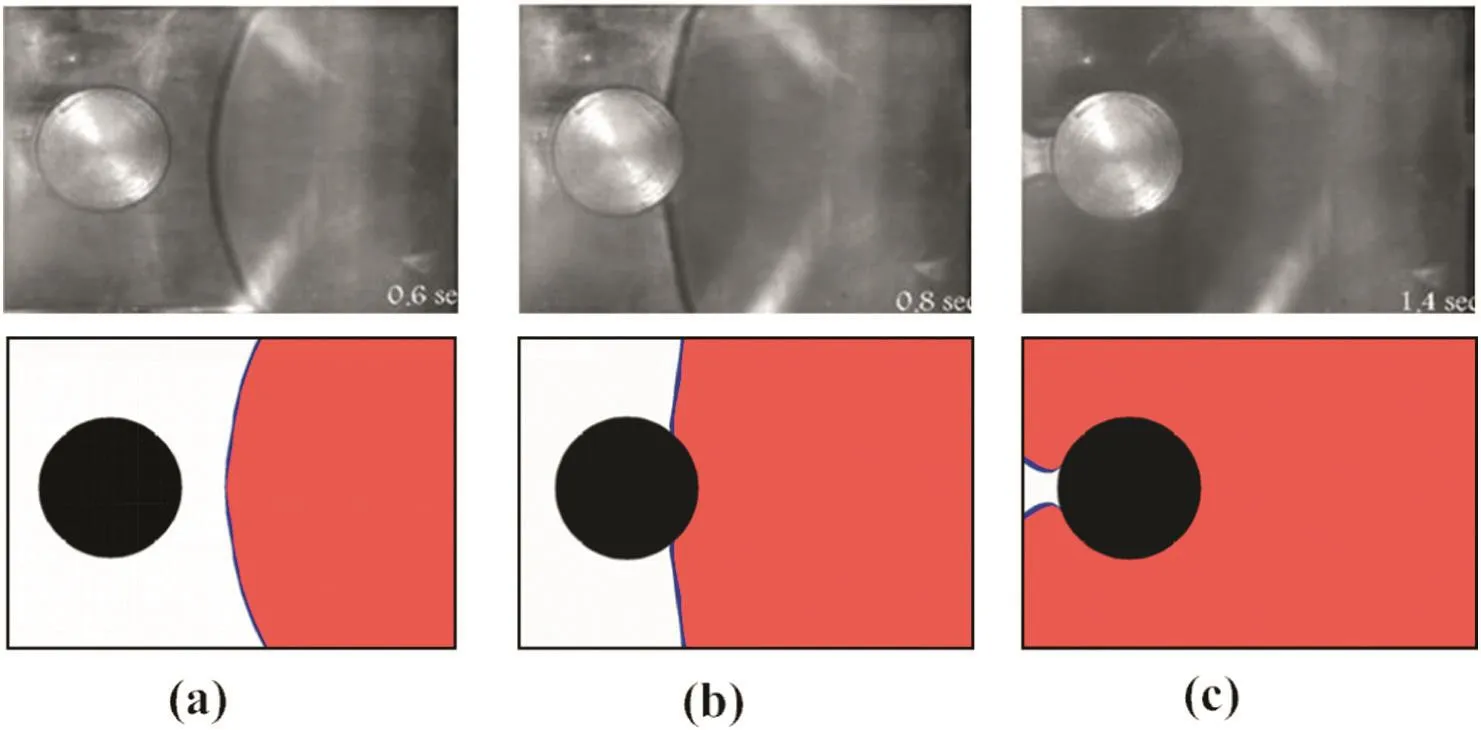
Fig.9.Comparison ofmeltfrontcontours between the experimentalresults[29]( firstrow)and the presentresults(second row)atthree differenttimes:(a)t=0.6 s,(b)t=0.8 s,(c)t=1.4 s.
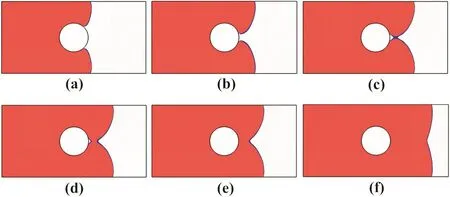
Fig.10.Melt front evolution at different times:(a)t=1.2 s,(b)t=1.4 s,(c)t=1.7 s,(d)t=1.74 s.(e)t=1.8 s,(f)t=2.4 s.

Fig.11.Distributions of(a)the meltvelocity vectors on x–y plane around the insert at t=1.7 s and(b)the melt velocity u on y–z plane in various cross-sections:x=1,3,5,7,9 cm atthe end of filling.
Figs.12 and 13 give the distributions of temperature and pressure at the end of filling stage on x–y plane(z=0.175 cm mid-plane)and y–z plane,respectively.We can see that the distributions of temperature and pressure are not homogeneous at the core and skin,as well as behind the insert.A narrow zone oflow temperature and low pressure appears along the melt recombined region.Then the weld line appears behind the insert,which is undesirable as previously stated.In addition,the low temperature is observed near the mold walls due to the heat transfer,and the pressure values are gradually decreasing from the inlet to the end of the cavity.
4.3.Melt filling in a hemispherical shell
Finally,we simulate the filling of the polymer melt in a more complex geometry shape,a hemispherical shell cavity as shown in Fig.14.The externaland internalradiuses ofthe cavity are 15 cm and 12 cm,respectively,and the thickness of the cavity is 3 cm.The ABS melt is injected through a small round inlet located at the top of the cavity and the initial melt interface is set to be a small hemisphere with a radius of 2.5 cm.Furthermore,the corresponding parameters for ABS melt are the same as those given in Subsection 4.2.The melt temperature of inlet and the mold temperature are 508 K and 353 K,respectively.The injection velocity atthe inletis setto be 15 m·s−1,and a uniform grid of 62×122×122 is used.

Fig.12.Distributions of temperature at the end of filling on(a)x–y plane and(b)y–z plane in various cross-sections:x=1,3,5,7,9 cm.
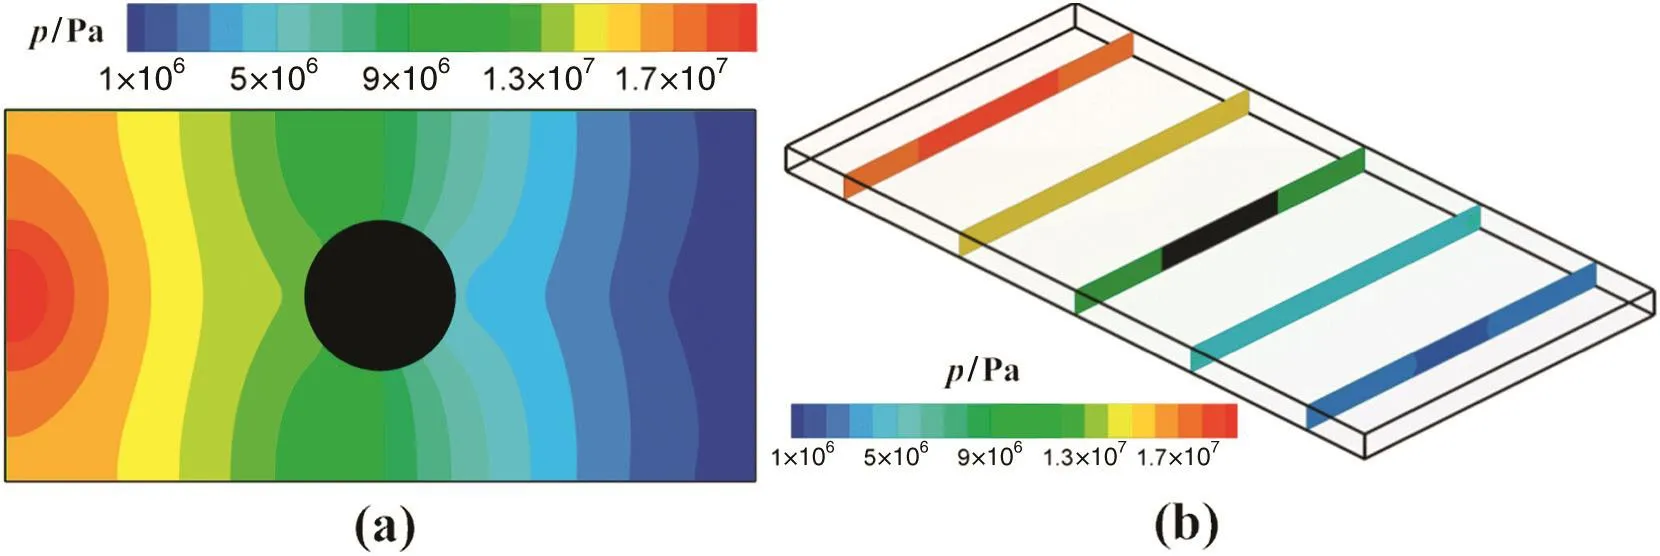
Fig.13.Distributions of pressure at the end of filling on(a)x–y plane and(b)y–z plane in various cross-sections:x=1,3,5,7,9 cm.
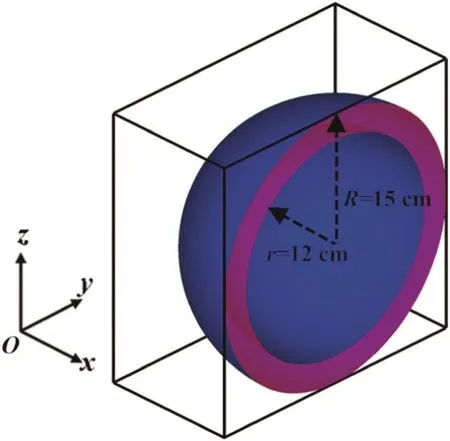
Fig.14.Sketch map of the hemispherical shell.
The meltfrontinterfaces of filling process atdifferenttimes in the 3D cavity and x–z plane(y=15 cm mid-plane)are presented in Figs.15 and 16,respectively.The initial interface is shown at t=0 s,and the melt is pushed ahead along with the hemispherical shell cavity in symmetry.Asclearly shown in Fig.16,before the meltreaches the rightwall,the interface is a curve shaped with big curved radius.The results show thatthe levelsetmethod with the domain extension technique presented in this papercan successfully dealwith the complex fluid in 3D filling process for the part with complicated geometry.

Fig.15.Melt front evolution in 3D space at different times:(a)t=0 s,(b)t=0.1 s,(c)t=0.2 s,(d)t=0.5 s,(e)t=1.2 s,(f)t=2.2 s.
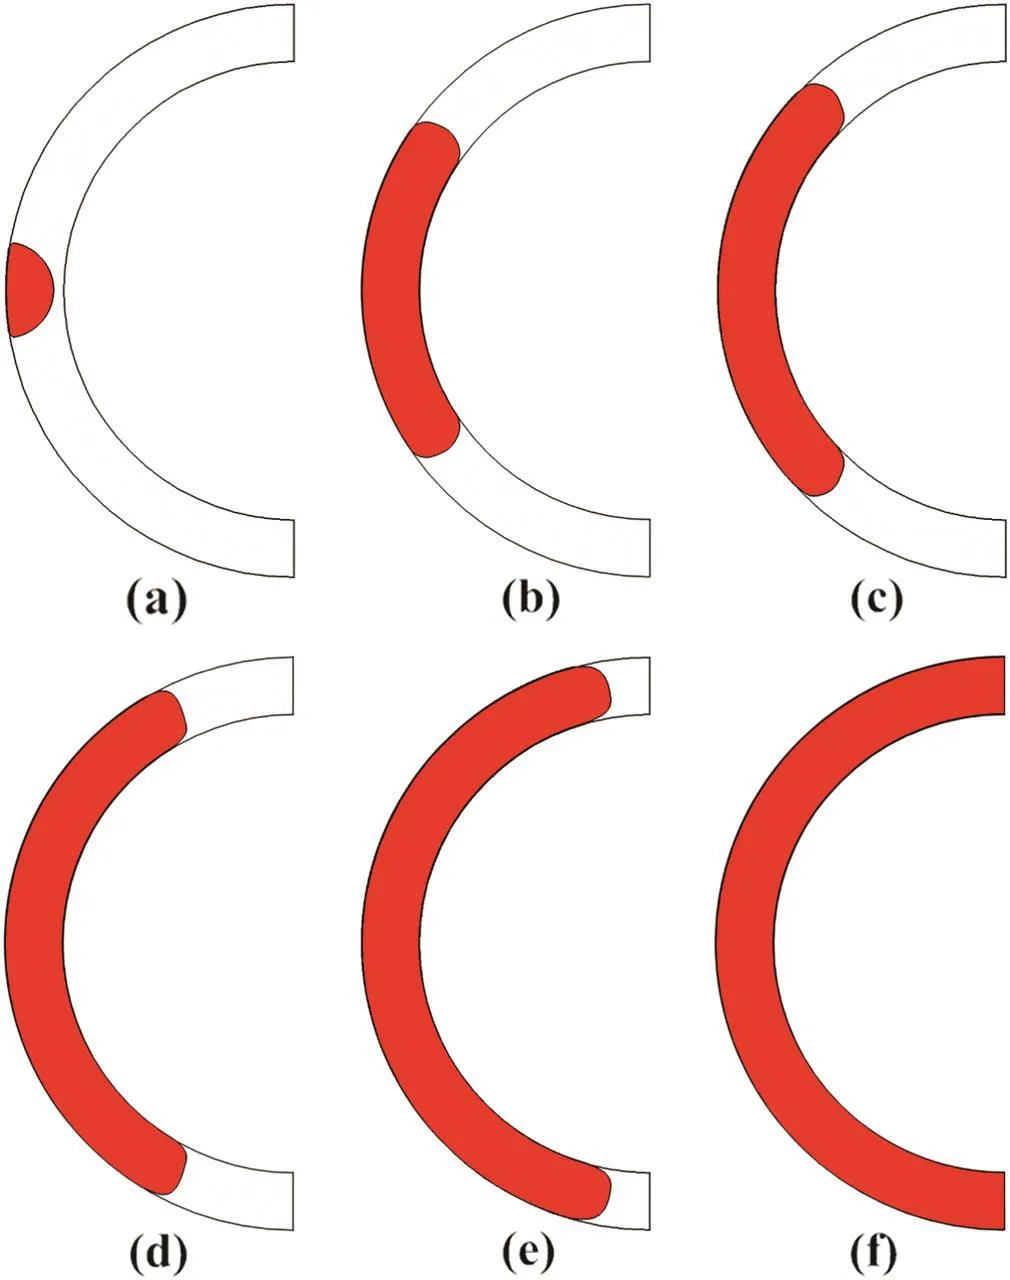
Fig.16.Melt front evolution on x–z plane at different times:(a)t=0 s,(b)t=0.1 s,(c)t=0.2 s,(d)t=0.5 s,(e)t=1.2 s,(f)t=2.2 s.
Fig.17 shows the temperature distributionson x–z plane(y=15 cm mid-plane)at t=0.2 s and t=2.2 s in non-isothermal melt filling process,respectively.The values of melt temperature near the mold walls and the free surface are lower than other regions,as described in the previous subsection.Fig.18 shows the pressure distributions on x–z plane(y=15 cm mid-plane)at t=0.2 s and t=2.2 s,respectively.The pressure at the top of the cavity(near the inlet)keeps the maximum value,which is gradually decreasing along the flow direction.More importantly,the pressure increases gradually in the cavity with the increase of the filling time.
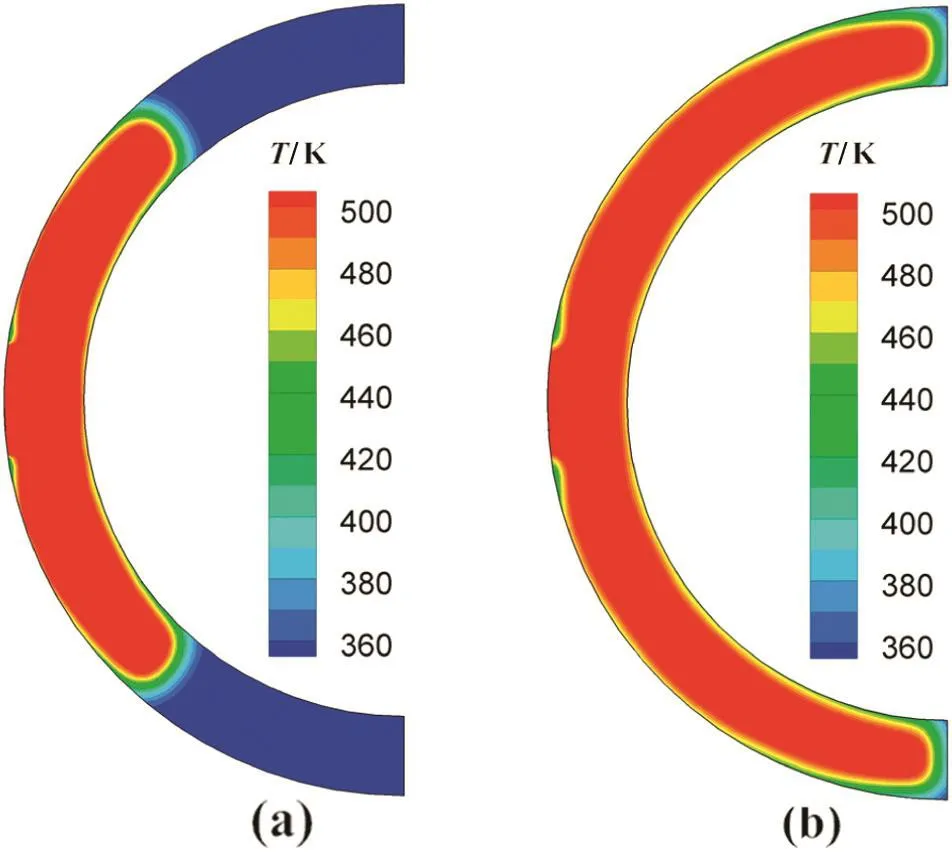
Fig.17.Distributions of temperature on x–z plane at different times:(a)t=0.2 s,(b)t=2.2 s.

Fig.18.Distributions ofpressure on x–z plane atdifferenttimes:(a)t=0.2 s,(b)t=2.2 s.
5.Conclusions
A full 3D two-phase flow model and the corresponding numerical methods have been introduced to simulate the non-isothermal,non-Newtonian polymer melt filling process in complex cavities.Three typical numerical examples are provided to validate the rationality of this 3D modeland illustrate the effectiveness ofthe numericalmethods.
The melt filling process in a thin rectangular cavity is simulated,and the simulation results are validated by comparing with those obtained by using MOLDFLOW and ANSYS CFX.The numerical results demonstrate that the collocated FVM with SIMPLEC algorithm combined with the level set method can provide stable and accurate results for 3D filling process,and it is easy to implement in 3D space for the complex flow of filling process on a personal computer.
Compared with the experimental results for melt filling process in a rectangular cavity with a cylindricalinsert,the numericalresults show a very good agreement.The level set method coupled with the domain extension technique can successfully deal with the complex cavity during filling process,which greatly reduces the computational complexity.The distributions of temperature,pressure and velocity along the gap-wise direction are simulated successfully,which show that the present 3D simulation procedure could offer more accurate and detailed information related to the flow characteristics than that of 2.5D simulation.
The filling process of a hemispherical shellcavity is successfully simulated.Obviously,the 3D numerical dynamic technology presented in this paper is an important step toward predicting the complex behaviors of polymer melt in filling process from the theoretical point of view,which can further deepen the understanding of actual injection molding process and can be used as a helpful tool for the optimal designs of injection molding.
Nomenclature
A1material constant
A2material constant,K
Br Brinkman number,Br=ηmU2/κmT0
C specific heat,J·kg−1·K
D1material constant,Pa·s
D2material constant,K
D3material constant,K·Pa−1
HεHeaviside function
L length scale,m
n power-law index
p pressure,Pa
Pe Peclet number,Pe=ρmCmUL/κm
Re Reynolds number Re=ρmUL/ηm
T temperature,K
T0temperature scale,K
U velocity scale,m·s−1
u velocity vector,m·s−1
˙γshear rate,s−1
η dynamic viscosity,Pa·s
κ thermal conductivity,W·m−1·K
ρ density,kg·m−3
τ* Cross-WLF model constant,Pa
ϕ level set function
ϕ0initial value of level set function
Subscripts
g gas phase
m melt phase
[1]S.W.Kim,L.S.Turng,Developments of three-dimensional computer-aided engineering simulation for injection moulding,Model.Simul.Mater.Sci.Eng.12(2004)S151–S173.
[2]D.Cardozo,Three models of the 3D filling simulation for injection molding:A brief review,J.Reinf.Plast.Compos.27(2008)1963–1974.
[3]H.H.Chiang,C.A.Hieber,K.K.Wang,A unified simulation of the filling and post filling stages in injection molding.Part I:Formulation,Polym.Eng.Sci.31(2)(1991)116–124.
[4]H.M.Zhou,D.Q.Li,Filling simulation and gas penetration modeling for gas-assisted injection molding,Appl.Math.Model.27(2003)849–860.
[5]J.F.Hetu,D.M.Gao,A.Garcia-Rejon,G.Salloum,3D finite element method for the simulation of the filling stage in injection molding,Polym.Eng.Sci.38(2)(1998)223–236.
[6]H.M.Zhou,T.Geng,D.Q.Li,Numerical filling simulation of injection molding based on 3D finite element model,J.Reinf.Plast.Compos.24(2005)823–830.
[7]X.P.Wang,X.K.Li,Numerical simulation of three dimensional non-Newtonian free surface flows in injection molding using ALE finite element method,Finite Elem.Anal.Des.46(2010)551–562.
[8]R.E.Khayat,C.Plaskos,D.Genouvrier,An adaptive boundary-element approach for 3D transient free surface cavity flow,as applied to polymer processing,Int.J.Numer.Methods Eng.50(2001)1347–1368.
[9]R.Y.Chang,W.H.Yang,Numerical simulation of mold filling in injection molding using a three-dimensional finite volume approach,Int.J.Numer.Methods Fluids 37(2001)125–148.
[10]B.J.Araújo,J.C.F.Teixeira,A.M.Cunha,C.P.T.Groth,Parallel three-dimensional simulation of the injection molding process,Int.J.Numer.Methods Fluids 59(2009)801–815.
[11]S.Osher,J.A.Sethian,Fronts propagating with curvature-dependent speed:Algorithms based on Hamilton–Jacobi formulation,J.Comput.Phys.79(1988)12–49.
[12]S.Osher,R.Fedkiw,Level set methods and dynamic implicit surfaces,Springer-Verlag,New York,2002.
[13]B.X.Yang,J.Ouyang,C.T.Liu,Q.Li,Simulation of non-isothermal injection molding for a non-Newtonian fluid by level set method,Chin.J.Chem.Eng.18(4)(2010)600–608.
[14]M.Sussman,E.Fatemi,P.Smereka,S.Osher,An improved level set method for incompressible two-phase flows,Comput.Fluids 27(5–6)(1998)663–680.
[15]C.Yang,Z.S.Mao,An improved levelset approach to the simulation ofdrop and bubble motion,Chin.J.Chem.Eng.10(3)(2002)263–272.
[16]T.Boronat,V.J.Segui,M.A.Peydro,M.J.Reig,In fluence of temperature and shear rate on the rheology and processability of reprocessed ABS in injection molding process,J.Mater.Process.Technol.209(2009)2735–2745.
[17]J.P.Van Doormaal,G.D.Raithby,Enhancements of the SIMPLE method for predicting incompressible fluid flows,Numer.Heat Transfer 7(1984)147–163.
[18]Q.Li,J.Ouyang,X.J.Li,G.R.Wu,B.X.Yang,Numerical simulation of gas-assisted injection molding process for a door handle,Comput.Model.Eng.Sci.74(4)(2011)247–267.
[19]P.J.Oliveira,F.T.Pinho,G.A.Pinto,Numerical simulation of non-linear elastic flows with a general collocated finite-volume method,J.Non-Newtonian Fluid Mech.79(1998)1–43.
[20]C.Yang,Z.S.Mao,Numerical simulation of interphase mass transfer with the level set approach,Chem.Eng.Sci.60(2005)2643–2660.
[21]G.S.Jiang,C.W.Shu,Ef ficient implementation of weighted ENO schemes,J.Comput.Phys.126(1996)202–228.
[22]G.S.Jiang,D.P.Peng,Weighted ENO schemes for Hamilton–Jacobi equations,SIAM J.Sci.Comput.21(6)(2000)2126–2143.
[23]J.H.Nie,B.F.Armaly,Three-dimensional convective flow adjacent to backwardfacing step-effects of step height,Int.J.Heat Mass Transf.45(2002)2431–2438.
[24]A.Korichi,L.Oufer,Numerical heat transfer in a rectangular channel with mounted obstacles on the upper and lower walls,Int.J.Therm.Sci.44(2005)644–655.
[25]C.Yang,Z.S.Mao,Mirror fluid method for numerical simulation of sedimentation of a solid particle in a Newtonian fluid,Phys.Rev.E 71(2005)036704.
[26]L.K.Jiao,L.X.Wang,Q.Li,C.Y.Shen,3D simulation of filling stage in injection molding based on ANSYS CFX,Polym.Mater.Sci.Eng.28(3)(2012)156–160(in Chinese).
[27]C.Y.Shen,Theory and method of numerical simulation and mold optimization design for injection molding,Science Press,Beijing,2009(in Chinese).
[28]C.D.Han,Rheology and processing of polymeric materials,Oxford University Press,Oxford,2007.
[29]S.Fathi,A.H.Behravesh,Real-time measurement of flow front kinematics using quantitative visualization in injection molding process,Polym.Eng.Sci.48(2008)598–605.
[30]S.Fathi,A.H.Behravesh,Visualization analysis of flow behavior during weld-line formation in injection molding process,Polym.Plast.Technol.47(2008)666–672.
 Chinese Journal of Chemical Engineering2016年7期
- Chinese Journal of Chemical Engineering的其它文章
- Vanadium oxide nanotubes for selective catalytic reduction of NO x with NH3
- Optimal design for split-and-recombine-type flow distributors of microreactors based on blockage detection☆
- Theoreticalpredictions ofviscosity ofmethane under confined conditions☆
- Permeabilization of Escherichia coli with ampicillin for a whole cell biocatalyst with enhanced glutamate decarboxylase activity☆
- Formation of crystalline particles from phase change emulsion:In fluence of different parameters
- The effect of SiO2 particle size on iron based F–T synthesis catalysts
