
Analysis of fouling characteristic in enhanced tubes using multiple heat and mass transfer analogies☆
2015-11-03 06:07ZepengWangGuanqiuLiJingliangXuJinjiaWeiJunZengDecangLouWeiLi
Zepeng Wang ,Guanqiu Li,Jingliang Xu ,Jinjia Wei,Jun Zeng ,Decang Lou ,Wei Li,*
1 College of Electromechanical Engineering,Qingdao University of Science and Technology,Qingdao 266061,China
2 College of Energy Engineering,Zhejiang University,Hangzhou 310027,China
3 School of Energy,Power,and Mechanical Engineering,North China Electric Power University,Beijing 102206,China
4 State Key Laboratory of Multiphase Flow in School Energy and Power Engineering of Xi'an Jiaotong University,Xi'an 710049,China
5 China Gas Turbine Establishment,6 Xin-Jun Road,Xidu district,Chengdu,China
Keywords:Fouling Enhanced tube Turbulent flow Mass transfer coefficient Cooling tower water
ABSTRACT This paper provides a comprehensive analysis on cooling tower fouling data taken from seven 15.54 mm I.D.helically ribbed,copper tubes and a plain tube at Re=16000.There are two key processes during fouling formation:fouling deposition and fouling removal,which can be determined by mass transfer and fluid friction respectively.The mass transfer coefficient can be calculated through three analogies:Prandtl analogy,Von-Karman analogy,and Chilton-Colburn analogy.Based on our analyses,Von-Karman analogy is the optimized analogy,which can well predict the formation of cooling tower fouling.Series of semi-theoretical fouling correlations as a function of the product of area indexes and efficiency indexes were developed,which can be applicable to different internally ribbed geometries.The correlations can be directly used to assess the fouling potential of enhanced tubes in actual cooling tower water situations.
1.Introduction
Fouling is the solid substance deposited on heat transfer surfaces contacting with unclean fluid,which can significantly reduce the heat transfer efficiency and therefore has been attracted many research interests.There are three issues to be addressed in fouling research[1].The first one is the theoretical and experimental analysis of fouling formation,providing a common and precise predicting model for heat exchanger design.The second is fouling monitor techniques.The last one is the countermeasure of fouling.Many researches had been focused on the theoretical and experimental analysis on fouling mechanisms,which are crucial to the control of fouling formation.
With regard to modeling the fouling data,Kern and Seaton[2]published an analysis which is considered as a landmark in the beginning of modern scientific study of fouling.They assumed two key processes that control the fouling resistance,namely fouling deposition and fouling removal.In principle,they brought forward a model which can embrace fouling involving all forms of growth and removal processes[3].Several significant investigations addressed the foulant deposition and removal rates in enhanced tubes.Kim and Webb[4]made a detailed research on three internal repeated rib tubes.Heatmass transfer analogy was utilized to calculate the mass transfer coefficient(Km)in the diffusion region.Within the test range,the fouling resistance increased as geometric parameter e/D decreased and p/e increased.Li and Webb[5]developed the first long-term fouling model for practical cooling tower water flowing inside the enhanced tubes by using the Chilton-Colburn analogy to calculate mass transfer coefficient.Recently,Jun and Puri[6]applied a 2D fouling model to predict the fouling performance of plate heat exchangers,which coupled a 2D dynamic model with material balance equations.The model showed a strong relation between fouling and the operating conditions,i.e. flow rate and deposit formation.Their model can determine the sensor locations that can provide necessary information for fouling formation to monitor not only fouling during thermal process but also cleaning condition.Quan et al.[7]conducted an experimental study to investigate the fouling process of calcium carbonate on enhanced heat transfer surface in forced convective heat transfer.The fouling behaviors were examined under different factors including fluid velocity,hardness,alkalinity,solution temperature,and wall temperature.Webb[8]reported heat transfer and friction characteristics of three tubes having a conical,three-dimensional roughness on the inner tube surface with water flow in the tube.The Nusselt number(Nu)of 3-D TC3 truncated cone tube was 3.74 times higher than a plain tube.Accelerated particular fouling data were also provided for this tube and compared to the results of helical-ribbed tubes studied in Li[9].The results showed that the 3-D tube provided the highest heat transfer coefficient but also had the highest asymptotic fouling resistance.
Webb and Li[10]described the experimental results of long-term fouling tests for cooling tower water flowing inside enhanced tubes.Fouling data were measured for the seven helical rib roughened tubes for more than a 2500 h operating period.There exist combined precipitation and particulate fouling(PPF)in cooling tower systems.The test geometries include seven enhanced copper tubes and a plain copper tube.In this study,the main focus is to analyze the experimental results in Ref.[10,11]to quantitatively define the effect of rib height,rib axial pitch,and helix angle on the tube fouling performance.
No analysis has been done to establish the fouling model that can fully reflect the realistic flow conditions.From the previous studies,fouling deposition rate determined by mass transfer coefficient is the key parameter to estimate the fouling resistance.In this study,new models for calculating the deposition rate are developed.Comprehensive analyses about three widely used analogies,i.e.the Prandtl analogy,the Von-Karman analogy,and the Chilton-Colburn analogy,are discussed to develop the mass transfer coefficient Km.Semi-theoretical fouling models based on three analogies have been established to correlate experimental data on fouling.It is revealed that the Von-Karman analogy is the most appropriate for providing the most accurate fouling model to represent the experimental results.
2.Fouling Model
There are four different patterns for fouling formation:the linear increasing pattern,the linear decreasing pattern,the power pattern,and the asymptotic pattern[12].In this work,the fouling pattern in cooling tower systems is considered to follow the asymptotic pattern:
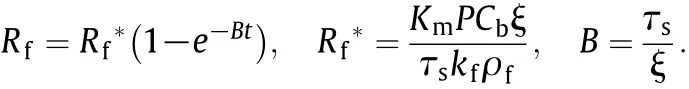
The asymptotic fouling resistance ratio Rf*/Rfp*is utilized to obtain the fouling characteristics in the enhanced tubes.For rough surfaces,a fraction of the pressure drop may be due to the profile drag on roughness elements.Webb et al.[13]reported the j and f factors for the clean tube,which can be used for characterize the heat transfer and flow performance in the helical-ribbed tubes.They showed that f∝Re-0.283,and the results indicated that the pressure drop was dominated by wall shear stress,and that the pressure drag component was negligible.In this study,the profile drag can be ignored,comparing with the wall shear stress,which can be calculated with τs= ΔPAc/Aw=0.5fρu2.We define σ =(P/Pp)(ξ/ξp),then the following equation can be obtained:

whereσis a fouling process index,which is determined from the fouling tests.The asymptotic fouling resistance ratio Rf*/Rfp*can be obtained after calculating Kmand τs.
2.1.Calculation of Km[14,15]
Three analogies are used to calculate the mass transfer coefficient,however,the Reynolds analogy is not included since it is assumed that Pr≈1 and Sc≈1.It is not suitable for the experimental data because of the wide range in the operating conditions.
Prandtl[16]assumed the turbulent boundary can be divided into laminar region and turbulent region,which can amend the Reynolds analogy.The momentum and heat transfer are attributed to molecule transfer,and the thickness of the laminar region is thin.Thus,the temperature and velocity are distributed linearly.Prandtl analogy divides the boundary into laminar region and turbulent region and ignores the influence of the buffer region.This brings the deviation.
The equations of Prandtl analogy are listed below:

Compared to the Reynolds analogy and the Prandtl analogy,the Von Karman analogy[17]includes buffer region into the model.The usage of the three-region model makes the turbulent heat and mass transfer theory more close to the realistic flow conditions.Fig.1 shows the temperature distribution and velocity profile of the turbulent flow inside a tube.The deviation of the Von-Karman analogy is primarily caused by neglecting turbulent transfer in laminar region and heat transfer in turbulent region.There are large deviations when Pr number is extra large or small.The equations of the Von-Karman analogy are listed below:

Colburn[18]modified the Reynolds analogy based on their experimental data.Their modification make the new analogy not restrict by Pr≈1 and Sc≈1,and it is extended to systems having fluid friction.Chilton-Colburn analogy presents:

The correlations of mass transfer coefficient Kmare obtained through eliminating f factor in above equations:
For Prandtl analogy,

where m1=[1+4/(b12St)]0.5,a1=5(Sc-1),b1=5(Pr-1).
For the Von-Karman analogy,

where m2=[1+4/(b22St)]0.5,a2=5(Sc-1)+5ln[(5Sc+1)/6],b2=5(Pr-1)+5ln[(5Pr+1)/6].
For the Chilton-Colburn analogy,

2.2.Correlation of f and j factors
Webb et al.[13]developed the following heat transfer and friction factor equations for the seven tubes tested in their study:
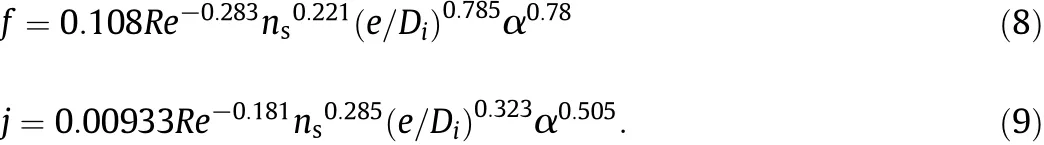
Average deviation of friction and heat transfer correlations is 4.9%and 3.8%,respectively.For smooth tube,the Seider-Tate correlations fp=0.079Re-0.25and jp=0.027Re-0.2are used to calculate f and j factors for smooth tubes[5].

Fig.1.Three regions in the Von-Karman analogy.

Table 1 The available range of the Sc and Pr numbers[16-18]
2.3.Analysis of fouling model

where ji′/jpi′=Kmi/Kmpi.For the Prandtl analogy,i=1;for the Von-Karman analogy,i=2;and for the Chilton-Colburn analogy,i=3.Note that the ji′/jpi′ratio indicates the relative foulant deposition rate and the f/fpratio indicates the relative foulant removal rate.Therefore,the assumption we obtained shows the fouling characteristic can be determined through two processes,which are the heat transfer and fluid friction.The j and f factor is the key parameter in the fouling formation.De fine ηi=(ji′/jpi′)/(f/fp),which is determined by tube efficiency index η =(j/jp)/(f/fp).η is normally provided by the tube manufacturer.
3.Analysis of Fouling Data
Table 2 gives the fouling data and tube geometry parameters of a plain tube and seven helical-rib tubes in Webb and Li[10].Fig.2 shows tube geometry detail of helical-rib tubes.Tubes 2,3 and 5 are with p/e<5;The rest tubes are with p/e>5.The fouling resistanceRf*/Rfp*is based on the nominal inside area(Ai=πDiL).Fig.3(a)shows Rf*/Rfp*vs.ηias presented in Table 2.The comparisons among the three analogies are presented.Since the analysis is based on the heat-mass transfer analogies,it is automatically assumed that the fouling deposit is formed by a large amount of individual particles.The effect of cohesion between the particles and the tube surface is not included.This is valid for particulate fouling,which is the accumulation of suspended solid on the heat transfer surface.However,it is not valid for PPF in cooling tower systems.The cooling tower by its designed evaporative cooling multiplies the non-evaporative impurities of water.An important property of non-evaporative impurity of particular interest is its hardness.As hardness is originated from dissolved inverse solubility salts(mostly CaCO3and MgCO3,their solubility decreasing with increasing temperature);these salts can precipitate onto the heated wall of the condenser,resulted in precipitation fouling.Cooling tower water contains usually rather high concentration of a large variety of salts,each exhibiting different crystalline formations.Consequently,crystalline clusters build up in irregular patterns,forming cavities between them which permit deposition of suspended particles,further decreasing the crystalline cohesion.When cooling tower waters are cooled by atmospheric air,the tiny particles in the atmospheric air get into the cooling waters.Rust and dust particles are commonly contained in cooling tower waters.Some of the particles can act as catalysts and undergo complex reactions.They imbed into the loose crystalline structure common to cooling tower water.

Table 2 Experimental data and geometric parameters of helical-rib tubes[10].[D i=15.54 mm,γ=41°,t t=0.024 mm,R fp*=4.4 × 10⁻⁶ m2·K·W,Pr=5.2,Sc=0.7,Re=16000,ppm(particle per million)=1300]
Even though the adherence forces of PPF of cooling tower water is smaller than that of pure precipitation fouling due to the existence of rust and dust particles,the effect of adherence forces between particles and heat transfer surface is an important factor for the formation of PPF deposit.Contrary to modeling of particulate fouling data,the effect of adherence forces must be considered in the process of modeling PPF data.The particulate fouling deposits primarily on the surface between the ribs and on rib tip surface.The nominal internal surface area based on plain tube(A=πDiL),the reference surface in the above equations,has been used widely in particulate fouling data analysis of enhanced tubes.With respect to precipitation fouling or PPF,we should use wetted internal surface area Awrather than nominal internal surface area A for the analysis.The adherence forces are sufficient to describe the formation of fouling.The PPF deposits on the total internal surface including the surfaces between ribs,rib tip surfaces,and side surfaces of ribs,due to deposit cohesion.In order to analyze the difference between Awand A,we introduced an area index,β=(Aw/A)/(Ac/Acp)into Eq.(10):

Fig.2.Description of helically ribbed tubes.(a)Photos of helically ribbed tubes,(b)Cross section drawing of rib.

3.1.Correlations
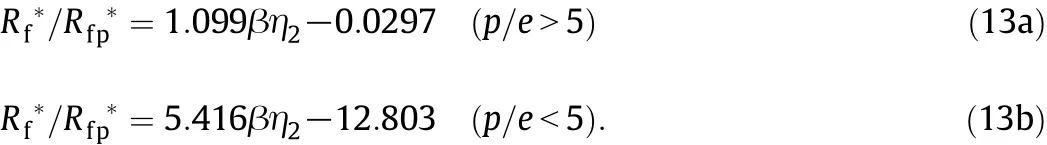
For the Prandtl analogy,

For the Von-Karman analogy,
For the Chilton-Colburn analogy,
The girl went out to the working society, whereas5 the guy was overseas, continuing his studies. They sent their love through emails and phone calls. Though it was hard, but both never thought of giving up.
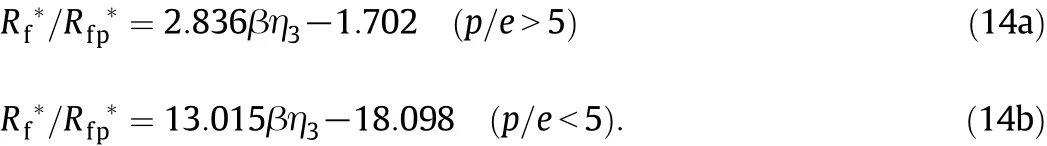
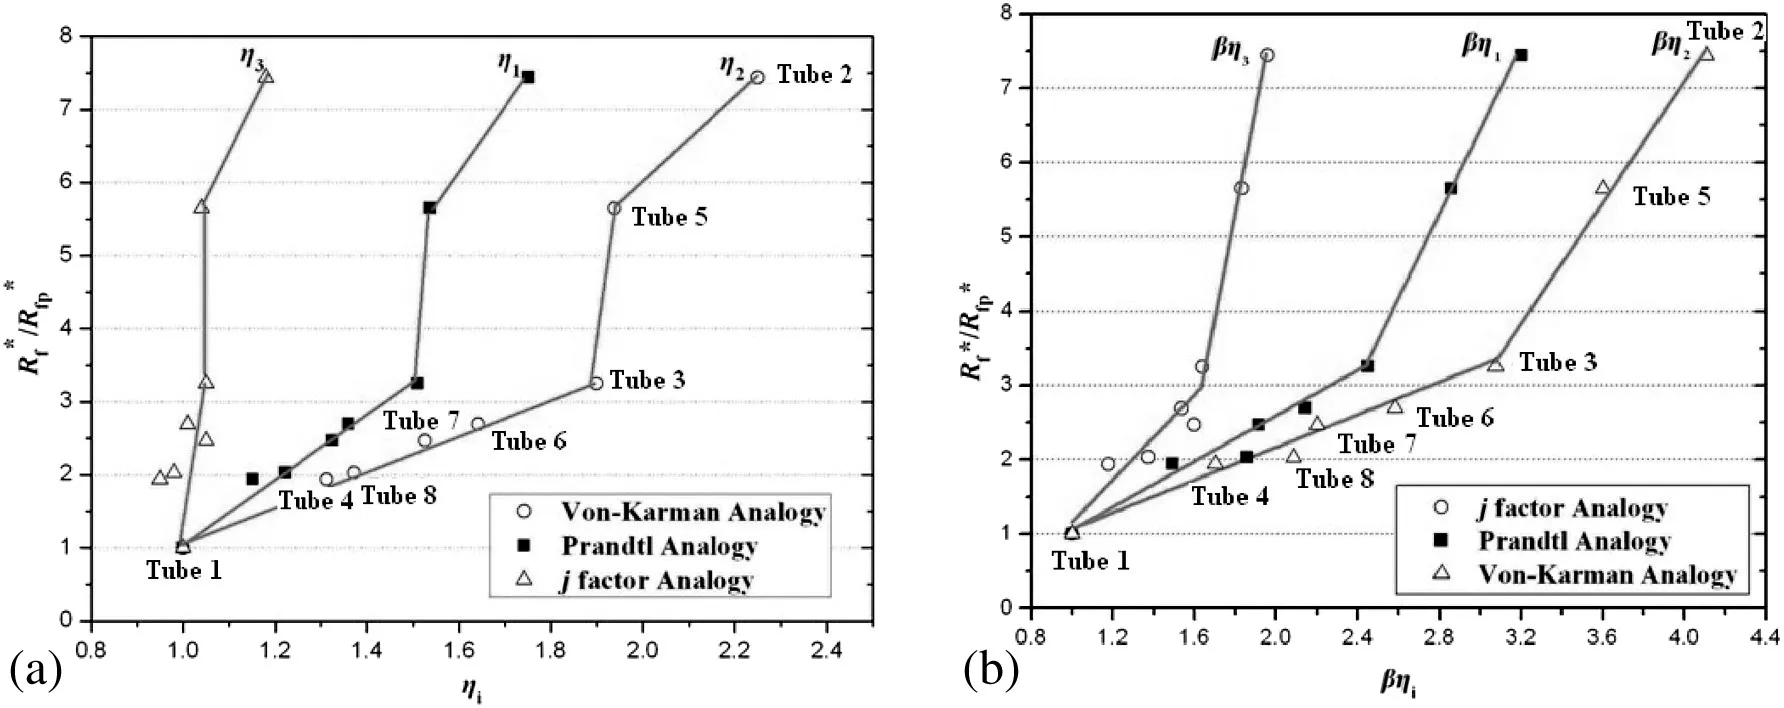
Fig.3.(a).ηi;(b)βηi.
The deviation of Eqs.(12a),(12b),(13a),(13b),(14a),and(14b)between the experimental data and calculated value is 5.4%,4.0%and 9.3%,respectively,but in contrast the deviation of corresponding equations without β between the experimental data and calculated value is 8.9%,7.2%and 12.3%,respectively.However,as the change of Pr and Sc numbers(for instance Pr>100),the deviation will become much larger.For those points,the three layers model of the Von-Karman analogy can express the actual turbulent situation inside the tubes,but the deviation of the Prandtl analogy and the Chilton-Colburn analogy are more than 15%,which are not satisfactory.There are three sources for the deviation in Eqs.(12a),(12b),(13a),(13b),(14a),and(14b).The first deviation is from the three analogy equations,which is relatively small.For instance,considering the Von-Karman analogy,the deviation is produced due to the moderate value of Pr and Sc number(Pr=5.2,Sc=0.7).The second is the deviation from Eqs.(8)and(9),which is 4.9%and 3.8%,respectively.The last and main error is produced during the calculation on plain tube by the Seider-Tate correlations.
3.2.Discussion
There are two ranges for each line corresponding to an analogy.In the enhanced tubes with intermediate helix angles used in this study,the flow inside the tubes has much greater momentum in the axial direction than the angular momentum caused by the ribs,which would result in the flow separation at the ribs[3].We primarily considered the effect of the reattachment of the fluid to the surface between the ribs.Reattachment does not occur when the pitch of roughness is reduced to less than approximately five rib heights(p/e<5)for tubes 2,3,and 5,and the main flow is forced to “glide over”the ribs and a secondary flow is created between the ribs.However,when p/e is large enough(p/e>5), flow reattachment would occur downstream of a rib and the secondary flow between two ribs caused a lower wall shear stress as shown in Fig.4.
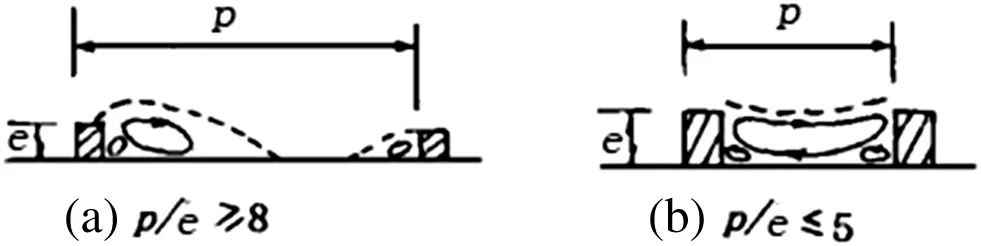
Fig.4.Boundary layer separation at different p/e.

Fig.5.ηi vs.j/j p.
The relations between ηiand j factor is shown in Fig.5.It can be easily found that η2> η1> η3,and j factor can reflect the magnitude of heat transfer coefficient.Therefore,ηicould reflect the heat transfer characteristic in certain degree.It could be considered that the heat transfer characteristic of the Von-Karman analogy is largest.From the view of deviation,the deviation of the Von-Karman analogy is the least.Making the Von-Karman analogy as the standard,comparison of Prandtl analogy to the Von-Karman analogy is instructive.The laminar region and turbulent region are considered in both analogies,but the influence of the buffer region is also considered in the Von-Karman analogy.The heat transfer coefficient in the turbulent region is much larger than the other two regions,therefore j1′and j1p′(Prandtl analogy)is larger than j2′and j2p′(Von-Karman analogy).However,the internal ribs of the enhanced tubes could disrupt the laminar flow,thereby increasing the heat transfer coefficient inside the enhanced tubes.The disruption of laminar region in enhanced tubes could result the increasing rate of the smooth tube(j1p′/j2p′),comparing with the rate of the enhanced tubes(j1′/j2′).Therefore,η1is smaller than η2and the heat transfer characteristic of the Von-Karman analogy is larger than Prandtl analogy.For the Chilton-Colburn analogy,one region model is the reason that the heat transfer characteristic of the Chilton-Colburn analogy is the least.
As shown in Eqs.(14a)and(14b),η3equals to the tube efficiency index η,which is an advantage of the Chilton-Colburn analogy.Comparing βηito βη,a relationship can be obtained and it can help us to understand more about the fouling deposition mechanism,which is shown in Fig.6.The results indicate that a linear dependence can be found between βηiand βη,which can be used for further prediction.
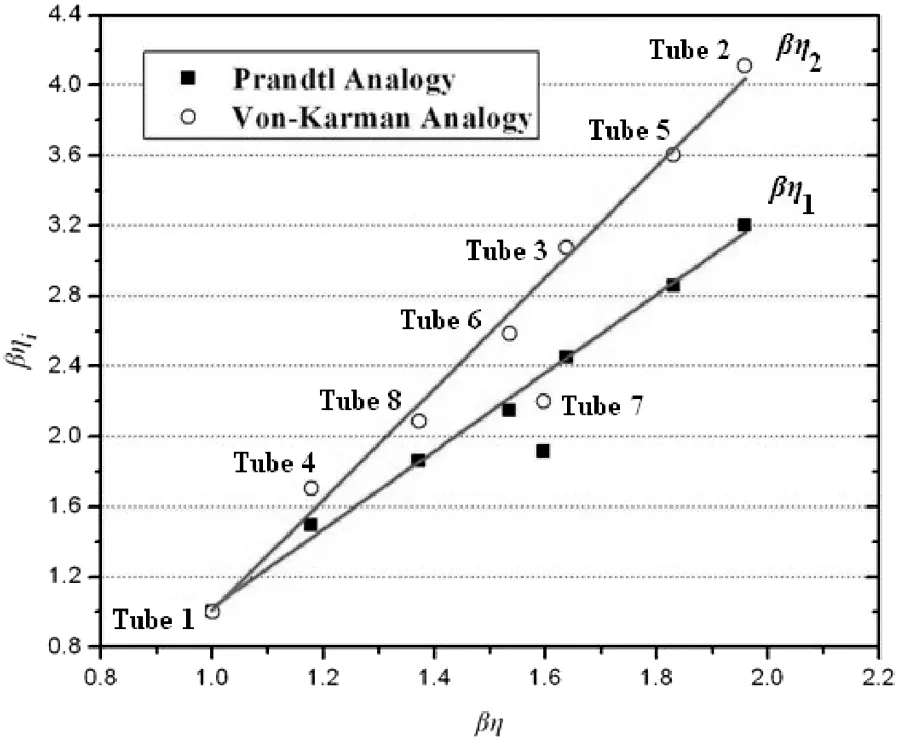
Fig.6.βηi vs.βη.
Besides calculated from the correlations above,the value ofηican be obtained from simulation,which can simplify the calculation process.As shown in Fig.5a,a power-law curve fit of(ji′/jp′)vs.(j/jp)generated the following correlation:

Eqs.(15)and(16)has an average deviation of 1.43%and 2.98%,and j3′/jp′equals to j/jp.The deviation of Eqs.(15)and(16)is broughtby the plain tube,and the deviation of enhanced tube is less than 0.05%.Therefore,we have


ηican be calculated from Eqs.(17a),(17b)and(17c).Combining Eqs.(8)and(9),Eqs.(17a),(17b)and(17c)can be applied to different internal ribbed geometries within the dimensional range of those tested tubes.
As shown above,a new model is established based on the model of Kern and Seaton[2].The assumption is that the fouling factor Rf*/Rfp*can be calculated through two parameters(j and f factors),which represent heat transfer process and fluid flow process.Through these two process and the analogies in turbulent boundary,a new method can be found to analyze the fouling characteristics in enhanced tubes.And even there are some relationships between the heat and flow process in Fig.7(a).As shown in Table 2,the available range of the Sc and Pr numbers for Prandtl analogy is a bit small comparing with the other two analogies.From the above analysis,analogies can be a suitable method to predict the mass transfer coefficient to further understand the fouling deposition process.The Von-Karman analogy having higher accuracy and wider applicable range is the most suitable analogy for simulating the flow and mass transfer inside the tube,comparing with the other two analogies.
Although Fig.7(b)is only an approximate relation between heat transferand fluid flow,the new model can be testified in another aspect.More research progresses including the experimental and theoretical investigation about fouling formation are needed to further understand the true mechanisms and improve the fouling model.
4.Conclusions
A semi-empirical fouling model considering two main parameters(j and f factor)has been established to predict the cooling tower fouling resistance in the helical-rib tubes.The asymptotic fouling resistance ratio of the helical-rib tubes were found to be higher than the plain tubes.The mass transfer coefficient Kmis calculated by the Prandtl analogy,the Von-Karman analogy,and the Chilton-Colburn analogy.The relation between ηiand the fouling resistance of the enhanced tubes has been discussed.Also,the results showed that ηican be simulated through tube efficiency index η.
Referring to smooth tubes,three groups of linear correlations Rf*/Rfp*vs.βηiare developed to predict the cooling tower fouling inside the helical-rib tubes.The predicted model is validated by the practical experimental results at Re=16000.The predictions have good accurancy and can be segmented when the key parameter p/e(pitch/rib height)is equal to 5.The deviation of the Prandtl analogy,the Von-Karman analogy,and the Chilton-Colburn analogy,and is 5.4%,4.0%,and 9.3%,respectively.The revised parameter β is also used the comparison about ηivs.η.The correlations developed in the study can be used to predict the fouling resistance in helical-rib tubes in practical cooling tower systems.
Dedication
This paper is dedicated to the memory of the late Doctor Guan-Qiu Li(1988-2015).Dr.Guan-Qiu Liobtained his Ph.D.with WeiLiin the Department of Energy Engineering,Zhejiang University,in China in June,2012 and passed away on December 25,2014 when he was serving as a post doctor in the Department of Mechanical and Materials Engineering,Masdar Institute of Science and Technology,in Abu Dhabi in UAE at the age of 27.
Nomenclature
Accross-sectional area,m2
Ainominal internal surface area based on plain tube,m2
Awinside wetted surface area,m2
B time constant,s-1
Cbbulk particle concentration,kg·m-3
cpspecific heat at constant pressure,J·kg-1
DABBrownian diffusivity(=(KBT)/(3πμdp)),m2·s-1
Diinternal tube diameter,or diameter to root of fins,m
dpdiameter of the particle,m
e internal rib height(average value),m
f fanning friction factor(=Di/2ρU2)
h heat transfer coefficient based on Ai,W·m-2·K
j j-factor(=StPr2/3)
KBBoltzmann constant(=1.38×10⁻²³),J·K
Kmparticle transfer coefficient
kfthermal conductivity of deposit,W·m-1·K
Nu Nusselt number(=h Di/k)
nsnumber of starts
P sticking probability
Pr Prandtl number(=μcp/k)
p axial element pitch,m
ΔP tube-side pressure drop,N·m-2
q heat transfer rate,W
Re Reynold number(=ρUDi/μ)
Rffouling factor,m2·K·W
Rf* asymptotic fouling factor,m2·K·W
Sc Schmidt number(=ν/DAB)
St Stanton number(=h/ρUcp)
T time,s
ttfin tip thickness,m

Fig.7.(a)ji′/j p′vs.j/j p;(b)approximate relation between heat transfer and fluid flow process.
U fluid velocity,m·s-1
u* friction velocity,m·s-1
α helix angle,(°)
β area index,(Aw/Awp)/(Ac/Acp),dimensionless
γ included angle between sides of ribs,(°)
μ dynamic viscosity,Ns·m-2
ν kinematic viscosity,m2·s-1
ξ deposit bond strength
ρ density of fluid,kg·m-3
ρfdensity of deposit,kg·m-3
ρpdensity of particle,kg·m-3
σ fouling process index
τsshear stress,N·m-2
φ deposition or removal rate,kg·m-2·s-1
Supercripts and Subscripts
d deposition
p plain surface
r removal
′ revised function of the Chilton-Colburn and efficiency indexη
 Chinese Journal of Chemical Engineering2015年11期
- Chinese Journal of Chemical Engineering的其它文章
- N-methyl-2-(2-nitrobenzylidene)hydrazine carbothioamide—A new corrosion inhibitor for mild steel in 1 mol·L-1 hydrochloric acid
- A dual-scale turbulence model for gas-liquid bubbly flows☆
- Gas-liquid hydrodynamics in a vessel stirred by dual dislocated-blade Rushton impellers☆
- Convective mass transfer enhancement in a membrane channel by delta winglets and their comparison with rectangular winglets☆
- Cobalt-free gadolinium-doped perovskite Gd x Ba1-x FeO3-δas high-performance materials for oxygen separation☆
- Synthesis and adsorption property of zeolite FAU/LTA from lithium slag with utilization of mother liquid☆