
A dual-scale turbulence model for gas-liquid bubbly flows☆
2015-11-03 06:06XiaopingGuanZhaoqiLiLijunWangXiLiYouweiCheng
Xiaoping Guan,Zhaoqi Li,Lijun Wang*,Xi Li,Youwei Cheng
College of Chemical and Biological Engineering,Zhejiang University,Hangzhou 310027,China
Keywords:Two- fluid model Dual-scale turbulence model Shear-induced turbulence Bubble-induced turbulence Bubbly flow
ABSTRACT A dual-scale turbulence model is applied to simulate cocurrent upward gas-liquid bubbly flows and validated with available experimental data.In the model,liquid phase turbulence is split into shear-induced and bubbleinduced turbulence.Single-phase standard k-ε model is used to compute shear-induced turbulence and another transport equation is added to model bubble-induced turbulence.In the latter transport equation,energy loss due to interface drag is the production term,and the characteristic length of bubble-induced turbulence,simply the bubble diameter in this work,is introduced to model the dissipation term.The simulated results agree well with experimental data of the test cases and it is demonstrated that the proposed dual-scale turbulence model outperforms other models.Analysis of the predicted turbulence shows that the main part of turbulent kinetic energy is the bubble-induced one while the shear-induced turbulent viscosity predominates within turbulent viscosity,especially at the pipe center.The underlying reason is the apparently different scales for the two kinds of turbulence production mechanisms:the shear-induced turbulence is on the scale of the whole pipe while the bubble-induced turbulence is on the scale of bubble diameter.Therefore,the model reflects the multi-scale phenomenon involved in gas-liquid bubbly flows.
1.Introduction
Bubbly flows occur in a great variety of natural phenomena and industrial applications.Knowledge of the characteristics of such flow is of great importance in designing multiphase systems,but gaining full understanding of the flows is difficult for the complex physics involved and the existing multi-scale phenomena.Hence,the CFD simulation is an important tool for predicting hydrodynamics in the systems and scaling up the apparatuses.Suitable CFD models should account for such effects as turbulence,phase interaction and multi-dimensionality.
The Euler-Eulertwo- fluid framework of inter penetrating continua is the widely used approach to simulate two-phase flows[1,2].In this model,conservative equations of mass,momentum and energy written for each phase are derived by an ensemble averaging method,and other equations are needed to close the turbulent stresses,such as in k-ε,k-ω,and RSM turbulence models.However,these turbulence models are all well developed and validated only in single phase flows,and their applications to multiphase flows remain open questions for the complexity of multiphase turbulence.
In bubbly flows,bubbles significantly affect the liquid turbulence structure and intensity[3].Therefore,a turbulence model taking into account the effect of bubbles is vital for predictive CFD simulations for bubbly flows.Sato et al.[4]modeled the bubble-induced turbulence through simply adding an extra bubble-induced contribution to single-phase turbulent viscosity.However,this method does not directly predict bubble-induced turbulent kinetic energy and dissipation.Another approach is directly reflected by adding source terms to the liquid turbulent kinetic energy and dissipation transport equations[5-8].The additional turbulent kinetic energy production rate is equal to the energy loss by the bubbles due to interface forces;in the turbulent dissipation transport equation,the destruction of bubble-induced turbulence is modeled through dividing the production rate by a characteristic time scale.Nevertheless,the time scale is mainly based on dimensional analysis and no consensus has reached due to the complexity of turbulence in bubbly flows.Morel[5]chose the time scale(dB2/εL)1/3based on bubble diameter and turbulent dissipation;the bubble time scale dB/urelwas selected by Troshko and Hassan[6]and the turbulence time scale kL/εLby Politano et al.[7].However,Rzehak and Krepper[8]indicated that the mixed time scale ofgave better prediction.In addition,Chahed et al.[9]introduced a separate transport equation for nondissipative pseudo-turbulence induced by the displacements of the bubbles.However,the limitations of the model are the consideration of fluctuations from the perturbation of the flow only in the vicinity of the bubbles and the assumption of ideal equilibrium between turbulent production and dissipation in the bubble wakes.
For macroscopic simulations of vegetated flows,King et al.[10]proposed a dual-scale turbulence model to evaluate different turbulence generation mechanisms:turbulence produced by large-scale shear and small-scale stem wakes.In this model,the standard k-ε turbulence model was applied to simulate large scale shearinduced turbulence and one-equation turbulence model was used to describe wake turbulence.In bubbly flows,there are also two kinds of turbulence production mechanisms:large-scale shearinduced turbulence and small-scale bubble-induced turbulence.Notwithstanding the similarity between vegetated flows and bubbly flows,whether the model proposed by King et al.[10]for vegetated single-phase flows can be applied to simulating turbulence in gas liquid bubbly flows remains unknown.
The objective of the present research is to apply the dual-scale turbulence model proposed by King et al.[10]to turbulent bubbly flows.The model is validated with experimental results,and the multi-scale turbulence structure in bubbly flows is also discussed.The model is compared with other turbulence models to illustrate its advantages.Moreover,the parameter sensitivity of the dual-scale turbulence model is investigated.
2.Overview of Models
The Euler-Euler two- fluid model is used to simulate the gas-liquid pipe flows.The conservation of mass for each phase is given by

The conservation of momentum for each phase is

The total interfacial forces Fiare formulated based on appropriate consideration of different sub-forces interacting between phases.As Lahey and Drew[11]demonstrated,the total interfacial forces are given by the drag,lift,wall force and turbulent dispersion force:

The drag force between gas and liquid phase is given by

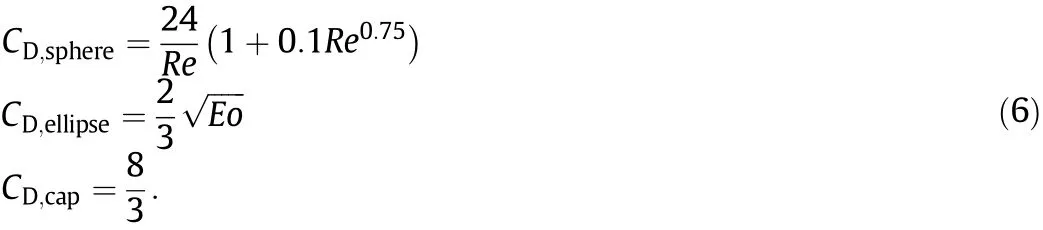
Some researchers analyzed the energy dissipation mechanisms of gas-liquid flows in bubble columns and proposed the drag models based on Energy-Minimization Multi-Scale(EMMS)methods[13-16].The drag model suggested by Ishii and Zuber[12]distinguishes bubble shape regimes and is widely used in the simulations of gas-liquid lf ows[5-8]:

with
The non-drag lateral force consists of lift,wall force and turbulent dispersion force,and shows great influence on the lateral void fraction distribution in gas-liquid pipe flows[17-19].The lift force arises from the interactions between bubbles and the shear stress in liquid,and is expressed as

The lift force depends on the bubble diameter and bubble shape as suggested by Tomiyama et al.[20],Hibiki and Ishii[21].The lift force coefficient is positive for small spherical bubbles so that the lift force pushes the bubbles toward the wall in upward co-current pipe flows;however,it changes its sign for large bubbles of substantial deformation and drives the bubbles toward the pipe axis,resulting in core-peak void fraction profiles in the lateral direction.From the experimental observation of the trajectories of single bubble rising in a shear flow,the following correlation was derived for the lift force coefficient by Tomiyama et al.[20]:

This correlation has been widely applied to simulate bubbly flows[7,8,22]and will also be used in the present simulations of gas-liquid pipe flows.The lift force coefficient changes its sign for water-air system at a bubble diameter of 5.8 mm.
The wall force is proposed by Antal et al.[17]to describe the interactions between bubbles and wall,and it drives bubbles away from the wall.The general form of the wall force is

where nwis the unit normal inward vector on the surface of the wall.The wall force coefficient CWdepends on the distance between the bubbles and the wall.An expression was derived by Antal et al.[17]based on potential flow as follows:

Based on experimental observation,Tomiyama et al.[23]proposed the following wall force coefficient model:

For the small Morton number water-air system,Hosokawa et al.[24]extrapolated their results to the following correction:

The wall force models of Antal et al.[17]and Tomiyama et al.[23]are widely used;however,Rzehak et al.[25]compared the above mentioned 3 models and found that predictions with Hosokawa et al.[24]suggested great agreement.Thus,this model is chosen in the present simulations.
The turbulent dispersion force describes the force exerted on the bubbles because of turbulent fluctuations of liquid velocity.Burns et al.[26]derived the expression by Favre averaging the drag force as
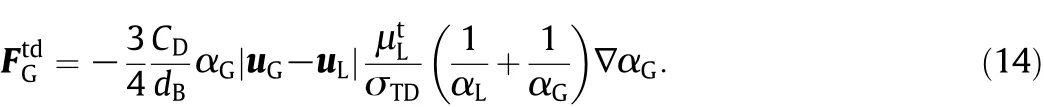
Here,σTDis referred to as a Schmidt number and a value of 0.9 is widely used.Burns et al.[26]also compared the Favre averaged drag(FAD)model with other turbulent dispersion force models and found that all models agreed with each other at least at low void fraction.Therefore,the FAD model is chosen here.
3.A Dual-scale Turbulence Model
Similar to the dual-scale turbulence model proposed by King et al.[10],turbulent kinetic energy is split into shear-induced turbulent kinetic energy() and bubble-induced turbulent kinetic energy(),so that total turbulent kinetic energy is given by

The turbulent dissipation is also split into two components:dissipation of shear-induced turbulent kinetic energy through the energy cascade() and dissipation of bubble-induced turbulence in the bubble wakes,so that total turbulent dissipation is given by

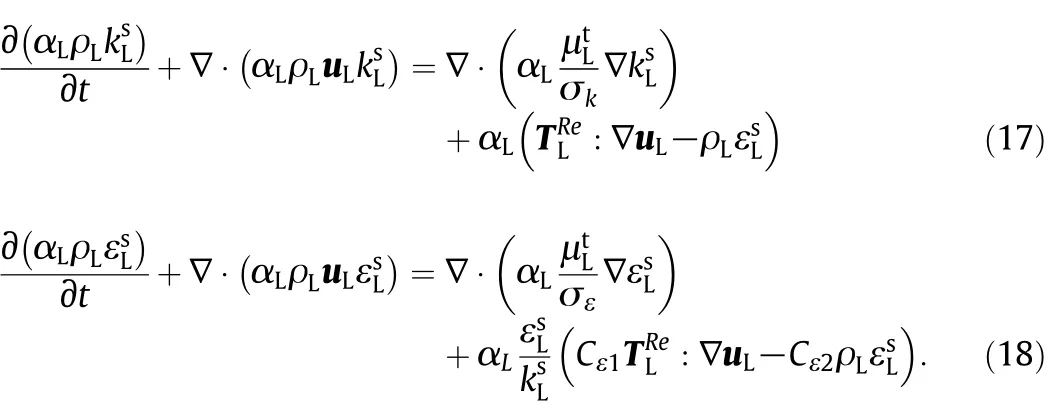
The shear-induced turbulence is modeled by the single-phase k-ε model:
The bubble-induced turbulence is controlled by one-equation turbulence model as follows:

where Pwis the production of bubble-induced turbulence and with the assumption that all energy lost by bubbles due to drag is converted to turbulent kinetic energy in bubble wakes,and it is modeled by

And the following algebraic equation is used to calculate:
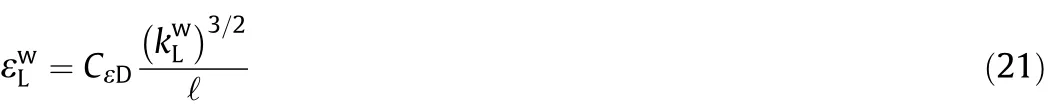
where CεDis a new model constant and ℓ is the characteristic length scale of bubble-induced turbulence.Bubble diameter dBis chosen as its value in this paper.
Similar to Sato et al.[4],the turbulent viscosity is evaluated from the linear superposition of shear-induced and bubble-induced viscosity,

where Cwis a new model constant.The effective viscosity is

Formulas(15)-(23)are the new dual-scale turbulence model used to simulate gas-liquid bubbly pipe flows in our work.The new constants CεDand Cware tuned to experimental results and the related parameter values are listed in Table 1.

Table 1 Constants in dual-scale turbulence model
4.Overview of the Simulations
4.1.Investigated tests
For model validation,the experimental results including turbulence information are very limited in the literature.Experimental investigations by Liu[27]and Shawkat et al.[28]have been chosen to validate the dual-scale turbulence model.A set of test cases covering a wide range of experimental conditions is selected as shown in Table 2.Since the model adopted in this work cannot capture turbulence anisotropy,the turbulent kinetic energy is used to validate the model.However,turbulent kinetic energy has not been measured directly in three directions in some cases,and therefore,an estimate method is used to estimate turbulent kinetic energy.From these experimental results,the axial turbulence is always greater than the other two components.In this work,we assume that azimuthal and radial components are equal.With the experimental axial and radial components,the total turbulent kinetic energy is estimated.Both liquid and gas are treated as incompressible fluid in the simulations,but the air bubbles expand during rise in the pipe.Therefore,the inlet gas volumetric fluxes may be not equal to those at experimental axial locations.With the measured local void fraction,liquid velocity and bubble diameter,local gas velocity can be estimated based on the balance between buoyancy and drag in the fully developed region,and then the gas fluxes were calculated by the sectional area-average of the local gas fluxes(local void fraction multiplying gas velocity).Hence,similar to Rzehak and Krepper[8],the inlet gas fluxes were adjusted to the calculated fluxes based on the measured data if the deviations between nominal experimental gas fluxes and calculated gas fluxes were more than 5%.As shown in Table 2,Liu's tests have been correspondingly adjusted to the calculated gas fluxes,while the differences between nominal gas fluxes and calculated fluxes were less than 5%in Shawkat's tests and no modification was made.
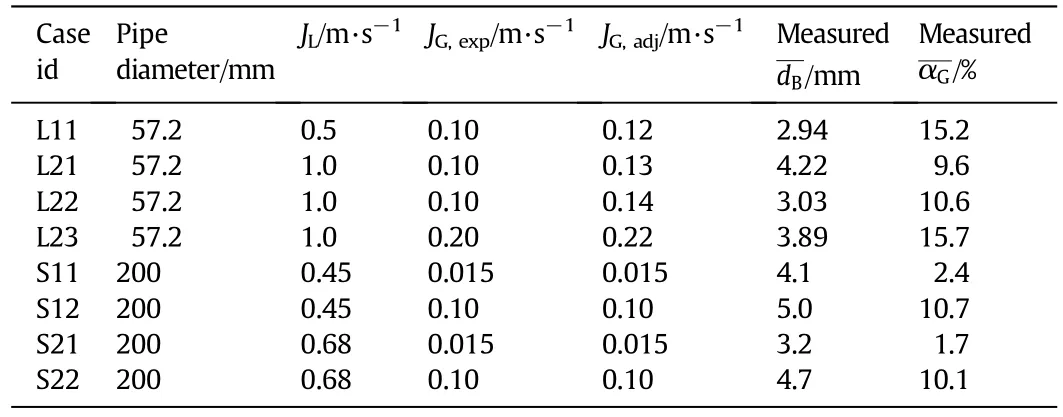
Table 2 Summary of the test cases chosen for the present work.
4.2.Geometry and boundary conditions
All cases were simulated in a quasi-2D cylindrical geometry,i.e.2D grid with symmetry boundary condition imposed on the centerline.Since both Liu's[27]and Shawkat's[28]measurements were performed at well-developed flow region,sufficient length was required for the simulation domain to satisfy full developed condition,and another 5 times diameter length was added to reduce the influence of imposed outlet boundary condition.By trial and error,domain lengths of 0.72 m and 3 m were selected for Liu's and Shawkat's test cases,respectively.Simulations were carried out with different grid sizes:20(r)×400(z),25×500,30×600 for Liu's experimental tests,and 25×500,35×700,45×900 for Shawkat's tests.Simulated results showed no difference between the latter two grid sizes for Liu's and Shawkat's tests,and hence medium grid sizes were selected to perform simulations.The y+for the cells adjacent to wall was close to 30,which was most desirable for the standard wall function.At the bottom,gas volume fraction and mass phase velocities were set as uniform values and satisfied the total flux of mass.Indeed,the conditions at the inlet had no influence on the simulated results at the fully developed region.At the outlet,a pressure boundary condition was set and no-slip boundary condition was chosen for both phases on the wall.Standard wall function approach was utilized for near-wall treatment.Simulated results with no-slip and free-slip boundaries for gas phase on the wall showed no differences on other parameters,except the gas axial velocity on the wall.Phasecoupled SIMPLE algorithm was used for pressure-velocity coupling,and the transient and convective terms were discretized through first order implicit and upwind scheme,respectively.All simulations were performed with Fluent 6.3 code.
5.Simulation Results
5.1.Validation dual-scale turbulence model
5.1.1.Void fraction
Liu[27]and Shawkat et al.[28]provided experimental radial profiles of void fraction,bubble size,liquid velocity and liquid turbulence intensity at well-developed flow region.The measured bubble size for the selected cases changes less than 50%in the radial profiles,thus the approximation of monodispersity adopted in this work is well justified.The simulated flow field at the fully developed region was compared with the measured data to validate the proposed model.
Fig.1 shows the comparison of measured and predicted void fraction profiles and the simulated results agree well with experimental data.Wall-peak void fraction profiles are predicted for all selected cases,while measured results of Shawkat et al.[28]show core-peak for S21 and S22.In the model,the lift force coefficient sign determines void fraction profile type:positive value pushes bubbles toward pipe wall to result in wall-peak void fraction profiles,while negative value drives bubbles toward the pipe center and leads to core-peak void fraction profiles.The lift force coefficient of Tomiyama et al.[19]changes its sign in water-air system at a bubble diameter of 5.8 mm.As shown in Table 2,the measured bubble diameters for all selected cases are smaller than 5.8 mm,and therefore wall-peak void fraction profiles are predicted.In addition,the figure suggests that the discrepancy between predictions and experimental data is more obvious at high gas fluxes,such as L23,S12 and S22.The reason may be that interactions between bubbles of different sizes are strong at high gas fluxes and the hypothesis of monodispersity is not correct.As demonstrated by Politano et al.[7],taking into account polydispersity can significantly improve model predictions.
5.1.2.Liquid velocity
A corresponding comparison for liquid velocity is shown in Fig.2.The agreement between predicted and measured results is good except for L11,S12 and S22,for which the predicted profiles are much flatter in the core and steepernear the wall in comparison with measured results.As shown in Fig.1,for S12 and S22,core-peak void fraction profiles are measured and wall-peak void fraction profiles are predicted.Accordingly,wall-peak void fraction profiles result in liquid velocity profiles flatter in the core and steeper in the wall in comparison with experimental data in Fig.2.On the other side,liquid velocity profiles influence void fraction profiles through interface forces,such as lift force.For example,steeper liquid velocity profiles near the wall lead to the increase of lift force,which drives more bubbles toward wall and enhances the wall peak void fraction.The feedback mechanism reflects the complexity in gas-liquid pipe flows.
5.1.3.Turbulence structure
For the square root of turbulent kinetic energy,comparison between model prediction and experimental results is shown in Fig.3.From the figure,the agreement is better at low gas fluxes than at high gas fluxes,and the reason may be the better prediction of void fraction and liquid velocity at low gas fluxes as shown in Figs.1 and 2.As shown in Eqs.(4)and(20),the bubble-induced turbulence production term is in proportion to gas holdup,and thereby accurate prediction of void fraction is vitalforestimation of bubble-induced turbulence.On the other side,the predicted liquid velocity profiles in Fig.1(b)at high gas fluxes are much flatter than measured results,and this leads to prediction of lower shear induced turbulence.Therefore,the discrepancy between predicted and measured turbulent kinetic energy is more obvious at high gas fluxes.

Fig.1.Comparison of measured and predicted radial profiles of void fraction for the selected test cases.
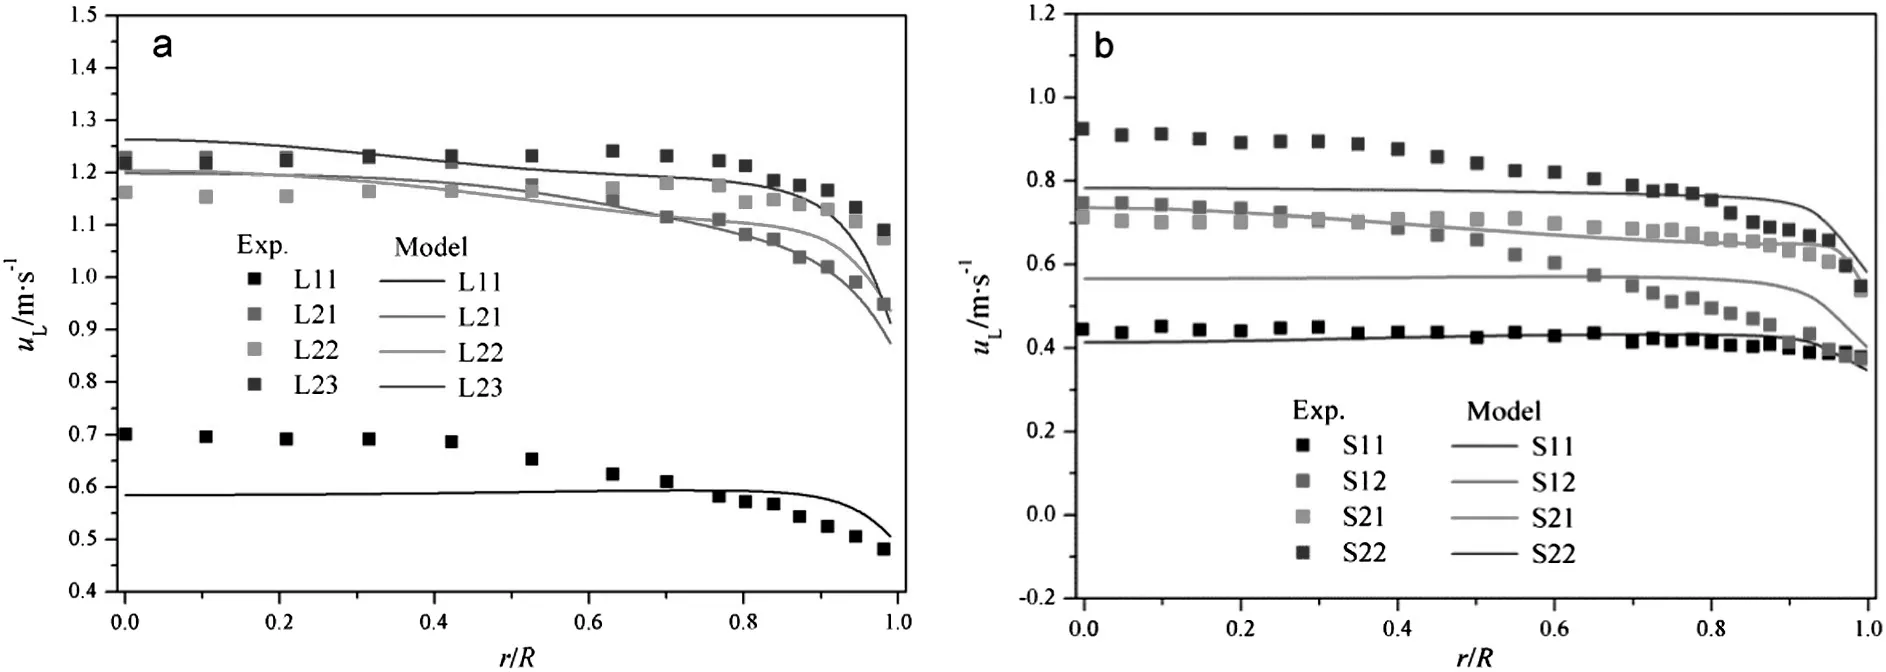
Fig.2.Comparison of measured and predicted radial profiles of liquid velocity for the selected test cases.

Fig.3.Comparison of measured and predicted radial profiles of the square root of turbulent kinetic energy for the selected test cases.
Fig.4 provides comparison of the predicted shear-induced and bubble-induced turbulent kinetic energy.It clearly suggests that both of them tend to increase toward wall,and the bubble-induced turbulence is much larger than shear-induced turbulence,especially at the center of the pipe,where the velocity profiles are flat and consequently the production of shear-induced turbulence is low.This conclusion is in conformity with the measured results in the literature[29,30].The radial profiles of bubble-induced turbulence show wall peaking similar to the predicted void fraction profiles,for the reason that the production of bubble-induced turbulence,as seen in Eqs.(4)and(20),is proportional to void fraction.
Fig.5 shows comparison of the predicted shear-induced and bubble induced viscosity and it is indicated that the shear-induced viscosity is much larger than the bubble-induced viscosity in the center of the pipe except for L11.Using our proposed model,the simulated results for bubble-induced turbulent kinetic energy indicate that the shearinduced turbulence and bubble-induced turbulence are on different scales:the macro-scale shear-induced turbulence determines the magnitude of turbulence viscosity while the bubble scale turbulence decides turbulence intensity.
5.2.Comparison dual-scale turbulence model with other turbulence models
Case L21 was chosen to compare turbulence models proposed by Sato et al.[4],Morel[5],Troshko and Hassan[6],Politano et al.[7],Rzehak and Krepper[8]and the present model.Fig.6 shows predicted void fraction by different models.Models of Sato et al.and Rzehak and Krepper give much flatter prediction than experimental results in the pipe center,while the model of Morel predicts no wall peaking void fraction.The other three models show good agreement with experimental results.

Fig.5.Comparison of predicted radial profiles of shear-induced and bubble-induced turbulent viscosity for the selected test cases.
Fig.7 gives simulated liquid velocity by different models and all models agree well with experimental results near the pipe wall.In the pipe center,liquid velocity is overestimated by models of Troshko and Hassan and Politano et al.,and is much underestimated by the model of Morel.Liquid velocity profiles are affected by void fraction distributions and turbulent viscosity.Therefore,the flatter void fraction profile predicted by the model of Morel in Fig.6 results in flatter velocity distribution in Fig.7 in the pipe center.

Fig.6.Comparison of predicted radial profiles of void fraction for case L21.

Fig.7.Comparison of predicted radial profiles of liquid velocity for case L21.
Comparison of turbulence intensity estimated by different models is shown in Fig.8,and models of Rzehak and Krepper and that in this work show great agreement with measured results.Fig.9 shows the predicted turbulent viscosity with different turbulence models,suggesting large difference among different models.The model of Morel predicts the largest turbulent viscosity,and models of Troshko and Hassan and of Politano et al.give the lowest value.Predictions of models of Sato et al.and our work are almost the same for adopting linear superposition of shear-induced and bubble-induced viscosity.On the one hand,turbulent viscosity affects turbulent dispersion force and impacts void fraction profiles.Therefore,the largest turbulent viscosity of Morel model predicts the flattest void fraction profile in Fig.6 and velocity distribution in Fig.7.On the other hand,turbulent viscosity determines shear-induced turbulent kinetic energy production term,and hence results in different turbulent intensity in Fig.8.From the above discussion,the proposed dual-scale turbulence model in this work is superior to other turbulence models in hydrodynamic prediction for gas-liquid pipe flows.
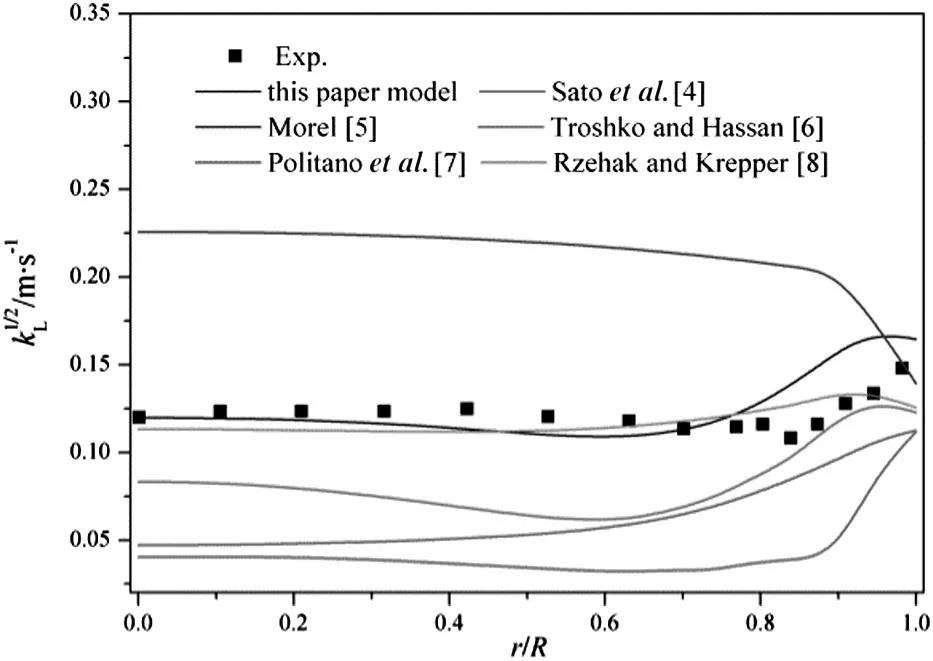
Fig.8.Comparison of predicted radial profiles of the square root of turbulent kinetic energy for case L21.
5.3.Sensitivity study of dual-scale turbulence model
In the proposed dual-scale turbulence model,the two new model parameters CεDand Cware tuned to experimental results and their values are listed in Table 1.The parametric sensitivity of the new model constants is investigated in this section.Effects of decrease or increase of the parameters by 50%on the model predictions are studied for L21.

Fig.9.Comparison of predicted radial profiles of turbulent viscosity for case L21.
Fig.10 shows the effect of the parameter CεDon the model predictions.It is indicated that the parameter CεDsignificantly influences the radial profile of turbulent kinetic energy while the radial profile of liquid velocity hardly changes.CεDdescribes the bubble-induced turbulence dissipation rate and the bubble-induced turbulent kinetic energy is the major part of the turbulent kinetic energy(in Fig.4),therefore the turbulent kinetic energy is greatly affected by CεDas indicated in Fig.10c.With the increase of CεD,the bubble-induced turbulence dissipation increases and the bubble-induced and the total turbulent kinetic energy decrease.Hence,the bubble-induced and the total turbulent viscosity decrease though the major part of turbulent viscosity is occupied by the shear-induced viscosity as shown in Fig.5.This results in the decrease of the turbulent dispersion force and the increase of the void fraction profile's steepness as shown in Fig.10a.
Fig.11 provides the effect of parameter Cwon the model estimated results.From the figure,the turbulent viscosity is greatly influenced by the parameter Cwwhile liquid velocity shows little difference.Cwis applied to evaluating bubble-induced turbulent viscosity as shown in Eq.(22).Therefore,the turbulent viscosity varies much with Cw.This leads to much more change of void fraction and liquid velocity in Fig.11 than that in Fig.10.For turbulent kinetic energy,on the one hand,the increase of turbulent viscosity causes the increase of the generation of shear-induced turbulent kinetic energy;on the other hand,the change of void fraction with the parameter Cwas shown in Fig.11a results in the change of the generation of bubble-induced turbulent kinetic energy.The mutual effects lead to the decrease of turbulent kinetic energy near the wall and the increase of turbulent kinetic energy in other part with the increase of parameter Cwas shown in Fig.11c.
From Figs.10 and 11,the parameter CεDsignificantly affects turbulent kinetic energy while the parameter Cwshows great influence on turbulent viscosity.However,both of them hardly change liquid velocity.The values of the two parameters listed in Table 1 are determined by the comparison between the model predictions and the experimental results.
6.Conclusions

Fig.10.Influence of parameter CεD on the dual-scale turbulence model predictions for case L21:(a)void fraction;(b)liquid velocity;(c)turbulent kinetic energy;(d)turbulent viscosity.
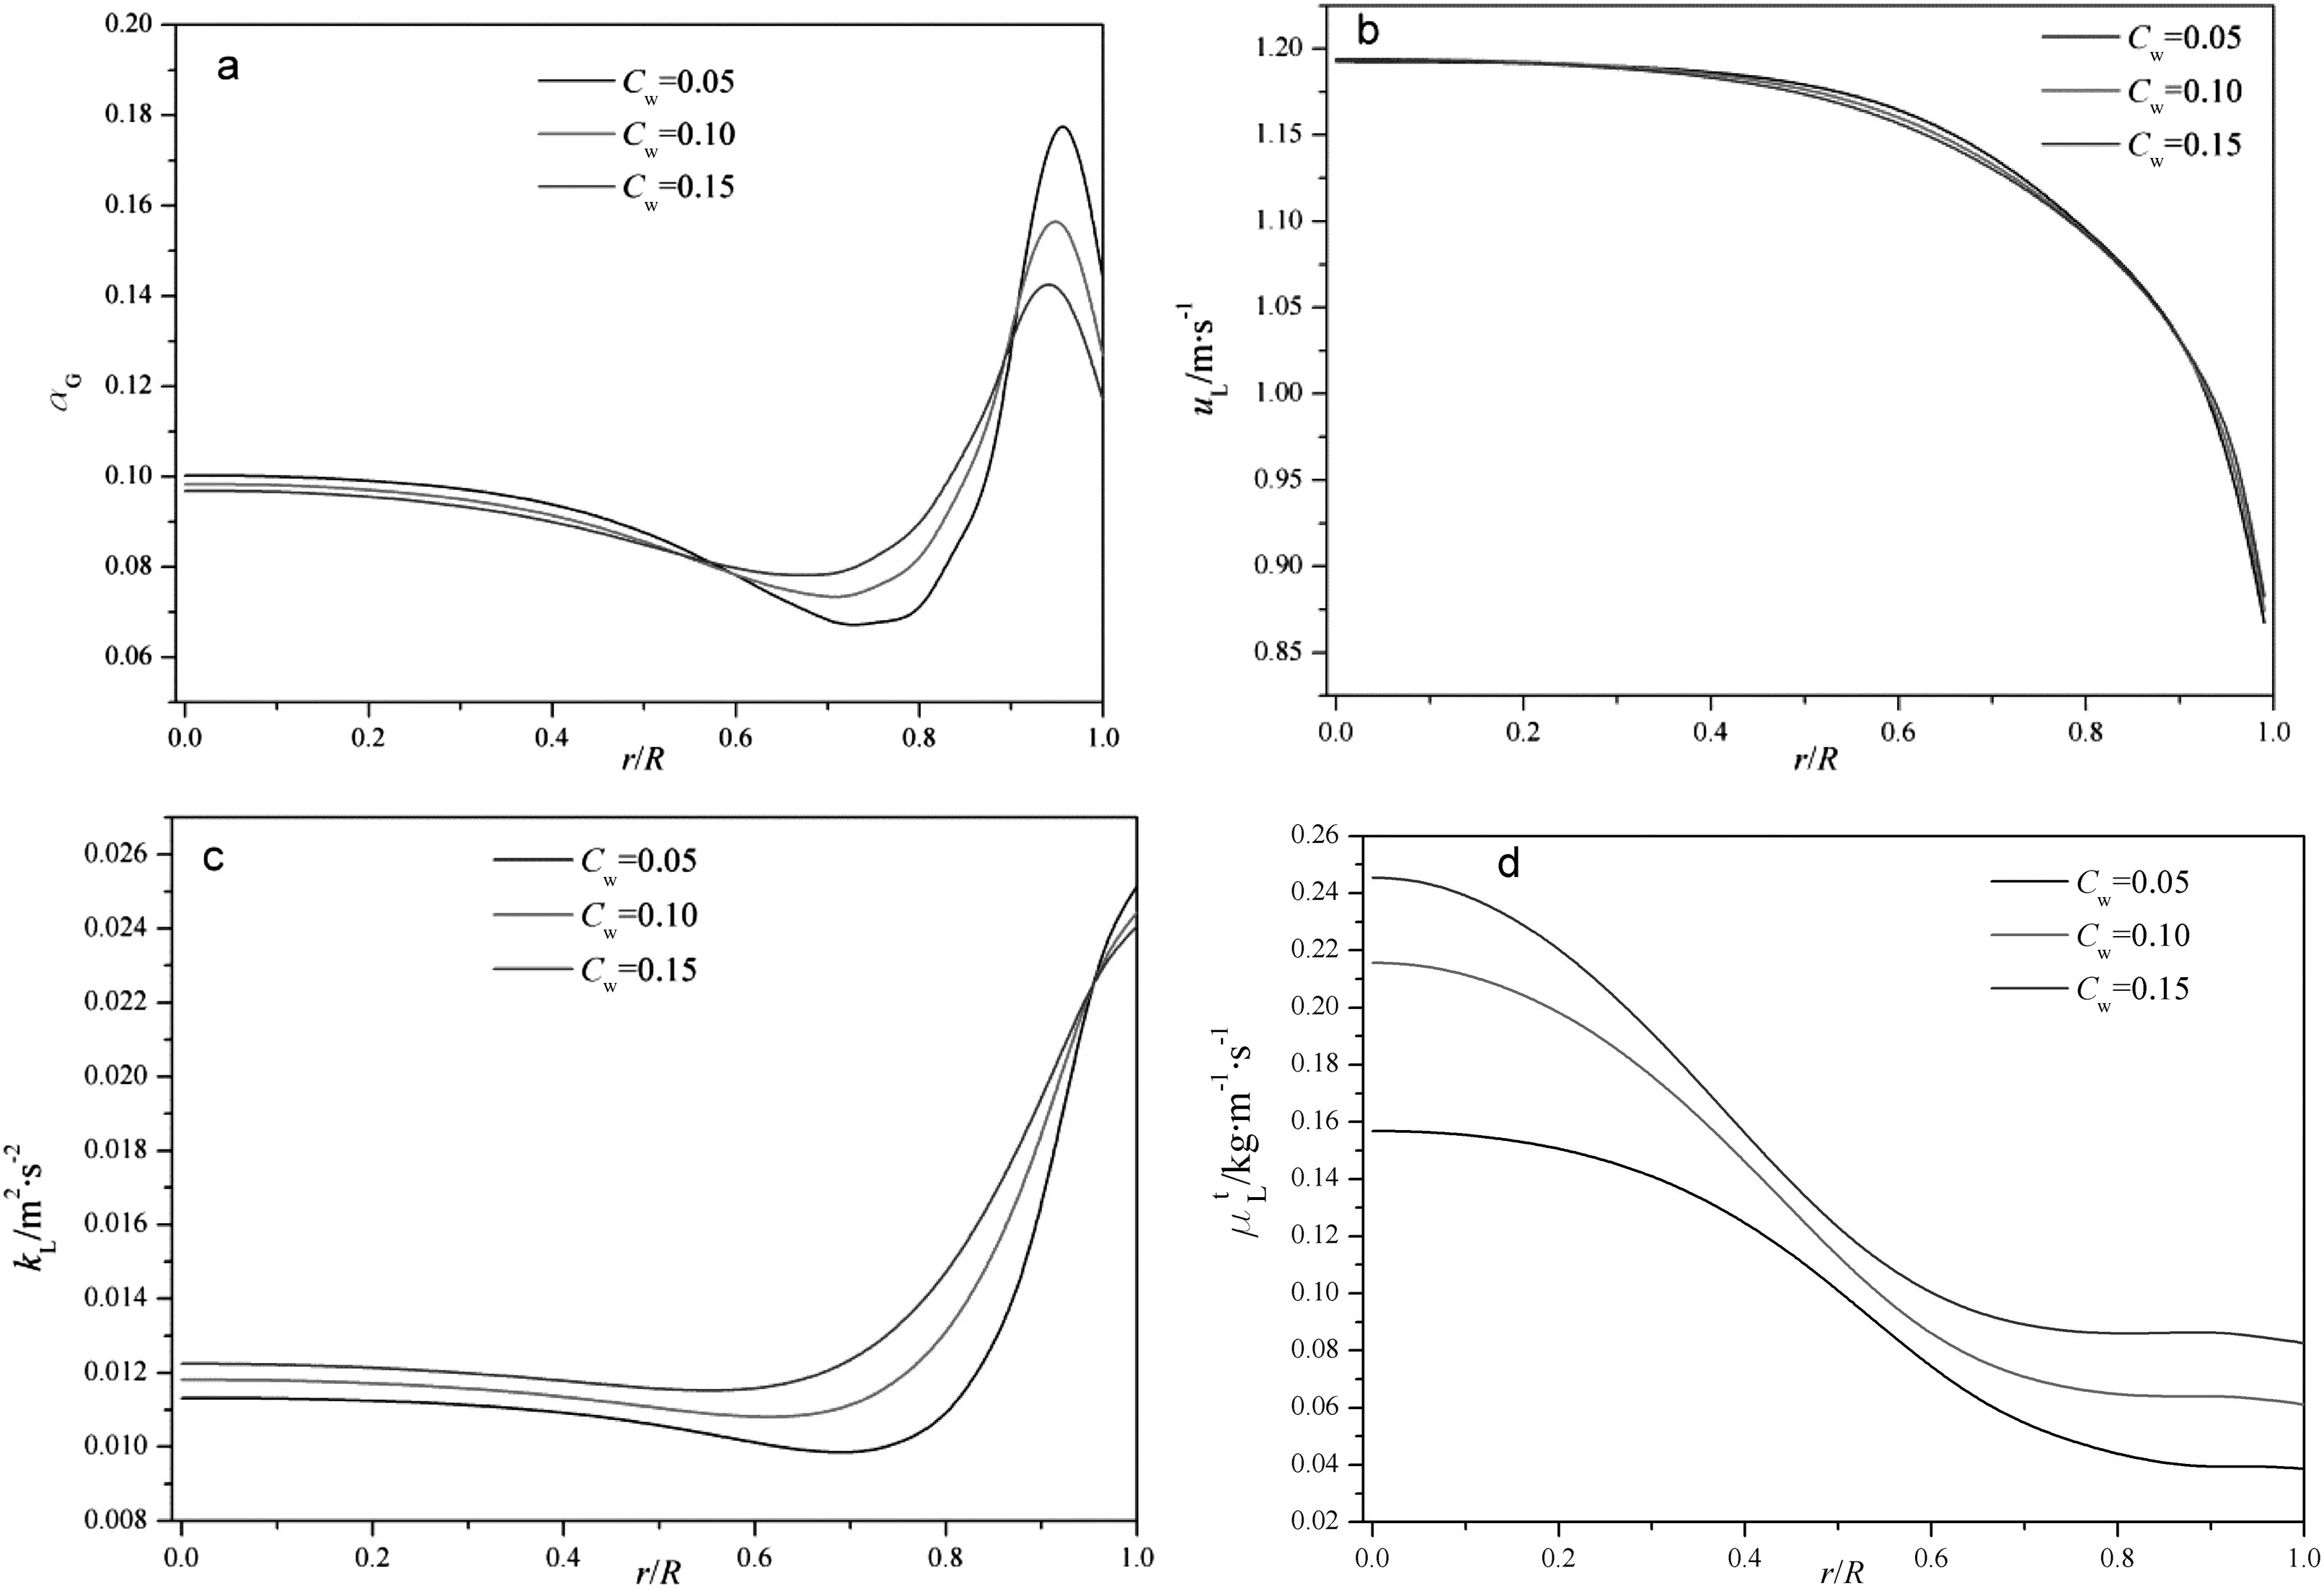
Fig.11.Influence of parameter C w on the dual-scale turbulence model predictions for case L21:(a)void fraction;(b)liquid velocity;(c)turbulent kinetic energy;(d)turbulent viscosity.
In this research,a two- fluid model has been proposed to study gasliquid bubbly pipe flows and further validated against available experimental data.To model turbulence in liquid phase,we split it into two parts:shear-induced turbulence and bubble-induced turbulence.The standard k-ε model is used to calculate shear-induced turbulence and a new transport equation is developed to describe bubble-induced turbulence.As for the new transport equation,interfacial energy loss due to drag is the production term and a characteristic length scale for the bubble-induced turbulence,bubble diameter chosen in this work,is introduced to model dissipation term.Similar to Sato et al.[4],linear superposition of shear-induced and bubble-induced viscosity is selected to compute turbulent viscosity.
For the selected test cases,the simulated results agree well with the experimental data.Comparison with other turbulence models suggests that the proposed model is superior in prediction hydrodynamics in gas-liquid pipe flows.Another interesting conclusion is that the model well describes the multi-scale phenomenon of the liquid turbulence in the bubbly flows:the majority party of the turbulent kinetic energy is from the bubble-induced turbulent kinetic energy while the macro-scale shear-induced turbulent viscosity predominates within turbulent viscosity,especially in the pipe center.This is plausible since the turbulent viscosity contains characteristic length scale of turbulence in addition to turbulent intensity.Therefore,addition source terms to kε turbulence model may well predict turbulent intensity,but it cannot well describe the turbulent viscosity for the reason that the singlephase turbulent viscosity model chooses the macro-scale turbulence length which is not suitable for the bubble-induced turbulent viscosity.The above discussions show the complexity involved and multi-scale phenomenon containing for the bubbly flows.
Obviously,the developed two- fluid model for bubbly flows improves the prediction.Nevertheless,modifications are needed to widen the application scope for the dual-scale turbulence model.The characteristic length scale of the bubble-induced turbulence is bubble diameter in this work.It is not so simple for high void fraction bubbly flows,where bubble swarms and clusters and the polydispersity make the characteristic length of bubble-induced turbulence much complex.Another drawback may be the simple linear superposition of bubble induced and shear-induced turbulent viscosity,which may not be suitable for the highly nonlinear phenomenon for bubbly flows,especially at high void fraction.Our suggestion is that the advanced numerical simulation methods,such as directnumerical simulations,may be helpful to answer the puzzle and make the proposed model more applicable.
Nomenclature
CDdrag force coefficient
CLlift force coefficient
CTDturbulent dispersion force coefficient
CWwall force coefficient
dBbubble diameter,m
dBaverage bubble diameter,m
EoEotvos number(Eo=g(ρL- ρG)dB2/σ)
Fiinterface force,N·m-3
g gravity acceleration,m·s-2
k turbulent kinetic energy,m2·s-2
ℓ characteristic length,m
p pressure,Pa
Re Reynolds number(Re=dB|uG-uL|ρL/μL)
t time,s
u velocity,m·s-1
y distance from wall,m
α phase fraction
ε turbulent kinetic energy
μeffeffective viscosity,kg·m-1·s-1
μmolmolecular viscosity,kg·m-1·s-1
μtturbulent viscosity,kg·m-1·s-1
ρ density,kg·m-3
σTDSchmidt number
τ stress,N·m-2
Subscripts
G gas phase
i phase
L liquid phase
 Chinese Journal of Chemical Engineering2015年11期
- Chinese Journal of Chemical Engineering的其它文章
- N-methyl-2-(2-nitrobenzylidene)hydrazine carbothioamide—A new corrosion inhibitor for mild steel in 1 mol·L-1 hydrochloric acid
- Gas-liquid hydrodynamics in a vessel stirred by dual dislocated-blade Rushton impellers☆
- Convective mass transfer enhancement in a membrane channel by delta winglets and their comparison with rectangular winglets☆
- Cobalt-free gadolinium-doped perovskite Gd x Ba1-x FeO3-δas high-performance materials for oxygen separation☆
- Synthesis and adsorption property of zeolite FAU/LTA from lithium slag with utilization of mother liquid☆
- Simulation and analysis of multi-stage centrifugal fractional extraction process of 4-nitrobenzene glycine enantiomers☆