
Design of reactive distillation processes for the production of butyl acrylate:Impact of bio-based raw materials☆
2015-11-03 06:07AlexanderNiesbachNataliaFinkPhilipLutzeAndrzejrak
Alexander Niesbach*,Natalia Fink,Philip Lutze,Andrzej Górak
TU Dortmund University,Department of Biochemical and Chemical Engineering,Laboratory of Fluid Separations,Emil Figge Straße 70,Dortmund D-44227,Germany
Keywords:Biobutanol Acrylic acid Purification Clustering Impurities
ABSTRACT The chemical industry is nowadays predominantly using fossilraw materials,but the alternative use of bio-based resources is investigated to account for the foreseeable scarcity of fossil feed stocks.A main challenge of using biobased feed stocks is the complexity of the impurity profile.For an economic production of bio-based chemicals,the use of intensified processes is inevitable and approaches are needed for the various process intensification techniques to identify their applicability to be used for the production of bio-based components.In the presented study,an approach is shown for the reactive distillation(RD)technology to identify the most critical bio-based impurities and their impact on the reactive distillation process.The investigated case-study is the production of n-butyl acrylate from acrylic acid and n-butanol.Among all initially identified impurities,the key impurities,having the biggest impact on the product purity in the reactive distillation process,are found.These impurities are then studied in more detail and an operating window depending on the impurity concentration is identified for the reactive distillation column.Furthermore,an integrated design of upstream and downstream processes is facilitated,as the presented results can be used in the development of the fermentation processes for the production of the bio-based reactants by decreasing the concentration of the critical impurities.
1.Introduction
The chemical industry is nowadays still predominantly using fossil raw materials.Butdue to the foreseeable scarcity of these raw materials,the development of processes using bio-based resources is being investigated.New production pathways based on the processing of different types of biomass allow for an increasing independence from fossil raw materials,but also provide new challenges for the production and purification steps.The use of biosynthetic production routesusually may not only result in different impurities compared to the chemical production process,but also in more complex impurity compositions.
For challenges in the development of processes for the bio-based industry,process intensification is an interesting option to match the needs of these technologies[1,2].Intensified processes are required allowing for an economic production of bio-based chemicals,replacing current processes or enabling the production of new products[1,2].Reactive distillation is one of the best known process intensification techniques and is already successfully applied to several industrial production processes[3,4].
Due to the changes in the impurity profiles when using bio-based raw materials,a modification of existing processes or even the development of new purification methods is mandatory.The impurities significantly influence the process design,as a reduction of the product purity may occur.Early simulation studies and the identification of the impact of single impurities on the process allow the identification of the most critical impurities,hereby reducing the complexity of the process design[5].These results can then be used for an integrated development of downstream processes together with the fermentation and purification steps of the feeds to achieve a target selectivity and avoid or reduce the production of specific impurities.
The investigated reaction in this study was the esterification of acrylic acid and n-butanol for the production of n-butyl acrylate in a reactive distillation column.The reactive distillation process was developed and economically optimised in earlier studies for an industrial-scale production of 20,000 ton n-butyl acrylate per year[6].
2.Approach for the Design of Reactive Distillation Processes Using Bio-based Raw Materials
The approach developed in this work is summarised in this section.A brief description of this approach was published in a five page conference contribution[7]and is explained in more detail in this manuscript.
Applying this approach results in the identification of the most criticalbio-based impurities for the investigated process.These results cannot only be used for the identification of a process window for the investigated reactive distillation process,but an integrated design of upstream and downstream processes can be performed and a target selectivity and purity for the production of the bio-based feeds can be identified.
A work flow of the proposed design approach and a scheme of the changes in the number of investigated components are shown in Fig.1.
The presented work flow consists of four steps.In the first step of the proposed approach,possible impurities were neglected and an optimal industrial-scale reactive distillation process used as the base-case was identified.To ensure reliable simulation results,a model validation has to be performed in this step using experimental reactive distillation results.The main result of the first step is the design of an optimised reactive distillation column which is used as the base-case for the following steps of this approach.As shown in Fig.1,the second step aimed at identifying and clustering all possible impurities that might appear in the process.In the first part of Step-2,biosynthetic routes for the production of the bio-based reactants were analysed and possible impurities in the reactants and impurities resulting from side-reactions taking place in the reactive distillation column were identified.Here,only those impurities were considered for further investigations that will mostprobably not be removed completely from the bio-based reactant due to azeotropes or similarity in boiling points.Based on thermodynamic and physical property data,the impurities were then clustered by potential occurrence in reactions,immiscibilities and azeotropes.This clustering was performed based on a setofrules that is summarised in Section 3.2.5.Acluster of components was formed,if the boiling point difference at the operating pressure of the process is at maximum around 10 K and if the vapour-liquid-equilibria with the main components are comparable,including the formation of azeotropes.Furthermore,the formation of immiscibilities with the main components should be comparable.To perform a first reduction of the number of components that need to be investigated,one representative component was chosen for each group of components based on similarity of the separation behaviour in the reactive distillation process.This component is then used for further investigations,representing the whole cluster.In the third step,a simple reactive distillation process model was used and the impact of the identified representative components on the reactive distillation process and the product purity was investigated.The starting point for the third step of the design approach was the base-case reactive distillation design resulting from Step-1.Based on these investigations,key components with the biggest negative impact on the final product purity were identified.In the fourth step,a detailed process analysis was performed taking the identified key components of step three into account.This more accurate simulation is used for a detailed investigation of the impact of the studied impurities.Hereby,an operating window for the reactive distillation process is found and required specifications for the single impurities can be used for the development of the production and purification processes of the reactants upstream of the reactive distillation column.Furthermore,adapted process configurations depending on the impurity composition and concentration can be identified to allow for a production of the final productin the desired purity.Adetailed description of the used process models for the third and fourth step of the proposed approach is given in Section 2.1.
2.1.Modelling of the reactive distillation process
Two different models are used in the approach described in this manuscript.For Step-3 of the approach,a reactive distillation model implemented in Aspen Plus™is used.This model is less accurate than the Aspen Custom Modeler™model used in Step-4,but is more stable and therefore advantages for the simulation of a higher number of investigated components.As in Step-3 the number of investigated impurities is significantly higher than in Step-4,this model is advantageous for the identification of the key components.For Step-4 of this approach,the more accurate Aspen Custom Modeler™model is used,which was validated using pilot-scale reactive distillation experiments[8].This model is then used for the identification of the operating window and the determination of required purities of the bio-based feedstocks.
2.1.1.Nonequilibrium model in Aspen Plus™
For the process analysis performed in the third step of the proposed design approach,Aspen Plus™was used to perform the process simulations.Simulations in Aspen Plus™are easier to set-up in comparison to Aspen Custom Modeler™and are used in this study,when a large number of components need to be investigated.In Aspen Plus™,the predefined module “RadFrac”was applied for the nonequilibriumstage(NEQ)modelling of the industrial-scale reactive distillation column.In contrast to equilibrium-stage modelling approaches,NEQ models calculate actual energy and mass transport rates and consider the hydrodynamic behaviour of the system,increasing the accuracy of the simulation[4].The nonequilibrium-stage “RadFrac”model in Aspen Plus™can be used for the simulation of various purification processes with a vapour and a liquid phase,such as absorption or distillation[9].Furthermore,chemical reactions can be defined and assigned to specific sections of the column for the simulation of reactive distillation processes[9].Additional details on the set-up of the column and the performed simulation studies are given in Section 3.
2.1.2.Nonequilibrium model in Aspen Custom Modeler™
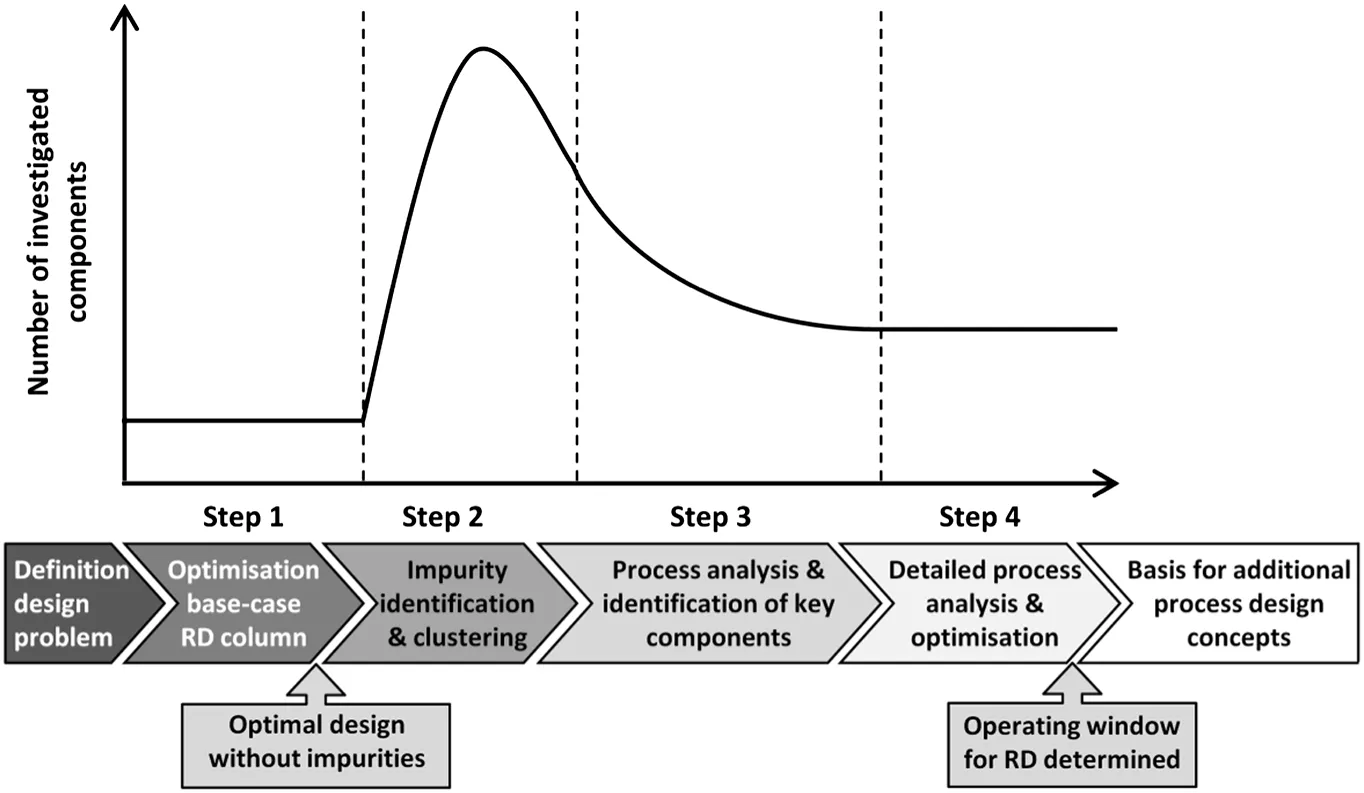
Fig.1.Flow chart of the design approach.
In the fourth step of the proposed design approach a NEQmodel,implemented in the simulation environment Aspen Custom Modeler™(the same model that was used for the first step),was used for the description of the process.A detailed description of the model was published by Klöker et al.[10].In this model,the mass transfer rates were calculated by applying the two- filmtheory[11],using effective diffusion coefficients for the calculation of the mass transfer rates[12,13],and the Chilton-Colburn analogy was used for the calculation of heat-transfer rates[14].In the simulated process,an adiabatic operation of the column was assumed and all pumps and heat exchangers were simulated with ideal efficiencies.The hydrodynamics of the column internals were calculated in a sub-model.The used packing-specific equations for these calculations were taken from Bravo et al.[15]and Rocha et al.[16]for the Sulzer BX™packing used in the separation sections.In the reactive section,the catalytic packing Sulzer KATAPAK-SP11™was used and the corresponding equations were taken from Hoffmann et al.[17]and Brunazzi and Viva[18].
3.Case-study
In the presented study,the esterification reaction of n-butanol and acrylic acid(AA)to form n-butyl acrylate(BA)and water was investigated.The reaction scheme of the investigated reaction is shown in Fig.2.
This reaction is limited by the chemical equilibrium and to achieve a high conversion of the reactants,a shift of the chemical equilibrium towards the side of the products,for example by removing the products from the reactive section,has to be performed.Table 1 summarises more detailed information on the main components,such as the boiling points and the CAS number.
Besides the pure-component boiling points,azeotropes determine the behaviour of the main components in a distillation orreactive distillation column.The compositions and the boiling points of the binary and ternary azeotropes formed by this system are summarised in Table 2.
For the equilibrium-limited esterification of acrylic acid and nbutanol for the synthesis of the main product n-butyl acrylate and the co-product water,a catalyst screening was performed in an earlier study and the heterogeneous ion-exchange resin Amberlyst 46™was selected as catalyst due to the high reaction rate and the low formation of side-products[8].
3.1.Step-1:design of the base-case process
The first step of the proposed design approach is related to the design of an optimised process,not taking any impurities into account.
To ensure reliable simulation results,a pilot-scale reactive distillation column was at first used to perform an experimental investigation[8,20].The experimental results were then used to validate the NEQ reactive distillation model.For the description of the reaction in the NEQ reactive distillation model,a Langmuir-Hinshelwood-Hougen-Watson(LHHW)kinetic approach was used.In the final part of the first step of the design approach,a reactive distillation column for the annual production of 20,000 ton n-butyl acrylate was optimised using an evolutionary algorithm[6].Further information on the nonequilibrium-stage model,such as additional information on hydrodynamics and the used reaction kinetic parameters are given in a previous study describing the optimisation of the base-case process[6].The reactive distillation column used for the production of n-butyl acrylate was composed of one reactive section in the middle of the column and two separation sections atthe top and at the bottom of the column[6].In this optimisation study,the costs per ton of the final product n-butyl acrylate were minimised,taking constraints of this system,like the maximum operating temperature of the used catalyst of 393 K[21],into account.The optimised design parameters of the reactive distillation column for the synthesis of 20,000 ton n-butyl acrylate per year are summarised in Table 3 and a scheme of the optimised design is shown in Fig.3.
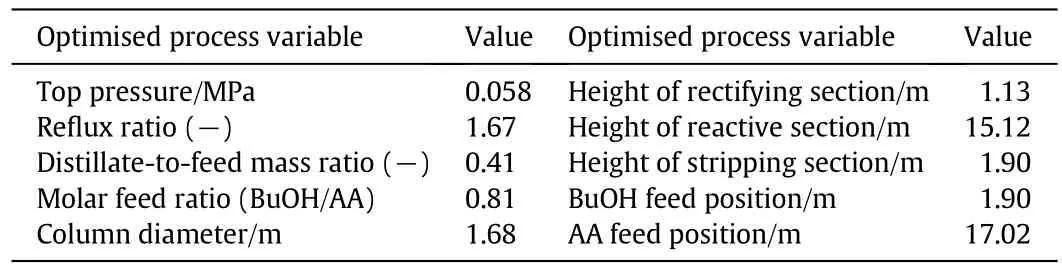
Table 3 Con figuration of optimised RD column[6]

Fig.2.Reaction scheme of the esterification of acrylic acid and n-butanol.
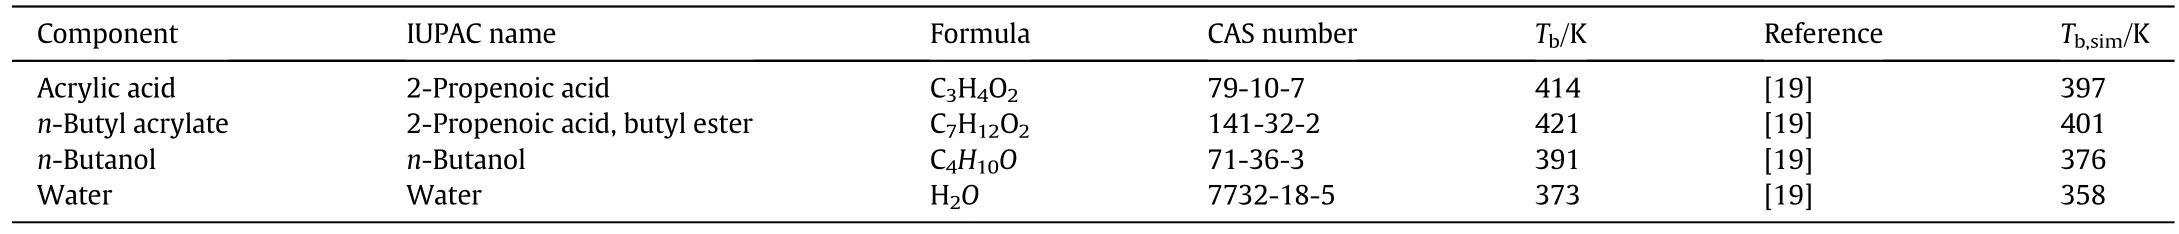
Table 1 Pure component boiling points at p=0.1 MPa and calculated pure component boiling points at 0.058 MPa using Aspen Plus™[6]
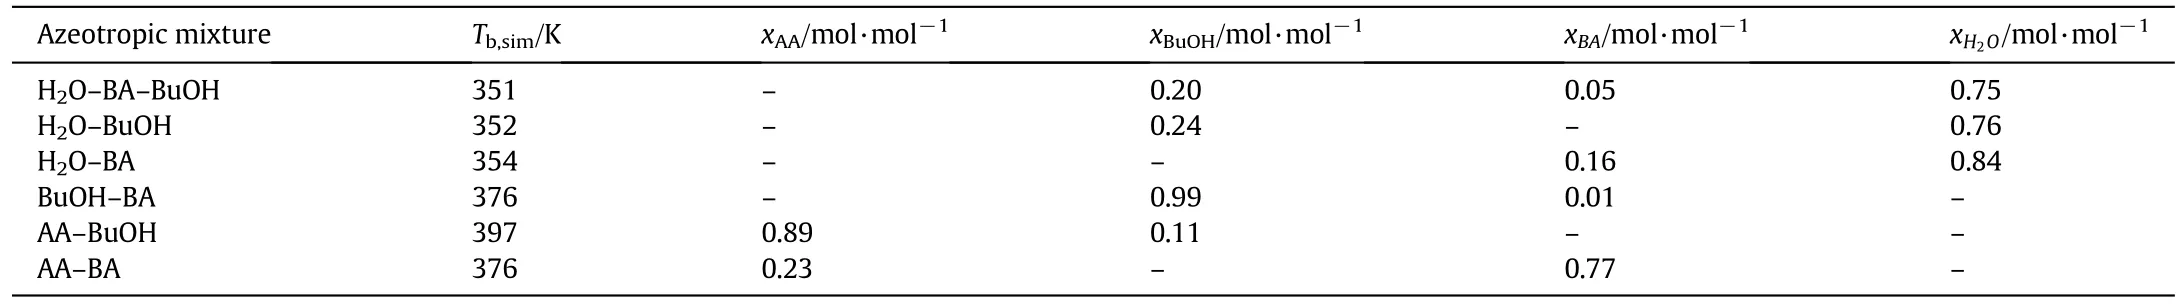
Table 2 Composition and boiling points of azeotropes formed by the four main components at 0.058 MPa simulated using Aspen Plus™[6]
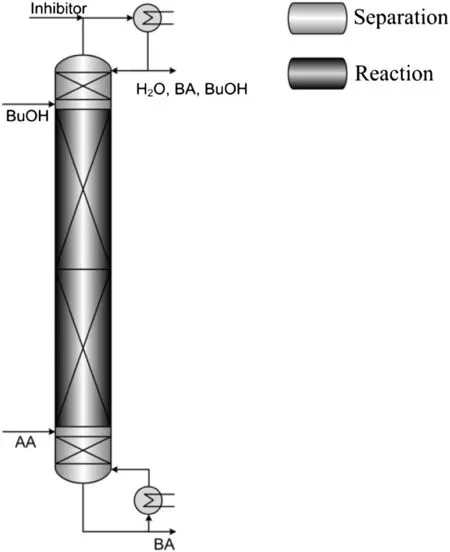
Fig.3.Process configuration of the optimised reactive distillation process[22].
The optimisation was performed,taking industrial product specifications into account.Therefore,a minimal purity for n-butyl acrylate of 99.5%(by mass)was used.Furthermore,an upper concentration limit of 400 mg·kg-1for water and n-butanol and an upper concentration limit of 100 mg·kg-1for acrylic acid were taken into account[6].At this stage of the approach,no side-products or impurities were considered.This results in a minimal purity for n-butyl acrylate of 99.91%(by mass)for the optimisation.For the process configuration shown in Table 3,a final n-butylacrylate purity of99.98%(by mass)was achieved,with concentrations of 175 mg·kg-1n-butanol,58 mg·kg-1of acrylic acid and a negligible concentration of water in the bottom product.The overall conversion of the optimised process for the single reactive distillation column was 73.5%for acrylic acid and 95.7%for n-butanol[6].
3.2.Step-2:identification and clustering of impurities
In the second step of the proposed design approach,a clustering of the bio-based impurities based on physical and thermodynamic purecomponent and mixture property data was performed.As a result of common industrial purity specifications for the reactants n-butanol and acrylic acid,both components are studied with purities of≥99.7%(by volume)and impurity concentrations of up to 3000 mmol·kmol-1[1].Prior to simulation studies with bio-based impurities,an analysis of biosynthetic routes for the production of n-butanol and acrylic acid and of possible side-reactions of main components and impurities in the reactive distillation column was performed to identify occurring biobased impurities.
3.2.1.Impurities in bio-butanol
The biosynthetic production of bio-butanol is performed by the Acetone-Butanol-Ethanol(ABE)process[23].Recent studies investigating fermentation and purification processes for the bio-n-butanol production can be found in literature[24-26].A scheme of the biosynthetic route from glucose to n-butanol was published by García et al.[27].The biosynthetic n-butanol production using the ABE fermentation is a two-step process.The precursors butyric acid and acetic acid are produced in the first step.In the second step,a conversion of these acids into n-butanol,acetone and ethanol is performed.Further potential impurities of the biosynthetic production of n-butanol are 1-propanol,isobutanol,2-methyl-1-butanol(2M1B)and 3-methyl-1-butanol(3M1B)[28].Currently,the purification of these impurities from nbutanol is conducted using distillation processes[29],but a complete separation of all impurities cannot be presumed.The identified potential impurities,their boiling points at a pressure of 0.058 MPa as well as the boiling point of the main component n-butanol and if they were considered for the further investigations are shown in Table 4.
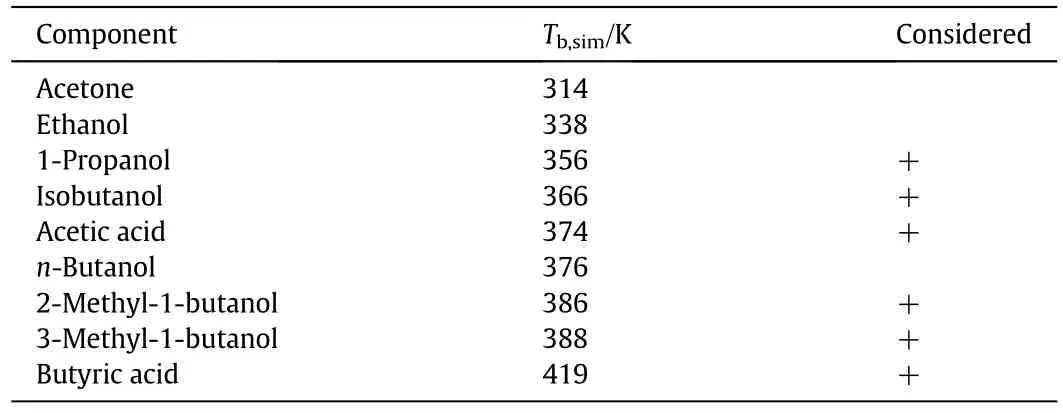
Table 4 Pure component boiling points of n-butanol and the potential bio-based impurities at p=0.058 MPa calculated using Aspen Plus™.The impurities marked with “+”were considered for further investigations
For further investigation and the clustering of the components,not all of the impurities listed in Table 4 need to be taken into account,as some of them can be assumed to be removed completely in the downstream processing of n-butanol.Hence,acetone and ethanol were not considered as impurities in bio-n-butanol due to large boiling point differences and no formation of azeotropes with n-butanol.In contrast,both intermediates acetic acid and butyric acid were taken into account as impurities.The boiling point of acetic acid is close to the n-butanol boiling point,therefore a complete separation was notexpected.Butyric acid was considered,although the boiling point of butyric acid is significantly different to the n-butanol boiling point,as n-butanol is the bottom product of the n-butanol-water separation step after the fermentation process in the n-butanol production and remaining butyric acid therefore accumulates in the product stream.Due to relatively small differences of the boiling points of the remaining components isobutanol,1-propanol,2-methyl-1-butanol and 3-methyl-1-butanol in comparison to n-butanol,these components were also taken into account for further investigation.
3.2.2.Impurities in bio-acrylic acid
First studies on the synthesis ofacrylic acid from renewable basic materials were started recently and are almost only performed in research facilities.The most promising feedstock for the production of bio-based acrylic acid is lactic acid[30].The synthesis of acrylic acid from lactic acid can be performed by a chemically catalysed dehydration reaction or by a fermentation process.During the chemical synthesis,side reactions like decarbonylation,decarboxylation,reduction-or condensation reactions can occur,resulting in yields of just 40%-60%[23].Besides the intermediate lactic acid,which is already being produced in an industrial scale[23],the biosynthetic production of acrylic acid from glucose can,among others,be conducted with 3-hydroxypropionic acid,glycerol and 3-hydroxypropionaldehyde as precursors[23,31,32].Due to the two reactive functional groups in the lactic acid molecule,acetic acid and propionic acid are also produced by biosynthetic synthesis of acrylic acid using Clostridium propionicum[33].A recent revision on a potential C3value chain and production processes for acrylic acid from conventional and biological carbon sources was published by Ding and Hua[32],focussing on the biological production of acrylic acid from 3-hydroxypropionic acid.The identified potential impurities in acrylic acid,their boiling points at 0.58 bar as well as the boiling point of the main component acrylic acid and if they were considered for further investigations are summarised in Table 5.
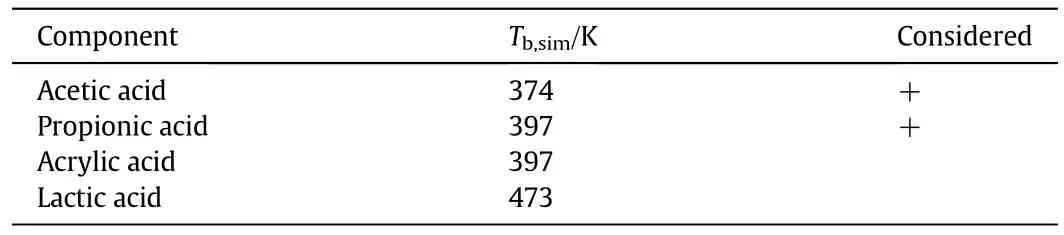
Table 5 Pure component boiling points of acrylic acid and the potential bio-based impurities at p=0.058 MPa calculated using Aspen Plus™.The impurities marked with “+”were considered for further investigations
As a result of the boiling points of the two acids propionic acid and acetic acid close to acrylic acid,a complete separation of these components from the reactant acrylic acid was not assumed and both acids were taken into account as potential impurities.Lactic acid was not taken into account,as the boiling point of lactic acid is very different to the acrylic acid boiling point and no azeotrope is formed by these two components.
3.2.3.Side-reactions
The unit operation investigated in this study was a reactive distillation column with the catalyst Amberlyst 46™immobilised in the reactive section.All impurities identified in n-butanol(Section 3.2.1)and acrylic acid(Section 3.2.2)were alcohols or acids,so that esterification reactions of the impurities also occurred in the reactive section of the column.Due to the small concentrations of the impurities of up to 3000 mg·kg-1,only esterification reactions of an impurity together with a main component(either acrylic acid or n-butanol)were taken into consideration.Side-reactions of the impurities among one another were not taken into account,as the probability of a side-reaction of two impurities is significantly smaller than the reaction of an impurity with one of the main components.The identified potential impurities resulting from the side-reactions in the reactive distillation column,their boiling points at 0.58 bar and if they were considered for further investigations are summarised in Table 6.

Table 6 Pure component boiling points of the potential esters formed through side-reactions at p=0.058 MPa calculated using Aspen Plus™.The impurities marked with “+”were considered for further investigations
Among the impurities listed in Table 6,butyl acetate,butyl propionate and butyl butyrate are results of reactions of an impurity with nbutanol and propyl acrylate,isobutyl acrylate,2-methyl-1-butyl acrylate and 3-methyl-1-butyl acrylate result from reactions of impurities together with the main componentacrylic acid.As the main component was present in a large excess compared to the impurity,the sidereactions were therefore assumed to be instantaneous.
3.2.4.Thermodynamic and physical property data
The use of reliable thermodynamic and physical property data is essential to allow a high accuracy of the simulated processes.The property data of the main components acrylic acid,n-butanol,n-butyl acrylate and water were already successfully validated in a preliminary study[8].
The thermodynamic and physical property data of the additional impurities considered in this study were calculated using Aspen Plus™.For the calculation of the activity coefficients,the UNIQUAC model was used.Nonidealties in the gas phase were calculated using the Hayden O'Connell equation of state.For the validation of the vapour pressures,the simulation results were compared to literature data published by Yaws[34]for all components.A comparison of the simulated and literature data of the vapourpressures of n-butanoland the impurities in the n-butanol feed stream is shown in Fig.4.
As shown in Fig.4,a high accuracy was achieved in the description of the vapour pressures of n-butanol and the impurities identified in the nbutanol feed stream.A comparable accuracy was also found for all other investigated components,the impurities in acrylic acid and the sideproducts.

Fig.4.Vapour pressures of n-butanol and the impurities identified in the n-butanol feed stream.Symbols represent the literature data and lines represent the simulated results of the Aspen Plus™simulations.
The validation of the binary vapour-liquid equilibria simulated with Aspen Plus™was also done by a comparison to available literature data.
As literature data was notavailable for allvapour-liquid equilibria of the impurities with the main components,only the isobutanol-nbutanol[35],acetic acid-n-butanol[36],2-methyl-1-butanol-nbutanol[37],3-methyl-1-butanol-n-butanol[37],butyl acetate-nbutanol[38],acetic acid-water[39],butyl propionate-water[40]and 1-propanol-water[41]vapour-liquid equilibria were checked against literature data.A good agreement between experimental and simulated data for the above mentioned vapour-liquid equilibria was found.
3.2.5.Clustering of impurities
In this step,the impurities were clustered based on pure-component and mixture property data,the formation of azeotropes and immiscibilities and the shape of vapour-liquid equilibria.The clustering was performed based on the following rules:
-The boiling points of several components sharing a cluster should only differ by~10 K at maximum.
-Components sharing a cluster should possess comparable vapourliquid equilibria with the main components.
-Components sharing a cluster should only form azeotropes with the same main components in the same range of concentrations.
-Components sharing a cluster should exhibit comparable miscibility gaps with the main components.
An example showing a comparison of two components that were summarised in a cluster based on the abovementioned rules is given in Fig.4.The identification of the impurities,shown in Section 3.2.1 to 3.2.3,resulted in fourteen impurities.A summary of the identified impurities is shown in Table 7.Based on comparisons,identifying the similarity of the identified impurities with respect to their property data,one representative component was selected for each identified group ofimpurities.For the identification of the representative component for each cluster,the following two rules were applied:

Table 7 Clustering of impurities from bio-based AA and BuOH
(1)The representative component of a cluster is chosen based on the similarity of its boiling point to the boiling point of the desired product and based on azeotropes,which increase the complexity of the separation of this component from the desired product.The component which possesses the closest boiling point to the desired final product is chosen as representative component for the whole cluster.
(2)In the process of choosing a representative component,the reliability of the simulated thermodynamic and physical property data,which was validated using experimental literature data in Section 3.2.4,is always taken into account.For almost identical boiling points and azeotropes for several components in a cluster,the representative component is chosen based on the property data reliability.
As an example for the proposed clustering step,in Fig.5 the vapourliquid equilibria of 2-methyl-1-butanol and 3-methyl-1-butanol with the four main components are shown.As literature data was only available for atmospheric pressure,the vapour-liquid equilibria were compared at 0.1 MPa.
It can be seen from a comparison of the vapour-liquid equilibria,that both components show a similar separation behaviour in the reactive distillation process.Both,the slopes of the vapour-liquid equilibria and the temperature levels are comparable.As the boiling point of 3-methyl-1-butanol is higher than the boiling point of 2-methyl-1-butanol and the separation in the reactive distillation process is more difficult as it will accumulate stronger in the bottom together with the main product n-butylacrylate,3-methyl-1-butanol was used as the representative component for this cluster.The selection of a representative component for the isobutanol/propanol cluster was performed in a comparable way and isobutanol was selected and was used in the following steps.
Among the impurities found in the reactants,the other components acetic acid,butyric acid and propionic acid could not be clustered due to large differences in their thermodynamic and physical property data.These components were therefore studied individually.
Beside these impurities,the esters resulting from side-reactions in the reactive distillation column were analysed.Three clusters were formed(Table 7)and one representative component was identified for each cluster using the same criteria as shown above.The cluster of butyl acetate and propyl acrylate was represented by butyl acetate;the cluster of butyl propionate and isobutyl acrylate was represented by butyl propionate and the last cluster of butyl butyrate,3-methyl-1-butyl acrylate and 3-methyl-1-butyl acrylate was represented by butyl butyrate.A summary of all impurities,the formed clusters and the chosen representatives is given in Table 7.

Fig.5.Vapour-liquid equilibria of 2-methyl-1-butanol with the four main components at 0.1 MPa.Symbols represent the literature data taken from Aucejo et al.[37]and lines represent the simulated results of the Aspen Plus™simulations.
3.3.Step-3:process simulation and process analysis
After Step-2 of the design approach was completed,the amount of impurities was reduced from fourteen to eight.Nevertheless,a nonequilibrium-stage simulation of the reactive distillation process in Aspen Custom Modeler™,taking eight impurities and the four main components into account,results in a high computational effort.In the third step of this approach the number of investigated impurities is therefore further reduced by performing process simulations using the module RadFrac implemented in Aspen Plus™.
3.3.1.Model initialisation
At the beginning of Step-3,the used RadFrac model was at first adapted to the optimised RD column configuration resulting from Step-1,which is summarised in Section 3.1.Beside the column configuration,also the kinetic data used in Step-1 was implemented in Aspen Plus™.As the LHHW approach[42,43],which was used in Aspen Custom Modeler™for the kinetic description[8],is not available in Aspen Plus™,the parameters of the power law kinetic expression(implemented in Aspen Plus™by default)were fitted to simulated data using the LHHW approach and implemented in Aspen Plus™.After the reactive distillation column was completely set-up,the simulation results of the Aspen Plus™model were validated against the results of the experimentally validated Aspen Custom Modeler™ model of Step-1 and the validated Aspen Plus™model was afterwards used for the simulation studies in Step-3.
3.3.2.Determination of effect of impurities
In this step,the representative impurities were studied and the impurities with the biggestimpacton the final product purity,from now on referred to as key components,were identified.The effects of the different impurity concentrations on the reactive distillation process were investigated in a range from 0.001 mol·mol-1to 0.003 mol·mol-1,with steps of 0.0005 mol·mol-1each,to determine the maximum concentration of the single impurities that still allow a sufficient purity of the final product.
For the investigation of the separation behaviour of the single impurities,detailed knowledge of the formed azeotropes of impurities with the four main components is essential.Table 8 summarises these azeotropes for an operating pressure of 0.058 MPa,the operating pressure of the optimised reactive distillation configuration described in Step-1(Section 3.1).The distillate temperature of the optimised reactive distillation process was 354 K and the bottom product boiling point was 401 K.
3.3.2.1.Key components in acrylic acid feed stream.The components in this section were studied with respect to their accumulation in the distillate and the bottom product stream of the reactive distillation process and the key components were selected based on these results.The components with the biggest impact on the product purity were identified as key components.
Fig.6 shows the accumulation of the representative acrylic acid impurities propionic acid and acetic acid in the distillate and bottom product of the reactive distillation column.Both impurities were fed with concentrations of up to 0.003 mol·mol-1and the accumulation in the column product streams was analysed in dependency of the impurity concentration.As shown in the figure,propionic acid mainly accumulates in the bottom product.This is a result of the boiling point of propionic acid,which is 397 K at 0.058 MPa and the heavy boiling azeotrope of propionic acid and n-butyl acrylate(see Table 8).A small amount of the propionic acid was removed together with the top productdue to the feed position of acrylic acid close to the top of the reactive distillation column(see Fig.3).Acetic acid has a boiling point of373 Kat 0.058 MPa and forms an azeotrope with n-butanol with a boiling point of379 K.It was therefore not only removed at the bottom,but is also to a small extent removed at the top of the column.
As a result of the investigation of the two representative components in acrylic acid,propionic acid was chosen to be the key component,as it has a higher boiling point and was accumulated almost completely in the final product.It was therefore assumed,that if propionic acid is investigated in more detail and could be removed completely from the final product,the other impurities in acrylic acid will be removed as well.
3.3.2.2.Key components in n-butanol feed stream.In the n-butanol feed stream,the four representative impurities isobutanol,3-methyl-1-butanol,acetic acid and butyric acid were identified in Section 3.2.1.The investigation was performed comparable to the investigation of the acrylic acid impurities and key components were identified based on the simulation studies.The simulation results of adding 0.003 mol·mol-1of the four impurities to the n-butanol feed stream are,together with the results for the other representative impurities,summarised in Fig.7.It was found that the three impurities 3-methyl-1-butanol,acetic acid and butyric acid completely accumulate in the bottom product.For butyric acid this resulted from the high boiling point of 419 K at 0.058 MPa.The other components acetic acid,with a boiling point of 373 K at 0.058 MPa,and 3-methyl-1-butanol,with a boiling point of 388 K at 0.058 MPa,have lower boiling points.Furthermore,3-methyl-1-butanol forms a light-boiling azeotrope with water.The reason for the exclusive accumulation of these two components in the bottom product was mainly the position of the n-butanol feed stream close to the bottom of the reactive distillation column(see Fig.2).The fourth component isobutanol is solely accumulated in the distillate stream due to the low boiling point of 366 K and the lightboiling azeotrope with water with a boiling point of 349 K at 0.058 MPa.Isobutanoldid therefore notaccumulate in the bottom productat all.But in the simulations performed with Aspen Plus™,the accumulation of isobutanol in the distillate resulted in a concentration of more than 0.004 mol·mol-1of n-butanol in the bottom product,leading to a significantly reduced n-butyl acrylate purity.
Among the impurities found in n-butanol,isobutanol and butyric acid were chosen as key components.Isobutanol was chosen as it indirectly decreased the product purity by pushing n-butanol towards thebottom of the column.Butyric acid was chosen,as it had the highest boiling point among the remaining three impurities.

Table 8 Binary azeotropes of the impurities together with the main components at 0.058 MPa.The data shown in this table were generated using Aspen Plus™

Fig.6.Results of the Aspen Plus™simulations to investigate the accumulation of the impurities in the acrylic acid feed stream in the distillate and bottom product of the reactive distillation column.
3.3.2.3.Key components among side-products.Beside the impurities identified in the acrylic acid and n-butanol feed streams,three representative esters were identified in Section 3.2.5,namely butyl acetate,butyl propionate and butyl butyrate.As these esters were results from sidereactions of one impurity with a main component and are therefore formed in the reactive distillation column,they can be present along the whole column height.To investigate the accumulation of the esters in the distillate and bottom product in dependency of the feed position,the three representative esters were fed with both feed streams separately and the accumulation of the esters in the distillate and bottom product was monitored for each investigation.
When the impurities were fed with the n-butanol feed stream at the bottom of the column,all three esters mainly accumulate in the bottom product(see Fig.7).This was a result of the high boiling points of butyl propionate(399 K at 0.058 MPa)and butyl butyrate(418 K at 0.058 MPa)and the lack of light-boiling azeotropes formed together with the main components.The third ester,butyl acetate,has a lower boiling point of 381 K at 0.058 MPa and forms a light-boiling azeotrope together with water,with a boiling point of only 350 K at the same pressure.Due to this azeotrope,still a significant amount of butyl acetate was found in the distillate,although it was fed very close to the bottom of the reactive distillation column.

Fig.7.Resulting concentration of impurities in top and bottom product after addition of 0.003 mol·mol-1 in one feed stream.
When the impurities were fed together with the acrylic acid feed at the top of the reactive distillation column,only butyl butyrate,due to the high boiling point,solely accumulates at the bottom of the column.Butyl propionate mainly accumulates at the bottom,but a small amount was still found in the distillate.The third ester,butyl acetate,only accumulated in the distillate and only tracks were found in the bottom product,due to the light-boiling azeotrope formed together with water.
To summarise,butyl butyrate was found to be the most critical component among the three representative esters with respect to the final product purity.Independent of the feed position,butyl butyrate solely accumulated in the bottom product,reducing the final product purity.Therefore,butyl butyrate was found to be the key component and was studied in more detail in Step-4 of the proposed design approach.
Based on the results shown above,four key components were identified among the eight representative components identified in the second step.These key components,summarised in Table 9,represent the fourteen components identified in Step-2 of the design approach and will be studied in more detail in Step-4 presented in the next section.
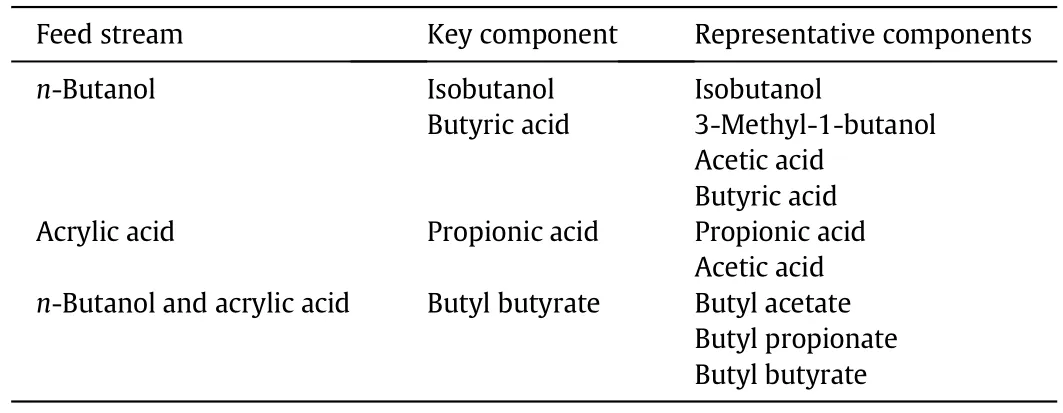
Table 9 Overview of the selected key components
3.4.Step-4:detailed design of bio-based process
In the fourth step of the proposed design approach,the key components identified in Step-3 were investigated in more detail.Based on the analysis in Step-4,maximum concentrations of the impurities in the feed streams are identified,still allowing a sufficient final n-butyl acrylate purity.
3.4.1.Impact of key impurities
The impact of the key components on the final product purity was studied and maximum impurity concentrations,still achieving the desired purity in a single reactive distillation process,were found.Afterwards,the change of operational parameters to increase the purity of the final product,without changing the set-up of the reactive distillation column or using additional unit operations,was investigated.
In Fig.8,the results of the investigation of the different key components are shown.The key impurity concentrations were varied between 0 and 0.003 mol·mol-1with a step length of 0.005 mol·mol-1each.In these studies,the resulting purity of the final product n-butylacrylate at the bottom of the reactive distillation column was determined in dependency of the impurity and the concentration.The key components that were investigated are propionic acid and butyl butyrate in the acrylic acid feed stream(shown on the leftside of Fig.8)and isobutanol,butyric acid and butyl butyrate in the n-butanol feed stream(shown on the right side of Fig.8).
The two impurities investigated together with the acrylic acid feed stream,propionic acid and butyl butyrate,exhibited an almost identical behaviour with respect to their influence on the final purity of n-butyl acrylate.Both impurities reduced the n-butylacrylate purity in the reactive distillation process from 99.97%to 99.44%(by mole),when 0.003 mol·mol-1of the impurity was added.For an assumed necessary specification of≥99.7%(by mole)for n-butyl acrylate,a maximum total impurity concentration of approximately 0.0013 mol·mol-1in the acrylic acid feed streamshould not be exceeded,assuming a negligible concentration of key impurities in the n-butanol feed.
In the n-butanolfeed stream,the three impurities isobutanol,butyric acid and butyl butyrate were investigated(see right side of Fig.8).The two impurities butyric acid and butyl butyrate exhibited,comparable to the two impurities investigated in the acrylic acid feed stream,an almost identical behaviour.The purity of n-butylacrylate was notreduced as much as for the acrylic acid impurities,which was a resultof the used excess of acrylic acid and therefore the higher total amount of impurities fed with the acrylic acid stream.For an impurity concentration of 0.003 mol·mol-1for the impurities butyric acid and butyl butyrate,the n-butyl acrylate purity was reduced from 99.97%to 99.55%(by mole).Hence,an assumed specification of≥99.7%(by mole)for n-butyl acrylate was achieved as long as the total impurity concentration was below approximately 0.0018 mol·mol-1.For the third key component,isobutanol,the excessive influence on the n-butyl acrylate purity that was identified from the simpler Aspen Plus™RadFrac model in Step-3,could not be confirmed.Instead,the small amounts of isobutanol in the n-butanolfeed stream left the column together with the distillate without having a strong influence on the bottom product purity.High isobutanol concentrations in the feed streams of up to 0.003 mol·mol-1were therefore not critical for the purity of the final product n-butyl acrylate.
In this part of the investigation,the maximum impurity concentrations were identified for both single streams.As the impact of the impurity concentration results in a linear decrease of the n-butyl acrylate purity,the maximum impurity concentrations in the single feeds for an occurrence of key impurities in both feeds simultaneously can be estimated,by just checking the purity reduction caused by the key impurities individually and hereby determine the combined impact.
3.4.1.1.Variation of operational parameters.When fed with the feed streams,the key components butyl butyrate,propionic acid and butyric acid significantly reduced the n-butyl acrylate purity in the reactive distillation process.To discover the potential of the reactive distillation process to deal with the key components with only changing operational parameters,the impact of changes of the three operational parameters,distillate-to-feed(DF)ratio,molar reactant ratio(BuOH/AA)and reflux ratio(RR)was investigated.These studies were performed for all key components fed together with the associated feed stream.As the results for all key components were comparable,only the studies for propionic acid fed together with acrylic acid were summarised in the supplementary material.
In summary,a change of the three operational parameters DF ratio,RR and the molar feed ratio in the reactive distillation process only had minor effects on the purity of n-butyl acrylate.For the other key components listed in Table 9,comparable results to the propionic acid results shown in the supplementary material were obtained.Therefore,if the n-butyl acrylate purity is out of spec due to impurity concentrations above the limits given in Section 3.4,additional unit operations for the purification are required.
3.5.Impact of bio-based raw materials on reactive distillation process
For the production of n-butyl acrylate from acrylic acid and nbutanol the four key components isobutanol,butyric acid,propionic acid and butyl butyrate were identified for the reactive distillation process.
Isobutanol is a microbial by-product formed in the fermentation process and is a key component representing both,isobutanol and propanol.In the detailed process modelling it was found,that the impact of isobutanol on the n-butyl acrylate purity is small.The selectivity towards isobutanol in the bio-butanol production process is therefore not a critical factor for bio-butyl acrylate production.
Butyric acid was found to be the critical component among the heavy boiling impurities in bio-butanol.It is a precursor of n-butanol in the fermentation process and solely accumulates in the final product,reducing the product purity.To decrease the concentration of butyric acid in bio-butanol,higher conversions of the precursors need to be achieved in the fermentation process.
Among the impurities identified in acrylic acid,propionic acid was found to be the most critical with respect to the product purity.Propionic acid is a side-product of the fermentation process and by increasing the microbial selectivity in the fermentation process for the production of acrylic acid,the concentration of propionic acid in bioacrylic acid can be reduced.
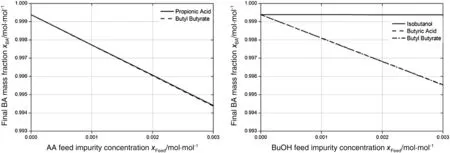
Fig.8.Resulting n-butyl acrylate purities in reactive distillation process in dependency of key component concentration in the feed streams.The key components identified in the acrylic acid feed stream are shown on the left and the n-butanol key components are shown on the right side.
Butyl butyrate was found to be the key component among the esters formed in the reactive distillation process.It is formed in an esterification reaction of butyric acid and n-butanol and a formation of this ester(and all the other esters as well)can be avoided,by reducing the concentration of the impurity reactant in the feed.As butyric acid was identified as a key component in n-butanol anyway,a reduction of the butyric acid concentration by increasing its conversion in the fermentative n-butanol production process will reduce the concentration of both key impurities,butyric acid and butyl butyrate.
Besides changing the fermentation processes of bio-acrylic acid and bio-butanol,a removal of the impurities from the reactants or from the final product n-butyl acrylate can also be performed by using an additional purification step.In a previous study,the use of a semicontinuous distillation system for the removal of the impurities was studied[22].Semicontinuous processes can separate light-and heavy boiling impurities simultaneously,achieving multiple separation steps in a single column.This process concept has shown a high potential for the removal of bio-based impurities,if the operating window,identified in Step-4 of the proposed approach,is exceeded regularly due to high impurity concentrations.Due to the high flexibility of the semicontinuous process,it can also be used for the removal of impurities from other bio-based systems.
4.Conclusions
The 4-step approach described in this manuscript aimed at the development of a process for the production of n-butyl acrylate using bio-derived n-butanol and acrylic acid.In total,fourteen impurities could be identified resulting from the bio-based nature of the raw materials.Among these fourteen impurities,four key components were found using the presented methodology.A process analysis with the key components was performed to identify the operating window of the reactive distillation process and the potential of the single reactive distillation column to remove the key components from the final product.
By the identification of the key impurities,the most critical impurities with respect to the product purity in the reactive distillation process were found.Based on these results,the selectivity of the fermentation process upstream of the reactive distillation column can be modified to reduce the key impurity concentrations in the biobased reactants.If a high concentration of some impurities cannot be avoided in the fermentation process and the reactive distillation column cannot be operated in the identified process window,additional purification steps which are flexible in terms of the streams that have to be purified should be used.Here intensified processes such as HiGee distillation[1]or a semicontinuous distillation unit are suggested[22].
Nomenclature
DF distillate-to-feed mass ratio
p top pressure of reactive distillation column,MPa
T temperature,K
UNIQUAC Universal Quasichemical
Subscripts
b at boiling point
sim simulated
Acknowledgements
The research leading to these results has received funding from the European Union Seventh Framework Programme(FP7/2007-2013)under grant agreement no.241718,Eurobioref.
Appendix A.Supplementary data
Supplementary data to this article can be found online at http://dx.doi.org/10.1016/j.cjche.2015.08.019.
 Chinese Journal of Chemical Engineering2015年11期
- Chinese Journal of Chemical Engineering的其它文章
- N-methyl-2-(2-nitrobenzylidene)hydrazine carbothioamide—A new corrosion inhibitor for mild steel in 1 mol·L-1 hydrochloric acid
- A dual-scale turbulence model for gas-liquid bubbly flows☆
- Gas-liquid hydrodynamics in a vessel stirred by dual dislocated-blade Rushton impellers☆
- Convective mass transfer enhancement in a membrane channel by delta winglets and their comparison with rectangular winglets☆
- Cobalt-free gadolinium-doped perovskite Gd x Ba1-x FeO3-δas high-performance materials for oxygen separation☆
- Synthesis and adsorption property of zeolite FAU/LTA from lithium slag with utilization of mother liquid☆