
Optimal design of anchor cables for slope reinforcement based on stress and displacement felds
2015-02-09 01:28GunghuYngZhihuiZhongYuchengZhngXudongFu
Gunghu Yng,Zhihui Zhong,Yucheng Zhng,Xudong Fu
aSchool of Civil and Architectural Engineering,Wuhan University,Wuhan,430072,China
bGuangdong Research Institute of Water Resources and Hydropower,Guangzhou,510610,China
cGeotechnical Engineering Technology Center of Guangdong Province,Guangzhou,510640,China
dEmergency Technology Research Center of Guangdong Province for Public Events,Guangzhou,510640,China
Optimal design of anchor cables for slope reinforcement based on stress and displacement felds
Guanghua Yanga,b,c,d,*,Zhihui Zhonga,b,Yucheng Zhangb,c,Xudong Fua
aSchool of Civil and Architectural Engineering,Wuhan University,Wuhan,430072,China
bGuangdong Research Institute of Water Resources and Hydropower,Guangzhou,510610,China
cGeotechnical Engineering Technology Center of Guangdong Province,Guangzhou,510640,China
dEmergency Technology Research Center of Guangdong Province for Public Events,Guangzhou,510640,China
A R T I C L E I N F O
Article history:
Received 19 January 2015
Received in revised form
16 April 2015
Accepted 17 April 2015
Available online 16 June 2015
Slope
Stress level
Displacement feld
Optimal arrangement
Variable-modulus elastoplastic model
How to determine reasonable position and length of anchor cable is a frequently encountered but not well addressed problem in slope reinforcement projects.In this paper,the variable-modulus elastoplastic strength reduction method(SRM)is used to obtain the stress feld,displacement feld,and factor of safety of slope.Slope reinforcement using anchor cables is modeled by surface loading,i.e.different distributions of surface loading represent various reinforcement schemes.Optimal reinforcement scheme of anchor cables can be determined based on slope stress and displacement felds.By comparing the factor of safety and stress feld before and after slope reinforcement,it is found that better reinforcement results can be achieved if strong reinforcement is applied upon the regions with high stress and large displacement.This method can well optimize the arrangement of anchor cables.In addition, several cases are employed to verify the proposed method.
©2015 Institute of Rock and Soil Mechanics,Chinese Academy of Sciences.Production and hosting by Elsevier B.V.All rights reserved.
1.Introduction
There are various types of reinforcement schemes for slopes, among which anti-slide piles and anchorcables are commonly used in order to offer resistance forces.It is a frequently encountered but not well solved problem for engineers to determine the reasonable position and length of anchor cable in slope reinforcement projects. The limit equilibrium method(LEM)is one of the commonly used methods;however,it only considers the equilibrium of total force, which means that comparison of different anchor positions of the slope is impossible.The numerical methods,such as fnite element strength reduction method(FE SRM)(Zheng,2012),are able to offer more detailed information,which are,unfortunately,not yet desirable when used.
Numerous researches have been conducted on the optimal reinforcement position of anti-slide piles.Hassiotis et al.(1999) pointed out that arranging anti-slide piles in the middle or top of the slope can increase the entire slope stability.Ausilio et al.(2001) presented that the optimal position of anti-slide piles is the bottom part of the slope.By employing the LEM,Li et al.(2005)proposed that the optimal positionof anti-slide piles is the lowest pointof the potential sliding surface.Based on the centrifuge tests,Gao et al. (2009)reported that the maximum factor of safety can be reached whenpiles are inserted in the middle of the slope,andNian et al.(2012)drew a similar conclusion through a simple threedimensional(3D)slope calculation.Based on the energy analysis method,Tan et al.(2011)pointed out that the optimal position of piles to reinforce slope should be located at the lower part of the slope.It can be seen that the above conclusions are signifcantly varied.Thus,a new solution to identify the optimal reinforcement position of anti-slide piles is needed.
In fact,there is a close relationship among stress feld, displacement feld,and stability of the slope(Huang,2008). Considering that the stress and strain can be obtained by numerical methods such as fnite element method(FEM),many scholars attempted to obtain the optimal reinforcement by analyzing the stress and displacement felds of the slope.Li et al.(2008)presented various methods for active slope reinforcement based on stress control in a critical sliding surface.Using deformation reinforcement theory,Liu et al.(2011)pointed out that the critical reinforcement position can be determined based on the distribution and magnitude of unbalanced forces in terms of strength reduction.Yang et al.(2009,2012)proposed that the optimal reinforcement position can be determined by the stress and displacement felds of the slope,i.e.the region characterized by higher stress level and larger displacement.The actual anchorposition is related to the type of sliding:for sliding induced by pushing force,the optimal anchor position is set at the top of the slope;while for sliding induced by traction,the optimal position is determined at the middle to bottom parts.
Therefore,it is more reasonable to identify the failure mechanism and determine the corresponding anchor position by investigating the stress and displacement felds of slope.Likewise,the optimal arrangement of anchor cables can be determined based on the stress and displacement felds of the slope.As a result,the variable-modulus elastoplastic strength reduction method(SRM)is adopted to calculate the stress feld,displacement feld,and factor of safety of slope.This method is proposed based on the variablemodulus elastoplastic model(Yang et al.,2009)that is more appropriate for soil.
Moreover,how to simulate the anchor cable is another critical issue.The behaviors of anchor cable and soil-anchor interactions have been extensivelystudied by researchers(e.g.Desai et al.,1986; Briaud and Lim,1999).For example,Cai and Ugai(2003)used 3D zero-thickness elastoplastic interface elements to simulate the soilanchor interactions.In this paper,reinforcement of anchor cable is realized by surface loading(Hryciw,1991),i.e.different distributions of surface loading represent various reinforcement schemes. Accordingly,the optimal scheme is obtained by comparing the effects of different reinforcement schemes with two slope cases. Finally,the general relationship among the stress feld,displacement feld,and optimal reinforcement arrangement of anchor cables is obtained bycomparing the effects of different reinforcement schemes.
2.Constitutive model and strength reduction method
2.1.Variable-modulus elastoplastic model
In order to obtain more accurate stress and displacement felds, the variable-modulus elastoplastic SRM(Yang et al.,2009)is used in this paper.The constitutive model combines the Duncan-Chang model with the deformation mode of in situ soil(Yang,2001), which also takes the relationship among deformation modulus, Poisson’s ratio,stress level,and strength into account.The deformation parameters related to the model are determined by

whereEtis the deformation modulus;Eiis the initial tangent modulus;Rfis the damage ratio,identical to that of Duncan-Chang model;μtis the Poisson’s ratio;μiis the initial Poisson’s ratio;μfis the Poisson’s ratio at failure,which is basically assumed to be 0.49; σ1is the major principal stress;σ3is the minor principal stress; (σ1-σ3)fis the ultimate shear strength of Mohr-Coulomb criterion, and can be written as

As can be seen from Eq.(1),the deformation modulusEtdecreases when the strength of soil decreases or the stress level increases,which coincides with the deformation characteristic of soil.Moreover,the parameters used in this model can be determined through in situ tests(Yang et al.,2014).Therefore,the variable-modulus elastoplastic model is considered to be closer to the actual situation.
The stress level is an important index refecting the stress state of soil,and it can be defned as the ratio of the deviator stress to the ultimate shear strength,i.e.

When the stress level(S)approaches 1,the soil element is approaching to failure.Generally speaking,for a region associated with high stress level,the corresponding displacement is large as well;hence,the stress level can be used as an indicator to determine the optimal anchor position.For slope stability problems,the stress level of certain region can be used to estimate whether the region is likely to fail or not.
2.2.Strength reduction method
The SRM(Lian et al.,2001;Zhao et al.,2002;Zheng and Zhao, 2004)is a commonly used method to obtain the factor of safety of slope.This method gradually reduces the strength of soil by a strength reduction factor until the slope fails,the value of strength reduction factor is basically regarded as the factor of safety.The reduction method can be written as

wherecand φ represent the cohesion and angle of internal friction, respectively;c′and φ′represent the reduced cohesion and angle of internal friction,respectively;andfis the reduction factor.By using the variable-modulus elastoplastic SRM,the deformation modulus decreases as the strength decreases(Eq.(1)).
2.3.Slope failure criteria
Currently,the slope failure criteria in the SRM are mainly classifed into three categories:(a)whether the plastic zone develops from the toe to the top;(b)whether the calculation is convergent; and(c)whether the deformation of the critical point is beyond the limit.
In the case of complex slope model,it is diffcult to identify whether the plastic zone develops from the toe to the top of the slope.In addition,the critical point representing the critical displacement of the slope failure is not easy to be identifed. Thus,the above-mentioned failure criterion category(b)is adopted as the failure criterion in this paper.The factor of safety is searched by dichotomy,and the search process is described as follows:
(1)First,the initial range[f1,f2]of factor of safety should be estimated,given that the calculation should be converged whenf=f1,and not converged whenf=f2.
(2)Second,letf=(f1+f2)/2.If the calculation is convergent,then
f1=f;if not convergent,thenf2=f.The above steps are repeated until the difference betweenf1andf2is less than 0.001.
(3)Finally,the factor of safety isf=(f1+f2)/2.
The 3D fnite difference software,FLAC3D,is adopted in this study.The variable-modulus elastoplastic model and the SRM based on dichotomy are realized in FLAC3D,but here it is only used to analyze the plane strain problem.
3.Numerical simulation
3.1.Model analysis
In this section,a simple slope model is used to discuss the relationship among stress feld,displacement feld,and factor of safety of slope.The numerical model is shown in Fig.1.There are three soil layers in the model,i.e.landslide mass,sliding zone,and bed rock,from top to bottom.The sliding surface is planar and the thickness of the sliding zone is 0.5 m.The soil parameters are listed in Table 1.The variable-modulus elastoplastic model is adopted, withRfof 0.8,andμfof 0.49.
3.2.Analysis of stress and displacementfelds
For natural slope,the calculation results show that the factor of safety is 1.141 without considering the reinforcement of the slope. The distribution of stress levels of the slope is shown in Fig.2.It can be seen from Fig.2 that the areas associated with high stress level are concentrated in the sliding zone;while the stress level in other regions is relatively low,with the value less than 0.7.Fig.3 shows the distribution of stress levels of the sliding zone.It is clear from Fig.3 that the middle and bottom parts of the sliding zone have the highest stress level(close to 1).Therefore,the slope stability is suggested to be controlled by the strength of the sliding zone.
The strength of sliding zone is calculated by SRM with reduction factorf=1.05 to observe the development of deformation during failure process.It can be seen from Fig.4 that the largest displacement occurs in the middle and bottom regions,where the stress level and deformation are the greatest(Fig.5).Therefore,it is concluded that the deformation of the region is larger in terms of higher stress level.

Fig.1.Numerical model in FLAC3D(unit:m).

Table 1Soil parameters used in the numerical simulation.

Fig.2.Distribution of stress levels of slope.

Fig.3.Distribution of stress levels of sliding zone.

Fig.4.Horizontal displacement of slope(unit:m).
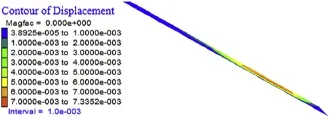
Fig.5.Displacement of sliding zone(unit:m).
3.3.Stressfeld,displacementfeld and optimal reinforcement position
In this numerical case,the anchor cables are used to reinforce the slope.To simplify the calculation,the reinforcement of anchor cable is simulated by surface loading.The cable stress is decomposed into horizontal and vertical pressures.
The preliminary estimation of load provided by anchor cable is described as follows:(a)each anchor cable can provide 200 kN;(b) the horizontal and vertical spacings are both 2 m;(c)the angle between the anchor cable and the level is 15°.Thus the horizontal and vertical pressures,SxxandSyy,on the slope surface are
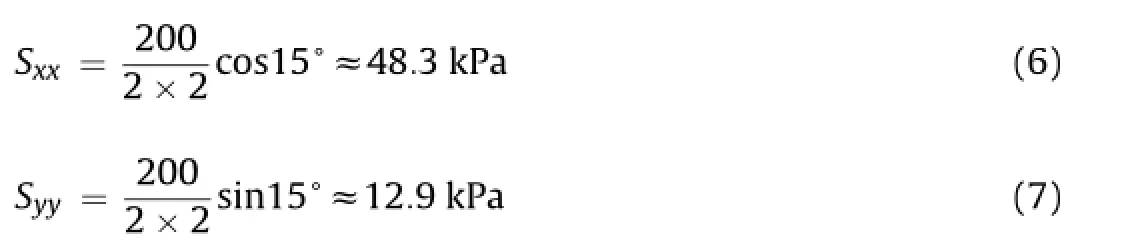
The horizontal and vertical stresses of 48.3 kPa and 12.9 kPa, respectively,are applied to the slope surface to simulate the local reinforcement.The distribution lengths of the horizontal and vertical loads are both 1 m(Fig.1).
It should be noted that the stress level of sliding zone varies along the vertical direction.Therefore,the stress level of sliding zone at certain height is represented by the average stress level of the corresponding soil elements.Fig.6 shows the relationships between the stress level of sliding zone and the factor of safety in different reinforcement positions.From Fig.6,it is known that alarger factor of safety can be obtained when the reinforcement position locates aty=7-14 m,where the stress level is relatively high as well(more than 0.9).
Figs.7 and 8 show the relationships between displacement feld (f=1.05)and the factor of safety in different reinforcement positions.It can be seen that the horizontal displacement of the slope surface aty=8-12 m is larger than that at other heights,and also the stress level of this region is higher.As a result,strengthening this region can yield a larger factor of safety.
The stress levels of sliding zones in different reinforcement positions are shown in Fig.9.In this fgure,if the reinforcement position is set in the middle or the bottom(y=8-14 m)of the slope,the stress level of sliding zone decreases signifcantly,thus it can effectively increase the factor of safety.Meanwhile,the displacement of this region is very large.Therefore,the optimal reinforcement position is set at the part of sliding zone that has high stress level as well as large displacement.
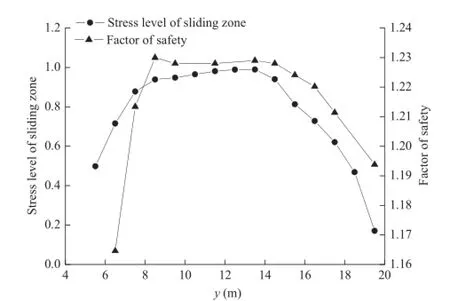
Fig.6.Relationships between stress level of sliding zone and factor of safety in different reinforcement positions.
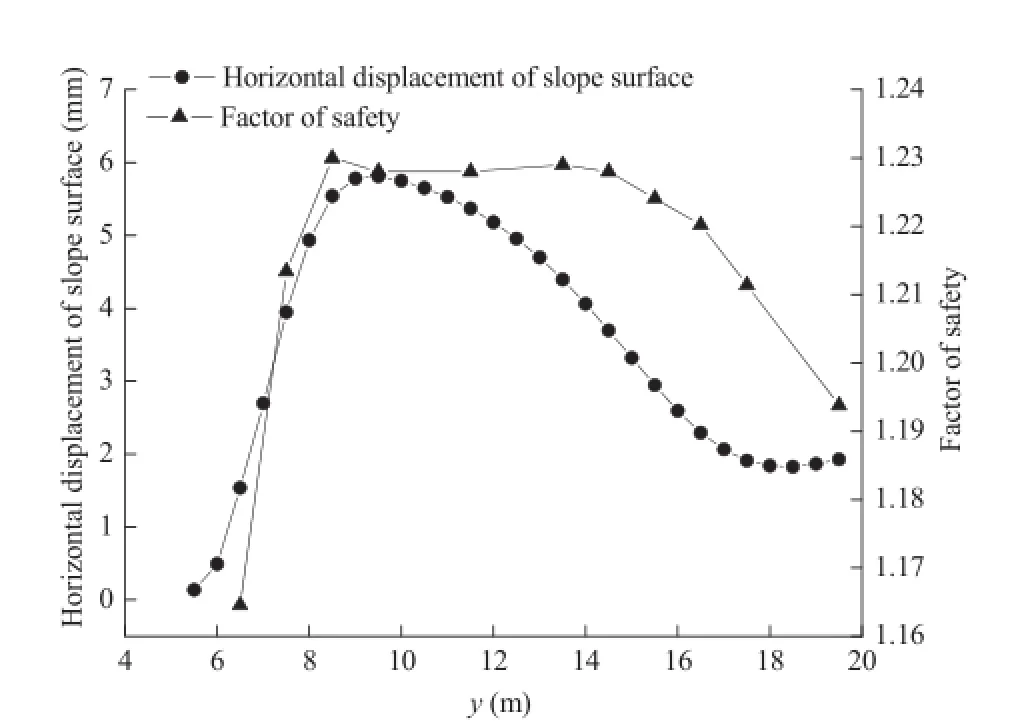
Fig.7.Relationships between horizontal displacement of slope surface and factor of safety in different reinforcement positions.
3.4.Optimal distribution of reinforcement loads under identical total reinforcement
For the slope reinforced by anchor cable or bolt,the reinforcement is simulated by surface loading.The optimal distribution of reinforcement is achieved by adjusting the load distribution type, and meanwhile,the total reinforcement keeps unchanged.The arrangement of anchor cables is determined according to the optimal distribution of reinforcement loads.
In this numerical case,four load distribution types are used,as shown in Fig.10:
(1)For load distribution type 1,the horizontal stress of 10 kPa is uniformly distributed on the entire surface,and the vertical stress is 3 kPa.
(2)For load distribution type 2,the load at the upper part of the slope is triangularly distributed,and that at the lower part is uniformly distributed.The maximum horizontal and vertical stresses are 12.5 kPa and 3.75 kPa,respectively.
(3)For load distribution type 3,the loads at the upper and lower parts are both triangularly distributed,and the load at the middle part is uniform.The maximum horizontal and vertical stresses are 13.65 kPa and 4.095 kPa,respectively.
(4)For load distribution type 4,the loads at the middle and lower parts(y=6-16 m)are uniformly distributed,and the horizontal and vertical stresses are 15 kPa and 4.5 kPa,respectively. The total load of four distribution types is 150 kN/m horizontally and 45 kN/m vertically.

Fig.8.Relationships between displacement of sliding zone and factor of safety in different reinforcement positions.

Fig.9.Stress levels of sliding zone in different reinforcement positions.
The factors of safety of the four load distribution types are listed in Table 2.The load distribution type 4 is proved to yield the largest factor of safety.The reason is that the main load is concentrated on the region where the largest stress level and slope displacementoccur.The load distribution type 3 is the next option,due to the fact that the displacement and stress level at both the foot and top are relatively low,thus the reinforcement load required in this position can be reduced.The load distribution type 1 is the worst in terms of the reinforcement effect,for the majority of reinforcement load is wasted at the upper part,which reduces the reinforcement effect at the middle and lower parts.However,it is more frequent to apply the load distribution type 1 in practice because it is easy to be implemented,though it is not the optimal arrangement.Therefore, the optimal load distribution type should be considered based on the stress level and displacement of sliding zone,i.e.more reinforcement load should be distributed at the positions where the stress level and displacement are large,in order that the maximum factor of safety can be obtained when the total reinforcement load is the same.
The total stress level of slope and the stress level of sliding zone for the load distribution types 1 and 4 are shown in Figs.11 and 12, respectively.It can be seen that,compared with the load distribution type 1,the load distribution type 4 reduces the high stress level of sliding zone more effectively,thus the factor of safety obtained is larger.

Fig.10.Schematic diagram of four load distribution types.

Table 2Factors of safety of four load distribution types.
4.Practical slope project No.1
4.1.General setting
A practical slope is shown in Fig.13.The slope is constituted of two soil layers,with six local slopes numbered from 1 to 6 sequentially.The anchor cables are used for slope reinforcement. The purpose of this case is to fgure out the optimal reinforcement scheme for the slope.The soil parameters are listed in Table 3,and the variable-modulus elastoplastic model is applied in this project, withRfof 0.8 andμfof 0.49.

Fig.11.Distribution of stress level of slope by different reinforcement load distributions.(a)Type 1,and(b)Type 4.

Fig.12.Stress level of sliding zone by reinforcement load distribution types 1 and 4.
The factor of safety of the slope without reinforcement is 1.111 when using the SRM,and it is 1.113 when using the Morgenstern-Price(M-P)method in the software Slope/W,which indicates that the result obtained by the SRM is close to that obtained from theLEM.Large shear strain would occur in the sliding zone when the slope collapses,thus the sliding surface can be determined through shear strain contours,as shown in Fig.14.

Fig.13.Profle of slope No.1.
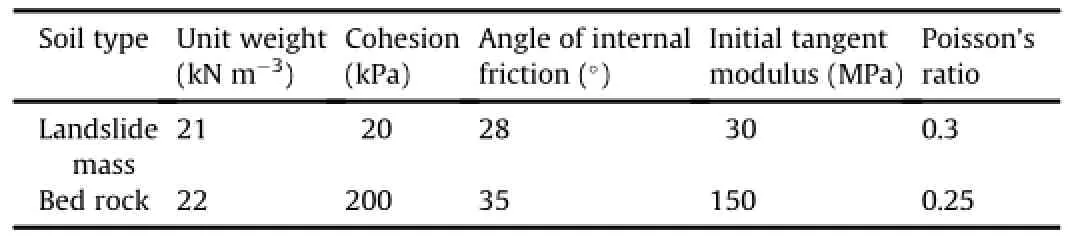
Table 3Soil parameters of slope No.1.
4.2.Analysis of stress and displacementfelds
The total stress level of the slope without reinforcement is presented in Fig.15,showing that the stress level of the slope is high.However,the area with high stress level does not connect the slope crest with the toe,thus the slope remains stable.The stress level of sliding zone is presented in Figs.16 and 17,showing that the stress level is higher at the upper and lower parts,while relatively lower in the middle.As is shown in Fig.17,the stress levels of the local slopes 1,2,4 and 5 are higher than those of the local slopes 3 and 6.
The strength of the slope is reduced by a factor of 1.04,so as to observe the displacement feld during its weakening.The horizontal displacement feld of the slope is illustrated in Fig.18,and the horizontaldisplacementof the slope surface along the elevation is shown in Fig.19.It can be seen that the displacement at the lower part is the largest,which occurs at the local slopes 1 and 2.With increasing elevation,the displacement decreases in the beginning, then increases,and fnally decreases.As a result,a peak value appears at the local slope 4.Combined with Fig.17,it is shown that the area with higher displacement also has larger stress level.
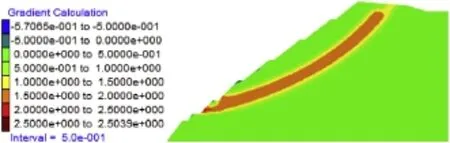
Fig.14.Sliding zone of slope No.1.

Fig.15.Distribution of stress level for slope No.1.
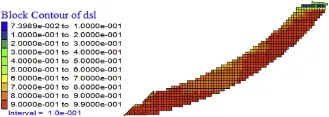
Fig.16.Distribution of stress level of sliding zone for slope No.1.
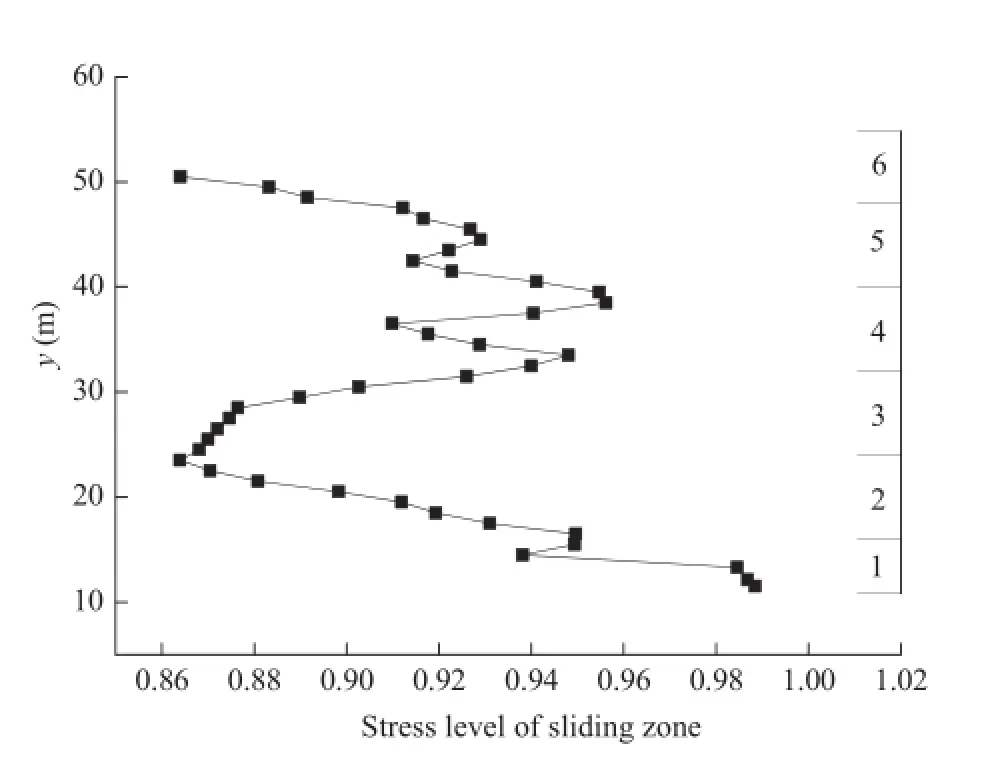
Fig.17.Stress level of sliding zone with respect to elevation for slope No.1.

Fig.18.Horizontal displacement of slope No.1(unit:m).

Fig.19.Horizontal displacement of slope surface with respect to elevation.

Table 4Slope surface area of each local slope per meter.
In other words,the maximum stress level and displacement occur at the local slopes 1 and 2,therefore the local slopes 1 and 2 are the critical areas that govern the slope stability.
4.3.Reinforcement design and optimal arrangement
The load provided byanchor cable(bolt)in this case is estimated initially as follows:the local slope 3 is a typical cross-section with surface length of 12.81 m,reinforced by three rows of anchor cable (bolt).Each row has a reinforcing force of 400 kN,and is placed at a horizontal spacing of 3 m.Assuming that the angle between anchor cable and the level is about 18°,the horizontal and vertical pressures on the slope surface are

Therefore,each local slope is applied with about 30 kPa of horizontal pressure and 10 kPa of vertical pressure,which is the Scheme 1.
However,according to the conclusion of the Section 3,it is not suitable to reinforce the slope surfacewith uniform pressures.More reinforcement load should be applied at the part where the stress level and displacement are larger.Consequently,two optimization schemes are proposed in accordance with the distribution of stress level and displacement feld ofthis slope:(1)1/3 ofthe reinforcement load of the local slope 3 is applied to the local slopes 1 and 2,respectively,and 2/3 of the reinforcement load of the local slope 6 is applied tothe local slope 2,which is the Scheme 2;(2)1/2 of the reinforcement load of the local slope 3 is applied to the local slopes 1 and 2,respectively,and all of the reinforcement load of the local slope 6 is applied to the local slope 2,which is the Scheme 3. The total reinforcement load is the same in each scheme.The areas of the slope surface per meter of each local slope are listed in Table 4,and the load distributions of each reinforcement scheme are shown in Table 5,whose schematic diagram is presented in Fig.20.
The factors of safety of the three reinforcement schemes are listed in Table 6,showing that the factor of safety of Scheme 1(the original one)is the lowest.The factor of safety of Scheme 2 slightly increases as the reinforcement load of the local slopes 3 and 6 is applied to the local slopes 1 and 2,thus the stress level and displacement are larger than those of the former.The factor of safety of Scheme 3 increases obviously by 0.064,for the whole reinforcement load of the local slopes 3 and 6 is applied to the local slopes 1 and 2,which is proved to be the optimal reinforcement scheme.
The stress levels of the slope in different reinforcement schemes are presented in Figs.21 and 22,showing that the total stress level decreases signifcantly after reinforcement.Moreover,the increase in stress level at the toe of the slope is more evident in the Schemes 2 and 3.The comparison of the stress level of sliding zone with and without reinforcement is demonstrated in Fig.23,showing that there is no signifcant difference in terms of the stress level at the middle part of sliding zone in the three schemes.Since the increasein stress level at the lower part of the slope is rather evident in Schemes 2 and 3,theyare more favorable of improving the safety of the lower part as a critical region.

Table 6Factors of safety of each reinforcement scheme for slope No.1.

Table 5Load distributions of each reinforcement scheme for slope No.1.
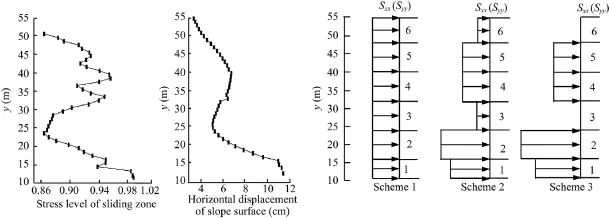
Fig.20.Schematic diagram of load distributions of three reinforcement schemes for slope No.1.
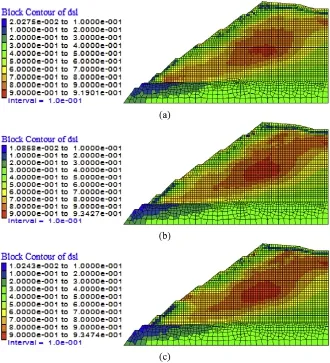
Fig.21.Distribution of stress levels of slope No.1 with reinforcement.(a)Scheme 1,(b) Scheme 2,and(c)Scheme 3.
5.Practical slope project No.2
5.1.General setting
A typical profle of a slope project is shown in Fig.24.The slope surface is classifed into several local slopes,numbered from 1 to 4 sequentially,and each is reinforced by anchor cables.The soil parameters of the slope are listed in Table 7,and the soil body is modeled by the various-modulus elastoplastic model,withRfof 0.8 andμfof 0.49.The retaining wall is modeled by the linear elastic model,and the elastic modulus is 30 GPa and the Poisson’s ratio is 0.2.
5.2.Analytical results
The factor of safety of the slope without reinforcement is 1.007, which is regarded as the ultimate state.The stress level of the slope without reinforcement is presented in Fig.25,showing that the stress level of the entire top soil is high,and the plastic zone appears.It should be noted that the stress level of the lower part(i.e. the local slope 2)approximates to 1.The strength of the entire slope is reduced bya factorof 1.02,so as to observe the displacement feld during the weakening,and then the slope fails.Furthermore,the horizontal displacement is observed after running 7000 calculation steps,as demonstrated in Figs.26 and 27,which show that the horizontal displacement is the largest at the lower part and relatively low at the top.

Fig.22.Distribution of stress levels of sliding zone with reinforcement for slope No.1. (a)Scheme 1,(b)Scheme 2,and(c)Scheme 3.

Fig.23.Stress level of sliding zone by different reinforcement schemes for slope No.1.

Fig.24.Profle of slope No.2.

Table 7Soil parameters of slope No.2.
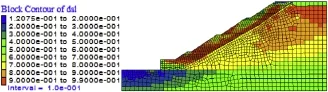
Fig.25.Distribution of stress levels of slope No.2 without reinforcement.

Table 9Factors of safety of each reinforcement scheme for slope No.2.
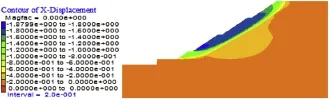
Fig.26.Horizontal displacement of slope No.2 without reinforcement(unit:m).

Fig.27.Horizontal displacement of slope surface without reinforcement(unit:m).

Fig.29.Distribution of stress levels of slope No.2 after reinforcement.(a)Scheme 1, (b)Scheme 2,and(c)Scheme 3.
Due to the overall high stress level,three reinforcement schemes are proposed based on the displacement feld:(a)in Scheme 1,the horizontal stress of 15.5 kPa and vertical stress of 5 kPa are applied to each local slope;(b)in Scheme 2,1/2 of the reinforcement load of the local slope 4 is applied to the local slope2;(c)in Scheme 3,thewhole reinforcement load of the local slope 4 is applied to the local slope 2.The total reinforcement load keeps unchanged in each scheme.The load distribution of each reinforcement scheme is listed in Table 8,and the schematic diagram is demonstrated in Fig.28.

Table 8Load distribution of each reinforcement scheme for slope No.2.
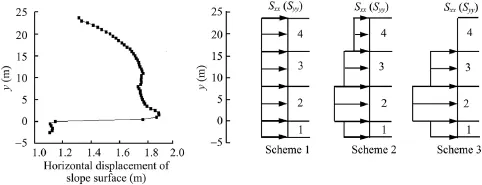
Fig.28.Schematic diagram of load distributions of three reinforcement schemes for slope No.2.
The factors of safety of the three reinforcement schemes are listed in Table 9.It shows that the Scheme 1,in which the same reinforcement load is applied to each local slope,is not desirable, for the factor of safety obtained is the lowest.The Scheme 3,in which the reinforcement load of the local slope 4 having smaller displacement is applied entirely to the local slope 2 having the maximum displacement,is the targeted scheme,due to the largest factor of safety.
The stress levels of the slope for each reinforcement scheme are presented in Fig.29,showing that for reducing the stress level purpose,all the schemes have slight difference.
6.Conclusions
Various schemes for slope reinforcement using anchor cable (bolt)show that a better reinforcement effect can be achieved when more reinforcement is applied to the position characterized by high stress level of sliding zone(or large displacement).For instance,by increasing the prestress or extending the length of anchor cable,it can provide larger resistance in this area.Compared tothecommonlyuseduniformlydistributedreinforcement schemes,it has a better reinforcement effect,which can obtain the reasonable arrangement of anchor cables.
For slope reinforcement design,numerical methods should be used to analyze stress level and displacement feld,based on which the optimal reinforcement scheme can be determined.
Confict of interest
The authors wish to confrm that there are no known conficts of interest associated with this publication and there has been no signifcant fnancial support for this work that could have infuenced its outcome.
Acknowledgments
This work is funded by the National Natural Science Foundation of China(Grant Nos.51378131 and 51378403).
Ausilio E,Conte E,Dente G.Stability analysis of slopes reinforced with piles. Computers and Geotechnics 2001;28(8):591-611.
Briaud JL,Lim Y.Tieback walls in sand:numerical simulation and design implications.Journal of Geotechnical and Geoenvironmental Engineering 1999;125(2): 101-10.ASCE.
Cai F,Ugai K.Reinforcing mechanism of anchors in slopes:a numerical comparison of results of LEM and FEM.International Journal for Numerical and Analytical Methods in Geomechanics 2003;27(7):549-64.
Desai CS,Muqtadir A,Scheele F.Interaction analysis of anchor-soil systems.Journal of Geotechnical Engineering 1986;112(5):537-53.ASCE.
Gao CS,Wei RL,Chen SS.Centrifugal model tests on deformation of slopes reinforced with piles.Chinese Journal of Geotechnical Engineering 2009;31(1): 145-8(in Chinese).
Hassiotis S,Chameau JL,Gunaratne M.Design method for stabilization of slopes with piles(closure).Journal of Geotechnical and Geoenvironmental Engineering 1999;125(10):913-4.
Hryciw RD.Anchor design for slope stabilization by surface loading.Journal of Geotechnical Engineering 1991;117(8):1260-74.
Huang RQ.Geodynamical process and stability control of high rock slope development.Chinese Journal of Rock Mechanics and Engineering 2008;27(8):1525-44(in Chinese).
Li JP,Lai YJ,Li YS,Zhou SH.Stabilization analysis of river-side slope reinforced by stabilizing piles.Hydro-Science and Engineering 2005;2:53-8(in Chinese).
Li Z,Zhu YP,Yu J.Calculation methods for active slope reinforcement based on stress control in critical slip surface.Chinese Journal of Rock Mechanics and Engineering 2008;27(5):979-89(in Chinese).
Lian ZY,Han GC,Kong XJ.Stability analysis of excavation slope by strength reduction FEM.ChineseJournalofGeotechnicalEngineering2001;23(4):407-11(inChinese).
Liu YR,Huang YQ,Yang Q.Stability and reinforcement analysis of rock and soil slope basedondeformationreinforcementtheory.RockandSoilMechanics 2011;32(11):3349-54(in Chinese).
Nian TK,Xu HY,Liu HS.Several issues in three-dimensional numerical analysis of slopes reinforced with anti-slide piles.Rock and Soil Mechanics 2012;33(8): 2521-35(in Chinese).
Tan HH,Zhao LH,Li L,Luo Q.Energy analysis method for pre-reinforcing slopes with anti-slide piles.Rock and Soil Mechanics 2011;32(Supp.2):190-7(in Chinese).
Yang GH,Zhang YC,Zhang YX.Variable modulus elastoplastic strength reduction method and its application to slope stability analysis.Chinese Journal of Rock Mechanics and Engineering 2009;28(7):1506-12(in Chinese).
Yang GH,Zhong ZH,Fu XD,Zhang YC,Wen Y,Zhang MF.Slope analysis based on the local strength reduction method and the variable modulus elastoplastic model. Journal of Central South University of Technology 2014;21(5):2041-50.
Yang GH,Zhong ZH,Zhang YC,Wang EQ.Identifcation of landslide type and determination of optimal reinforcement site based on stress feld and displacement feld.Chinese Journal of Rock Mechanics and Engineering 2012;31(9):1879-87(in Chinese).
Yang GH.Hyperbola model for calculating the nonlinear settlement of foundation on granite residual soil.In:Proceedings of the 7th National Conference on the Numerical Analysis and Analytical Method for Rock and Soil Mechanics.Dalian: Dalian University of Technology Press;2001.p.168-71(in Chinese).
Zhao SY,Zheng YR,Shi WM,Wang JL.Analysis of safety factor of slope stability by strengthreductionFEM.ChineseJournalofGeotechnicalEngineering 2002;24(3):343-6(in Chinese).
Zheng YR,Zhao SY.Application of strength reduction FEM to soil and rock slope. Chinese Journal of Rock Mechanics and Engineering 2004;23(19):3381-8(in Chinese).
Zheng YR.Development and application of the numerical limit analysis for geological materials.Chinese Journal of Rock Mechanics and Engineering 2012;31(7):1297-316(in Chinese).

Guanghua Yangis now a professor,national registered civil engineer(geotechnical engineering),and honorary president of Guangdong Research Institute of Water Resources and Hydropower,China.He obtained the B.S.and M.S.degrees at Wuhan College of Water Resources and Hydroelectric Engineering in 1982 and 1985,respectively, and the Ph.D.degree at Tsinghua University in 1999.Dr. Yang’s research interests cover soil constitutive theory, deep excavation,foundation engineering of high-rise building,soft soil engineering,slope engineering and so on.He proposed a generalized potential theory for establishing the soil constitutive model,an incremental method for calculating the action of the construction process for deep excavation,and also put forward an in-situ tangent modulus method based on the plate loading test for calculating the nonlinear settlement of the foundation.He has published more than 170 academic papers,participated in the engineering consultation and processing more than 300 cases,and published 3 monographs.He currently serves as the associate editor ofChinese Journal of Rock Mechanics and Engineering,editorial board member ofChinese Journal of Geotechnical EngineeringandRock and Soil Mechanics.He is also the deputy director of Geotechnical Mechanics Professional Committee of Chinese Society of Mechanics and deputy director of Deep Excavation Engineering Professional Committee of Chinese Society of Architecture.Meanwhile,he is the graduate advisor at Wuhan University and South China University of Technology.
*Corresponding author.Tel.:+86 13609728183.
E-mail address:1084242143@qq.com(G.Yang).
Peer review under responsibility of Institute of Rock and Soil Mechanics,Chinese Academy of Sciences.
1674-7755©2015 Institute of Rock and Soil Mechanics,Chinese Academy of Sciences.Production and hosting by Elsevier B.V.All rights reserved.
http://dx.doi.org/10.1016/j.jrmge.2015.04.004
 Journal of Rock Mechanics and Geotechnical Engineering2015年4期
- Journal of Rock Mechanics and Geotechnical Engineering的其它文章
- A theoretical derivation of the Hoek-Brown failure criterion for rock materials
- Strength properties of soft clay treated with mixture of nano-SiO2and recycled polyester fber
- Case studies of high-sensitivity monitoring of natural and engineered slopes
- Key technologies of drilling process with raise boring method
- Analysis of horizontal displacement distribution caused by single advancing longwall panel excavation
- Susceptibility assessment of debris fows using the analytic hierarchy process method-A case study in Subao river valley,China