大气成分研究进展
2013-07-05 16:44
中国气象科学研究院年报 2013年0期
大气化学和大气成分
Atmospheric Chemistry and Atmospheric Composition
大气成分研究进展
2013年,大气成分研究所圆满完成了承担的各项任务,在分析方法建立、比对校验、质量控制、大气成分及相关特性的观测、模式发展应用、影响评估等方面均取得了明显进展。
1 分析方法、比对校验和质量控制研究
1.1 大气CO2、CH4、CO高精度观测混合标气配制方法
高精度、高准确度大气CO2、CH4、CO浓度观测需使用以干洁大气为底气的标气。标气中水汽含量及CO2的δ13C对基于光学原理的观测系统有不可忽视的影响。本研究利用自组装的混合标气配制系统,以环境大气为底气,通过添加高浓度气体或利用吸附剂吸附,调节目标物种浓度。CO2和CO吸附效率分别达99.7%和99.8%,标气水汽含量小于3.7×10⁻⁶,可配制不同浓度范围的CO2、CH4、CO混合标气。在青海瓦里关全球大气本底站配制环境大气浓度范围的标气,CO2、CH4、CO实际配制浓度同目标浓度的偏差分别小于10×10-6、30×10-9和30×10-9,CO2中δ13C同实际大气接近。本方法配制的标气已应用于我国本底站大气CO2、CH4和CO高精度观测,符合世界气象组织/全球大气观测(WMO/ GAW)质量要求。(姚波)
1.2 进改的大气CO2、CH4、N2O、CO在线观测FTIR系统
利用商用傅立叶红外(FTIR)主机,与自动进样模块及标气模块集成,初步建立了一套可流程化、准确、高效分析本底大气CO2、CH4、CO和N2O的在线观测系统。观测结果表明,该商用FTIR主机具有良好的精度,但以仪器自带校正系数计算所得的结果准确度较差,CO体积分数的绝对误差更是达38.8×10⁻⁹,无法满足在线观测分析要求。集成后的FTIR系统以可溯源至国际标准的工作标气对仪器分析结果进行校正,有效提高了准确度。动态及静态两种模式下各要素实测值与标称值的体积分数偏差可达CO2≤0.11×10⁻⁶、CH4≤1.8×10⁻⁹、N2O≤0.15×10⁻⁹、CO≤0.5×10⁻⁹,能够满足本底大气在线观测需求。利用该FTIR集成系统进行为期6天的模拟在线观测,采用动态流量模式(Flow)进样,每隔6 h穿插分析高、低浓度标气及目标气,目标气CO2/CH4/N2O/CO的体积分数标准偏差分别为0.05×10-6、0.2×10-9、0.07×10-9和0.5×10-9,平均值与标称值之间的偏差分别为0.09×10-6、0.4×10-9、0.14×10-9和0.5×10-9。(刘立新)
1.3 气相色谱-质谱联用法(GC-MS)和气相色谱-电子捕获检测法(GC-ECD)同时在线观测本底大气中
的HCFC-142b
2010年5月至2011年5月,利用自组装气相色谱-质谱联用法(GC-MS)和气相色谱-电子捕获检测法(GC-ECD)在线观测系统,在北京上甸子区域大气本底站开展了二氟一氯乙烷(HCFC-142b)在线观测对比试验,GC-MS和GC-ECD系统分析精度分别为0.23%和0.88%。观测期间HCFC-142b浓度变化范围为21×10-12~355×10-12;通过独立样本t检验P>0.05,表明两种方法获得的HCFC-142b浓度数据无显著差异;对两套系统观测浓度数据的差值分析表明,造成两套系统观测浓度微小差别的主要因素是空气样品时间分辨率和观测精度。利用局部近似回归法进行本底值筛分,GC-MS和GC-ECD法获得的本底浓度均值差、中值差、25和75百分位数值差均优于系统观测精度。两种方法捕获HCFC-142b污染过程一致,污染浓度均具有夏秋高、冬低的特点;两种方法观测HCFC-142b污染浓度的年变化趋势一致。(姚波)
1.4 矿质颗粒物对α-蒎烯光反应过程中二次有机气溶胶产率及粒径的影响
采用烟雾箱模拟实验研究了矿质颗粒物对二次有机气溶胶(SOA)生成过程的影响。选取常用模型颗粒物Al2O3作为矿质颗粒物的代表,研究其对α-蒎烯光化学反应过程中SOA产率及SOA粒径的影响。实验在2 m3的室内烟雾箱中于30℃、50%相对湿度条件下进行。研究发现,与α-蒎烯单独的光氧化过程相比,矿质颗粒物可抑制O3的生成,并进一步影响半挥发性有机产物(SVOCs)的生成及其在气/固相的分配过程,从而降低了SOA的产率。这种抑制作用将会影响到α-蒎烯对区域SOA浓度的贡献率。矿质颗粒物对SOA生成的抑制也可能是北京地区气溶胶中有机碳相对含量低于其他地区的原因之一。此外,矿质气溶胶种子还将导致悬浮态SOA粒径明显下降,在高浓度矿质气溶胶种子的情况下尤为明显。研究发现新粒子的生成及加速沉降是导致悬浮气溶胶粒径减小的原因。SOA粒径的减小将最终影响到SOA粒子的光学效应及其健康效应。(刘畅)
1.5 BP网络框架下MODIS气溶胶光学厚度产品估算中国东部PM2.5
近年来随着中国经济的快速发展,中国区域的大气污染情况日趋严重,大气污染监测与治理已刻不容缓。由于卫星遥感具有空间覆盖广、成本低等优点,卫星遥感反演气溶胶光学厚度(AOD)产品被普遍认为是地面PM2.5浓度的重要指标,且已被广泛应用于地面PM2.5遥感监测。利用2007—2008年的MODIS/Terra气溶胶光学厚度产品,考虑中国东部地区5个大气成分站风速、风向、温度、湿度和边界层高度等气象数据,构建后向(BP)神经网络,提出了基于MODIS AOD产品估算PM2.5浓度的模型。利用5个大气成分站PM2.5观测数据对模型进行散点拟合和时间序列拟合验证,结果表明:(1)从PM2.5观测值与估算值的散点回归分析来看,PM2.5估算值与观测值相关系数最好的为庐山站(R=0.6),其他4个站次之,但其相关系数均在0.4(中强相关)以上;(2)从PM2.5观测值与估算值的时间序列对比分析来看,PM2.5估算值和观测值差值随时间变化而变化,且存在明显的日际振荡现象,但经相邻5天滑动平均处理,5个站的PM2.5估算值与观测值相关系数得到普遍提升,滑动后的相关系数均在0.7以上(除郑州外),庐山达到0.83。结果表明,在BP网络框架下,基于MODIS AOD产品估算PM2.5的模型能较好地应用于PM2.5监测。(郭建平)
1.6 中国北方沙尘暴的多源卫星和地面协同监测
研究如何协同利用搭载在Aqua卫星上的传感器MODIS反演的气溶胶光学厚度(AOD)和搭载在CALIPSO卫星上的CALIOP激光传感器,以及地面观测PM10数据监测中国北方春季多发的沙尘暴过程,重点研究发生在2010年3月17—21日中国北方的一次较大的沙尘天气过程。沙尘暴站点北京站观测到的PM10浓度从3月17日的背景值(相当低)15 μg/m3上升到3月20日的峰值283 μg/m3。卫星激光雷达观测仪CALIOP气溶胶分类产品分析结果显示中国北方地区上空存在很多沙尘,这些地区主要位于沙漠(沙尘暴源地)的下风向,且沙尘可以吹到海拔高度3.5 km处。
MODIS卫星遥感AOD资料可以观测到大空间范围的沙尘分布,其高值区基本与地面沙尘暴站观测到的PM10峰值对应,特别是在没有云污染的情况下。通过与MODIS AOD和地面观测PM10数据比较,星载激光雷达观测仪CALIOP可以提供其他传感器不能提供的清晰的沙尘垂直廓线信息,尽管CALIPSO卫星的重访周期较长(16天)和幅宽较窄(90 m)。利用HYSPLIT进行后向轨迹分析的结果表明,来自中国西北部戈壁沙漠的沙尘(3月18日)以每天1200~1500 km的速度向东移动,并于19日到达华北地区,这与其他人的研究结论高度吻合。同时,多种卫星观测资料协同观测,结合后向轨迹模型HYSPLIT以三维的方式再现了这次沙尘天气过程,再次印证了影响华北的沙尘天气主要来源于西北、蒙古、内蒙古的沙尘源区的结论。综合分析表明,多源卫星遥感观测协同模型模拟分析有助于全面地监测中国北方地区的沙尘天气过程。(郭建平)
2 大气成分及相关特性变化的观测研究
2.1 中国东北城市地区能见度和颗粒物(PM)的特征变化
根据2010—2012年中国东北沈阳地区的能见度数据,对能见度、颗粒物质量浓度、气象要素的相关性进行了分析。研究结果表明,沈阳地区能见度月均值在3月和9月较高,平均值分别为19.0±4.3和17.1±4.3 km。沈阳地区低能见度出现在1月,平均值为11.0±4.7 km。在所探讨的气象要素中,风速是影响能见度和颗粒物浓度最主要的气象要素。能见度和颗粒物质量浓度的相关性表明,细粒子是主要的污染物,对我国东北城市地区能见度的恶化起到了重要作用。能见度和颗粒物质量浓度存在明显的日变化和周末效应,其产生的主要原因是人类活动。(车慧正)
2.2 中国东北城市及工业地区太阳光度计地基观测气溶胶光学特性
利用CE-318太阳光度计观测获得的数据分析了我国东北城市及工业地区沈阳、鞍山、本溪和抚顺的气溶胶光学厚度(AOD)及Angstrom波长指数(Alpha)的时空变化。沈阳和抚顺地区较高的气溶胶光学厚度出现在夏季和冬季,呈双峰分布。鞍山和本溪地区较高的气溶胶光学厚度则呈单峰分布。沈阳和本溪地区气溶胶光学厚度的频率分布呈双峰分布,相关系数的平方(R2)分别为0.94和0.91。鞍山和抚顺地区气溶胶光学厚度的频率分布在0.40左右出现相同的单峰分布。本溪地区气溶胶光学厚度的季节变化大于其他3个地区,沈阳地区Angstrom波长指数的季节变化最大,其次是鞍山、抚顺和本溪。对气溶胶光学厚度(AOD)及Angstrom波长指数的散点图分析结果表明,沈阳、鞍山、本溪和抚顺地区气溶胶粒子是由细粒子和粗粒子共同组成的。(车慧正)
2.3 利用MODIS卫星研究近10年关中盆地大气气溶胶时空变化特征
利用CE-318太阳光度计对MODIS C5产品在西安地区的适用性进行验证,西安地区C5产品与CE-318太阳光度计反演的气溶胶光学厚度具有较好的一致性,相关系数达到0.91,误差在Δτ=±0.05±0.15τ内的样本占总数的67.9%,满足NASA设计要求,反演数值可以用于区域气候变化和大气污染研究。利用NASA-MODIS网站提供的2000—2010年C5版本MODIS气溶胶产品,分析了气溶胶光学厚度和小颗粒气溶胶对总光学厚度贡献的多年变化特征。结果表明:(1)沙尘粒子和人类活动产生的细粒子是关中盆地气溶胶的主要来源,气溶胶分布受地形影响显著,在特殊地形和盛行风向影响下,气溶胶粒子在边界层的水平扩散受到抑制,在东部出现堆积,气溶胶光学厚度分布呈现东高西低的趋势,高值中心主要分布在西安、渭南南部,为沙尘气溶胶和人类活动产生的细粒子气溶胶共同作用,关中西部多年处于气溶胶光学厚度的低值区,主要为人类活动和工业排放产生的细粒子气溶胶;(2)关中不同地区气溶胶光学厚度时间序列变化存在差异,关中西部近10年呈现波动下降趋势,关中中部和东部则呈现波动中增加的趋势;(3)关中地区自西向东气溶胶光学厚度的贡献粗粒子的比重逐渐加大,近10年关中地区细粒子气溶胶粒子污染有逐年加重的趋势,其中中东部城市较为显著。(车慧正)
2.4 中国塔克拉玛干沙漠地区气溶胶光学特性的变化
通过对中国西北塔克拉玛干沙漠中心地区2004—2008年气溶胶光学厚度及波长指数的观测,研究了该地区气溶胶的光学特性。由于沙尘事件的影响,春季和夏季出现了气溶胶光学厚度较高而波长指数较低的明显的季节变化,而在秋季和冬季气溶胶光学厚度则较低。气溶胶光学厚度的最大值和最小值分别出现在4月(0.83±0.41)和11月(0.19±0.10),Angstrom波长指数的最大值和最小值分别出现在1月(0.70±0.25)和5月(0.09±0.06)。气溶胶光学厚度及Angstrom波长指数的日变化表明,早晨和夜晚容易出现光学厚度的高值(0.50~0.60)和Angstrom波长指数的低值(0.40)。气溶胶光学厚度及Angstrom波长指数的相关系数R2=0.55。气溶胶光学厚度呈单峰分布,Angstrom波长指数频率分布则呈双模态分布。(车慧正)
2.5 1980—2011年东北亚地区春季沙尘暴天气系统的变化
采用1980—2011年WMO交换气象站地面气象要素观测资料以及高空大气探空资料,中国加密气象观测站资料,NCEP/NCAR再分析资料以及中国气象档案馆原始天气图表等资料,基于沙尘沉降物浓度-权重路径追踪 (CWT)方法,发展离散观测站获取的沙尘特征影响域,跟踪分析东北亚大范围区域性沙尘天气过程,给出1980—2011年区域性沙尘天气过程特征分布;采用Spline趋势分析,讨论沙尘天气系统强度变化特征,1980—2011年沙尘天气过程出现历史持续性与转折突变性并存的波状变化态势,出现准10年的高低频活动特征。环流合成分析揭示,沙尘高频与低频活动期间的大气环流特征,沙尘多年与少年的极地涡旋、中纬度西风急流、贝加尔湖附近流场分布特征差异显著,在东亚春季沙尘频繁活动走廊区域,即从巴尔喀什湖经我国西北、华北地区,朝鲜半岛、日本岛一带,对流层高层及中层气流经向度显著高于少沙尘年,这更有利于沙尘天气系统在中纬度地区发展和移动。(杨元琴)
2.6 北京亚微米气溶胶化学组分及粒径分布季节变化特征
北京亚微米气溶胶主要化学组分硫酸盐、硝酸盐、铵盐、氯化物、有机物质量浓度及其粒径谱具有明显的季节变化规律。其中有机气溶胶在四季中占PM1的份额(36%~58%)高于其他物种。碳氢类有机气溶胶(HOA)和氧化性有机气溶胶(OOA)质量浓度及其粒径分布也表现出了明显的季节变化特点。HOA浓度在冬季最高,占有机气溶胶总量的70%左右。OOA浓度在夏季最高,秋冬季较低。傍晚到夜间HOA浓度变化幅度明显大于其他物种,其浓度在中午出现峰值,可能与北京餐馆排放有直接关系。OOA以及硫酸盐、硝酸盐、铵盐和氯化物的日变化特点接近。
亚微米气溶胶主要化学组分粒径分布峰值均出现在500~600 nm之间。有机物质谱分布范围较其他物种宽,尤其是秋、冬季质量谱分布更宽。硫酸盐、硝酸盐和铵盐在春、夏、秋三季的平均粒径分布特点相似,而冬季谱分布较其他季节要宽,峰值粒径偏小。在粒径<200 nm范围内,有机物占亚微米气溶胶总量60%以上,粒子越细,有机物占的份额越大,冬季有机物在观测粒径范围内占PM1的50%以上。春、夏、秋三季HOA在<200 nm粒径范围内占优势,而OOA则在>300 nm粒径范围内占有相对优势。
该研究填补了我国在亚微米气溶胶化学组分和粒径分布季节变化研究中的空白,首次对不同类型有机气溶胶的质量浓度和粒径分布季节变化特点进行系统的总结。该项研究成果对进一步了解城市气溶胶的污染特征,有针对性地采取防控措施,改善城市空气质量,为气溶胶化学模式计算提供有代表性的参考等都是非常有意义的(图1,2)。(张养梅)
2.7 华北平原城区和区域背景地区新粒子形成事件的变化特征
通过对华北区域城区和区域背景站点同步观测的气溶胶数谱近一年观测资料的分析,发现52次新粒子形成事件同时发生,表明新粒子形成事件是一个区域性的现象。平均而言,新粒子形成事件发生前的凝结汇在市区环境下为0.025 s-1,大约是背景地区的1.6倍。也观察到北京大学颗粒物的形成和增长速率(10.8 cm-3s-1,5.2 nm h-1)要比上甸子的(4.9 cm-3s-1,4.0 nm h-1)要高,这说明在污染严重的城市环境出现新粒子形成事件核化过程需要更多的前体物。与非常干净环境观测到的相比,上甸子华北区域本底则是以高浓度的源和汇并存。新形成的颗粒物的凝结增长使得颗粒物的质量、颗粒物的散射系数,以及云凝结核(CCN)的浓度增加,进而影响气候和空气质量。两地同时发生的34个新粒子形成事件显示出颗粒物的核化,以及在较长时间的后续的增长。研究表明新粒子形成事件显著增加了颗粒物的散射系数,以及潜在的CCN浓度,分别是6.3~7.6和5.6~8.7倍。人为排放对CCN的贡献在50%左右,这需要在区域和全球模式中引起重视,特别是在污染严重的城市地区。(孙俊英)
2.8 我国3个本底站大气中CH4浓度观测研究
利用自组装的光腔衰荡光谱系统于2009—2011年对我国3个WMO/GAW本底站(浙江临安、黑龙江龙凤山和青海瓦里关)大气中CH4浓度进行观测研究。临安站位于我国经济最发达区域;龙凤山站位于东北水稻种植区;瓦里关站是全球大气本底站之一,位于我国西北地区。临安站四季CH4浓度均较高,从东北来的地面风明显抬升观测CH4浓度,最大抬升出现在夏季,为(32±15)×10-9,观测CH4浓度季节振幅(77±35)×10-9。龙凤山站除夏季外,其CH4浓度日变化不明显,夏季日变化最大振幅为(196±65)×10-9,该站夏季CH4浓度出现一个明显的峰值,与北半球变化趋势不同。瓦里关站CH4浓度和变化幅度均较低,最高值出现在夏季,也与北半球的WMO/GAW全球大气本底站有一定区别,其季变化振幅为(17±11)×10-9。利用观测数据通过线性拟合估算临安、龙凤山和瓦里关CH4浓度年增长率分别为(8.0±1.2)×10-9、(7.9±0.9)×10-9和(9.4±0.2)×10-9,均明显高于同期全球的增长率。以上观测分析结果能够补充我国本底大气CH4观测研究不足的现状。(方双喜)
2.9 华北不同城区和工业中心气团的化学特征
华北地区是中国污染最为严重的地区之一,其中排放强度大的北京、天津、唐山以及华北地区的其他城市和工业地区,排放源类型又有很大区别,使得来自这些地区的空气气团的化学属性也应该有不同的特征。在“华北地区大气污染对气溶胶和云微物理特征的影响”项目中,选取了位于北京、天津和唐山的中心地区的新安乡村站进行观测,获取了2006年4—5月地面臭氧和相关前体物浓度观测资料。基于观测资料和区域大气化学数值模式研究不同地区污染源的化学属性和其对华北地区区域臭氧和氮氧化物分布的影响。模式中采用源示踪的方法示踪模拟不同排放源(比如工业、交通)和不同地区(比如北京、天津)对区域氮氧化物的贡献。研究结果表明,来自不同污染和工业地区的空气气团的化学属性完全不一样。运用模式计算了北京、天津、唐山和石家庄空气气团的臭氧生成效率(OPEx),分别为3.35,2.75,1.43和2.33 mol/mol。而新安站的OPEx和气流来源有很大关系,其值和估算的上述地区空气气团的OPEx相当,表明不同城市和工业地区的空气气团在到达城市乡村站的输送过程中保持了各自的化学属性。(薛敏)
2.10 观测到的瓦里关SO2和HNO3浓度水平及趋势:1997—2009年结果
SO2和HNO3的长期观测数据鲜有报道,尤其是来自本底站点结果。本研究首次报道来自欧亚大陆内陆地区全球基准站点瓦里关的SO2和HNO3的长期观测结果。所分析的资料来自1997—2009年在瓦里关的观测。大气SO2和HNO3的全年平均浓度分别为1.28±0.41 μg/m3和0.22±0.19 μg/m3。HNO3浓度在温暖季节远高于在寒冷季节,而SO2浓度却表现出相反的季节变化特征。在大多数月份,HNO3浓度与SO2浓度显著相关,表明有一些共同因素影响这两种气体的浓度,HNO3的前体物可能部分来自SO2的排放源。SO2浓度在1997—2002年期间具有非常显著(P<0.0001)的下降趋势(-0.2 μg/(m3·a)),而在2003—2009年期间却呈现显著(P<0.05)的增长趋势(+0.06 μg/(m3·a))。整个1997—2009年期间HNO3浓度没有统计显著的趋势。虽然SO2在1997—2002年的下降趋势与全球硫排放趋势一致,但其在2003—2009年的增长趋势却与全球许多区域的下降趋势不一致。轨迹分析结果表明,来自青藏高原北部及塔克拉玛干地区的气团可能引起了2003—2009年瓦里关SO2和HNO3浓度的增长,增速分别为+0.13 μg/(m3·a)和+0.007 μg/(m3·a)。(徐晓斌)
2.11 北京上空对流层NO2柱浓度前3年(2008—2011年)的地基MAX-DOAS观测结果与卫星验证
利用MAX-DOAS观测反演了2008—2011年北京城区上空对流层NO2的柱浓度。夏季NO2柱浓度日平均值变化范围为0.5~13.3,平均为3.6,冬季日平均值变化范围为0.2~16.8,平均为5.8(单位均为1016cm-2)。由于不同季节污染源排放和NO2大气寿命的不同,北京城区对流层NO2柱浓度日变化形式的季节差异较大。通过将MAX-DOAS地基遥感观测结果与SCIAMACHY和OMI卫星产品的对比,发现卫星遥感低估了北京城区对流层NO2的柱浓度。大气辐射传输模式模拟计算结果表明,气溶胶的屏蔽效应可以解释为什么卫星遥感会低估NO2的柱浓度,此外较低的空间分辨率,即所谓的网格平滑效应,也可以导致卫星产品的偏差。(马建中)
2.12 北京地区有机物种人为源排放量及O3生成潜势估算
在华北地区总挥发性有机化合物(VOCs)排放清单的基础上,通过调研国内外VOCs主要人为污染源排放源谱,计算了北京市各行业、各区县88个VOCs物种的排放量,发展了北京市2003年和2006年VOCs物种排放清单,并估算了北京地区VOCs排放的O3生成潜势。结果显示:北京市2003年和2006年人为源向大气排放VOCs总量分别为34.6×10⁴t和55.0×10⁴t,VOCs排放总臭氧生成潜势(OFP)值分别为131.9×10⁴t和209.5×10⁴t;对北京地区O3生成潜势贡献最大的前10个VOCs物种依次为乙烯、间/对-二甲苯、甲苯、1-丁烯、异戊烷、反-2-丁烯、丙烯、顺-2-丁烯、邻-二甲苯和乙炔,这10个物种的累计排放量占VOCs排放总量的60%左右,但对总OFP值的贡献率接近80%;北京城区是VOCs排放的高值区,同时也是O3生成潜势最大的区域;降低交通排放、溶剂挥发及油品挥发排放是降低北京地区VOCs排放、控制O3生成的有效途径。(马建中)
3 大气成分模式的发展应用及大气成分的影响研究
3.1 CAM5模式中两个气溶胶模块的评估
公共大气模式(CAM)广泛用于气候变化研究,其5.0版包含两个气溶胶模块MAM3和MOZART。利用AeroCom (2000年)多模式中值、IMPROVE (1988—2005年)和EMEP (2002—2008年)站点资料对两模块进行了评估。结果表明:MAM3和MOZART模块都能很好地模拟硫酸盐气溶胶的季节变化,与观测资料相比,模拟结果均在夏季偏高,相关系数均在0.89左右,在2倍误差内。两模块能较好地模拟黑碳气溶胶的时空分布特征,与观测资料相比,模拟结果偏低,相关系数均在0.62左右,排放源偏小而清除率偏大是造成黑碳气溶胶偏低的主要原因。两模块对有机碳气溶胶的模拟结果差别较大,大部分站点在3倍误差内,MAM3的结果偏高92.1%,MOZART则偏低58.1%;两模块一次有机碳的结果接近,差异主要源自对二次有机碳的模拟。两模块模拟的海盐气溶胶偏大,这主要是清除率偏小造成的。两模块采用相同的起沙机制,但起沙系数有差异,MAM3的沙尘源强偏大近2倍,模拟沙尘总量较大;MOZART的沙尘源强则偏低40%左右,模拟沙尘总量较低。模式中气溶胶的输送和扩散过程偏弱,说明清除机制还有待改进。(刘煜)
3.2 黑碳存在云滴内部造成的辐射强迫及其对气候的影响
利用Maxwell Garnett计算混合颗粒复折射指数的法则和Mie理论计算了黑碳与云滴内部混合后云滴的光学性质,并将其应用于一个气溶胶-气候在线耦合模式中,研究了黑碳与云滴内部混合造成的辐射强迫及其对气候的影响。结果表明,黑碳与云滴内部混合增加了云滴对太阳光的吸收。模拟的黑碳和云滴内部混合在大气顶产生辐射强迫的全球年平均值约为0.086 W/m2,其中在非洲、南美、东亚、南亚和西欧等区域正辐射强迫非常明显,最大值达到1.5 W/m2。黑碳和云滴内部混合造成大气短波加热率增加,温度明显升高,水汽含量增加,云量减少。全球年平均的地表温度升高了约0.08 K。南北半球地表温度的变化具有明显的差异,南半球升高了0.19 K,北半球降低了0.04 K。半球间温度变化的非对称性,造成了大气动力场和降水分布发生变化。在赤道辐合带内,赤道北边东北信风增强,增强的东北信风跨越赤道,与赤道南边增强的东南信风在南半球热带区域辐合,从而造成赤道以南垂直上升运动和降水增强,而赤道以北降水减少,这可能导致与赤道辐合带有关的热带降水最大值的南移。(王志立)
3.3 沙尘非球形效应对其直接辐射强迫的影响
将Lorenz-Mie理论和T矩阵与改进的几何光学算法相结合的方法计算的球形和非球形沙尘气溶胶光学性质应用于一个气溶胶-气候双向耦合模式中,定量分析了沙尘气溶胶的非球形效应对其直接辐射强迫的影响。结果表明,当模式中不考虑沙尘的辐射反馈时,沙尘气溶胶的非球形效应对其直接辐射强迫的影响不明显。当模式中考虑沙尘的辐射反馈后,模拟的全天情况下球形和非球形沙尘气溶胶在大气顶全球年平均短波(长波)直接辐射强迫分别为-0.55(0.052)W/m2和-0.48(0.049)W/m2,沙尘的非球形效应造成沙尘气溶胶全球年平均短波和长波辐射强迫的绝对值分别减少了约13%和6%。沙尘的非球形效应对沙尘调整辐射强迫的影响明显大于对其瞬时辐射强迫的影响。(王志立)
3.4 沙尘气溶胶模拟中气溶胶数据同化和直接辐射反馈的敏感性研究
为了研究东亚沙尘气溶胶模拟中的沙尘气溶胶同化和辐射强迫以及它们对局地大气的影响,将三维变分同化(3DV)和气溶胶辐射反馈方案(RAD)在线应用到中尺度数值预报系统GRAPES/CUACE_ Dust中。并进行了4个模拟试验:不包含3DV和RAD的参照试验(CTL),以及3个敏感性试验,分别包含3DV、RAD和将两者结合在一起的3DV_RAD。试验结果表明,包含3DV的试验沙尘浓度日平均值模拟有明显改善,而应用3DV_RAD的试验在强沙尘天气中模拟效果较好。对比CTL、RAD、3DV_ RAD各试验中空气温度、气压和风速的模拟偏差可知,沙尘直接辐射会导致对流层下层温度下降和对流层上层温度上升,这将导致对流层下层气压升高和对流层上层气压降低。在对流层中部和上层3DV_ RAD的模拟结果较RAD更为合理,体现了将气溶胶同化和辐射强迫进行整合在气溶胶模拟和气象领域的重要性。(王宏)
3.5 中国东部长波辐射对沙尘辐射效应贡献的个例研究
为了评估长波贡献对东亚地区气溶胶辐射效应的影响,将沙尘长波辐射参数化方案整合到在线中尺度沙尘预报模式GRAPES_CUACE/dust中。个例模拟研究表明,在沙尘影响地区地表近一半、大气层顶近1/3的沙尘负短波辐射强迫被正长波强迫所抵消。在沙尘层,沙尘发出的长波辐射使大气降温,这在白天抵消了接近17%的短波对大气加热,并在晚上使大气温度降低。同时,沙尘层之上的大气将会因为吸收沙尘层发出的长波辐射而增温。沙尘长波贡献对低层大气和地表的空气温度影响更明显。由沙尘太阳辐射造成的地表空气温度降低率,因沙尘白天长波加热而减少了40%。在夜间,沙尘长波贡献为对陆地和海洋表层加热。对沙尘长波辐射的在线计算,减少了只考虑短波辐射反馈的沙尘模式中AOD预报的近15%相关误差。此次案例试验结果表明,沙尘长波贡献在地球大气,尤其是在地表和低层大气能量过程中有重要影响,在沙尘辐射效应的研究中不应被忽视。(王宏)
3.6 结合气象模式与GloBEIS模式研究气象条件对BVOCs排放的影响
BVOCs对全球碳收支、对流层化学反应及臭氧的形成和气候变化都有很大的影响。选取森林覆盖率高且BVOCs排放尚未有研究报道的中国东北地区作为研究区域,利用美国NCAR中心提供的1°×1°的6-h NCEP再分析资料,运行MM5模式,得到模拟结果,从中提取GloBEIS模式所需要的近地面层的温度、湿度、风速和云量的格点数据,实现了将MM5模式与GloBEIS相结合对BVOCs进行研究。研究中需要的植被种类及分布数据来自最新的“植被信息系统”数据库,选取温度较高、太阳辐射较强、植被生长茂盛的2006年7月和2010年7月作为模拟时段,运行GloBEIS模式,对研究区域内的BVOCs排放情况进行了估算。模拟结果与温度和云量等气象要素分析结果表明,异戊二烯的排放速率受温度和光合有效辐射通量(PAR)的共同影响,日变化趋势显著,随着温度升高,PAR增强,异戊二烯的排放速率增大,在午后14∶00左右达到最大值,之后降低。由于云量与PAR成反比,因此云量越少,异戊二烯的排放量就越高,反之,则越低;与异戊二烯不同,温度是单萜烯和其他VOC排放的主导因素,受PAR和云量的影响较小,温度越高,排放量越大,反之,则越小。(安兴琴)
3.7 利用中国区域大气本底站观测资料评估排放源清单
准确和及时的排放源清单数据是提高空气质量模式模拟准确度的关键。近年来,INTEX-B2006排放清单在中国和东亚区域广泛使用,结合中国区域大气本底站的观测数据,利用MM5-CMAQ多尺度空气质量模式来评估INTEX-B2006清单的模拟效果。利用上甸子、龙凤山和临安3个区域本底站SO2,NO2,O3和CO的观测数据和模拟结果对比表明:模式的模拟结果基本上能捕捉到污染物浓度的月变化、季变化和日变化特征。与其他物种相比,模拟的CO低估了约2/3至1/2,这与CO排放清单的不确定性相关。与其他测站相比,上甸子站的模拟效果差一些,特别是SO2和CO,主要是该测站受北京地区排放源影响,INTEX-B2006清单分辨率比较低,不能捕捉比较强的当地排放源的影响。总体来看:夏天的模拟效果略差,特别是SO2和O3,除了排放源因素外,也与模式模拟的夏季温度和风等气象要素效果比较差有关。(安兴琴)
3.8 FLEXPART模式在源区追踪中的应用
FLEXPART模式是挪威大气研究所开发的拉格朗日粒子扩散模式。利用该模式并结合上甸子区域大气本底站的观测资料,以CO作为示踪气体,通过筛分本底和非本底浓度的方法,探讨了将FLEXPART大气反转模式应用于追踪测站本底和污染源区中的可能性。分别利用GFS和ECWMF资料驱动FLEXPART模式,两种模拟结果与观测对比表明:模式模拟的CO浓度变化趋势可以较好地反映上甸子地区CO浓度的日变化规律,CO浓度的模拟值与实测值相关系数分别达到0.67和0.71;模拟发现N-WNW-WN为上甸子CO气体观测最主要的本底扇区,W-WS-S为上甸子最主要的非本底扇区,模式能捕捉到测站本底和污染源区的分布特征并较好地体现北京及周边地区CO源区的分布特征。(安兴琴)
3.9 中国大气本底站2000—2009年CO2浓度变化模拟:CarbonTracker 模式应用
CarbonTracker(CT)是NOAA/ESRL/GMD的模式小组基于大气传输模型TM5研发的一种大气反演模型,它将大气传输模型与卡尔曼滤波法相结合。从大气的角度估算地球表面CO2吸收和释放随时间变化的情况。通过与全球观测结果比较,进而追踪CO2源汇。目前该模式已在北美、欧洲等地有所应用。本研究报道的是CT模式在中国移植和适用性验证以及获得的2000—2009年10年间中国代表性区域CO2浓度和通量的初步模拟结果。旨在为全面掌握我国温室气体浓度水平及变化趋势和估算碳源汇动态变化探索有益的手段。CT模式在中国的降尺度应用采用的是双重嵌套网格技术(全球3°×2°,中国1°×1°)。模拟结果与已开展CO2长期观测的中国4个大气本底站观测值比较显示,二者具有很好的一致性,一元线性回归的R值大于0.7,并且提高模式分辨率会使区域大气本底站的模拟结果与观测值的一致性提升。进一步分析2000—2009年4个本底站CO2浓度的年际和季节变化发现,CO2浓度逐年上升,上甸子和临安站2009年较2000年分别增长了27.89和26.75 μmol/mol,相当于10年分别增长了7.31%和7.03%;龙凤山站和瓦里关站增长相对较小,分别增长20.56和20.27 μmol/mol,10年的增长百分比分别为5.44%和5.46%。模拟结果还显示,瓦里关全球大气本底站大气CO2浓度变化较为平稳,而上甸子和临安两个区域本底站分别受到京津冀经济圈和长三角经济圈人类活动的显著影响,浓度波动较大,龙凤山站由于受到自然源(主要是植被)和人类活动的综合影响,大气CO2浓度季节变化规律最为明显。就空间分布而言,CO2浓度和通量的空间分布趋势一致,均显示中国东部高于中国西部。(程艳丽)
3.10 气象条件对北京PM2.5浓度影响的诊断识别
采用北京2007—2008年逐日PM2.5浓度观测数据、北京和华北区域气象站地面观测和高空探测信息、2008年7月自动气象站(AWS)观测资料和气溶胶质谱(AMS)每小时观测资料,研究了影响PM2.5浓度变化相关的敏感气象要素与气象条件,以及影响PM2.5浓度的敏感气象参数和气象条件对空气质量(AQ)的影响。建立了气象条件对空气质量影响的参数化PLAM诊断、预测模型。结果表明:凝结函数fc是对PM2.5浓度影响的敏感因子。当大气环境有利于fc快速增加,则为二次气溶胶粒子产生提供有利的条件。通过大样本PM2.5和气象观测数据统计分析得出,气象条件适应权重参数β对诊断PM2.5变化有指示意义。当北京与华北处于干冷的冬季,凝结函数fc贡献趋弱,但(有利于悬浮细颗粒生存的)适应权重参数β贡献显著;与此相反,7、8月份北京与华北雨季,高温、高湿使凝结作用加大,但参数β作用明显低于冬季。PLAM指数中的适应权重参数β与凝结函数fc对PM2.5浓度变化的影响具有相互制约影响效应。这与气象要素与PM2.5浓度的季节变化的观测事实相一致。采用2007—2008年逐日气象要素和PM2.5逐日观测资料,进行PLAM指数24 h预测试验,结果表明,PLAM指数24 h预测与北京PM2.5的浓度观测结果具有良好相关性,为基于PM2.5空气质量分析、诊断和预测研究提供了有意义的尝试。(王继志)
3.11 基于PLAM指数跟踪方法的中国沙尘天气及其波状化研究
采用1980—2011年中国气象局气象站地面气象要素观测资料以及高空大气探空资料,时间和空间加密气象观测站资料,以及中国气象档案馆原始天气图表等资料,基于沙尘气溶胶浓度(PM10)路径追踪的潜势源地贡献函数(PSCF)方法,发展空气质量气象条件PLAM指数对沙尘天气过程的路径跟踪,给出1980—2011年东北亚沙尘天气过程特征分布;采用Spline趋势分析讨论沙尘天气系统强度的年际变化。结果表明,1980—2011年沙尘天气过程具有历史持续性与转折突变性并存的波状变化趋势,出现准10年的高低频活动特征。(王继志)
3.12 基于经验模型的土壤侵蚀脆弱性评估研究
土壤侵蚀是当前全球土壤退化的严重问题之一,这将一定程度上导致土地质量的降低。本研究发展了一种修正的RUSLE模型,通过利用STI参数替换RUSLE模型中的坡长和坡度的乘积实现。该模型主要输入参数包括:数字高程模型、地形参数、NDVI和降水。利用修正模型,选择Alianello作为研究区,该区域是比较典型的土壤侵蚀区。结合地面观测和卫星遥感数据,制作了该地区的土壤侵蚀图。
利用修正的RUSLE模型估算了研究区土壤流失的空间分布,土壤流失量从10到7000 t/(hm2·a),存在很大的空间变化。高土壤侵蚀区域占研究区总面积的46.8%。根据土壤覆盖类型进行分类统计,高土壤侵蚀区中有33%是混合裸土,而灌木和树木混合区占5.29%,纯灌木区占0.06%。根据地形坡度分类,40.90%高土壤侵蚀区属于非常陡峭的斜坡类型,只有0.12%属于平缓坡地形,表明平缓坡不利于土壤侵蚀发生。根据地貌分类评估土壤侵蚀,则中度陡坡及中度到严重陡坡最有可能发生土壤侵蚀,所占比重达9.34%。
根据目视解译的土壤侵蚀图对修正RUSLE模型输出的土壤侵蚀图进行交叉验证,发现两种结果表现了很好的一致性,高达71.9%,表明修正RUSLE模型在研究区具有很好的适用性。(郭建平)
3.13 中国可吸入颗粒物人体暴露水平评估
利用高精度的中国人口数据和加密的PM10监测浓度,发挥GIS技术的空间插值和图层叠加优势,并结合国家环保总局的浓度标准,研究了中国可吸入颗粒物人体暴露水平的区域特征,对比分析了中国不同气候区域,京津冀、长三角、珠三角、四川盆地四大典型区域和北京、上海等重点城市可吸入颗粒物人体暴露水平的不同。为了解中国区域大气可吸入颗粒物污染状况和人口暴露水平提供依据。研究结果表明,中国可吸入颗粒物的空间和人口分布是不均匀的,在大部分地区,人口加权PM10的暴露浓度略高于年平均浓度,意味着更多的人口暴露于高浓度。一般来说,大多数人口暴露于2级PM10标准范围内,较少的人口暴露于1级和3级浓度范围。4个典型区域对比表明,京津冀地区相对污染较严重,珠江三角洲地区污染浓度相对较低。5个代表性城市比较表明,相对于其他4个城市,广州PM10浓度较低,北京和天津PM10浓度高,污染较严重。目前,中国的大部分城市和地区PM10污染形势不容乐观。人体暴露浓度水平与世界卫生组织(WHO)的标准差异较大,需要在WHO标准指导下,从人体健康角度,继续严格执行各项控制措施。(安兴琴)
3.14 基于GIS评估兰州市人群暴露水平及健康损害的经济学评估
采用空间插值方法计算PM10空间浓度分布,格点的空间分辨率为0.01°×0.01°。基于2000年精确的人口分布数据,利用地理信息技术对站点观测的PM10浓度数据进行空间插值。将插值后的人口分布图层与PM10浓度分布图层相叠加,依据两图层的叠加结果,计算人群暴露水平。在此基础上,建立PM10与居民的暴露反应关系,并分析由此造成的经济损失。兰州人口呈带状分布,在西固区、城关区和七里河区人口密度相对较大。将与健康相关的PM10的阈值浓度C0分别设定为0 μg/m3(无健康损害),20 μg/m3(世界卫生组织推荐值)和50 μg/m3(中国国家空气质量一级标准)。对应3个健康阈值浓度,PM10健康损害造成的经济损失占GDP的比例分别为0.206%、0.194%和0.175%。同时分析了2000年影响PM10浓度的气象因素,春季沙尘暴多发、冬季逆温层和夏季的降水是影响PM10浓度的重要因素。人群暴露水平分析结果显示,污染较重地区生活着当地大部分人口。随着评估中健康损害阈值浓度的降低,污染带来的经济损失将加重。兰州地区由于大气污染导致的健康损害值得重视。在政策制定过程中应审慎地权衡有利和不利因素,找到保护居民健康与当地经济发展之间的平衡点。(安兴琴)
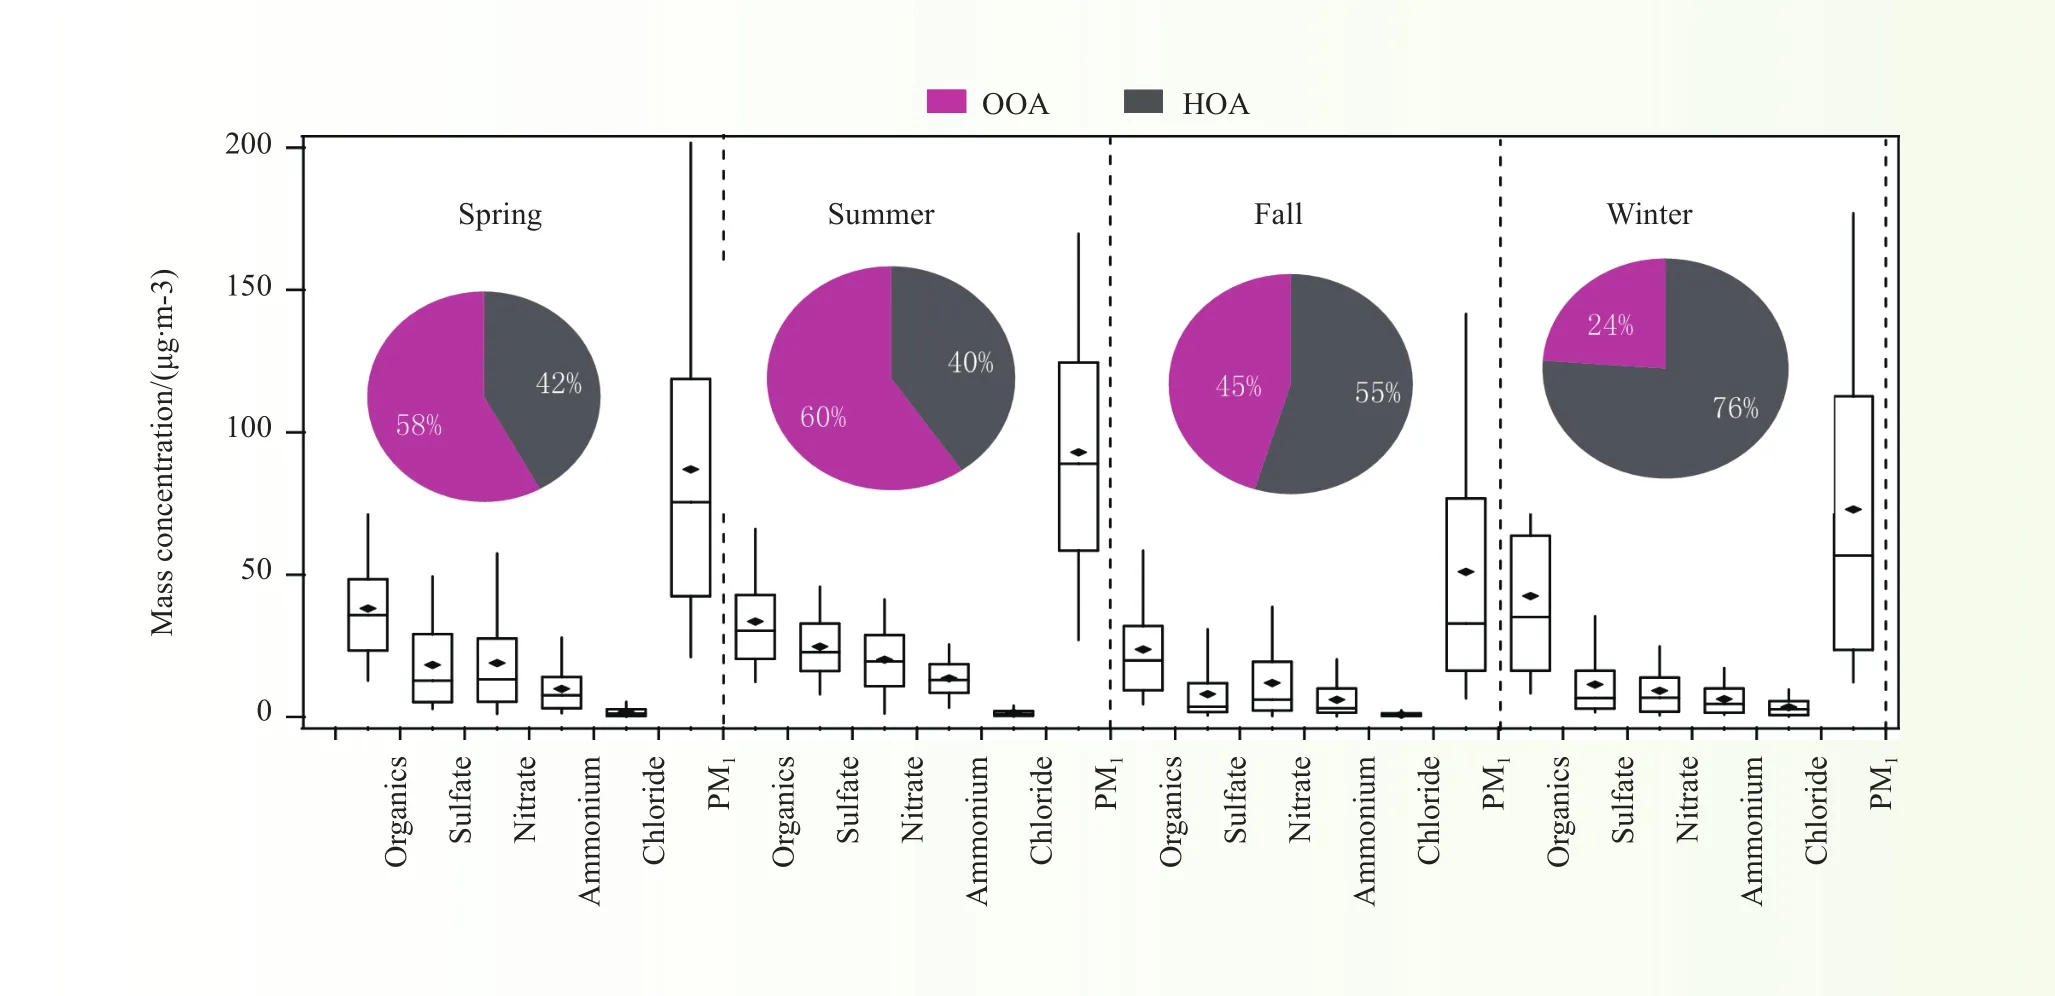
图 1 PM1及其重要化学组分质量浓度季节变化(盒式图分位数分别是5%、25%、50%,平均值:75%、95%;饼图为有机气溶胶质量浓度,饼图内不同区域分别表示HOA和OOA在不同季节占有机气溶胶的份额)Fig. 1 The seasonal mass concentration of PM1and main species (5%, 25%, 50%, mean∶ 75%, 95%; the pie charts represent the mass concentration of organics and the fraction of HOA and OOA in organics

图 2 北京地区主要化学组分、HOA和OOA粒径分布季节变化特点Fig. 2 The seasonal size distributions of chemical components, HOA and OOA over Beijing
Progress in Atmospheric Composition Research
In 2013, the Institute of Atmospheric Composition completed several tasks and made obvious progress in analytical methods, comparison and verifcation, quality control, observation of atmospheric composition and related factors, model development and implementation, and in assessing the impact of atmospheric composition on climate, weather, and human health.
1 Observational methods, comparison and verifcation, and quality control
1.1 Preparation of mixed standards for high-accuracy CO2/CH4/CO measurements
CO2/CH4/CO mixed standards in dry clean air are crucial for high accuracy measurement, since optical measurements are affected by vapor concentration and the δ13C in CO2. In this study, the required mixed standards were prepared by a customized preparation system. Specifcally, ambient air was pressurized into cylinders and the target gases were adjusted by flling in high concentration gases or applying an absorption material. The absorption effciencies of ASCARITE II and Sofnocat423 were 99.7% and 99.8%, respectively. The water vapor in the mixing standards was below 3.7×10⁻⁶. In seven testing standards made at the Waliguan global background station in Qinghai Province, China, the prepared and target concentrations of CO2, CH4and CO deviated by less than 10×10-6, 30×10-9, and 30×10-9, respectively, and the δ13C in CO2was within the ambient range. Qualifed standards for highly accurate greenhouse gas measurements at Chinese background stations are already prepared by this method. These standards meet the requirement of the World Meteorological Organization/Global Atmosphere Watch (WMO/GAW). (Yao Bo)
1.2 In-situ measurement of greenhouse gas by improved FTIR
To develop a real-time, automatic, highly accurate, and effcient system for measuring the baseline mixing ratios of CO2, CH4, CO, and N2O, the commercial FTIR system (Wollongong University) was combined with an auto-sampling system and a working standard module. In tests, the FTIR performed with high precision but relatively low accuracy because it could not properly determine the correction factors. The absolute error of the mixing ratio of CO was above 38.8×10⁻⁹, suggesting that FTIR alone could not meet the requirements of real time measurements. By adjusting the FTIR results with respect to the working standard gases, the accuracy of the FTIR measurements was signifcantly improved. Under both static and dynamic conditions, the measured and actual concentrations of CO2, CH4, N2O, and CO differed by less than 0.11×10⁻⁶, 1.8×10⁻⁹, 0.15×10⁻⁹, and 0.5×10⁻⁹, respectively, meeting the requirements of atmospheric real-time baseline measurements. The respective precisions of these gases, evaluated during 6 days of in-situ greenhouse gas measurements outside our laboratory, were 0.05×10⁻⁶, 0.2×10⁻⁹, 0.07×10⁻⁹, and 0.5×10⁻⁹, and the respective inaccuracies were 0.09×10⁻⁶, 0.4×10⁻⁹, 0.14×10⁻⁹, and 0.5×10⁻⁹. (Liu Lixin)
1.3 In-situ measurement of background atmospheric HCFC-142b by GC-MS and GC-ECD methods
A custom-made GC-MS and GC-ECD in-situ measurement system was established at the Shangdianzi GAW regional station. From May 2010 to May 2011, the precisions of the GC-MS and GC-ECD systems were 0.23% and 0.88%, respectively. Throughout the observation period, the mole fraction of HCFC-142b ranged from 21 ×10-12to 355 ×10-12and was independent of method (P>0.05; independent-sample t-test). The small difference between the GC-MS and GC-ECD measurements might be attributable to the different sampling times and precisions of the two systems. The HCFC-142b background was separated from the pollution data by a statistical flter called robust local regression. The mean and median differences, and the 25 and 75 percent differences of the background data measured by GC-MS and GC-ECD, were within the instrument precisions.The pollution events captured by both systems showed similar characteristics; that is, HCFC-142b levels were higher in summer and autumn than in winter. The pollution mole fraction measured by both systems showed similar seasonal changes. (Yao Bo)
1.4 Effect of mineral dust on secondary organic aerosol yield and aerosol size in α-pinene/NOxphoto-oxidation
The role of mineral dust in secondary organic aerosol (SOA) formation was investigated in an indoor smog chamber. Alumina was chosen as the surrogate to investigate the effect of mineral dust on α-pinene/ NOxphoto-oxidation in a 2 m3smog chamber at 30 °C and 50% relative humidity (RH). The alumina seeds infuenced the fnal concentration of O3in the chamber and the aerosol size in the photo-oxidation process. They also slightly reduced the SOA yield relative to the seed-free system. Since O3is an important oxidant of α-pinene, the decreased O3concentration could reduce the formation of semi-volatile compounds (SVOCs) and consequently inhibit SOA formation. In addition, the aerosol size was closely related to the mass loading of alumina seeds. At low alumina concentration, SVOCs condensed onto the pre-existing seed surface, and larger aerosols were grown. At alumina concentration exceeding approximately 5 µg cm-3, the SVOCs condensing into seed particles were dispersed by alumina seeds, reducing the aerosol size. (Liu Chang)
1.5 Estimating PM2.5over eastern China from MODIS aerosol optical depth using a back propagation neural network
China’s fast economic development in recent years has been accompanied by serious air pollution problems. Therefore, new technology to combat pollution has become imperative. Satellite remote sensing covers a wide spatial range at lower cost than ground-based in-situ aerosol measurements. Therefore, the aerosol optical depth (AOD) received by satellites is a widely recognized indicator of surface PM2.5concentrations. In this study, two years’ worth (2007–2008) of AOD data collected by the Moderate Resolution Imaging Spectroradiometer (MODIS) onboard Terra at fve observational sites in China (Benxi, Zhengzhou, Lushan, Nanning, and Guilin) were combined with five meteorological factors, namely, wind speed, wind direction, temperature, humidity, and planetary boundary height. The combined data were input to a back propagation (BP) neural network model, from which the PM2.5was estimated. The estimated PM2.5was then validated by in-situ PM2.5ground measurements at the five sites. In scatter analysis, the linear correlation coeffcients (R) between the observed and modeled PM2.5were highest at Lushan (R=0.6); R at the remaining sites ranged from 0.43 to 0.49. Time-series validations revealed that R signifcantly varied from day to day. The R could be significantly improved by fitting the five-day moving-average ground measurements to the modeled PM2.5data. Again, the modeled and observational data were most well-correlated at Lushan (R=0.83), suggesting that the MODIS AOD data can be used to monitor PM2.5levels by the BP network model developed in this study. (Guo Jianping)
1.6 Integration of multi-sensor measurements to monitor dust over North China
By integrating aerosol optical depth (AOD) from the Moderate Resolution Imaging Spectroradiometer (MODIS) aboard Aqua, altitude-resolved aerosol subtype products from the Cloud-Aerosol LIdar with Orthogonal Polarization (CALIOP), and surface PM10measurements, we can investigate typical dust activities during springtime in northern China. Specifically, the dust storm event over the North China Plain (NCP) during 17–21 March 2010, was identified by all instruments. The PM10concentration at Beijing (39.8°N, 116.47°E) on the NCP increased from its background level of 15 μg m-3(measured on 17 March 2010) to a peak of 283 μg m-3(20 March 2010), before dropping to 176 μg m-3on 21 March 2010. The analysis of CALIOP aerosol subtype products revealed numerous large dust plumes floating over northern China downwind of the main desert source regions, uplifting as high as 3.5 km.
The spatial distribution of dust load provided by MODIS AOD was broadly consistent with the ground-level PM10in cloud free areas, but the measurements diverged under cloudy conditions, highlighting the unique capability of the CALIOP lidar. CALIOP can penetrate cloud layers to obtain unambiguous, altitude-resolved dust measurements, but requires a longer revisit period (16 days) and operates over a narrower swath (90 m). Back trajectory simulations by the HYSPLIT model revealed that on 18 March 2010, dust from the Gobi desert travelled eastward at approximately 1200–1500 km day-1, passing over the NCP on 19 March 2010. These results are entirely consistent with previous fndings. Moreover, the multisensor measurements were integrated with the HYSPLIT model to generate a 3-D view of the transport pathway of this dust episode. The dust episode appeared to be closely associated with desert source regions northwest of the NCP. These results imply that multisensor measurements clarify the overall structure of dust events over northern China. (Guo Jianping)
2 Observational studies of varying atmospheric compositions and related properties
2.1 Characteristics of visibility and particulate matter (PM) in an urban area of Northeast China
The visibility data were obtained from 2010 to 2012 at Shenyang, Northeast China, and the relationships between visibility, PM mass concentration, and meteorological variables were statistically analyzed. The monthly-averaged visibility over Shenyang was high in March and September with approximate values of 19.0±4.3 and 17.1±4.3 km, respectively. Visibility was low (approximately 11.0±4.7 km) over Shenyang in January. Among the considered meteorological variables, wind speed mainly influenced the visibility and PM mass concentrations. The relationship between visibility and PM indicates that fne particles are already a main source of pollutants, and chiefly contribute to visibility deterioration in urban areas of Northeast China. Visibility and PM levels also exhibit clear diurnal variation and weekend effects, mainly caused by human activities. The results of this study highlight the signifcant impact of fne particles on air pollution and visibility in an urban area of Northeast China. (Che Huizheng)
2.2 Aerosol optical properties over urban and industrial region of Northeast China obtained by ground-based sun-photometry measurements
The spatial and temporal characteristics of aerosol optical depth (AOD) and the Angstrom exponent (Alpha) were analyzed using data from CE-318 sun-photometers at Shenyang, Anshan, Benxi, and Fushun in urban and industrial regions of northeastern China. Two AOD peaks were found over Shenyang and Fushun; one in summer, the other in winter. In contrast, the monthly-averaged AODs at Anshan and Benxi showed a singlepeak distribution. The AOD frequency distributions at Shenyang and Benxi were well fitted by a bi-modal normal distribution (r2=0.94 and 0.91, respectively). At Anshan and Fushun, the AOD frequency distributions peaked at approximately 0.40. The seasonal AOD at Benxi is larger than at the other three stations, and the seasonal Alpha is highest at Shenyang, followed by Anshan, Fushun, and Benxi. An analysis of the AOD and Alpha scatter plots suggests that the aerosol size in all four industrial regions is contributed by both fne and coarse particles. (Che Huizheng)
2.3 Analysis of spatial and temporal characteristics of AOD over the Guanzhong region of Shaanxi using long-term MODIS data
Based on the CE-318 sun-photometer data collected at northern Xi’an, we validated the applicability of the MODIS Collection 5 aerosol optical depth (AOD) products over the Guanzhong region of Shaanxi Province. A strong relationship was found between the AOD product of the MODIS Collection 5 data and CE-318 sun-photometer data (correlation coeffcient ~0.91). Next, using the MODIS Collection 5 AOD product data from 2000 to 2010, we analyzed the long term variation of AOD and FMF (the fine-mode fraction). Aerosols over the Guanzhong region were mainly sourced from dust storms and urban/industrial areas. In the eastern region, both urban/industrial and dust aerosols were accumulated by the special terrain andprevailing winds. Aerosols over the western part of Guanzhong were dominated by urban/industrial aerosols. Furthermore, the AOD trends varied over different parts of Guanzhong. Throughout the study period, the AOD slightly decreased in the western part but clearly increased in the eastern part. Analysis of the FMF trends over one decade revealed that although the ratio of fne-mode AOD was reduced from the west to east over the Guanzhong region, the pollution of fne-mode aerosol over the whole region has worsened. (Che Huizheng)
2.4 Variation of aerosol optical properties over Taklimakan Desert of China
The aerosol optical properties at the center of Taklimakan Desert in Northwest China were determined from measurements of aerosol optical depth (AOD) and Angstrom exponents collected from 2004 to 2008. Both parameters showed seasonal variation. Specifcally, the AOD was high in spring and summer while the Angstrom exponent was low during those seasons refecting the effect of dust storm events. The AOD was low in autumn and winter. The AOD was maximized in April (0.83±0.41) and minimized in November (0.19±0.10), whereas the Angstrom exponent was maximized in January (0.70±0.25) and minimized in May (0.09±0.06). Diurnal variation of both parameters was also observed∶ the AOD was high (0.50–0.60) in the morning and evening (when the Angstrom exponent was low) and constant (~0.40) during the daytime. The relationship between AOD and Angstrom exponent can be fitted by a power-law equation (R2= 0.55). The frequency distributions of the occurrence probabilities of the AOD and Angstrom exponent display single peaks and are well-ftted by a two-mode distribution. (Che Huizheng)
2.5 Variability of springtime sand and dust storm systems in Northeast Asia in the1980–2011 period
The characteristic distributions of regional sand and dust storm (SDS) were investigated from 1980 to 2011 using WMO meteorological element data obtained from surface stations, atmospheric sounding data, Chinese high-density weather data, NCEP/NCAR reanalysis data, and archived Chinese original weather maps. The SDS deposited concentration-weighted trajectory (CWT) method was employed to establish the domain of SDS influence from the data of discrete stations, and to track and analyze the large-scale regional SDS processes in Northeast Asia. The strength variability of the SDS systems was investigated by a spline trend analysis method. Throughout the 1980–2011 period, the waveforms of the SDS processes altered, featuring both a historical persistence and abrupt transition with a high–low oscillation occurring approximately once per decade. Through a composite analysis of the atmospheric circulation during high and low SDS years, SDS occurrences were found to be closely related to the anomalies of Arctic vortex strength, midlatitude westerlies, and circulation patterns around the Lake Baikal. During high-frequency years, the meridional fows in the upper- and mid-troposphere above the high SDS corridor in East Asia (i.e., from the Lake Balkhash, along Northwest and North China, the Korean Peninsula, and the Japan islands), are apparently stronger than during the low SDS years, favoring the development and transport of SDS in the midlatitude regions. (Yang Yuanqin)
2.6 Seasonal characterization of components and size distributions of submicron aerosols in Beijing
Mass concentration of PM1was the highest in summer and lowest in autumn. Organics dominated in all seasons, accounting for 36%–58% of the PM1. The concentrations of organic and inorganic components (sulfate, nitrate, and ammonium) were maximized in winter and summer, respectively.
Organics were deconvolved and quantifed as hydrocarbon-like and oxygenated organic aerosols (HOA and OOA, respectively). The HOA was the highest in winter, when it comprised around 70% of organics. However, the OOA was the highest in summer, and reduced in autumn and winter. The HOA peaked at noon, possibly due to cooking emissions. The size distributions of all species appeared to peak in the range 500–600 nm. The size distributions of organics were much broader than those of other species, particularly in autumn and winter. Size distributions of sulfate, nitrate and ammonium showed similar patterns, broadening in winter. The contributions of different species were size-dependent; the fner the particle, the greater the contribution of organics. Organics comprised more than 60% of particles smaller than 200 nm, and 50% of PM1in winter.In spring and summer, HOA dominated the organic fraction of particles smaller than 200 nm, while OOA contributed more to particles larger than 300 nm. In winter, all PM1particles were contributed more by HOA than by OOA (Figs. 1 and 2). (Zhang Yangmei)
2.7 Characteristics of regional new particle formation in urban and regional background environments in the North China Plain
Long-term measurements of particle number size distributions were conducted at an urban background site (Peking University, PKU) and a regional Global Atmospheric Watch station (Shangdianzi, SDZ) from March to November 2008. A total of 52 new particle formation (NPF) events were simultaneously observed at both sites, indicating that NPF is a regional phenomenon in the North China Plain. The mean condensation sink value prior to a nucleation event was 0.025 s-1in the urban environment, 1.6 times higher than at the regional site. However, higher particle formation and growth rates were observed at PKU (10.8 cm−3s−1and 5.2 nm h−1) than at SDZ (4.9 cm−3s−1and 4.0 nm h−1), implying that NPF precursors were much more abundant in the polluted urban environment. Unlike observations in cleaner environments, particle homogeneous nucleation events in the North China Plain occurred when a strong source of precursor gases co-existed with a high condensational sink of pre-existing aerosol particles. Following a nucleation event, secondary aerosol formation increased the particle mass concentration, particle light scattering coeffcient, and cloud condensation nuclei (CCN) number concentration, with detrimental effects on visibility, radiative effects, and air quality. Next, the infuence of NPF on the number concentration of “potential” CCN was evaluated from typical regional NPF events with signifcant particle nucleation rates and subsequent particle growth over suffciently long time periods at both sites. The NPF and subsequent condensable growth increased the CCN number concentration in the North China Plain by factors ranging from 5.6 to 8.7. Moreover, anthropogenic emissions potentially contributed more than 50% to the CCN number concentration, indicating that regional and global climate modeling requires increased attention, especially in polluted urban areas. (Sun Junying)
2.8 Study of atmospheric CH4mole fractions at three WMO/GAW stations in China
Atmospheric CH4mole fractions were continuously measured from 2009 to 2011 at three WMO/GAW stations in China (Lin’an, LAN; Longfengshan, LFS; and Waliguan,WLG) by three Cavity Ring Down Spectroscopy instruments. Of the GAW regional measurement stations, LAN is located in China’s most economically developed region, and LFS is in a rice production area (planting area>40000 km2). The global measurement station, WLG, is located in remote Northwest China. LAN recorded high mole fractions of CH4in all seasons. The CH4levels were enhanced by surface winds from the northeast, and were maximally increased by (32±15)×10-9in summer. The peak-to-peak amplitude of the seasonal cycle was (77±35)×10-9. The amplitude of the diurnal cycle was approximately constant throughout the year at LFS, but increased to (196±65)×10-9in summer. CH4levels at LFS peaked in July, different from the typical seasonal variations observed in the Northern Hemisphere. Among the three stations, the smallest and least variable CH4mole fractions were recorded by WLG. Unlike other WMO/GAW global stations in the Northern Hemisphere, the CH4mole fractions at WLG were maximized during summer. The amplitude of the seasonal cycle was (17±11)×10-9. The linear growth rates at LAN, LFS, and WLG were (8.0±1.2)×10-9, (7.9±0.9)×10-9, and (9.4±0.2)×10-9per year, respectively, all larger than the global mean over the same three-year period. The results from this study will improve our basic understanding of observed atmospheric CH4in China. (Fang Shuangxi)
2.9 Chemical characteristics of air masses from different urban and industrial centers in North China
North China is one of the most severely polluted regions in China. There are many large, complex, and strong emission sources in Beijing, Tianjin, and Tangshan (collectively called Jing-Jin-Tang in China) and otherNorth China urban and industrial centers. The chemical characteristics of the air masses coming from these pollution centers are expected to be quite different. As part of the project “Infuence of Pollution on Aerosols and Cloud Microphysics in North China (IPAC-NC)”, the surface ozone and related trace gases were measured at the Xin’an rural station (39.73°N,117.51°E) from 2 April to 16 May 2006. The Xin’an station is located in the central part of the larger Jing-Jin-Tang area. We investigated the chemical characteristics of air masses from these different pollution hotspots, and their effects on the regional distributions of ozone and nitrogen oxides in North China. For this purpose, we combined measurement data with a regional chemical transport model. Simulated reactive nitrogen compounds were attributed to the different emission sources in North China using the tracer-tagging method implemented in the model. The pollution plumes from different urban and industrial centers show decidedly different chemical characteristics. The estimated OPEx (defned as the ozone production effciency of nitrogen oxides) ingeneral pollution plumes from Beijing, Tianjin, Tangshan, and Shijiazhuang is 3.35, 2.75, 1.43, and 2.33 mol mol-1, respectively. During the IPAC-NC feld campaign period, the Xin’an site was alternately infuenced by air masses from the Beijing and Tianjin megacities and the Tangshan industrial area. The estimated OPEx in Beijing, Tianjin, and Tangshan air masses arriving at Xin’an are comparable to those in their general pollution plumes. This indicates that air masses from different urban and industrial centers in North China maintain their distinctive chemical characteristics during their transport to rural areas. (Xue Min)
2.10 Observed levels and trends of gaseous SO2and HNO3at Mt. Waliguan, China, from 1997 to 2009
Long-term measurements of SO2and HNO3, particularly those sourced from background sites, are rarely reported. For the frst time, we present the long-term measurements of SO2and HNO3at Waliguan (WLG), the only global baseline station in the backlands of the Eurasian Continent. The SO2and HNO3concentrations at WLG were observed from 1997 to 2009, and their annual means were assessed as 1.28 ± 0.41 and 0.22 ± 0.19 μg m-3, respectively. The HNO3concentrations were much higher in warmer than in colder seasons, while the SO2concentrations showed almost the reverse seasonal trend. During most months, the concentrations of HNO3and SO2were significantly correlated, suggesting that both gases are influenced by common factors and that SO2-emitting sources constitute a fraction of the HNO3precursors. The SO2concentration displayed a very signifcant decreasing trend (-0.2 μg m-3yr-1; P<0.0001) in 1997–2002, but a signifcant increasing trend (+0.06 μg m-3yr-1; P< 0.05) in 2003–2009. Conversely, the HNO3concentration showed no statistically signifcant yearly trends during 1997–2009. Although the SO2concentration declined throughout the 1997– 2002 period, consistent with global SO2emission trends, it increased during 2003–2009 while global levels continued to fall. Trajectory analysis suggests that the increasing SO2and HNO3levels at WLG throughout 2003–2009 were largely sourced from air masses from the northern Tibetan Plateau and the Taklamakan desert regions, which contribute +0.13 and +0.007 μg m-3yr-1, respectively. (Xu Xiaobin)
2.11 Tropospheric NO2vertical column densities over Beijing: Results of the first three years of ground-based MAX-DOAS measurements (2008–2011) and satellite validation
In this study, we retrieved the tropospheric NO2vertical column densities (VCDs) over Beijing from the Multi Axis Differential Optical Absorption Spectroscopy (MAX-DOAS) observations taken from August 2008 to September 2011. The daytime mean tropospheric NO2VCD (in units of 1016molecules cm-2) varied from 0.5 to 13.3 (average =3.6) during summertime, and from 0.2 to 16.8 (average =5.8) during wintertime. The average diurnal patterns of tropospheric NO2over Beijing appeared to vary from one season to another, indicating differences in the emission strength and atmospheric lifetime. Compared with the MAX-DOAS measurements, the satellite observations systematically underestimated the tropospheric NO2VCDs over Beijing. According to radiative transfer simulations, this underestimation is likely caused by the aerosol shielding effect, while the gradient smoothing effect imposed by the coarse spatial resolution of the satellite observations could play an additional role. (Ma Jianzhong)
2.12 Estimation of anthropogenic emissions and ozone formation potential of speciated VOCs in
Beijing area
Based on the emission inventories of total volatile organic compounds (VOCs) in North China, we calculated the amounts of 88 VOC species emitted from the main anthropogenic sources in each district and county of Beijing during 2003 and 2006. The source profiles of VOCs were either domestically measured or taken from the global literature. An emission inventory of speciated VOCs was developed, and the ozone formation potential (OFP) of VOCs was estimated. The total amounts of VOCs emitted from anthropogenic sources in 2003 and 2006 were 34.6×10⁴and 55.0×10⁴t, respectively, and the respective OFPs were 131.9×10⁴and 209.5×10⁴t. The top 10 species (in order of decreasing OFP) were ethylene, m,p-xylene, toluene, 1-butene, i-pentane, t-2-butene, propene, c-2-butene, o-xylene, and acetylene. Collectively, these species contributed approximately 60% to the total VOC emissions but accounted for 80% of the OFPs in North China. The VOC emissions and OFP values were elevated in the urban area of Beijing. Decreasing traffc exhaust, volatizing solvents, and evaporating gasoline are the most effective ways of reducing VOC emissions and controlling ozone formation in the Beijing area. (Ma Jianzhong)
3 Model development and the impact of atmospheric compositions on climate, weather, and human health
3.1 Assessment of two aerosol modules of CAM5
The Community Atmosphere Model (CAM) is widely employed in climate simulation and climate change research. The latest version (5.0) provides two modules for simulating atmosphere aerosols, named MAM3 and MOZART. These modules simulate several main atmosphere aerosols and determine their surface concentrations, which are then examined by the Interagency Monitoring of Protected Visual Environments Program (IMPROVE) and the European Monitoring and Evaluation Program (EMEP). The simulated global distributions of aerosol column concentration, as well as the aerosol global budgets, are compared with the median model results on the AeroCom website.
Both MAM3 and MOZART modules capture the seasonal distribution of sulfate aerosols; the simulated surface concentrations reasonably agree with observations, though the summer values are overestimated in the simulations. The correlation coeffcient between the observed and simulated results is approximately 0.89, regardless of module. MAM3 and MOZART also capture the spatiotemporal distribution of black carbon aerosol, although both modules underestimate the surface concentration of black carbon by a factor of 2 or 3. The correlation coeffcients between the observed black carbon surface concentration and those predicted by both modules are approximately 0.62. which are believed to be caused by smaller emission fluxes and higher rates of wet removal. When simulating organic matter concentrations, however, both MAM3 and MOZART introduce a bias factor of 2–3. MAM3 overestimates the surface concentrations of organic matter with a normalized mean bias of 92.1%, while MOZART underestimates them by 55.1%. Both biases become clear in the summer and autumn months. In a separate analysis, both modules yield nearly identical results when simulating primary organic matter, but significantly differ when simulating these condary organic carbon (SOC). Therefore, the bias in the total organic matter is primarily contributed by the SOC. Although MAM3 and MOZART yield similar global budgets of sea salt, the estimated total content of sea salt is larger than the median model results listed on AeroCom. The most likely cause of this discrepancy is that CAM5 underestimates the rates of dry and wet removal. Under similar mechanisms and varying emission factors, mineral dust is simulated differently by the two models. Specifically, the mineral dust emission simulated by MAM3 exceeds the median model results on AeroCom by a factor of nearly 3. Consequently, MAM3 overestimates the total mineral dust content, while MOZART underestimates the mineral dust burden because its emission fux is 40% smaller than that listed on AeroCom.
From the global distribution and global budget comparisons, we infer that the removal mechanism shouldbe improved in CAM5; in particular, the aerosol translation and diffusion must be strengthened. (Liu Yu)
3.2 Radiative forcing caused by black carbon in cloud droplets, and consequent climate responses
The optical properties of clouds whose water droplets contain black carbon (BC) were calculated by the Maxwell Garnett mixing rule and Mie theory, and applied to an interactive system that coupled an aerosol model with a General Circulation Model. This system was used to investigate the radiative forcing imposed by BC in cloud droplets, and the effect of such BC on climate equilibrium. The simulated global annual mean radiative forcing at the top of the atmosphere caused by BC in cloud droplets was 0.086 W m-2. Positive radiative forcing has been observed in Africa, South America, East and South Asia, and West Europe, where it has reportedly reached 1.5 W m-2. Enhanced cloud absorption increases the global annual means of solar heating rate, water vapor, and temperature, but decreases the global annual means of cloud fraction. Finally, BC in cloud droplets increases the global annual mean surface temperature by 0.08 K. This surface temperature change has been signifcant in both the Southern and Northern hemispheres, but is hemispherically asymmetric (+0.19 and -0.04 K, respectively). Such asymmetry could alter the atmospheric dynamics and precipitation. In addition, it enhances the northern trade winds in the Inter-tropical Convergence Zone (ITCZ). Consequently, northerly surface wind anomalies cross the equator and converge with the enhanced southern trade winds in the southern tropics. The result is increased (decreased) vertical ascension and precipitation on the south (north) side of the equator, with a potential southward shift in the tropical rainfall maximum (relative to the ITCZ). (Wang Zhili)
3.3 Effect of non-spherical dust aerosol on direct radiative forcing
The optical properties of spherical and non-spherical dust aerosols were calculated using Lorenz-Mie theory. In the calculation, the T-matrix method was combined with an improved geometricoptics method. The resulting optical properties were input to an interactive system that couples a general circulation model to an aerosol model. In this way, we can quantitatively analyze the effect of non-spherical dust aerosol on direct radiative forcing. Non-spherical dust exerted negligible effect on instantaneous radiative forcing (IRF), but exerted larger than expected infuences on atmospheric and land-temperature adjusted radiative forcing (AF) at the top of the atmosphere (TOA). The global annual means of shortwave (longwave) AFs at the TOA imposed by spherical and non-spherical dust aerosols, obtained from all-sky data, were −0.55 (0.052) W m−2and −0.48 (0.049) W m−2, respectively. The AFs of all dust were much weaker than the corresponding IRFs. The all-sky absolute means of the longwave and shortwave AFs were approximately 13% and 6% lower for non-spherical than for spherical dust. These results indicate that the AFs of dust are more effectively reduced by nonspherical effects than by the IRF. (Wang Zhili)
3.4 Sensitivity studies of aerosol data assimilation and direct radiative feedback in dust aerosol modeling
To simulate dust aerosol assimilation and radiative forcing in East Asian dust aerosols and their impacts on the regional atmosphere, a three-dimensional variational data assimilation (3DV) and an aerosol radiative feedback scheme (RAD) were implemented online in a mesoscale numerical weather prediction system (GRAPES_CUACE/Dust). Four modeling experiments were conducted∶ a control run (CTL) excluding 3DV and RAD, and three sensitivity experiments based on 3DV, RAD, or integrated 3DV and RAD (3DV_ RAD). Inclusion of 3DV distinctly improved the daily averaged dust concentrations, whereas 3DV_RAD enabled superior modeling of strong dust storms. Comparing the model biases in air temperature, pressure, and wind speed among the CTL, RAD, and 3DV_RAD experiments, we found that direct radiation from dusty atmospheres leads to decreased lower tropospheric temperature and increased upper tropospheric temperature. Consequently, air pressure was enhanced in the lower troposphere and reduced in the upper troposphere. The middle and upper troposphere was more realistically simulated in 3DV_RAD than in RAD, suggesting that aerosol assimilation and radiative forcing must be integrated in aerosol modeling and meteorological felds. (Wang Hong)
3.5 Case study of longwave contribution to the radiative effects of dust
To evaluate the longwave (LW) contribution to the radiative effects of aerosol over East Asia, a dust longwave radiative parameterization scheme was integrated into the online mesoscale dust forecasting model GRAPES_CUACE/dust. Approximately one-half and one-third of the dust-induced negative shortwave radiative forcing was cancelled by positive LW forcing at the surface and the top of the atmosplere of dust covered areas, respectively. Atmospheric dust emits LW radiation that cools the atmosphere, counteracting approximately 17% of the daytime shortwave heating and allowing simple atmospheric cooling during nighttime. Beyond the dust layer, the atmosphere is warmed by absorption of LW radiation emitted by the dust layer. The LW contribution of dust emissions strongly affects the air temperature in the lower atmosphere and at the earth’s surface. Although the surface air temperature is cooled by dust solar radiation, approximately 40% of the cooling rate is cancelled by daytime warming imposed by dust LW radiation. During the nighttime, land and sea surfaces are warmed by LWs emitted from atmospheric dust. Including the dust LW radiation in the dust model reduces the errors of the predicted aerosal optical depth by 15%, relative to the dust model with shortwave radiative feedback alone. This case study suggests that the LW contribution of dust signifcantly affects the earth–atmosphere energy process, especially at the surface and in the lower atmosphere, and should not be neglected in studies of dust radiation effects. (Wang Hong)
3.6 Investigating the impact of weather conditions on BVOC emissions by combining a meteorological model with GloBEIS
BVOCs severely affect the global carbon budget, chemical reactions in the troposphere, ozone formation, and global climate. The study region was Northeast China, where the forest coverage is high and the BVOC emissions have yet to be investigated. MM5 simulations were conducted using reanalysis data from the National Center for Environmental Prediction in the U.S. The spatial and temporal resolutions of the reanalysis data were 1° × 1° and 6 h, respectively. From the MM5 simulation results, the meteorological parameters required for the GloBEIS model, namely, the temperature, humidity, wind speed, and fractional cloud cover fraction, were extracted across the grid. In this way, the BVOC analysis integrates MM5 and GloBEIS. The vegetation species and distribution data were derived from the updated Vegetation Information System database. The selected simulation periods were July 2006 and July 2010, when the vegetation in Northeast China flourished under high temperatures and strong solar radiation. BVOC emissions were estimated by running the GloBEIS model. According to the results, isoprene emission exhibits signifcant diurnal variation, and is correlated with temperature, PAR and fractional cloud cover. Specifcally, the isoprene emission rises with increasing temperature and PAR, peaking at around 14∶00BJ, but is negatively correlated with cloud cover fraction. Other VOCs are mainly infuenced by temperature. Since similar fndings have been reported in previous studies, we conclude that the combined MM5 and GloBEIS methodology is feasible and yields reliable results. Therefore, we can effectively and reliably forecast BVOC emissions under different scenarios. (An Xingqin)
3.7 Evaluation of emission inventory using data collected by regional atmospheric background stations in China
Any accurate simulation of regional air quality by numerical models requires accurate and up-to-date emission data for that region. One of the newest emission inventories, INTEX-B2006 (I06), has become popularly used in China and East Asia, and was here assessed by the Community Multiscale Air Quality model and by observations from regional atmospheric background stations installed in China. The simulated results were compared with levels of SO2, NO2, O3, and CO detected at three regional atmospheric background stations (Shangdianzi, Longfengshan, and Lin,an). The model captured the essential temporal characteristics of the observed data, such as the monthly, seasonal, and diurnal variance trends. However, while levels of SO2, NO2, and O3were properly predicted, the simulated CO values were grossly underestimated, being approximatelytwo-thirds or one-half of the observed values. These discrepancies are attributed to uncertainties in the CO emissions. Pollutant levels, especially those of SO2and CO, were more poorly simulated at Shangdianzi than at the other stations, partly because this site lies close to local emission sources from the Beijing area. The regional inventory used in this study could not capture the infuencing factors of strong regional sources on the stations. Given that pollutants (especially SO2and O3) were more poorly simulated in summer than in other seasons, it appears that meteorological felds such as temperature and wind are important. (An Xingqin)
3.8 Tracking the source area of Shangdianzi station using the Lagrangian particle dispersion model of FLEXPART
The FLEXPART model is a Lagrangian particle dispersion model developed by the Norwegian Institute for Air Research. In this study, we first compared simulations based on GFS and ECWMF meteorological data with the observed data collected at Shangdianzi station. Next, taking CO as the tracer gas and screening the background and non-background concentrations, we traced the clean and polluted source areas of the observation station using FLEXPART. Comparing the GFS and ECWMF simulations with the observational data, we found that GFS and ECWMF yielded similar results. Both models accurately reproduced the daily and monthly variations in CO levels. The correlation coeffcients between the measured CO concentrations and those simulated by GFS and ECWMF were 0.67 and 0.71, respectively. Both simulated results were slightly lower than the observed concentrations. The simulations also revealed that most of the background CO at Shangdianzi station is sourced from the north-west northwest-northwest sector, whereas the most important non-background source is the west-southwest-south sector. The model properly captures the distributions of the background and pollution source areas of Shangdianzi station and also refects the distribution of the CO source areas in the wider Beijing area. (An Xingqin)
3.9 Simulating CO2variability at Chinese background atmospheric monitoring stations between2000 and 2009 by the CarbonTracker model
A downscaling treatment was conducted over China using a numerical model named CarbonTracker. Applying a double grid nesting technique (3° × 2° over the whole globe, 1° × 1° over China), the atmospheric CO2concentrations were simulated and analyzed over a recent decade (2000–2009). The simulation results were consistent with data collected at four background atmospheric monitoring stations in China. Comparisons were made from January 2000 to December 2009 at the Waliguan station and from June 2006 to December 2009 at the Shangdianzi, Longfengshan, and Lin,an stations. All correlation coeffcients exceeded 0.7. At three of the stations, the high-resolution simulation data were slightly better correlated than the low-resolution data. Further analysis of the observed CO2concentration revealed annual and seasonal variations. In particular, the CO2concentration increased each year over the study period. The average decade increase exceeded 5%, reaching more than 7% at the Shangdianzi and Lin’an stations. The seasonal CO2variations were greater at the Longfengshan station than at the Shangdianzi and Lin’an stations. However, the actual concentrations were higher at Shangdianzi and Lin’an, because these stations receive input from the Jingjinji and Yangtze River Delta economic zones. The spatial distributions of CO2concentrations and fuxes were higher in eastern than in western China. (Cheng Yanli)
3.10 Diagnostic identifcation of the impact of meteorological conditions on PM2.5concentration
Using daily PM2.5concentration data from Beijing, surface observations and upper-air sounding data from regional weather stations in Beijing and North China (collected from 2007 to 2008), 5-min AWS (automatic weather station) observations, and hourly AMS (aerosol mass spectrum) data from July 2008, we analyzed the meteorological parameters and conditions that sensitively affect the PM2.5concentration. We also diagnosed and identifed the impact of meteorological conditions on air quality (AQ). The PM2.5was strongly affected by the condensation function fc, favoring the generation of secondary aerosol particles. Statistical analysis of a large sample of PM2.5and meteorological observation data indicated that the adaptive weight parameter ßis a reliable indicator of changing PM2.5concentration. When Beijing and North China experience dry, cold winters with a low fc, the parameter ß becomes large, and the conditions become conducive to suspended fne particles. During moist hot summers, although the fcis increased by the high temperature and humidity, ß plays a much weaker role than in winter. ß and fcinfuence and restrict each other, and their combined impacts on PM2.5concentration are consistent with the observed seasonal changes in meteorological elements and PM2.5concentrations. Furthermore, in Beijing, the 24-h forecast of the Parameters of Air quality and Meteorology index is strongly correlated with the observed PM2.5, indicating that PM2.5levels are useful for diagnosing, identifying, and predicting the infuence of meteorological conditions on AQ. (Wang Jizhi)
3.11 Sand dust weather in China and its oscillatory behavior, analyzed by a PLAM index tracking method
The characteristic distributions of regional sand and dust storm (SDS) from 1980 to 2011 were investigated using meteorological elements data from surface stations, atmospheric sounding data, highdensity weather data of the Chinese Meteorological Administration, and archived Chinese original weather maps. Based on the SDS deposited potential source contribution function (PSCF) method, a tracking analysis of the sand-dust weather process was developed using the index calculating of the Parameters of Air quality and Meteorology (PLAM), within the Northeast Asia region. The strength variability of the SDS systems was investigated by Spline trend analysis. The results showed that during 1980–2011, the waveforms of the SDS processes altered significantly, featuring both a historical persistence and abrupt transitions, with high–low oscillations occurring approximately once per decade. (Wang Jizhi)
3.12 Empirical modeling of soil erosion susceptibility
Soil erosion ranks among the most serious land degradation problems worldwide, causing irreversible reduction in land quality. In this investigation, we modifed the Revised Universal Soil Loss Equation (RUSLE) model by replacing the length and gradient of the slope with the sediment transport index (STI). The digital elevation model, terrain parameters, NDVI and meteorological data such as rainfall were input to the model. Applying remote sensing techniques and ground surveyed measurements, erosion susceptibility maps were produced. The revised models were then used to estimate the soil erosion susceptibility at Alianello, which is prone to soil erosion.
The soil loss estimated from the modifed RUSLE model is spatially variable, ranging from 10 t hm-2yr-1to as much as 7000 t hm-2yr-1. The area susceptible to high erosion constitutes around 46.8% of the total eroded area. Classifed by land cover type, 33% is “mixed bare with shrubs and grass”, 5.29% comprises a “mixture of shrubs and trees”, and a mere 0.06% constitutes “shrubs”. Very steep slopes account for 40.90% of the highly susceptible area, whereas fat slopes account for only 0.12%, indicating that fat topography presents a low erosion hazard. Among the geomorphologic types, “moderate steep-steep slopes with moderate to severe”types are most vulnerable to high soil erosion, and comprise about 9.34% of the highly susceptible area.
Finally, the soil erosion from the adapted RUSLE model was validated against the visual interpretation map. The two maps were 71.9% similar, indicating that the adapted RUSLE model effectively mapped the soil erosion in the study area. (Guo Jianping)
3.13 Assessment of human exposure to PM10in China
Epidemiological studies have found that atmospheric particulate matter, especially PM10(inhalable particulate matter with aerodynamic diameter less than or equal to 10 μm), presents a serious threat to human health. In recent years, particulate matter pollution in China has become increasingly serious and PM10has become the primary pollutant in Beijing and other cities. Therefore, studying and assessing the detrimental effect of PM10on human health is mandatory. Health damage assessment involves measuring human exposure levels to PM10and providing accurate exposure data for the exposure–response relationship, and for accurately quantifying the human exposure.
The spatial distribution of particle concentration in China varies because of spatial differences in localeconomic statuses and geographical environments. China’s accelerating urbanization has been accompanied by increased population density. However, since the urban population distribution varies both among and within cities, different numbers of individuals are exposed to different concentration ranges. Therefore, an accurate assessment of China’s exposure to particulate matter is a priority and fundamental to assessing the public health risk imposed by particle pollution. Using accurate population data and PM10monitoring data, this study analyzed human exposure to PM10in different regions and typical cities of China. In most areas, the population-weighted PM10exposure concentration was slightly higher than the annual mean concentration, indicating that many individuals are over exposed to PM10, although most of the population is exposed to levels that meet the second national standard (between 40 and 100 mg m-3). Specifcally, 83.7% of the population residing in 76.3% of China’s land area is exposed to 40–100 mg m-3of PM10. PM10exposure is elevated in two types of typical regions and cities; densely populated areas, such as Beijing, Tianjin, Hebei Province, and areas containing sand dust and factories, such as Northwest China and Chongqing. (An Xingqin)
3.14 Assessment of population exposure to PM10in Lanzhou and its health-related economic costs based on GIS
Background∶ Evaluating the adverse health effects of PM10pollution (particulate matter less than 10 microns in diameter) is crucial for protecting human health and establishing pollution control policies. Estimating population exposure levels is the frst step in formulating exposure data for quantitative assessment of harmful PM10pollution.
To estimate the PM10concentration, we implemented a spatial interpolation method on a grid with 0.01° × 0.01° spatial resolution. PM10concentration data were acquired from monitoring stations, and accurate population data in 2000 were acquired by a geographic information system. The data were spatially interpolated, and the interpolated population and PM10concentration layers were overlaid to obtain the population exposure levels. Combining the results with the exposure–response function between the PM10and health endpoints, the economic health costs of PM10pollution were analyzed.
In urban Lanzhou, human populations are distributed in a long narrow belt with relatively high spatial population gradients in the Xigu, Chengguan, and Qilihe districts. For calculating the excess exposure morbidity, the threshold concentrations of PM10were decided as follows∶ 0 μg m-3(no harmful health effects), 20 μg m-3(recommended by the World Health Organization), and 50 μg m-3(national frst class standard in China). In these three scenarios, the economic cost of PM10pollution-related adverse health effects (relative to the GDP) are 0.206%, 0.194%, and 0.175%, respectively. The impact of meteorological factors on PM10concentrations in 2000 was also analyzed. PM10concentration was largely affected by sandstorm weather in spring, inversion layers in winter, and precipitation in summer.
The study showed that the majority of China’s people live in polluted areas. Improved evaluation criteria revealed the full extent of the economic damage caused by PM10-related respiratory disease. The health risk to Lanzhou urban residents should not be ignored. The government must carefully balance economic development with residents’ health, and consider the pros and cons before making a fnal policy. (An Xingqin)

2013年3月30日,国务院副总理汪洋到中国气象局视察,在局长郑国光等领导陪同下,汪洋副总理一行视察了气科院大气成分研究所,院长端义宏主持了接待。汪洋副总理就大气成分与气候变化、雾-霾天气形成原因、大气成分监测和预测预报等科学问题与科研人员进行了交流。On 30 March 2013, Chinese Vice Premier Wang Yang, visited CMA in the accompany of CMA Administrator, Dr. Zheng Guoguang and other CMA leaders. President of CAMS, Dr. Duan Yihong hosted the visit to CAMS Atmospheric Composition Research Institute. Vice Premier Wang Yang exchanged views with scientists on hot scientific issues such as climate change, formation of fog-haze weather, atmospheric composition monitoring, as well as its prediction and forecasting, etc.

2013年1月14日,在中国气象局在沈阳召开的专题新闻发布会上,气科院院长端义宏详细解读了《中国温室气体公报》,温室气体专家周凌晞研究员回答了媒体记者的提问。这是中国气象局发布的由气科院牵头编制完成的首期《中国温室气体公报》,该公报今后将每年以中、英文版对外发布。On 14 January 2013, on the Press Briefing of CMA held in Shenyang, President of CAMS, Dr. Duan Yihong interpreted in detail the Bulletin of Greenhouse Gases in China. Prof. Zhou Lingxi, researcher on greenhouse gases, responded to the media questions. This was the frst Bulletin of Greenhouse Gases in China completed by CAMS taking the leading role and released by CMA. The Bulletin would be released every year in both Chinese and English versions.

2013年1月18日,气科院召开2013年工作会议。院长端义宏主持会议并做工作报告。报告总结了气科院2012年取得的工作成绩,并对2013年各项重点工作进行了部署。On 18 January 2013, the 2013 Annual Meeting of CAMS was held and presided over by Dr. Duan Yihong, President of CAMS, who presented the annual working report reviewing the working performance of CAMS in 2012 and confrmed the working highlights for 2013.
2013年2月21日,气科院组织召开了雾-霾天气成因分析与预报技术研讨会,院长端义宏主持会议。中国气象局副局长矫梅燕等领导出席会议,中国气象局科研业务部门、中国环科院、中科院大气所以及人民日报、中国科学报等10多个单位的100多名专家和记者参加了会议。On 21 February 2013, CAMS held the Workshop on Analysis of Fog-Haze Weather Formation and Its Forecasting Techniques, which was presided over by CAMS President, Dr. Duan Yihong. CMA Deputy Administrator, Prof. Jiao Meiyan and other leaders attended the workshop. More than 100 experts and journalists from over 10 institutions attended the workshop, including CMA’s institutional bodies, Chinese Research Academy of Environmental Sciences, Institute of Atmospheric Sciences of the Chinese Academy of Sciences, People’s Daily, etc.

2013年2月25日,气科院灾害天气国家重点实验室换届改革阶段总结会召开,院长端义宏宣读了新一届实验室科学顾问委员会和学术委员会成员名单。同时,实验室组织召开了学术委员会会议,专家针对实验室主任赵平的关于实验室换届改革阶段总结和5个重点研究方向团队首席科学家的关于发展计划的汇报进行了讨论。On 25 February 2013, a meeting for summarizing the reform outcomes over the certain period after the change of office for State Key Laboratory on Severe Weather (LaSW) was held. President of CAMS, Dr. Duan Yihong announced the name list of the new Scientifc Advisory Committee as well as the Academic Committee of LaSW. At the same time, LaSW organized the Academic Committee Meeting, during which expertise discussions were held regarding the summarizing report by LaSW head, Dr. Zhao Ping for reform outcomes over the certain period after the change of offce and development plans of fve key research teams by chief scientists.

2013年3月5日,气科院召开2012年度学术年会。17名院内外知名专家做了大会特邀报告和大会报告。在灾害天气和大气探测研究、气候和农业气象研究、大气成分和人工影响天气研究3个分会场,43位学者做了学术报告,展示了气科院最新科研成果和进展。On 5 March 2013, CAMS held the 2012 Annual Academic Conference and 17 famous experts from both CAMS and other institutions attended the conference and presented invited presentations or conference presentations. Academic presentations by 43 scholars were made on three sub-conferences covering hazardous weather and atmospheric sounding research, climate and agrometeorology, atmospheric composition and weather modification, exhibiting the latest scientific research outcomes and progresses of CAMS.
2013年3月22日,在副院长王怀刚的陪同下,郑国光局长观看了气科院正在举办的“光辉永在、精神永存——雷雨顺先进事迹暨学习活动展”。郑国光寄希气科院科研人员好好学习雷雨顺的刻苦钻研精神,努力为气象事业科学发展做贡献。On 22 March 2013, accompanied by Mr. Wang Huaigang, Vice President of CAMS, CMA Administrator, Dr. Zheng Guoguang, attended CAMS’ exhibition of“Eternal Spirit–Learning from Lei Yushun’s Working Performance of High Moral Standards”. Dr. Zheng Guoguang advocated that researching staff of CAMS should learn from Lei Yushun’s spirit of hard-working and devotedness to make more contributions to the scientifc development of meteorological cause.

2013年5月11日,第3次青藏高原大气科学试验实施方案及其第1阶段行业专项重大项目实施方案论证会在京召开。中国气象局局长郑国光、副局长宇如聪出席了论证会。针对试验的立项依据、实施方案以及试验组织保障等问题,周秀骥院士等14位专家组成员和与会者进行了论证和讨论,并一致同意通过上述实施方案。On 11 May 2013, demonstration meeting of experiment implementation scheme and meteorological key projects implementation scheme for the first phase of “the Third Tibetan Plateau Scientifc Experiment on Atmosphere” was held. CMA Administrator, Dr. Zheng Guoguang and Deputy Administrator, Dr. Yu Rucong attended the meeting. 14 members from the expert committee, including Dr. Zhou Xiuji, Academician of CAS, discussed with participants about the project basis, implementation scheme, organizational support for the experiment, etc. The above two schemes were approved unanimously.
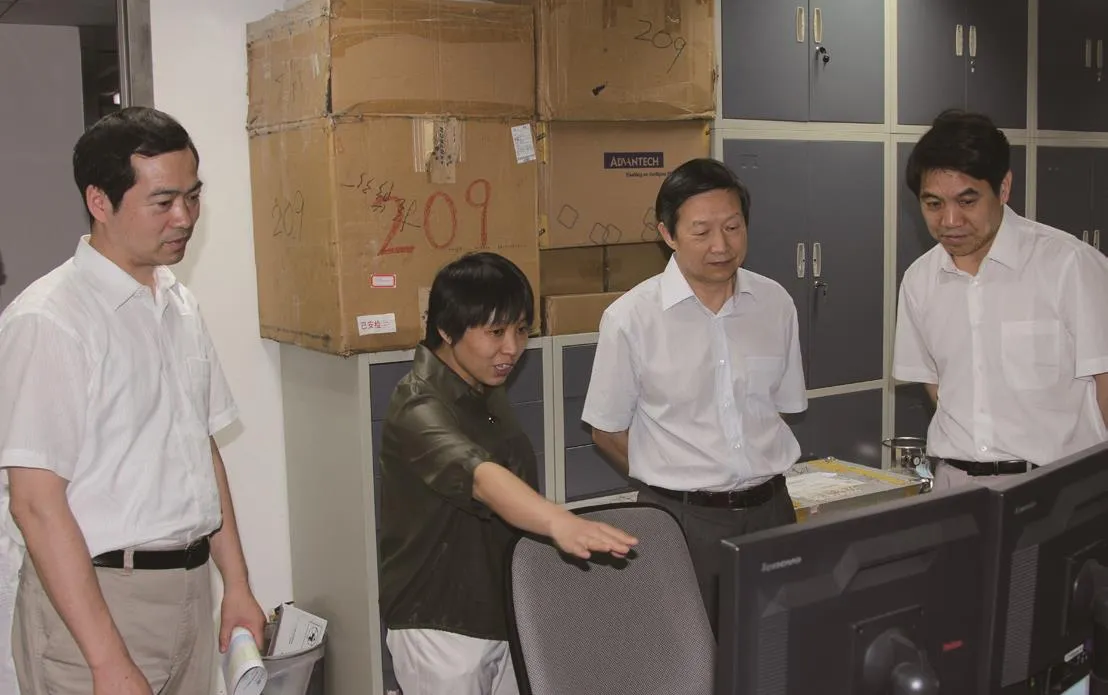
2013年6月26日,住房和城乡建设部副部长仇保兴在中国气象局郑国光局长陪同下,参观了气科院大气化学重点开放实验室,并就环境空气质量等公众关注的科学问题与实验室人员进行了交流。On 26 June 2013, Mr. Qiu Baoxing, Vice Minister for Ministry of Housing and Urban-Rural Development visited CAMS Key Open Laboratory of Atmospheric Chemistry, accompanied by CMA Administrator, Dr. Zheng Guoguang. Mr. Qiu Baoxing exchanged views with researchers from the lab on some scientifc issues such as environmental air quality, etc.
2013年6月26日,气科院召开特聘专家陈飞入选国家重点创新项目平台即国家“千人计划”宣布大会。陈飞是美国国家大气研究中心从事陆气相互作用与模拟研究的国际著名科学家。至此,气科院入选国家“千人计划”的专家已增至3人。On 26 June 2013, the declaration ceremony of Dr. Chen Fei’s selection into the National Leading Innovation Project Platform (the Thousand High-Level Foreign Experts Project) was held at CAMS. Dr. Chen Fei is a senior researcher from US National Center of Atmospheric Research (NCAR), specialized in landatmosphere interaction and modeling.
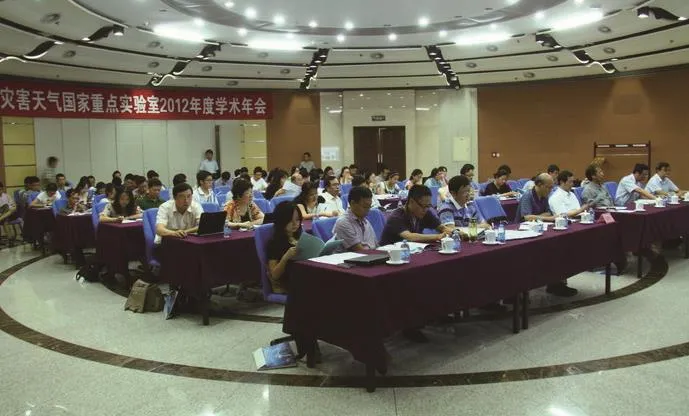
2013年7月4—5日,灾害天气国家重点实验室2012年度学术年会在京召开。年会邀请了美国知名台风专家William Mason Gray教授、张大林教授和气科院徐祥德院士等专家做了特邀报告,实验室各位首席专家、各团队研究人员进行了会议报告和学术交流。On 4-5 July 2013, the 2012 Academic Annual Meeting of State Key Laboratory on Severe Weather (LaSW) was held in Beijing. Typhoon expert, Prof. William Mason Gray from US, Prof. Zhang Dalin, Academician Xu Xiangde, et al. were invited to give presentations. Presentations and academic discussions were held by chief experts of the LaSW as well as researchers from all research teams.
2013年7月28—30日,中国气象局人工影响天气中心联合学术年会在北京召开,会议开幕式由人影中心主任李集明主持。来自北京大学等高校、中科院大气物理研究所等研究院所,以及全国12个省人影办共100多人与会进行了学术交流。On 28-30 July 2013, the Joint Academic Annual Meeting of CMA Weather Modification Center was held in Beijing. The Director-General of Weather Modification Center, Prof. Li Jiming presided over the opening ceremony. More than 100 participants attended the meeting, who are from universities like Peking University, research institutes such as Institute of Atmospheric Physics, CAS, as well as 12 provincial weather modification offices all over the country.
2013年8月3日,王怀刚副院长一行到广州野外雷电试验基地考察并慰问了正在开展雷电试验的气科院职工和研究生。气科院已连续8年开展了野外雷电试验,所获取的试验数据为我国开展雷电监测和雷电预警预报提供了有力的支撑。On 3 August 2013, Vice President of CAMS, Mr. Wang Huaigang visited the field test site for lightning in Guangzhou and greeted the CAMS staff and graduate students, who were carrying out lightning experiments. CAMS has carried out field thunder and lightning experiments for eight years, and the experimental data acquired have provided effective support to the monitoring of thunder and lightning as well as the prediction and warning service in the country.
2013年8月12日,国家973项目“我国持续性重大天气异常形成机理与预测理论和方法研究”中期总结评议会在北京召开。项目首席科学家翟盘茂研究员等5位专家汇报了5个课题的研究进展情况,并顺利通过了评议专家组的评议。On 12 August 2013, the mid-term summarizing meeting of National 973 Project “Research on Theories and Methods of Abnormal Formation Mechanism and Prediction for Sustained Significant Weather” was held in Beijing. The project chief scientist, Dr. Zhai Panmao and other four experts reported the research progress of fve subjects, which passed the peer review of expert committee.

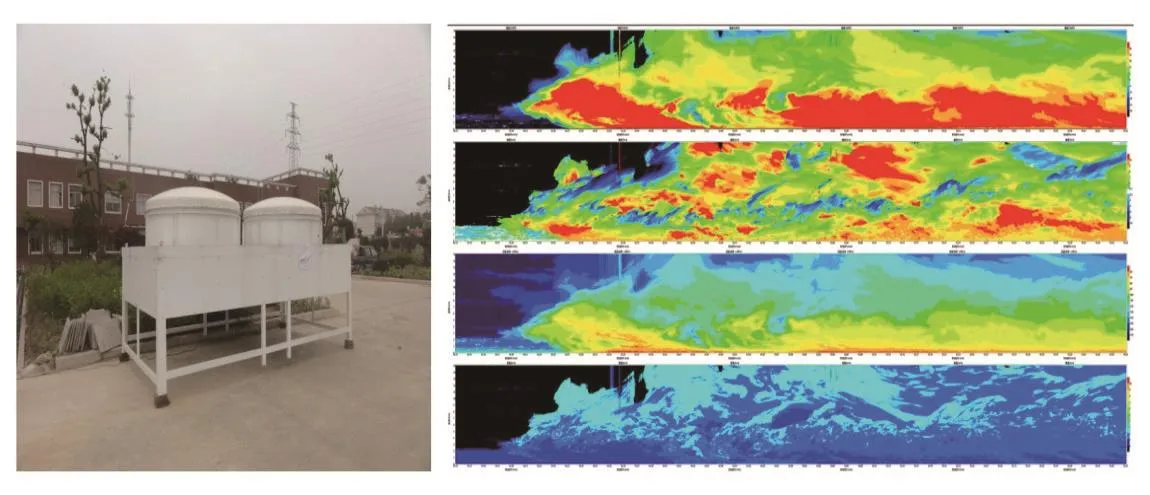
由灾害天气国家重点实验室组织、安徽四创电子股份有限公司研制的C波段连续波雷达(C-FMCW),在安徽定远试验运行80天后,于2013年9月6日通过了气科院组织的测试验收,2014年将正式投入第3次青藏高原大气科学试验。The C-Band consecutive wave radar (C-FMCW) organized by State Key Laboratory on Severe Weather (LaSW) and developed by Anhui Sichuang Electronics Corp. Ltd. completed CAMS’ test and approval on 6 September 2013, after 80 days’ trial running in Dingyuan, Anhui. In 2014, it will be put into official operation in the Third Tibetan Plateau Scientifc Experiment on Atmosphere.
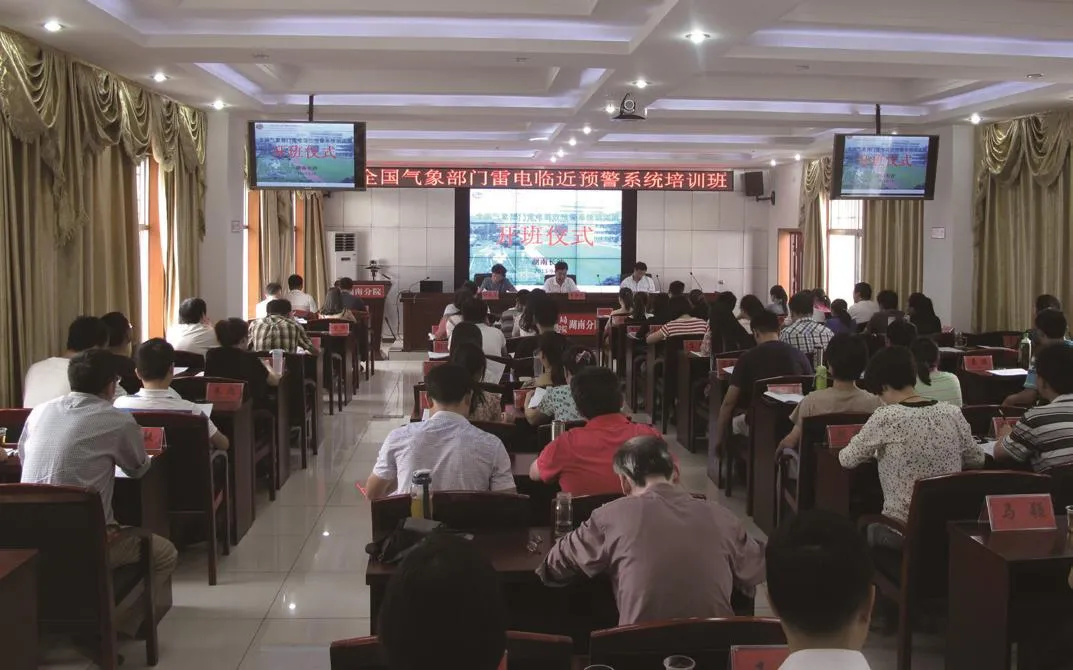
2013年9月24—27日,全国气象部门雷电临近预警系统培训班在湖南开班,来自全国各省市气象台、防雷中心等相关业务单位的60多位学员参加了培训。气科院大气探测研究所承担了本次培训班的教材编写和教学授课任务。On 24-27 September 2013, the National Training Workshop of Nowcasting Warning System for Thunder and Lightning was held in Hunan Province. More than 60 staff from provincial or prefectural meteorological observatories and lightning protection centers participated in the training. CAMS’ Atmospheric Sounding Institute compiled the training material and gave lectures for this training workshop.

2013年10月25日,气科院气候系统研究所召开2013/2014年冬季全国气候趋势预测研讨会。气候所所长武炳义等专家介绍了与冬季短期气候预测有关的研究成果,以及据此对2013/2014年东亚冬季风强弱、中国温度异常分布特征以及雾霾日数的多寡进行的预测。On 25 October 2013, CAMS Climate System Research Institute (CSRI) held the Workshop on Winter Climate Trend Prediction during 2013/2014 of the country. Dr. Wu Bingyi, Director of CSRI, and other experts introduced the latest research outcomes related to short-term climate prediction for winter season, as well as predictions for East-Asian winter monsoon strength in 2013/2014, distribution of temperature anomaly in China and number of fog-haze days based on the research outcomes.
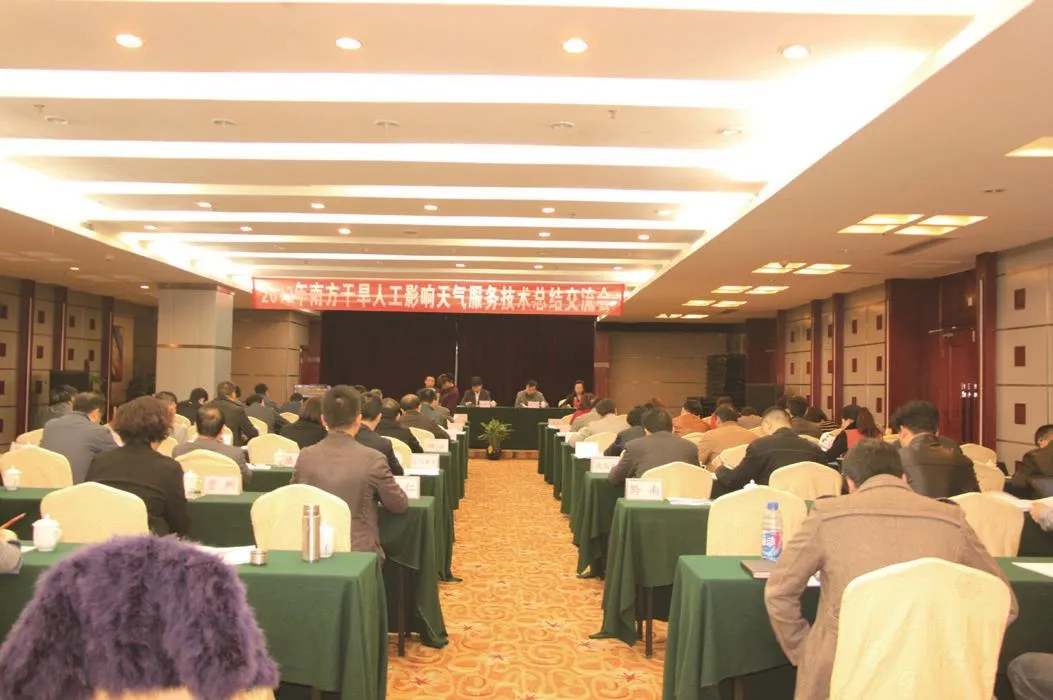
2013年11月4—5日,中国气象局人工影响天气中心在贵州召开2013年南方干旱人工影响天气服务技术总结交流会,总结交流应对南方复杂云系的人影作业相关科学技术问题。来自12个省气象局以及北京大学等单位的70多名人影专家出席会议。On 4-5 November 2013, CMA Weather Modification Center held the Summarizing and Technical Exchange Meeting of Weather Modifcation Service for Mitigating High-Temperature and Drought in south China in 2013. Scientific and technological issues related to weather modification operations in response to the complicated cloud system in south China were discussed. More than 70 weather modifcation experts from 12 provincial meteorological services and Peking University attended the meeting.
2013年11月22日,全国环境气象数值预报应用交流会在京举行。翟盘茂副院长出席会议,张小曳研究员主持会议。会上,数名专家分别介绍了国家级环境气象数值模式系统的建设现状、该系统在环境预报业务中的使用情况,并就如何区分雾、霾、轻雾、PM2.5浓度与能见度的关系等问题进行了深入讨论。On 22 November 2013, the National Environmental Meteorology NWP Application Workshop was held in Beijing. Vice President of CAMS, Dr. Zhai Panmao attended the meeting and Prof. Zhang Xiaoye, CAMS researcher, presided over the meeting. A number of experts introduced the development progress of the national environmental meteorology NWP system, its application in operational environmental prediction, and discussed about how to distinguish fog, haze, and light fog, as well as correlation of PM2.5with visibility, etc.

2013年11月22日,气科院灾害天气国家重点实验室与国家气象中心天气预报室联合召开了科研与业务结合试点工作之“暴雨研究与预报”项目年度会议。与会专家针对5次重大暴雨过程进行了深入的研讨和交流。总结了一年来在科研与业务结合方面取得的成绩,并讨论了未来的合作方向及交流合作机制。On 22 November 2013, CAMS State Key Laboratory on Severe Weather (LaSW), in joint effort with Weather Forecast Office of National Meteorological Center, held the Annual Meeting for Rainstorm Research and Forecast Pilot Project combing research and operation. The participating experts thoroughly exchanged views on fve severe rainstorm processes and reviewed the outcomes in the past year regarding the combination of research and operation. CAMS and NMC also discussed about future cooperation and exchange mechanisms.
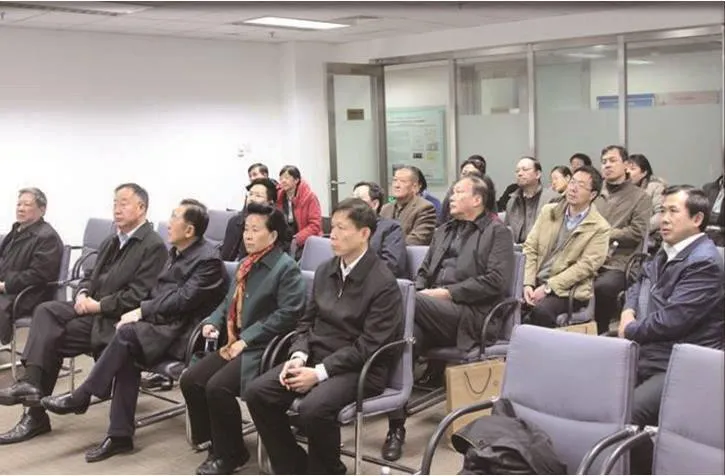
2013年11月28日,全国政协人口资源环境委员会委员一行30余人,在中国气象局副局长许小峰等领导的陪同下,参观了气科院大气化学重点开放实验室。气科院院长端义宏向客人介绍了气科院的情况,张小曳研究员介绍了中国气象局环境气象与大气成分工作,委员们就大气成分及雾-霾相关研究工作与专家进行了交流和探讨。On 28 November 2013, a delegation of about 30 from the CPPCC Committee of Population, Resources and Environment visited CAMS Key Open Laboratory of Atmospheric Chemistry, accompanied by CMA Deputy Administrator, Dr. Xu Xiaofeng and other leaders. CAMS President, Dr. Duan Yihong introduced CAMS. Researcher Zhang Xiaoye introduced CMA’s work in the area of environmental meteorology and atmospheric composition. The guests exchanged views with CAMS experts on atmospheric composition and fog-haze research.
2013年11月26日,WMO/WWRP国际研究发展项目——华南季风降水试验(SCMREX)2013年度总结会议在京召开。项目负责人罗亚丽研究员及相关专家从外场观测试验、网站和数据库建设、数值预报研究、机理研究4方面汇报了项目进展。会议还针对2013年预备试验中暴露的问题和解决方案进行了讨论。On 26 November 2013, WMO/WWRP International Research and Development Project-South China Monsoon Rainfall Experiment (SCMAREX) held its 2013 Annual Meeting in Beijing. The project leader, Prof. Luo Yali, CAMS researcher, and relevant experts reported on the project progress from four aspects including field observation experiment, website and database development, NWP research, and mechanism investigation. The meeting also discussed the problems arising from preparatory experiments in 2013 as well as recommended solutions.
猜你喜欢
成都信息工程大学学报(2022年3期)2022-07-21
地球科学与环境学报(2021年6期)2021-11-16
家庭影院技术(2021年8期)2021-11-02
学生天地(2020年18期)2020-08-25
装备环境工程(2019年6期)2019-07-16
家庭影院技术(2019年1期)2019-01-21
国外科技新书评介(2014年4期)2014-12-17
数学大王·中高年级(2006年7期)2006-07-01