大气探测与雷电研究进展
2013-07-05 16:44
中国气象科学研究院年报 2013年0期
大气探测与雷电防护
Atmospheric Sounding and Lightning Protection
大气探测与雷电研究进展
2013年大气探测研究所基于试验和理论研究,紧密围绕闪电监测、雷电物理过程的观测和研究、雷暴中闪电活动的研究等几个方面开展了大量的工作,取得了丰硕的成果。2013年新申请批准国家自然科学基金面上项目1项,获得973计划项目“雷电重大灾害天气系统的过程、动力、微物理和成灾机理”1项课题和2项专题的支持;发表论文16篇,其中10篇被SCI/EI收录;申请国际专利1项、国家发明专利3项、实用新型专利1项,获得专利授权5项。主要成果集中体现在以下几个方面。
1 雷电观测试验和物理过程研究
1.1 雷电野外观测试验
2013年4月16日至8月16日,大气探测研究所在广州从化“广州野外雷电试验基地”开展了第8年的广东闪电放电综合观测试验(GCOELD)。本年度试验实现了多次包括多回击在内的人工触发闪电,获取了包括先导始发阶段在内的较完整的综合观测资料, 共成功触发闪电8次,其中4次为多回击闪电,同时获得了上述触发闪电的电磁场、光辐射、高速摄像、电流的直接测量资料。通过架设高灵敏度电磁场探测天线和小量程电流测量装置,在改进了触发记录方案后,共获得了13次成功触发和失败触发时的先导全阶段电磁信号及电流信号的记录。创建了低频电磁场、光辐射、宽带辐射场和高速摄像多频段的同步综合观测平台,成功探测记录到了几十次包含低频电磁场、高频辐射场及光辐射在内的不规则脉冲簇放电事件,并且获得了数次宝贵的高速摄像同步记录数据。
此外,通过将人工触发闪电引发到通信塔的方法,获得通信塔电源及信号线的分流、感应情况,检验了真实雷电环境下通信系统的电磁兼容性能,研究了真实雷电环境下雷电电磁脉冲(LEMP)在通信各系统中的耦合机理和破坏机制。共成功获得了5次直击雷的感应电压特征及通信设备分流性能,为通信基站雷电防护方案的优化及防雷等级的确立提供了重要的基础数据(图1)。(吕伟涛)
1.2 经典和空中触发闪电回击电流特征研究
通过对广东闪电放电综合观测试验(GCOELD)中经典和空中触发闪电回击电流特征的研究,首次分析了广东闪电放电综合观测试验中由10次经典触发闪电和1次空中触发闪电产生的29次回击过程的电流资料。分析发现,回击峰值电流的平均值为16.07 kA,上升沿10%~90%平均上升时间为29.16 kA/ μs,回击开始1 ms内的平均电荷传输为1.36 C,平均比能量为5.39×10³A2·s,上述值与其他地区的触发闪电研究结果相比偏大。分析发现,峰值电流与上升沿10%~90%陡度、最大陡度、回击开始后1 ms内的电荷传输和1 ms内的比能量分别有显著的指数函数、指数函数、幂函数和对数函数关系,决定系数(相关系数的平方)分别达到了0.43、0.77、0.89和0.93。此外,分析了包含在2次空中触发闪电初始阶段过程的初始阶段回击特征,峰值电流分别为10.09 kA和9.03 kA,他们的峰值,10%~90%上升时间、10%~90%平均陡度和最大陡度都近似回击过程。分析了跟随在初始阶段回击之后的锯齿状振荡(chopped-shape)脉冲以及与导线融化和通道重建相关联的脉冲。(郑栋)
1.3 人工触发闪电M分量的电流与电磁场特征分析
M分量发生在回击过程之后的通道微弱发光阶段,并伴随有通道亮度的突然增加和电场的快速变化。Malan和Collens于20世纪30年代首次发现了这一现象并将其命名为M分量,其光脉冲信号表现为对称的形式。虽然目前对M过程有一定了解,但对于M分量产生的物理机制仍然存在许多疑问,其电磁场波形特征仍不明确。研究M分量多从其电流特征着手,但是其电流的直接测量存在很多困难,如何实现其电流的反演,十分重要且必要。本研究从M分量的电磁场和电流波形分析入手寻找相关性,从而为M分量电流的反演提供支持。
利用2008—2010年在广州从化人工触发闪电试验中观测到的闪电通道底部电流、近距离电场以及近距离磁场数据资料,对人工触发闪电M过程的电流和电磁场特征及相关性进行了分析。分析显示M分量的电场、电流及磁场主要的波形特征参量如下:M分量电场波形持续时间和10%~90%上升时间几何平均值分别为0.49 ms和0.12 ms;电流波形持续时间、10%~90%上升时间和电流变化的几何平均值分别为0.53 ms、0.11 ms和0.34 kA;磁场波形持续时间、10%-90%上升时间和磁场变化的几何平均值分别为0.65 ms、0.16 ms和2.76×10⁻⁵T。此外,M分量的电流、电场及磁场波形间存在一定的相互关系。相关性分析结果表明,M分量的电磁场与电流资料在峰值幅度上具有较强相关性,几何形状也较为一致,利用电磁场资料反演M分量的电流波形具有可行性(图2)。(张阳)
1.4 正地闪初始击穿过程的研究
为了更好地理解正地闪的始发机理,将广州和北京两个地区的正地闪初始击穿脉冲特征进行了比较研究。考虑到广州和北京这两个地区的正地闪比例不同,整体电荷结构分布存在差异,因此,该比较分析也反映了电荷结构对正地闪初始击穿脉冲的影响,从一定程度上解释和推断了不同种类、不同特征的初始击穿脉冲的发生机制。根据与回击极性的关系,研究发现了相同、相反、混合3种类别的正地闪初始击穿脉冲。广州和北京两地的正地闪初始击穿脉冲簇虽然存在相同的类型,但是其特征存在很大差别。由于北京地区存在较大的正电荷区,导致广州和北京的初始击穿脉冲各种类型的比例存在很大不同,北京地区的相反极性类型比例更高。北京和广州两地的脉冲参量特征具有明显差别,广州地区较大的脉冲宽度和相邻脉冲间隔显示了放电距离的不同。与广州相比,北京更大的初始击穿脉冲峰值和首次回击峰值的比例来源于相反极性脉冲在这方面的贡献。我们认为,随着纬度的升高,只有相反极性的初始击穿过程具有更高的强度。两地的初始击穿脉冲也出现了相似的特征,相反极性脉冲具有较大的和回击之间的时间间隔,而相反极性的脉冲具有较小的脉冲簇持续时间以及脉冲簇峰值和首次回击的比例(图3,4)。(张阳)
1.5 负地闪不规则脉冲簇事件的宽带干涉仪三维观测
通过2010年夏季的VHF宽带干涉仪双站同步观测试验,对闪电中的不规则脉冲簇事件(CPT)进行了观测研究。这类事件由于常出现在负地闪继后回击前先导过程的时间段,因此也被称作不规则先导(Chaotic Leader)。但近年来的观测表明,这类事件也会在闪电过程多个放电阶段中出现,因此可将其总称为不规则脉冲簇事件。针对10次含有CPT事件并具有较好VHF辐射源三维定位结果的负地闪宽带干涉仪的观测记录进行了分析,给出了这类事件的时空发展特征、30~290 MHz频段功率谱特征,以及VLF/LF频段的电场变化波形特征。分析结果表明,与CPT事件相关的放电过程与企图先导或直窜先导类似,放电过程的平均发展速度为106~107m/s。CPT事件的平均功率谱密度比同次闪电中的体积先导或直窜先导大1.8~11.6 dB或2.4~12.0 dB。CPT电场变化波形脉冲间隔的平均值和标准差分别为5.3~9.0 μs和2.7~4.9 μs(图5)。(刘恒毅)
1.6 高建筑物雷电过程中的非“头部-头部”连接现象
在广州高建筑物雷电观测试验中,采用帧率达104帧/s(fps)量级的高速摄像系统观测到击中广州国际金融中心(高440 m)的一次下行地闪。分析表明,该闪电的上行连接先导的发展特征受下行先导的影响较为明显,特别是在回击前的160 µs内,上行先导的速率从105m/s量级快速升至106m/s量级,亮度也快速增强;而下行先导的发展受上行先导的影响相对较弱,只有在先导头部间距减小至60 m以下,才观测到下行先导明显向上行先导弯曲,速率和亮度才有明显提升。连接过程中下行和上行先导发展速率的比值随时间呈现逐渐降低的趋势,并且会降低到明显低于1的情况,即上行先导的发展速率会明显超过下行先导,这在已有的先导模式中从未考虑过。5×10⁴帧/s的高速摄像资料清楚地体现出该次闪电的连接点位于上行先导头部以下,即“头部-侧面”连接,这是国际上首次发表的有关连接过程中下行先导和上行先导非“头部-头部”连接的观测事实。关于此个例的分析结果已发表在美国《地球物理研究快报》(Geophysical Research Letters)期刊上,并被选为2013年12月美国地球物理学会(AGU )期刊的亮点(Highlight)工作,得到了国际同行的高度关注(图6)。(吕伟涛)
2 台风闪电活动和降水特性研究
综合利用地基闪电定位资料、热带气旋强度和路径资料、多普勒雷达资料以及TRMM卫星微波辐射计和闪电成像仪同步观测资料,分析了我国第0906号登陆台风“莫拉菲”的闪电时空分布特征;选取雷达参量和卫星反演参量,详细对比了台风内、外雨带对流结构和降水特性,揭示了台风不同区域闪电活动差异产生的原因。台风闪电集中发生在外雨带,内雨带和眼壁闪电活动相对较少。闪电的空间分布表现出明显的结构非对称性,主要发生在台风移动方向(西北向)的左侧。台风临近登陆时虽然强度减弱,但仍有较强的闪电活动发生,台风登陆后闪电活动迅速减弱,但正地闪比例上升,特别是消散阶段正地闪平均比例较高。在气旋到达最大强度之前,眼壁闪电爆发(图7)。眼壁闪电的间歇式爆发,可能预示着气旋的加深和强度的增强。台风不同区域的对流结构和降水特征,决定了闪电活动特征的差异。外雨带由于具有较强的上升气流、较大的降水粒子浓度、混合相态区具有较高的冰相粒子浓度,对流云体不仅在垂直方向达到较高高度,而且具有较为广阔的水平分布范围,因而具有较强的闪电活动。台风处于海上时,有较为完整的结构,但外雨带地表降水率较低,闪电活动较弱。外雨带登陆后出现强对流核,产生较强的地表降水和闪电活动。台风登陆后较高的冰粒子浓度以及靠近陆地一侧螺旋雨带与陆地的摩擦作用,是外雨带对流和闪电活动增强的主要原因(图8)。(张文娟)
3 雷电业务相关研究
3.1 雷电监测预警系统的运行、改进和推广
改进了雷电监测预警业务平台,并优化了临近预警算法。具体改进包括:增加了重点区域雷电临近预警产品以及移动趋势预报产品的文本表现形式;增加了产品数据保留功能和定时删除系统所生成数据的功能;增加了雷电临近预警系统的历史模式设计。用户输入所要运行的时间段,系统将自动停止实时运行模式,开始历史模式的运行,获取相应的产品,便于事后产品的评估。
大气探测研究所还承担了“雷电临近预警系统培训班”的教材编写和教学授课任务。(姚雯)
3.2 雷电灾害业务工作和雷灾数据库的完善
进一步完善了全国雷电灾害专用数据库,对全国雷电灾情资料进行了系统的管理。系统改进包括:建立了重大雷灾示例库,其中包括了重大雷灾事例的文本报告、雷灾各种类型特征、雷灾图片等。进一步细化了雷电灾情属性类别,将雷电灾害事故属性细分为损失类型、灾害程度、事前防雷措施、人员伤亡程度、雷击原因、雷击时防护措施、雷击环境、财产损失行业等方面。雷灾各种类型特征统计在数字化基础上增加了图形输出功能。实现了批量XML格式的雷电灾情数据的导入。(王飞,姚雯)
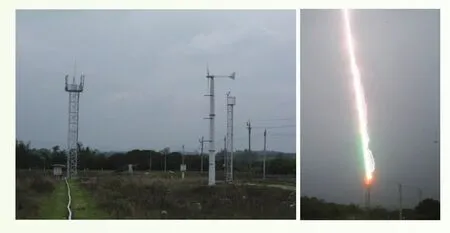
图 1 人工引雷试验场和2013年6月5日的一次成功触发闪电Fig. 1 The trigged lightning proving ground (left) and a successful trigged lightning on 5 June 2013 (right)
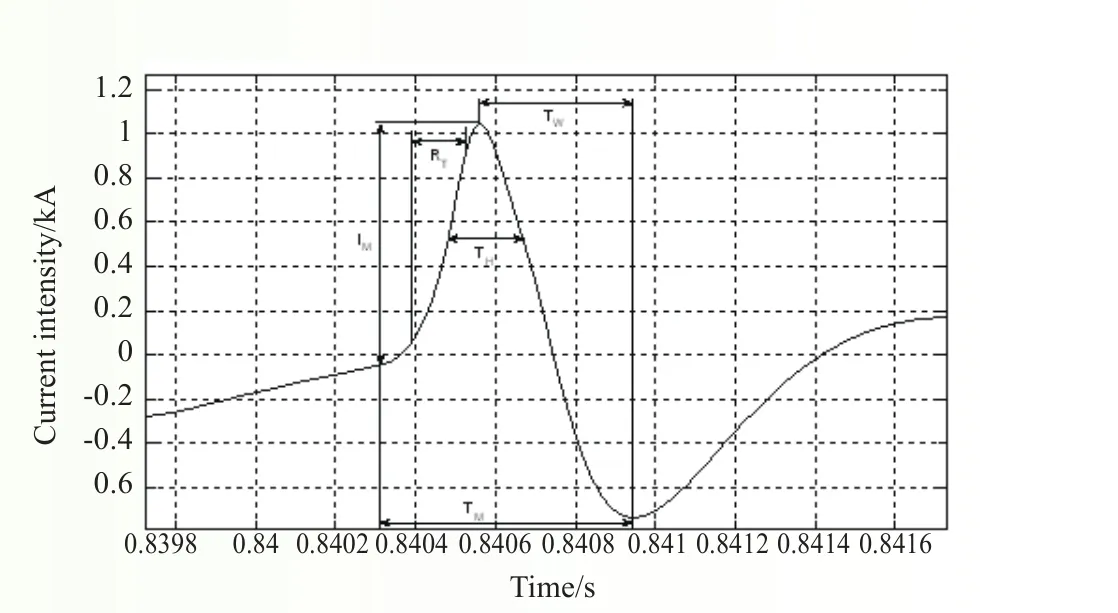
图 2 M分量波形Fig. 2 Waveform of M component
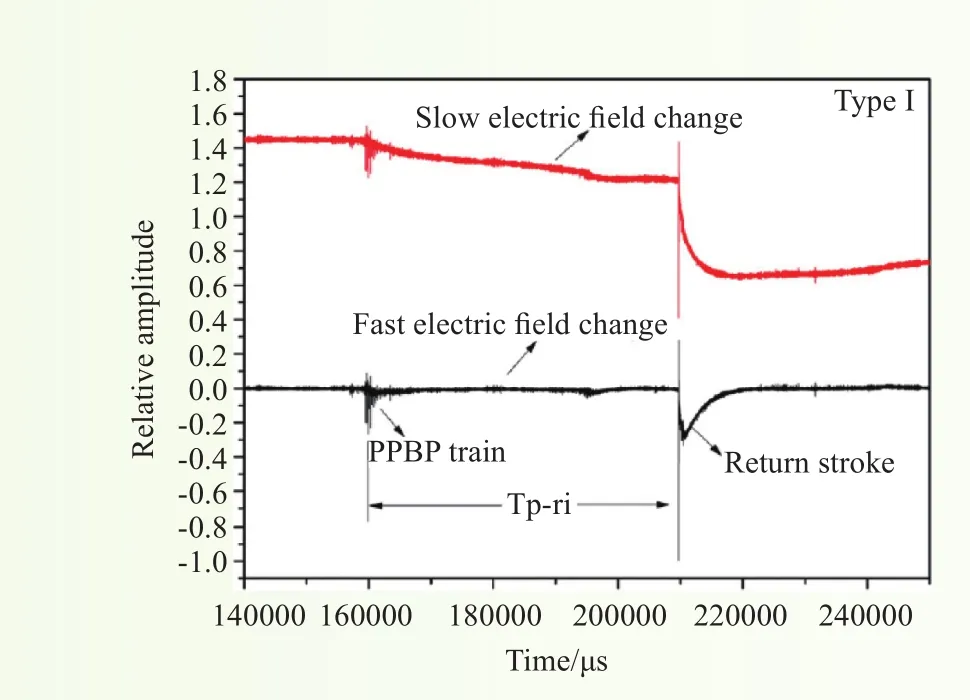
图 3 初始击穿脉冲的波形Fig. 3 Waveform of initial breakdown pulses
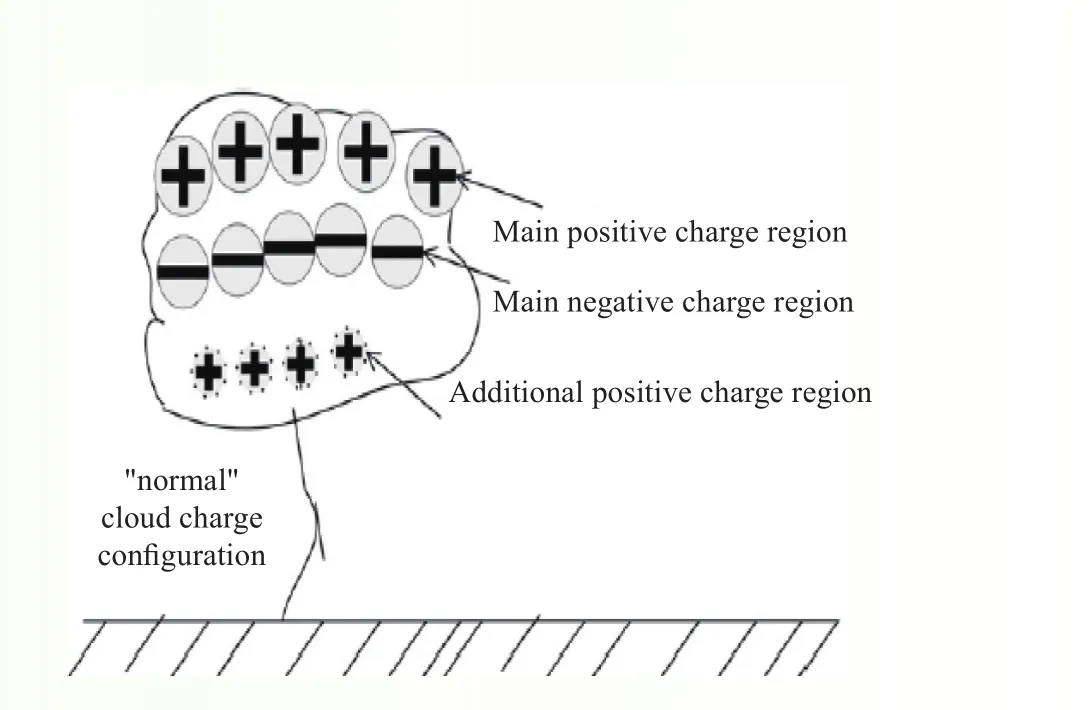
图 4 与初始击穿脉冲相关的电荷结构Fig. 4 Thundercloud charge structure corresponding to initial breakdown pulses
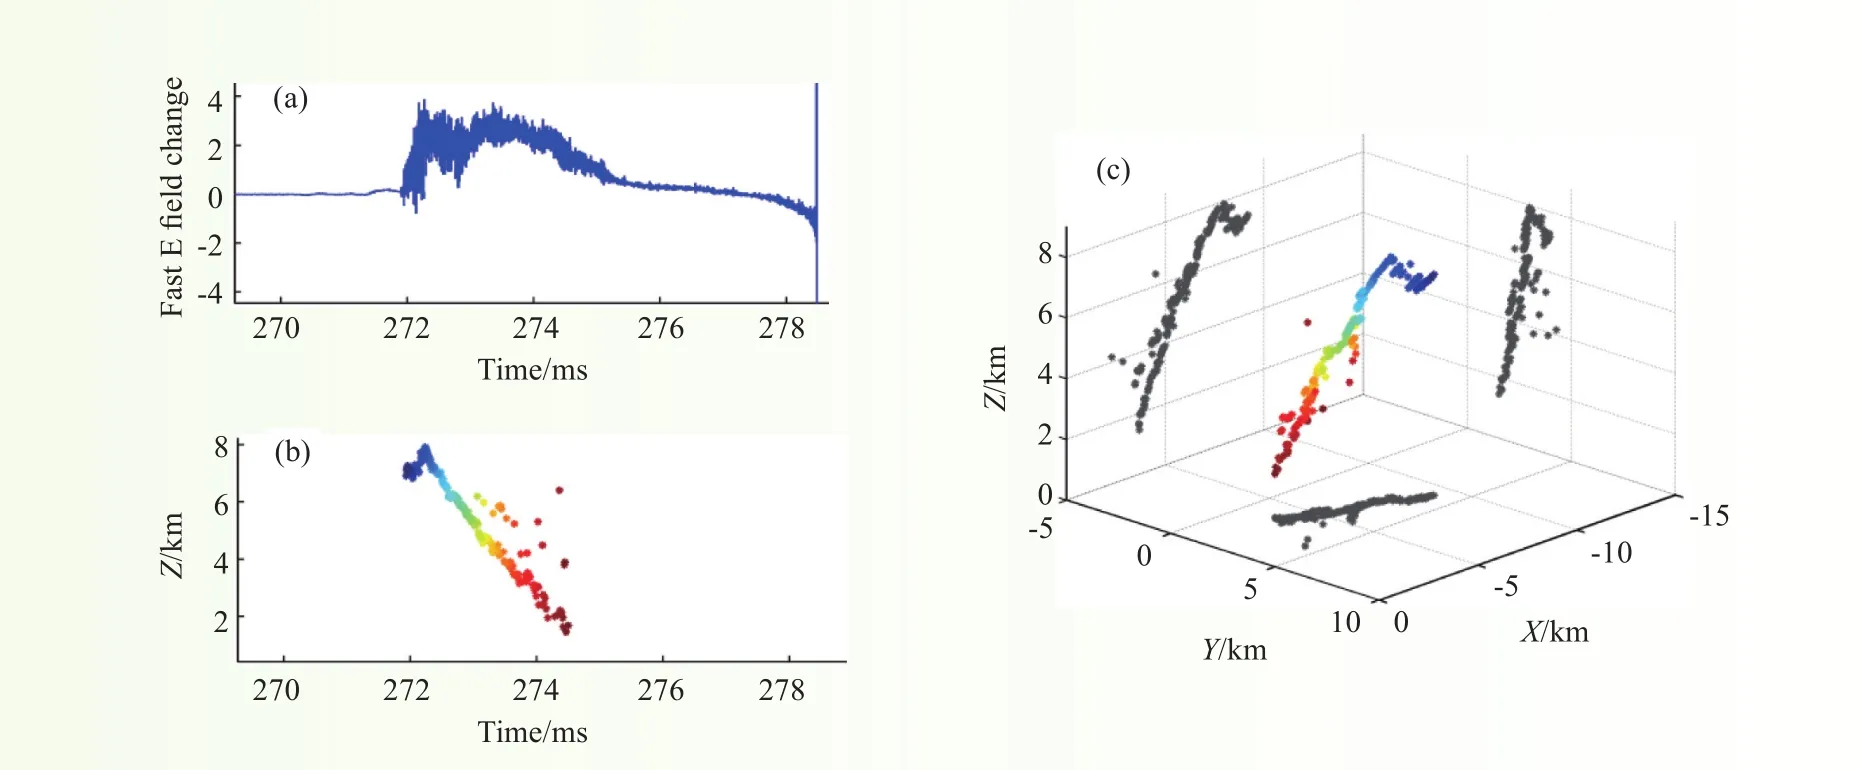
图 5 2010年6月15日16:21:50(北京时)一次负地闪中脉冲簇(CPT)事件:(a)快电场变化波形;(b)辐射源高度随时间变化;(c)辐射源三维定位结果(彩色点)及X、Y、Z坐标平面投影(灰色点)Fig. 5 Three-dimensional location of chaotic pulse trains (CPT) occurring in a negative cloud-to-ground (CG) fash recorded at 16∶21∶50 15 June 2010∶ (a) Fast E feld change waveform; (b) height of sources (Z) over time; (c) three-dimensional location and its projection onto the three coordinate planes (gray points)
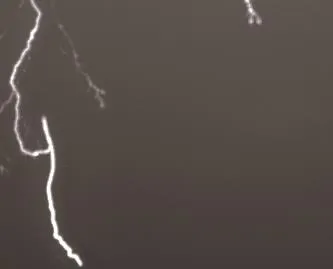
图 6 下行先导击中上行连接先导侧面的光学证据Fig. 6 Optical evidence of the newly documented phenomenon∶ connection of the downward leader tip to the lateral surface of upward connecting leader (UCL)

图 7 2009年第6号台风闪电频次与中心最低气压和最大风速随时间的演变(数字标号为3次眼壁闪电爆发)Fig. 7 Temporal evolution of lightning flashes superimposed on hourly interpolations of the minimum central pressure and maximum sustained wind speed of Typhoon Molave. The three eyewall lightning outbreaks are indicated by arrows with serial numbers
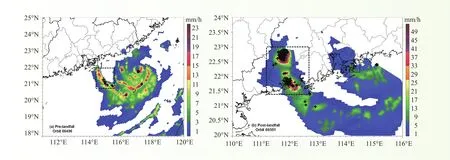
图 8 外雨带登陆前(a)和登陆后(b)TRMM/TMI-2A12反演的地表降水率和LIS探测闪电的叠加(矩形框为研究区域,“+”为LIS探测到的闪电,黑色圆点为台风中心位置)Fig. 8 Distributions of surface precipitation rate retrieved by TRMM/TMI-2A12 and lightning detected by LIS during prelandfall (a) and postlandfall (b) of the outer rainbands of Typhoon Molave. The rectangle denotes the study area. The symbol “+”indicates total lightning fashes detected by LIS. The black dot marks the location of the center of Molave
Progress in Atmospheric Sounding and Lightning Research
Through feld experiments and theoretical studies, sciensts at the Atmospheric Sounding Institute have performed considerable research on the monitoring of lightning, the observation and study of lightning physical processes, and its activity in thunderstorms. A large number of accomplishments were attained during 2013. A new National Science Fund ation of China project was approved; one general subject and two special projects were supported by the 973 planned project, “The development process, dynamics, microphysics, and disaster mechanism of major disaster weather systems with lightning;” 16 papers were published, ten of which were published by SCI/EI; one international patent, three national invention patents, and one utility patent were applied for, and fve patents were granted. Specifc results of the research are presented in the following sections.
1 Lightning feld experiments and physical process research
1.1 Lightning feld experiments
The 8th Guangdong Comprehensive Observation Experiment on Lightning Discharge was performed in Conghua, Guangzhou, from 16 April to 16 August, 2013. Eight lightning fashes, including four lightning flashes with multiple return strokes, were successfully triggered. Comprehensive and complete observation data, including the originating leader, were obtained, in addition to direct observational data, such as electromagnetic feld, optical radiation, high-speed video, and electric current. Following the installation of a highly sensitive electromagnetic feld detecting antenna and a current measurement device with small range, the electromagnetic felds and currents of the entire leader process for 13 successfully and unsuccessfully triggered lightning fashes were recorded. An observation platform was constructed to make synchronous observations of the lightning fash electromagnetic feld, optical radiation, broadband radiation feld, and to record high-speed video in various frequency bands. Moreover, dozens of chaotic pulse trains were successfully recorded.
In addition, the shunt and induction of power supply in the signal lines of the communication tower were acquired after introducing triggered lightning into the communication tower. The electromagnetic compatibility of the communication system was examined in real lightning conditions, while the coupling and failure mechanisms during a lightning electromagnetic pulse were also studied. The induced voltage characteristics and the current distribution performance of the communication equipment were recorded for five triggered lightning fashes that stroke the tower directly. These observations provide important basic data for optimizing the communication station’s lightning protection scheme and for establishing an appropriate lightning protection level in the future (Fig. 1). (Lü Weitao)
1.2 Characteristics of the return stroke currents of classical triggered lightning fashes (TLFs) and altitude TLFs
The currents of 29 return strokes (RSs) from 10 classical triggered lightning flashes (TLFs) and an altitude TLF recorded in Guangdong, China between 2008 and 2011 are analyzed for the frst time. They have relatively high peak values, with a geometric mean (GM) of 16.07 kA, an average rate of increase between 10% and 90% (S10%–90%, GM of 29.16 kA μs−1), with charge transfer occurring within 1 ms (Q1 ms, GM of 1.36 C) and action integral within 1 ms (AI1 ms, GM of 5.39 × 10³A2s). These are higher than the values reported in other studies. The peak current exhibits a pronounced exponential relationship with S10%–90% (determination coeffcient (R2) = 0.43) and the maximum rate of rise (R2= 0.77), a power relationship with Q1 ms (R2= 0.89), and a logarithmic relationship with AI1 ms (R2= 0.93). In addition, the discharges associated with the processes of initial-stage return strokes (ISRSs) involved in two altitude TLFs, with the peak currentsof 10.09 and 9.03 kA, respectively, are investigated. Their peak, 10%–90% rise time, average rate of rise between 10% and 90%, and maximum rate of rise are comparable to those of RSs. The chopped-shape pulses that closely follow ISRSs and the pulses associated with the disintegration and the reconnections of the wire’s channel are also discussed. (Zheng Dong)
1.3 Current and electromagnetic feld of the M component in triggered lightning
Lightning M components are transient enhancements in the continuing current and in the associated channel luminosity after the return stroke. A typical M component is characterized by an approximately symmetrical current pulse at the channel base. Although some stuches on M components have been performed, their occurrence mechanism is not completely understood. Current is clearly an important parameter; however, it is very difficult to directly measure lightning currents. Therefore, it is necessary to deduce the current based on electromagnetic data. Based on the available data of the channel base current and the nearby electromagnetic feld for the triggered lightning events obtained in Conghua, Guangzhou during 2008–2010, the characteristics and correlations between the base current and the electromagnetic feld of the M component are analyzed.
The results are as follows∶ a) the geometric mean values of duration, the 10%–90% rise time, the decline time, and the half-peak width for the electric feld waveform of the M component are 0.49, 0.12, 0.28, and 0.15 ms, respectively; b) the geometric mean values of duration, the 10%–90% rise time, the decline time, the halfpeak width, and the peak for the current waveform of the M component are 0.53, 0.11, 0.31, 0.17 ms, and 0.34 kA, respectively; and c) the geometric mean values of duration, the 10%–90% rise time, the decline time, the half-peak width, and the peak for the magnetic feld waveform of the M component are 0.65, 0.16, 0.37, 0.21 ms, and 2.76 × 10⁻⁵T, respectively.
In addition, the following relationships were identified between the current, the electric field, and the magnetic feld waveform of the M component. The correlation coeffcients of the duration, the 10%–90% rise time, the decline time, the half-peak width, and the peak between the electric feld and the current are 0.64, 0.69, 0.39, 0.77, and 0.86, respectively. Similarly, the coeffcients between the magnetic feld and current are 0.62, 0.86, 0.55, 0.76, and 0.93, respectively.
In summary, a relatively strong correlation can be identified between the peaks of current and the electromagnetic feld waveform, and their geometry shows some comparability. Consequently, it is feasible to calculate the current waveform of the M component using electromagnetic feld data (Fig. 2). (Zhang Yang)
1.4 Study on the initial breakdown process for positive cloud-to-ground lightning
To further understand the initiation mechanism for positive cloud-to-ground fashes, the characteristics of the initial breakdown pulse trains are investigated and compared using electric feld data observed in Beijing and Guangzhou. According to the difference in initial polarity between the initial breakdown pulse and the frst return stoke, three types of initial breakdown pulse trains are identifed∶ same polarity (type I), opposite polarity (type II), and composite polarity (type III). These categories of initial breakdown pulse trains are the same in Beijing as those in Guangzhou. However, in Beijing and Guangzhou, the proportions of each type are different, which may be due to different charge confgurations. In Beijing, the percentages of type I, type II and type III are 55%, 39%, and 6%, respectively, whereas in Guangzhou, the percentages of type I, type II, and type III are 81%, 15%, and 4%, respectively. Through the comparison of the pulse train parameters, it can be found that the widths of individual pulses and the intervals between adjacent pulses are greater in Guangzhou than in Beijing, which may be due to differences in the discharge distance. In addition, both in Beijing and Guangzhou, the pulse train duration and the ratio of the maximum peak amplitude of the initial breakdown pulse train to the amplitude of the frst return stroke peak for type II are smaller than those for type I. However, the interval between the initial breakdown pulse train and the frst return stroke for type II is greater than that for type I. We also fnd that for type II, the ratio of the maximum peak amplitude of the initial breakdown pulse train to the amplitude of the frst return stroke peak is notably larger in Beijing than in Guangzhou. We believe that theintensity of the initiation breakdown process for type II is greater at higher latitudes. It can be speculated that the intensity of the initial breakdown pulse train preceding the positive frst return stroke is further affected by the intensity of the lower positively charged region. Possible causes of these differences have been discussed (Fig. 3 and 4). (Zhang Yang)
1.5 Three-dimensional observations of chaotic pulse trains in negative CG flashes using VHF broadband digital interferometer
In the summer of 2010, we performed a three-dimensional lightning locating experiment using synchronous observations from two VHF broadband interferometer systems near to or at the Guangzhou Field Experiment Station for Lightning Research and Testing. During the experiments, various lightning phenomena were observed by our interferometer systems, including chaotic pulse trains (CPTs). The term “CPT” is used here rather than ‘Chaotic Leader’ because, in several cases, the observed irregular sequences of pulse activity were not close to the subsequent return stroke.
In this study, we selected ten negative cloud-to-ground lightning records that contained CPT events. The discharge processes associated with CPTs were imaged in three dimensions using VHF broadband digital interferometers. The spatial and temporal characteristics of these records were analyzed, alongside the power spectral density (PSD) in the 30 to 290 MHz band and the pulse train structure.
We found that the breakdown processes associated with CPTs is similar to those of attempt leaders or dart leaders. The statistical result shows that the average progression speeds of these breakdown processes are 106– 107m s−1. The average PSD, of the VHF emission of the CPT events are 1.8–11.6 or 2.4–12.0 dB greater than that of the step leader or dart leader in the same negative cloud-to-ground lightning, respectively. The mean values and standard deviations of the pulse separations in these chaotic pulse trains are 5.3–9.0 and 2.7–4.9 μs, respectively (Fig. 5). (Liu Hengyi)
1.6 Non-“tip-to-tip” connection phenomenon in a tall-object lightning fash
In the Guangzhou tall-object lightning observation experiment, a downward cloud-to-ground lightning flash that struck the 440-m high Guangzhou International Finance Center was captured by two high-speed video cameras that were operated at sampling rates of approximately 104frames per second (fps). In this fash, the following was observed. The effect of the downward leader on the upward connecting leader (UCL) is signifcant, especially during the fnal 160 µs preceding the beginning of the return stroke, during which the UCL’s speed quickly increases from 105to 106m s-1, while the UCL’s luminosity also exhibits a rapid increase. Meanwhile, the effect of UCL on the downward leader appears to be negligible until the distance between the leaders decreases to less than approximately 60 m, after which the downward leader bends sharply toward UCL, and both the speed and the luminosity of the downward leader show a noticeable increase. The ratio of the downward leader’s speed to the UCL’s speed exhibits an overall decreasing trend and can be signifcantly less than 1, meaning that the UCL’s speed can signifcantly exceed that of the downward leader. To the best of our knowledge, this possibility has never been considered in previous leader models. The high-speed video camera records, with a sampling rate of 5×10⁴fps, show that the attachment process exhibited unexpected behavior in that the downward leader tip connected to the lateral surface of UCL below its tip. This is the frst time that non-“tip-to-tip” connection during the attachment process has been presented. The results of the analysis of this fash have been published in Geophysical Research Letters. The paper attracted wide attention and was selected as the American Geophysical Union Journal Highlight in December 2013 (Fig. 6). (Lü Weitao)
2 Characteristics of precipitation and lightning activity in a typhoon
Combining lightning data, storm intensity and track data, Doppler radar, and Tropical Rainfall Measuring Mission (TRMM) satellite data, we were able to analyze the temporal and spatial characteristics of lightning activity in Typhoon Molave (0906) around its landfall. Parameters retrieved from the radar and the TRMMsatellite were utilized to compare the precipitation structures of the inner and outer rainbands and to discuss the possible causes of the differing characteristics of lightning activity; some signifcant results were obtained.
Stronger lightning activity occurred mostly in the outer rainbands rather than in the eyewall and inner rainbands during the landfall of Typhoon Molave. Lightning showed a significant spatial asymmetry and occurred mainly on the left side of the typhoon, relative to its direction of motion. When approaching the land, the storm gradually weakened, but strong lightning activity was still observed. After making landfall, the lightning density rapidly decreased. CG lightning weakened rapidly after the typhoon landed, but the proportion of positive lightning increased, especially during the typhoon’s dissipation. Eyewall lightning outbreaks occurred before the storm reached its strongest intensity (Fig. 7), and such outbreaks in eyewall lightning may indicate a deepening of the cyclone.
The characteristics of lightning activity are determined by convective structures and precipitation features in different regions of the typhoon. Strong lightning activity in the outer rainbands is due to strong updrafts, large concentrations of precipitable particles, and large ice particles in the mixed-phase region, as well as the higher and broader convective clouds.
While it was over water, Typhoon Molave exhibited a complete structure consisting of the eye, and inner and outer rainbands, but during this period the precipitation rate and lightning fash rate were low. After the landfall of the outer rainbands, convective cores occurred in the outer rainbands, and heavy rainfall and stronger lightning activity were observed (Fig.8). At this time, signifcantly higher ice particle density was also observed in the outer rainbands, which, together with strengthened convection resulting from favorable local surface conditions, may have caused the enhanced lightning in the outer rainbands during landfall (Fig.7 and Fig.8). (Zhang Wenjuan)
3 Research relating to lightning operational work
3.1 Operation, improvement, and promotion of Lightning Nowcasting and Warning System (LNWS)
The nowcasting and warning algorithm of LNWS was optimized, and the system was also improved in the following ways∶ (1) The lightning nowcasting and warning results for key areas and the moving trend forecasting results can now be presented in text form. (2) Data retention and data deletion functions were added. (3) The history playback module was appended. When the module is activated, the system will stop the real-time module and start the history playback module from the time that user inputs for event evaluation.
Further, we undertook the work of textbook compilation and delivering lessons as part of the training course for lightning nowcasting and warning. (Yao Wen)
3.2 Improvement of the National Lightning Disaster Database
The National Lightning Disaster Database was improved in the following ways∶ (1) A database of great lightning disasters was constructed. The information input into the database includes text reports, lightning disaster type, and disaster images. (2) The lightning disaster information was classifed considerately. (3) A graphical output function module was added. (4) Batch importation of lightning disaster data (XML formation) was realized. (Wang Fei, Yao Wen)
猜你喜欢
环球时报(2022-09-07)2022-09-07
中老年保健(2021年5期)2021-08-24
小读者(2020年4期)2020-06-16
当代陕西(2019年19期)2019-11-23
智族GQ(2019年9期)2019-10-28
小学生学习指导(低年级)(2019年5期)2019-04-29
英美文学研究论丛(2018年1期)2018-08-16
中国市场(2016年45期)2016-05-17
小火炬·阅读作文(2012年24期)2013-03-18
燃气涡轮试验与研究(2011年1期)2011-04-16