生态与农业气象研究进展
2013-07-05 16:44
中国气象科学研究院年报 2013年0期
生态环境与农业气象
Ecological Environment and Agrometeorology
生态与农业气象研究进展
2013年,生态环境与农业气象研究所在生态与农业气象理论及应用、农业气象防灾减灾、农业应对气候变化3个方向开展了系列研究,并取得了显著进展,部分成果得到了推广应用。
1 生态与农业气象理论及应用
1.1 包含光抑制过程的作物生长模式的建立与验证
在近期国内外对光合作用过程中的气孔导度、光合、蒸腾、光抑制、能量平衡等子过程研究的基础上,对描述上述子过程的方程进行联立求解,得到能反映光抑制过程的叶片光合模式,用Gaussian 3点积分法将叶片尺度光合模式升尺度到冠层尺度,在此基础上建立了包含光抑制功能的作物生长模型,并用冬小麦田间生理生态观测和干物质积累动态观测试验资料对模型进行了验证和评价(图1)。(邬定荣)
1.2 东北地区玉米和水稻农田生态系统水分利用效率的控制机制
生态系统水分利用效率(WUE)是联系水和碳循环的重要指标。可能对WUE产生影响的因子总体可以归纳为气象因子、土壤水分可利用性和生物因子3类。本研究的玉米和水稻农田生态系统WUE都与饱和水汽压差(VPD)呈显著线性负相关,这与过去多数研究结果一致。但同时发现WUE与相对湿度(RH)呈显著正相关,且相对湿度对WUE的解释率比水汽压差高,能更好地描述各生态系统水分对气孔导度的限制作用。水稻生态系统WUE随相对湿度呈指数增加,而在玉米生态系统中更倾向于线性增加。相比较,相对湿度对水稻生态系统WUE影响较大,而玉米生态系统WUE更多受土壤水分(SWC)的影响。WUE对晴空指数的响应分析表明,二者呈显著负相关,即散射辐射对WUE有促进作用。各生态系统WUE与叶面指数(LAI)均呈显著线性正相关,且多年数据统计结果表明,二者无显著年际差异。(周莉)
1.3 基于遥感-作物生长模型的华北夏玉米生长定量评价技术
开展了基于约束性分析的WOFOST模型与遥感数据同化方法研究,建立了华北区域遥感-玉米生长模型。根据模型模拟当年生物量及其与多年平均的比较确定了作物苗情和长势评价指标,结合实时气象数据可以动态评价玉米苗情和长势变化。该研究的创新点在于在数据模型同化过程中定义了约束性,它体现了观测数据对模型参数或变量初值的制约能力,只有优化可被观测数据约束的参数或变量初值才能有效提高模型的模拟效果。同时制定了以约束性为核心的待优化参数逐步筛选方法:首先利用Price算法开展模型参数的敏感性分析,然后进行敏感参数的约束性分析,最后进行可约束参数的组合优化分析,从而逐步筛选出少而精的待优化参数,使数据模型同化效果达到最好。另外,本研究对玉米长势的评价结果不仅体现时间上的变化(长势),也反映空间上的差异(苗情)。(马玉平)
2 农业气象防灾减灾
2.1 重大农业气象灾害立体监测与动态评估技术研究
针对西南地区农业干旱、南方双季稻低温冷害和黄淮海小麦干热风灾害的研究,取得了以下几个方面的成果:(1)系统分析了近3年试验数据和历史灾情资料,结合灾害对作物的影响,细化并完善了灾害的时空分布图。(2)分别建立了以气象、遥感以及作物模型为主的灾害监测指标和方法,并进行了验证。对于冬小麦干热风,简化了灾害气象监测指标并进行了初步验证,开展了干热风灾害遥感监测方法研究。水稻低温冷害方面,对于单点监测,从水稻播种出苗到抽穗开花直至成熟,建立了监测延迟型和障碍型冷害的多类指标,采用水稻低温冷害气象监测指标对典型冷害年进行了监测验证。对于区域监测,将水稻延迟型冷害气象监测指标与区域遥感结合起来,建立了生育期延迟的遥感监测指标,并完成了区域验证;将水稻障碍型冷害气象监测指标与作物模型ORZYA2000结合,建立了水稻空秕率模拟监测指标。(3)对水稻作物模型ORYZA2000进行了改进。(4)对于西南干旱,将分别建立的气象、遥感以及作物模型为主的灾害监测指标进行综合,针对不同时段和区域分别赋予不同的权重,形成了干旱的综合监测指标,在2013年的业务服务中得到了应用。(赵艳霞)
2.2 重大农业气象灾害预测预警关键技术研究
利用2个冬小麦品种开展了池栽试验,对其各自农艺性状、生育过程、干物质积累分配、光合参数、气孔导度等进行了较为全面的系统测定,为所研制的作物干旱模型提供了可靠参数;在调整模型参数基础上,将土壤水分微波遥感反演信息(AMSR-E)嵌入作物模型中,分别采用链接遥感技术和不链接遥感技术2种方式模拟冬小麦生长发育及其农业干旱过程,与大田实际情况进行了对比分析,实现了遥感信息与作物模型的有机结合模拟技术(图2)。进一步完善了华北地区农业干旱气象等级指标,开展了干旱规律分析,建立了农业干旱中长期预测模型。初步构建了广西、广东、湖南3省区双季稻低温灾害预测预警等级指标,验证了等级指标临界阈值与灾害发生临界温度的吻合性;对南方双季稻低温灾害进行了风险区划,揭示了双季稻低温灾害发生发展的时空分布特征,编制了双季稻低温灾害发生次数及累计天数的风险区划图。开展了南方双季稻低温灾害预测预警指示信号研究,初步筛选出南方不同地区寒露风扰动信号、低温阴雨天气形势。研究揭示出重度低温阴雨灾害主要出现在厄尔尼诺结束与拉尼娜开始、拉尼娜结束与厄尔尼诺开始年之间的转换期,发生频率分别为1/2和1/3;开展了南方双季稻低温灾害预测预警技术方法研究,初步构建了旬、月、年尺度的省级双季稻低温灾害预测预警模型,试用预测准确率在82%以上(图2)。(刘建栋)
2.3 重大农业气象灾害风险评价与管理关键技术研究
利用华北地区48个农气站近30年(1981—2010年)冬小麦发育期观测资料和近50年(1961—2010年)气象资料和产量资料,将冬小麦全生育期划分为前期(播种期-起身期)、中期(拔节期-开花期)和后期(灌浆期-成熟期)3个阶段,在考虑底墒期降水的基础上,探索了干旱对冬小麦产量形成的影响。通过构建干旱指数,分析了不同发育阶段干旱的时空分布规律。根据典型灾害年份的减产率数据将不同发育阶段干旱灾害造成的灾损情况进行量化,以权重系数的形式反映不同发育阶段发生干旱对于华北地区冬小麦干旱危险性的贡献大小。最后利用GIS技术绘制了华北地区干旱危险性区划图。结果表明:(1)华北地区冬小麦各发育阶段均受干旱威胁,其中中期水分亏缺最为严重。(2)冬小麦平均干旱指数空间分布在前期和后期由东南向西北递增,在中期由南向北递增。(3)华北地区冬小麦前期危险性权重系数由南向北逐渐增大,而中期危险性权重系数由北向南逐渐增大。特别是北京、天津、河北等地前期危险性权重大于中期危险性权重,需要防范前期干旱。(王春乙,刘玲)
2.4 洪涝灾害监测预警、防控与应急关键技术研究与应用
采用南方16个省(市、区)276个站点1961—2010年的逐日降水量、分省洪涝受灾面积和农作物耕地面积资料以及历史洪涝灾情资料,基于逐年逐站小涝、中涝、大涝的发生次数构建洪涝指数,依据分省相对受灾率与平均洪涝指数大小可比性原则,构建了南方分省基于降水量的洪涝灾害等级指标。在此基础上,编制了南方地区平均洪涝发生指数、等级洪涝平均发生次数分布图。揭示了长江中下游地区暴雨洪涝灾害空间分布特征,编制了100、50和10年一遇暴雨、连续降水400和600 mm的影响面积与平均淹没深度分布图。如“百年一遇”暴雨可能导致河流、湖泊、水库和沼泽地的水面平均升高4.0 m,重度和中度影响面积6.5×10⁴km2,平均淹没深度0.5~1.0 m;连续降雨量>600 mm,可能导致水面平均升高11.0 m,重度和中度影响面积9.7×10⁴km2,可能淹没深度1.0~2.0 m。(霍治国)
2.5 农作物病虫害发生气象条件监测、预警和评价技术
利用小麦白粉病田间病情指数、稻飞虱田间百丛虫量,以及植保部门制定的田间发生程度分级标准,采用因子膨化方法筛选气象影响因子,基于Bayes准则的等级指标模型和Fuzzy模糊模型、基于Fuzzy模糊的广义回归神经网络模型构建技术,构建了豫西南地区小麦白粉病发生等级逐周、河北地区小麦白粉病发生等级逐候、桂林地区稻飞虱发生等级逐候预警预报模型,3种模型的预报准确率均在80%以上。研发了小麦白粉病病菌孢子自动识别智能系统软件,可实现对病菌孢子发生消长的连续动态监测。系统软件实现了对田间实时捕捉的病菌孢子的自动识别与自动计数,与专家人工识别对比,正负误差1个孢子的自动识别率平均达85.6%。(霍治国)
2.6 北方冬小麦精细化土壤墒情和灌溉预报技术研究
通过对比观测分析了导致人工和自动土壤湿度观测差异的原因,大多数土壤层次的自动与人工测定值一致性较好,少数土壤层次存在差异,其中大多数可以通过建立标定曲线解决。在此基础上,结合神经网络、最优化等方法探索了精细化土壤水分预报初始场的获取技术;通过分析3个站的冬小麦根系分布观测资料,初步构建了各发育期不同土层的作物系数。从2个站获取的试验资料,为确定冬小麦水分胁迫指标以及模型的关键参数提供了依据。结合农田观测试验,初步构建了冬小麦农田水量平衡简化模型和冬小麦精细化逐日多层土壤墒情和灌溉预报模型。(毛飞)
2.7 淮河流域夏玉米旱涝损失精细化评估技术
利用淮河流域多地田间试验数据,揭示了土壤水分对夏玉米发育进程、光合作用、干物质分配及叶片扩展的定量影响,由此建立土壤水分影响玉米生长发育子模式,以改进现有的作物生长模型。利用作物生长模型开展敏感性分析,确定夏玉米旱涝敏感时段,建立旱涝评价指标体系,并开展了逐年旱涝定量评价。结果表明,淮河流域夏玉米干旱呈逐年减轻而涝渍呈逐年加重趋势。该研究以其高空间分辨率、评估过程的逐日时间动态,以及评估指标的分发育阶段细化等,实现了淮河流域夏玉米旱涝损失的精细化评估。另外,通过作物生长模型模拟并结合田间试验数据分析确定了作物生长对旱涝的敏感时段和强度,这在方法和结论上都有一定的创新。(马玉平)
3 农业应对气候变化
3.1 气候变化对中国农业生产的影响评价
发展了气候变化背景下农作物种植分布的气候适宜性评价方法。该方法针对现有作物种植分布影响因子的选取及其对种植分布划分综合影响考虑的不足,从气候的相似性出发,采用最大熵方法,确定了全国范围和年尺度上影响作物种植分布的主导气候因子,给出了作物种植分布的气候适宜性分区,以及探讨了作物种植分布的时空格局变化及其气候驱动因素。阐明了我国主要作物种植区农业气候资源变化及其对产量的影响。近50年,小麦除西北麦区气候呈暖湿化外,主要气候呈暖干化;玉米除西北玉米产区气候呈暖湿化外,主要气候呈暖干化;东北和西南单季稻区气候呈暖干化,其他单季稻产区气候均呈暖湿化;除西南双季稻产区气候呈暖干化外,主要双季稻产区气候变暖,降水量变化存在空间差异。作物生育期内平均气温升高使全国冬小麦、玉米、单季稻和双季稻的平均单产分别减少5.8%、减少3.4%、增加11.0%和减少1.9%,平均降水量变化使全国冬小麦和单季稻的平均单产分别增加1.6%和6.2%,而对玉米和双季稻的平均单产影响不明显。(周广胜)
3.2 气候变化背景下农业气候资源的有效性评估
结合东北地区春玉米生长发育及产量形成对农业气候资源的需求,应用农业气候适宜度理论,以春玉米农业气候资源适宜指数、效能指数和资源利用指数为指标,评价了气候变化下东北地区春玉米生育期内气候资源的配置及利用情况。气候变化使东北3省春玉米生育期内农业气候资源适宜指数、效能指数和资源利用指数在时间演变和空间分布上都发生了显著变化,其中辽宁省3个指数均呈下降趋势,资源利用指数下降尤其显著;吉林省和黑龙江省农业气候资源适宜指数略有增加,效能指数变化不显著,而资源利用指数略有下降;空间分布上3个指数的高值区随气候变暖都有向东北方向移动的趋势。玉米品种布局调整和抗逆新品种的应用对提高玉米气候资源的利用率有重要作用。(郭建平)
3.3 全球变化影响下我国主要陆地生态系统的脆弱性与适应性研究
华北平原不同分区冬小麦播种期与不同的界限温度关系密切,即华北平原北部区与≥16 ℃终日、中部区与≥15 ℃终日、南部区与≥14 ℃终日相关性较好;冬小麦停止生长期和返青期分别与≥0 ℃终日与≥2 ℃初日显著相关。在华北平原冬小麦返青前热量条件随时间变化方面,冬小麦停止生长期和返青期表现出相反的趋势,随着时间的推移分别呈现出逐渐推迟和提前的趋势,而冬小麦越冬期长度和越冬期负积温则逐渐缩短和减少;无论是偏冷年型还是偏暖年型,试验区夜间增温2~2.5 ℃并未导致冬小麦的产量下降,而偏冷年较偏暖年的增温可更显著地提高冬小麦产量。偏冷年的增温将促进小麦的分蘖,有效穗数显著增加,籽粒产量大幅度增加; 偏暖年的增温也显著促进冬小麦有效穗数和穗粒数增加,尽管使得千粒重显著降低, 但并未导致产量下降。(王培娟,房世波)
4 农业气象科技成果推广应用
基于“十一五”国家科技支撑计划课题中有关东北玉米低温冷害研究成果,将东北地区进一步细分成11个监测预测区域,利用逐步回归模型、GM(1,1)模型和模糊均生函数分别建立了各个区热量指数的逐月动态预测模型,模型回代和试报准确率在72%~99%之间,平均准确率90%以上。研发了区域级和省级玉米低温冷害动态监测预测业务系统4个,系统结构层次清晰,操作简便,实现了东北玉米低温冷害动态监测预测及服务产品的制作功能,系统已通过专家测试,并进行了软件著作权登记。课题成果分别在国家气象中心和东北3省的玉米低温冷害监测预警业务中进行了推广应用,培训业务服务人员50余人次,近2年来,共制作发布服务产品30余期,取得了良好的社会和经济效益(图3)。(郭建平)
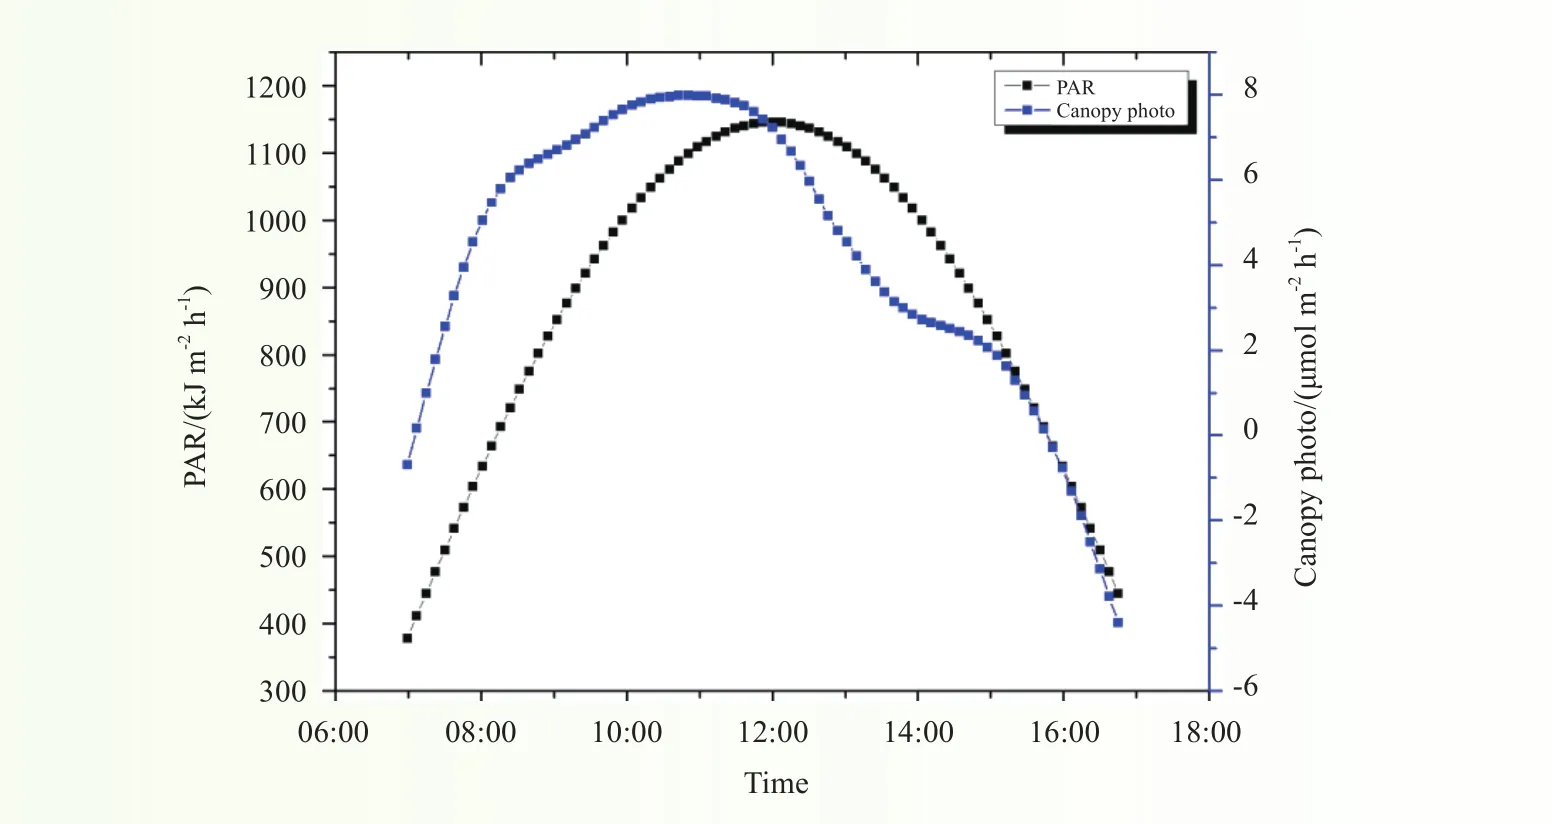
图 1 光抑制模块计算的光合有效辐射(PAR)和冠层光合Fig. 1 PAR and canopy-photosynthesis calculated by photo-inhibition model
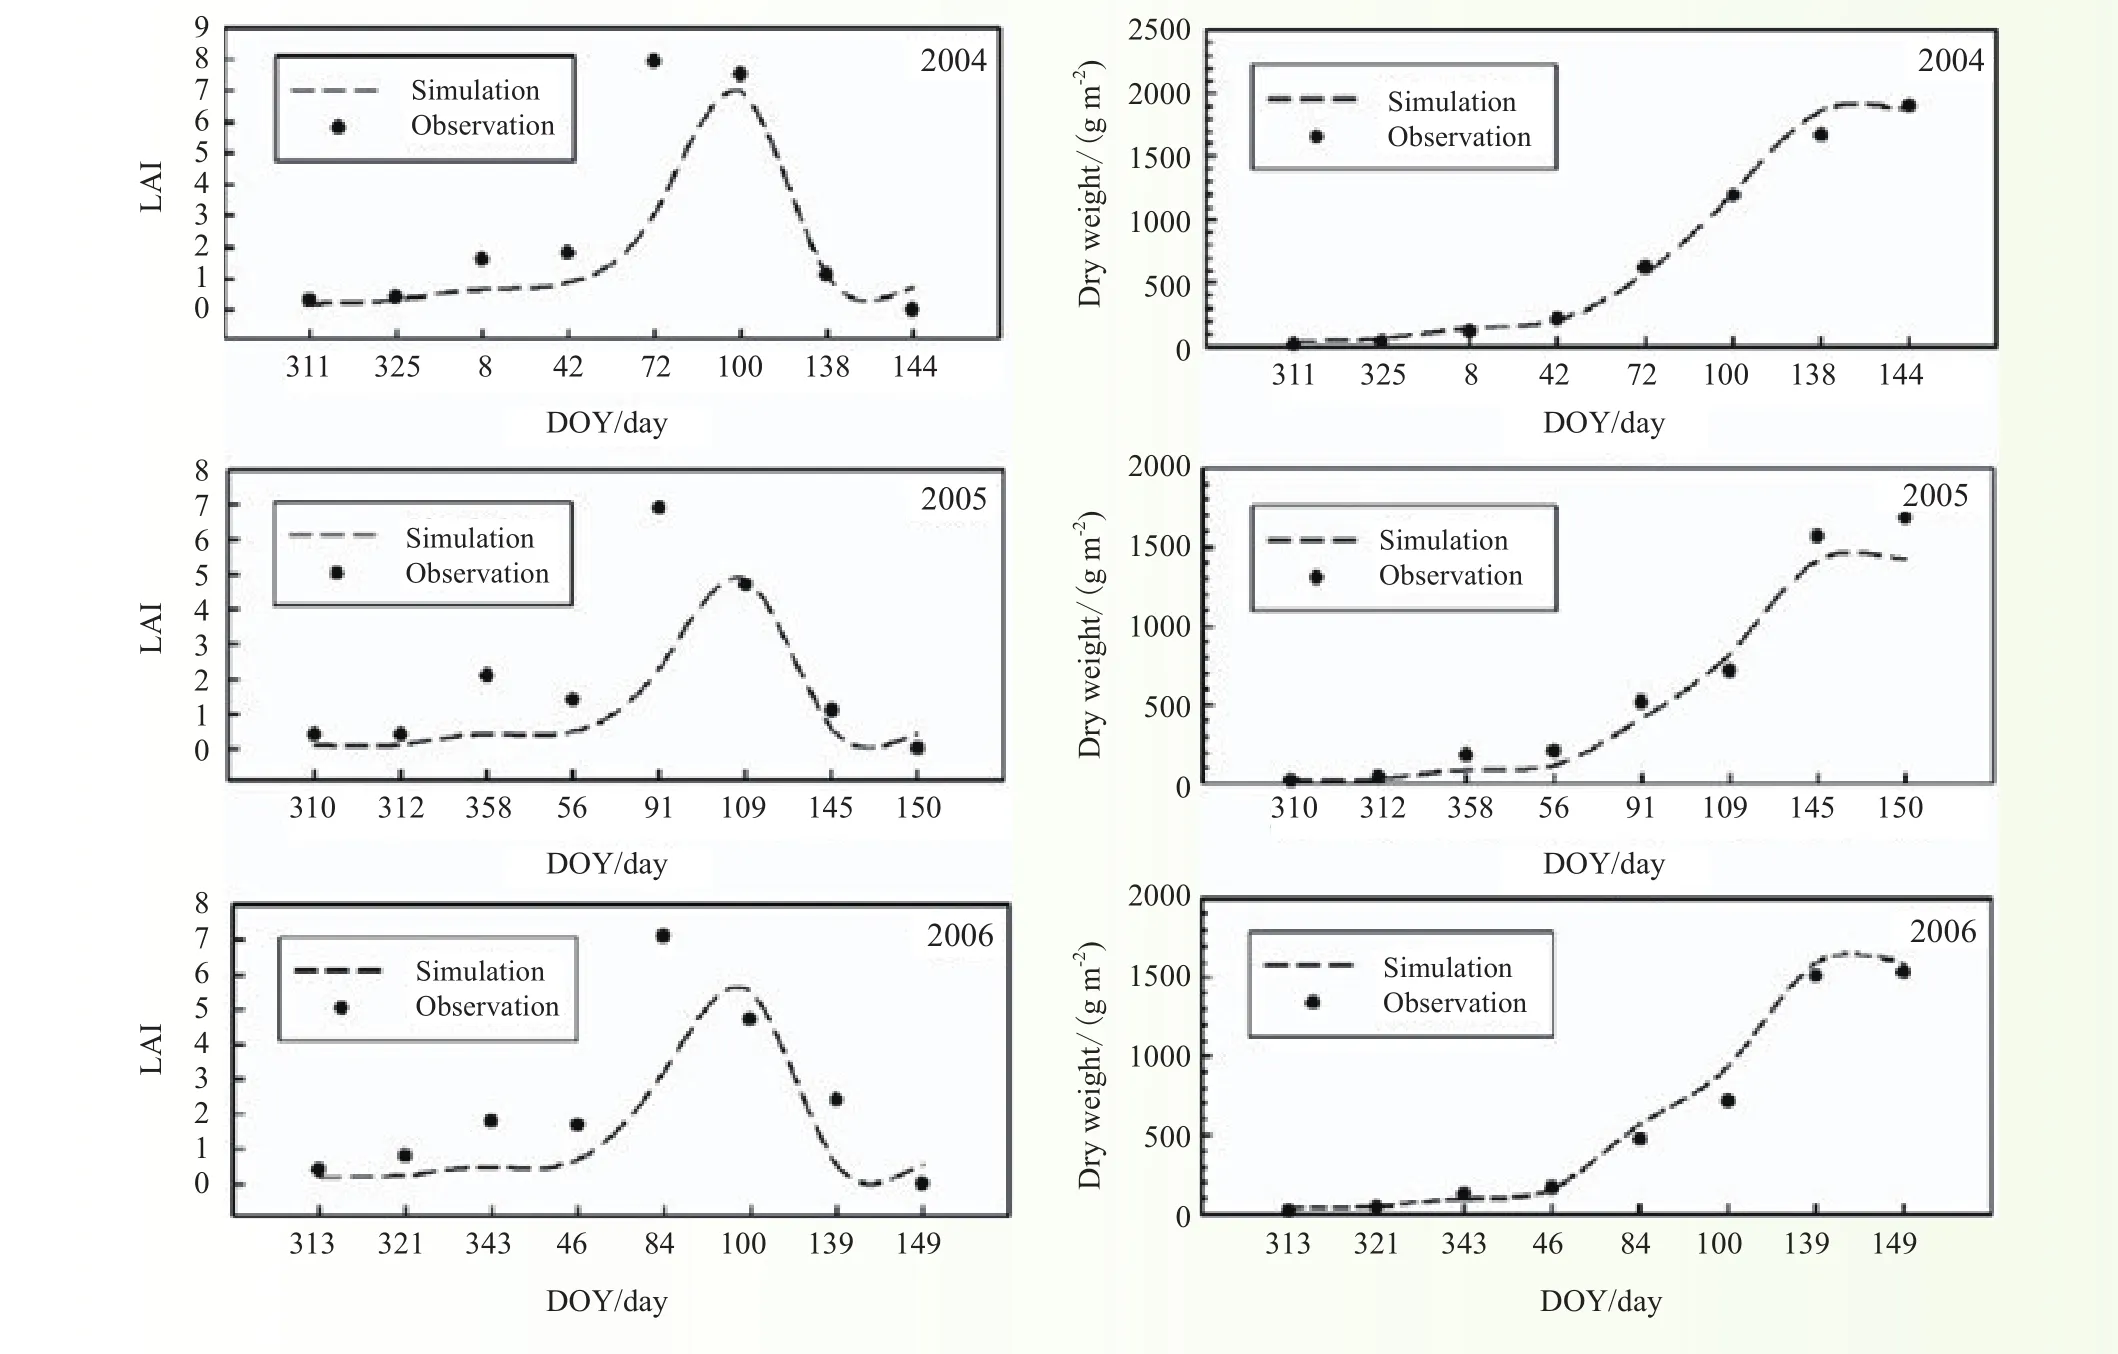
图 2 冬小麦叶面指数(LAI)和干物重外推模拟值与实测值的比较Fig. 2 Comparation between real and simulation results of winter wheat LAI and dry weight
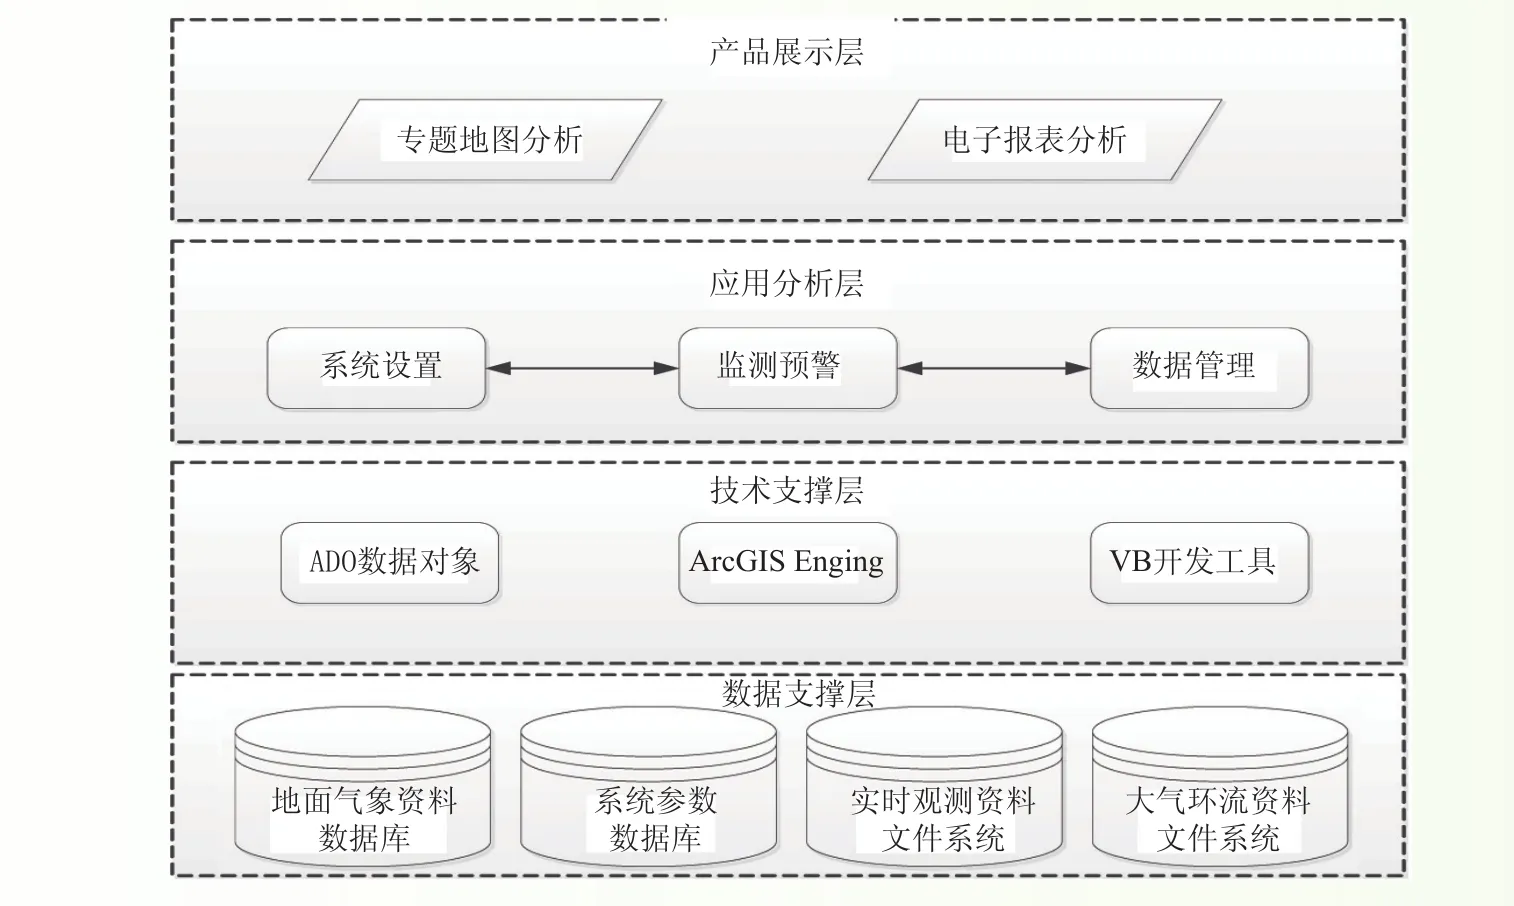
图 3 玉米低温冷害动态监测预警系统(DMSE)总体结构Fig. 3 Framework of dynamic monitoring and forecasting system for corn chilling damage
Progress in Ecology and Agrometeorology Research
1 Ecological and agrometeorological theories and application techniques
1.1 Development and testing of a crop growth simulation model with photo-inhibition procedure
For the development of crop growth, simulation model equations were initially established and solved for subprocedures of photosynthesis, including stomatal conductance, photosynthesis, transpiration, photoinhibition, and energy balance, based on the most current research in these areas. A photosynthesis model at the leaf level was established that can simulate the photo-inhibition procedure. Through the Gaussian integral method, the scale of the model was extended from leaf to canopy. Based on the canopy photosynthesis model, a crop growth simulation model could then be developed, validated, and evaluated using the observation data of winter wheat physiology and the dynamics of dry matter accumulation (Fig. 1). (Wu Dingrong)
1.2 Regulation of water use effciency for maize and rice paddy ecosystems in Northeast China
Water use efficiency (WUE), defined as carbon gain per unit of water loss, is a key parameter for analyzing the interactions between the carbon and water cycles at an ecosystem level. Factors affecting WUE can be classifed into three types∶ meteorological factors, soil water availability, and biological factors. Results from a maize site in Jinzhou and a rice paddy site in Panjin both indicate that vapor pressure defcit (VPD) has a negative effect on WUE, whereas relative humidity (RH) has a positive effect. However, relative to VPD, RH explains more variation in WUE as a controlling factor of stomatal conductance; WUE exponentially increases with increasing RH at the rice paddy site, whereas it linearly increases at the maize site. RH is, therefore, the controlling factor of WUE at the rice paddy site, whereas soil water availability is the most important determinant of WUE at the maize site. Diffuse radiation and LAI are observed to have a positive effect on WUE at both sites. (Zhou Li)
1.3 Quantitative evaluation technology for summer maize growth in North China
A remote sensing-crop growth model was established based on assimilation of data and WOFOST, employing a constraint analysis method. The summer maize growth index was frst determined using simulated biomass and its variation to that of the yearly average determined. Maize growth was then dynamically evaluated with a model driven by real-time weather data. The innovation in the study is the definition of parameter constraint in the data and model assimilation process, which reflects the constraint ability of observation data on model parameters or initial variable values. The simulated ability of the model was improved only when the parameter that can be constrained by observed data was optimized. At the same time, a stepwise selection method of the optimized parameters was performed based on constraint analysis. The sensitivity analysis of model parameters was frst conducted using the Price algorithm. The constraint of the sensitive parameter was then analyzed and the optimized parameters were determined through combinatorial optimization analyses of the fnal constraint parameters. Furthermore, the product of the maize growth evaluation in the study not only refects the change with time but also determines the differences in space. (Ma Yuping)
2 Agrometeorological disaster prevention and mitigation
2.1 Study on integrated monitoring and dynamic assessment for major agrometeorological disasters
With regard to agricultural drought in Southwest China, the cool injury to double-cropping rice insouthern China, and dry and hot wind damage to wheat in the Huang-Huai-Hai Region, the following has been achieved. (1) A distribution map of hazardous periods and regions has been detailed and perfected on the basis of systematic analysis of experimental data during the past three years and historical data, with reference to the infuence of these hazards on crops. (2) Monitoring indicators and approaches for agrometeorological hazards, in terms of meteorology, remote sensing, and crop modeling, have been established and preliminarily verifed. Initially, the study simplifed and preliminarily verifed monitoring indicators for the dry and hot wind hazard. We further conducted research on the monitoring of dry and hot wind using a remote sensing approach. With regard to cool injury, for a single-site monitoring, indicators to detect delaying- and disordering-type cool injury were set up throughout the entire growing process, from sowing, germinating, earing, and blossoming to ripening. In regional cool injury monitoring, by combining meteorological monitoring indicators with regional remote sensing data, a type of remote sensing monitoring indicator was established and verifed for the region. Moreover, a simulative monitoring indicator based on the blighted grain rate was established by combining the disordering type meteorological monitoring indicator with the ORYZA2000 crop model. (3) The rice model ORYZA2000 was improved. (4) With regard to the drought in Southwest China, hazard monitoring indicators in terms of meteorology, remote sensing, and crop modeling were synthesized to distribute various weights to different periods and regions. In this way, a comprehensive monitoring indicator was formed and applied in 2013. (Zhao Yanxia)
2.2 Study of forecasting and warning for major agrometeorological disasters
Reliable parameters for the crop drought simulation model were attained from a pool-culture experiment in Shandong Agricultural University, during which ecological parameters of two winter wheat varieties, including agronomic characteristics, growth process, accumulation and allocation of dry matter, photosynthesis, and stomatal conductivity amongst others, were measured systematically. Simultaneously, a combination of the crop growth model and remote sensing information was achieved by comparative analysis of simulation results of coupled and offine models, with the adjusted parameters obtained from the feld experiments. Furthermore, the long- and medium-term agro-drought prediction model was successfully established, which was based on the further improvement of the classifcation index and analysis of the agro-drought principle in the North China Plain (Fig. 2). Anastomosis of the level indicator critical threshold and the critical disaster temperature was verifed on the basis of level indicators for low temperature hazard warning of double rice established in the three provinces of Guangxi, Guangdong, and Hunan. Risk division was conducted for a low temperature disaster of double rice in the south to determine the spatial and temporal distribution of the rice development and establish risk division maps for the occurrence and cumulative days of the low temperature disaster. Both cold dew wind and cold and rainy weather were preliminary selected as disturbance signals in different areas in the south on the basis of research predicting signals of low temperature disaster. The research revealed that severe cold rainy disaster occurred mainly in the transition period when El Niño ended and the La Niña began, or vice versa, with the frequencies of occurrence being 1/2 and 1/3, respectively. Provincial low temperature disaster forecasting and warning models for double rice on a scale of ten days, month, and year were initially built using the technique studies, with the accuracy rate of prediction above 82% (Fig. 2). (Liu Jiandong)
2.3 Study of risk assessment and management for major agrometeorological disasters
The North China Plain is China’s leading district for winter wheat production, and it is also the area that is most severely affected by drought. On the basis of the growth and development characteristics of winter wheat, the whole growing period is divided into three stages∶ the early stage from sowing to standing; the medium stage from jointing to fowering; and the late stage from flling to maturity. In addition to the weather conditions in the three stages, the precipitation in the period before sowing is also considered in the impact analysis of periodical drought on winter wheat in North China. To explore the spatial and temporal distribution of periodical drought hazard, meteorological data from 1961 to 2010 and winter wheat developmental stagedata from 48 agrometeorological observatories are employed to construct the drought index. The degree of damage at each developmental stage is quantifed by applying the yield reduction rate data in typical drought years, with its contribution to the damage as a whole shown in the form of risk weight. The research presents a map for drought hazard to wheat production in North China based on geographical information system (GIS). The results show the following∶ (1) Water defciency exists at each developmental stage of winter wheat in North China, with the medium stage suffering the most. (2) The drought index of winter wheat at early and late stages increases gradually from the southeast to northwest in North China; at the medium stage it increases from the south to north. (3) The risk weight at the early stage increases from the south to north in North China. On the contrary, risk weight at the medium stage decreases from the south to north. In some regions like Beijing, Tianjin, and most parts of Hebei Province, the risk weight at the early stage is higher than that at the medium stage. According to the weights of different stages, defensive measures can be considered to mitigate yield reduction for particular regions. (Wang Chunyi, Liu Ling)
2.4 Key technologies of observing, early warning, and preventing fooding and waterlog hazards
Based on the flood index from the times of slight, medium, and heavy floods in every station and on the comparable principle between a province’s disaster rate and average values of flood index, the daily precipitation from 276 meteorological stations in 16 provinces of southern China, the food areas and cultivated crop areas in the province as a unit, and the historical food disaster data were used to establish the provincial food disaster grade index. On this basis, the average food occurrence index in regions of southern China was formatted and the distribution maps of average food times for different grades were constructed. Furthermore, we investigated the spatial characteristics of food disasters caused by heavy rainfall in the middle and lower reaches of the Yangtze River, and delineated the affected area and the potential average submerged depth according to the frequency of 100-year, 50-year, and 10-year heavy rainfall events and continuous rainfalls with a total precipitation more than 400 and 600 mm. The results show that the 100-year heavy rainfall event may on average raise water levels of rivers, lakes or low-level bogs by 4.0 m. The severe and medium affected areas may reach 6.5 × 10⁴km2and the average submerged depth 0.5 to 1.0 m. Additionally, the heavy rainfall of continuous total precipitation of more than 600 mm was predicted to elevate water levels by 11.0 m, with severe and medium affected areas reaching 9.7 × 10⁴km2and an average submerged depth of 1.0 to 2.0 m. (Huo Zhiguo)
2.5 Meteorological condition monitoring, early warning, and assessment technology of crop diseases and pests
An early warning and forecasting model of the weekly levels of wheat powdery mildew in southwest of Henan, wheat powdery mildew in Hebei (by pentad), and rice planthoppers in Guilin (by pentad), was built using wheat powdery mildew disease index in field, the number of rice planthoppers per hundred clumps, and the occurrence degree standard constructed by the plant protection department. The puffng method was chosen for selected meteorological factors, with the models established on the basis of Bayes’ rules, the Fuzzy model and a general regression neural network based on the Fuzzy model. The predicted accuracy of the three models was greater than 80%. An intelligent automatic identification system software for wheat powdery mildew spores has been developed, which can realize continuous dynamic monitoring of the pathogen spores. Furthermore, the system software was implemented in the field to conduct real-time capture of the fungus spores and automatic identifcation and counting, which was compared with expert artifcial recognition; the automatic recognition rate with an average error of ±1 spore was 85.6% . (Huo Zhiguo)
2.6 Research on soil moisture and irrigation forecasting technology of winter wheat in North China
The causes behind differences in manual and automatic soil moisture observations were analyzed by contrast test. The results showed that the soil moisture values by both methods had good uniformity for most parts with differences in a few soil layers, and most of which can be controlled by establishing a calibration curve. On this basis, the technologies for refning the initial feld soil moisture prediction were explored usinga neural network, method optimization, and so on. Through analyzing observation data of the winter wheat root distribution in three test stations, the crop coeffcients in different soil layers of each growth stage were established. Test data obtained from two test stations provided support for establishing a winter wheat water stress index and the key parameters of the model, and were used to build the winter wheat fne daily multilayer soil moisture and irrigation forecast model. The simplifed model of water balance and the daily multilayer soil moisture and irrigation forecast for winter wheat was established on the basis of feld observation experiments. (Mao Fei)
2.7 Fine assessment techniques for maize loss from droughts and waterlogging in the Huaihe River Basin
The quantitative impacts of soil moisture on the summer maize development process, photosynthesis, dry matter partitioning, and leaf expansion were revealed using the feld trial data in the Huaihe River basin. A submodel for maize growth and development affected by soil moisture was established to improve the crop growth model. The periods of summer maize growth sensitive to drought and waterlogging were determined on the basis of the crop growth models. The drought and waterlogging index system for maize was established and maize growth status was quantitatively assessed on a yearly basis. The result showed that the drought was gradually reduced; however, the waterlogging increased for summer maize in the Huaihe River basin. In the study, fne assessment of loss from droughts and waterlogging for maize in the Huaihe River basin was achieved on the basis of high spatial resolution, the daily time dynamic evaluation, and varied indicators in different developmental stages. Furthermore, using these innovative methods the sensitive periods and strength of crop growth to drought and waterlogging were determined by combining the results simulated by crop growth model and feld trial data. (Ma Yuping)
3 Response of agriculture to climate change
3.1 Evaluating the effects of climate change on agricultural production in China
This research consists of two parts∶ the development of an evaluation method for the climate suitability of grain crop cultivation distribution and the evaluation of agroclimatic resources in main grain crop producing areas and their effects on crop yield. The evaluation method to determine the climate suitability of grain crop cultivation distribution differed from the traditional method in both the selection of climate factors affecting grain crop cultivation distribution and determination of the grain crop cultivation boundary. A combination of climatic similarity and MaxEnt model was used. The main climatic factors affecting grain crop cultivation distribution in China were determined on national and yearly scales based on this method, and the divisions of climatic suitability for grain crop cultivation distribution were given. Moreover, the temporal and spatial dynamics of grain crop cultivation distribution in China and their driving factors were discussed.
The agroclimatic resources in main grain crop producing areas in China and their effects on crop yield were evaluated during 1961–2010. Most winter wheat and maize cultivation areas showed a warming and drying climate, except in the northwest wheat and maize cultivation areas with warming and wetter climate. The northeast and southwest parts of a single-cropping paddy rice producing area exhibited warming and drying climate, whereas the others exhibited warming and wetter climate. In the double-cropping paddy rice producing areas, climate was warming and the precipitation showed great spatial variation. During 1961–2010, mean grain yield per unit area in China decreased by approximately 5.8% for winter wheat, 3.4% for maize, 1.9% for double-cropping paddy rice, and increased by 11.0% for single-cropping paddy rice because of the rising temperature during the growing season. The change in mean precipitation resulted in an increase of approximately 1.6% for winter wheat and 6.2% for single-cropping paddy rice. However, its effects on the grain yield per unit area of maize and double-cropping paddy rice were not signifcant. (Zhou Guangsheng)
3.2 Evaluation of agricultural climatic resource utilization under climate change
In this study, the demands on agricultural climatic resources in Northeast China imposed by the cultivation of spring maize were combined and agricultural climatic suitability theory was applied. The average resource suitability index (Isr), average efficacy suitability index (Ise), and average resource utilization index (K) are indicators to evaluate the effects of climate change on climatic resource utilization for spring maize production. The results showed that signifcant temporal and spatial changes occurred in Isr, Ise, and K in Northeast China under climate change. Isr, Ise, and K all exhibited decreasing trends in Liaoning Province, particularly for K. In Jilin and Heilongjiang provinces, Isrincreased slightly; however, Isedid not noticeably change, whereas K decreased slightly. The spatial distributions of the highest values of the three indices shifted toward the northeast with global warming. Warming of the climate in Northeast China is expected to have a negative impact on spring maize production, particularly in Liaoning Province. Spring maize cultivation is likely to shift northward and expand eastward to effciently utilize future agricultural climatic resources. It is important to adjust the layout and apply the new resilience varieties for improving the agricultural climatic resource utilization of maize. (Guo Jianping)
3.3 Study on the vulnerability and adaptation of main land ecosystems under global change
The following close relationships were observed between sowing date of winter wheat in different regions and various critical temperatures, with the end date air temperature of ≥16 °C, ≥15 °C, and ≥14 °C stably in the northern, middle, and southern North China Plain, respectively. Meanwhile, the statistics are signifcant between winter dormancy date and an end date with a stable air temperature of ≥0 °C, and between the green-up date and the frst date with a stable air temperature of ≥2 °C. Temporally, it becomes later for winter dormancy date over the past 50 years; on the contrary, it is earlier for green-up date with climate warming. The days and negative accumulated temperature during winter dormancy have decreased slowly over the past fve decades. Compared with the CK treatment, winter wheat yield did not decline in the higher night temperature (HNT) treatment, which increased by 2.0–2.5 °C in both the warmer year and colder year. Furthermore, winter wheat yield in colder year increased signifcantly in the HNT treatment. HNT treatment in colder year signifcantly promoted tillering and increased the effective panicles, which subsequently increased grain yield signifcantly compared with CK. The HNT treatment in warmer year contributed to a signifcant increase in the effective panicles and kernels. Although it made a signifcant reduction in 1000-grain weight, it did not lead to a yield decline. (Wang Peijuan, Fang Shibo)
4 Promotion and application of agrometeorology technological achievements
Based on the findings related to cold damage, from the “Eleventh Five-Year” National Science and Technology Support Program, Northeast China was further subdivided into 11 regions for monitoring and forecasting. Monthly dynamic prediction models of heat index were established in each area using the stepwise regression model, GM (1,1) model, and fuzzy function. The results showed that the accuracies of established models in replacing and forecasting were between 72% and 99%, and the average accuracies were more than 90%. Four dynamic monitoring and forecasting operation systems for maize cold damage were subsequently developed at regional and provincial scales. The systems had clear hierarchies and were easy to operate, achieving dynamic monitoring and forecasting, and product service function of maize cold damage. Furthermore, the test systems were passed by experts, and the software copyrights were registered. Additionally, the research achievements were promoted, and applied in monitoring and early warning of businesses for maize cold damage in the National Meteorological Center and Northeast China. The trained business staff totaled to more than 50. In the last two years, the released service products were more than 30 issues, achieving good social and economic benefts (Fig. 3). (Guo Jianping)
猜你喜欢
中国农业信息(2022年5期)2023-01-14
真空与低温(2022年6期)2023-01-06
作文周刊·小学一年级版(2022年24期)2022-06-18
农业灾害研究(2022年1期)2022-05-07
军事文摘(2021年16期)2021-11-05
内蒙古气象(2021年2期)2021-07-01
今日农业(2021年4期)2021-06-09
劳动保护(2018年8期)2018-09-12
领导决策信息(2018年46期)2018-04-20
中国资源综合利用(2017年4期)2018-01-22