灾害天气研究进展
2013-07-05 16:44
中国气象科学研究院年报 2013年0期
灾害天气
Severe Weather
灾害天气研究进展
1 灾害天气监测与资料融合
1.1 2013年青藏高原第3次科学试验水分循环观测与研究
完成了“2013年青藏高原第3次科学试验水分循环观测与研究”项目的云降水外场试验观测,形成了数据集。主要创新点包括:在国内首次利用云雷达、微降水雷达和水汽云探测激光雷达在青藏高原和高原东坡实现了云垂直结构的观测;初步形成了多种遥感手段反演云边界、云水/云冰/雨水/雪水的垂直廓线的反演方法,验证了国产新型探测设备在高原工作的能力,为高原水分和能量循环研究提供了数据,也为今后开展青藏高原第3次科学试验做好云降水观测的准备。(崔哲虎)
1.2 双线偏振雷达质量控制及应用算法研究
在国家自然科学基金面上项目“偏振天气雷达探测云的相态与滴谱分布变化及其对降水估测影响研究”的资助下,研发了多种双线偏振雷达数据质量算法,形成了双线偏振雷达反演雨滴谱、相态识别和降水强度估测的方法,利用质量控制后的数据,反演了降水过程中云的相态和滴谱,分析这些变化对雷达探测参量的影响以及间接导致的雷达定量估测降水的精度变化,与地面雨量计对比评估了双线偏振雷达在降水估测中的潜力。主要成果的创新点包括:将小波方法用于双线偏振雷达数据质量控制,利用地面雨滴谱数据,进一步验证了双线偏振雷达数据的质量和质控效果。(胡志群)
1.3 风廓线雷达测风数据的能谱分析研究
基于雷达获取的中高空长序列水平风探测数据,用快速傅立叶算法计算了大气的风能谱、湍流能谱,并对其分布特征进行了分析,得到了寒潮大风、大范围暴雨和强对流天气的湍流能谱;提出一种直接由垂直指向雷达降水回波谱参数估算雨滴谱参数的方法,并与地面激光雨滴谱仪获取的雨滴谱参数进行了比较,二者的平均粒径基本相同。这一工作的创新点包括:拓宽了风廓线雷达的应用范围,特别是将其应用于降水微物理参量反演。(阮征)
1.4 雷达局部灾害天气临近预警技术在河南电网的推广应用
完成了河南省电力公司电力科学研究院的横向课题“雷达局部灾害性天气临近预警技术在电网的推广应用”软件研发,实现了业务运行。主要创新点包括:在国内首次利用新一代天气雷达三维拼图回波强度数据,结合对流云跟踪和外推预报技术,提出了利用对流单体回波特征及其演变参数,进行地面大风和冰雹的分等级识别和0~1 h预警,将新一代天气雷达数据分析技术成功应用于影响电力输送的地面大风、冰雹、局地强降水的预警,提高了电力生产的安全性。(刘黎平,王红艳)
1.5 雷达基数据质量控制算法的业务应用
在中国气象局重点工程项目“新一代天气雷达建设业务软件系统”开发中,灾害天气国家重点实验室研发的地物识别、海浪识别、电磁干扰识别、晴空回波识别和CC雷达径向速度处理方法等质量控制算法,在中国气象局气象探测中心进行了效果检验,已经连接到ROSE软件系统中,并在国内部分雷达站试运行。(刘黎平)
1.6 北大西洋涛动形成的最优前期征兆
北大西洋涛动(NAO)形成的最优前期征兆研究工作的出发点是基于这样一个观测事实:北大西洋涛动事件的生命周期为10天左右。本研究从天气学的观点,探讨了冬季NAO发生的最优前期征兆,指出NAO的最优前期征兆为位于北大西洋急流北侧的斜压波列。随着NAO事件的形成,出现了不同的波破碎现象以及纬向平均西风的南北偏移。此外,还指出了非线性在NAO正负位相形成过程中的不同作用(图1)。(姜智娜)
1.7 2009 年冬季华北初雪对流层低层风场及大气层结特征
对2009年冬季我国华北一次回流初雪天气进行了数值模拟和诊断分析,重点研究了与回流相关的对流层低层风场的动力、热力作用以及大气层结特征。此次初雪是在高空低压槽、低空回流切变线以及地面倒槽锋生的共同影响下产生的,降雪区域随着影响系统向东南方向移动而移动;对降雪起到重要动力作用的偏东风回流主要出现在850 hPa及以下层次,其发展一方面与偏西气流形成低空风场辐合线,有利于气流的上升运动,一方面在地形的共同作用下,形成偏南风;偏南风的形成有利于暖空气向降雪区域输送,而暖平流与强冷空气相遇引起了锋生;偏东风回流除了重要的动力作用外,热力作用也很明显,其对降雪区域的水汽辐合起到了主要作用;在降雪发生时,对流层低层有明显的降温过程,大气边界层温度降到0 ℃以下,850 hPa温度降至-5 ℃左右。该结果表明,冬季关注数值模式模拟的对流层低层温度层结特征,将有助于对降水性质做出更准确的预报。(夏茹娣)
1.8 卫星观测青藏高原大气水汽资料的评估与分析
开展了基于多卫星与探空观测的青藏高原大气水汽资料的整理评估与分析,建立了高原地区探空观测和卫星观测的水汽综合融合数据集,为高原地区的天气气候分析以及资料同化和模式评估等工作提供了基础。首先对2003—2010年探空观测资料进行质量控制,然后利用探空资料评估同时期的AIRS卫星观测资料,提出了AIRS卫星的水汽资料相对探空资料的订正方法。同时,收集整理了NASA水汽项目(NVAP)提供的1988—1999年和2000—2001年整层和分层水汽数据集;评估和整理了欧洲发射的IASI卫星2008—2011年的水汽资料。在此基础上结合AIRS、IASI、NVAP以及探空观测数据,建立了高原地区站点观测和卫星观测的水汽综合数据集,时间跨度可由1988年至2011年。利用订正后的综合水汽数据集,分析了高原地区的水汽时空分布特征,结果表明,高原地区上空500 hPa左右水汽含量相对周边较高,该偏湿层可向上延伸至300 hPa。对流层的分层水汽通量和散度场的结果说明这一偏湿层对高原周边及下游地区的降水有影响。(王东海)
2 灾害天气结构与形成机理
2.1 青藏高原对下游灾害天气的预警与预测理论应用研究
青藏高原对亚洲季风环流的形成起着重要的作用,同时,作为“世界屋脊”,青藏高原拥有丰富的冰川、积雪、河流、湖泊和地下蓄水层。本研究从青藏高原对全球大气水分循环重要作用的视角,提出了青藏高原-世界“水塔”的概念,综述青藏高原-世界“水塔”相关的研究理论成果,描述了与高原密切相关的亚洲区域和跨半球垂直环流圈水分循环结构与海洋—大气—陆地水文过程特殊的相互反馈作用。 通过对东亚地区水汽输送结构的分析,发现了青藏高原-梅雨带的水汽输送“大三角区域”及其源汇;中国青藏高原-黄土高原的西南—东北大地形分布,形成了一种“动力吸引”作用,其与东部梅雨带东南—西北向推进的季节性进程存在密切的联系。专著还阐述了中日合作JICA计划实施的青藏高原及其周边地区的新一代综合观测系统建设,并给出了2008年南方雨雪冰冻灾害和暴雨天气应用研究成果。研究青藏高原关键区新一代综合观测系统数据应用,对提高中国区域高原下游灾害性天气预报预警能力的提升有重要意义(图2)。(徐祥德,陆春谷,施晓晖)
2.2 青藏高原视热源对中国夏季雨带年代际变化的调制作用
由于亚洲夏季风是世界上最大和最显著的季风,其强度变化可能对全球气候和气候系统产生深远的影响,特别是对南亚和东亚的降水型。另一方面,作为占中国国土面积约1/4的一个巨大的高架陆地“平台”,青藏高原形成了一个“嵌入”对流层中部大气的巨大的柱状热源,可以伸展到自由大气,被称为中空“热源柱”。在全球气候变化的背景下,高原大气加热影响如何改变亚洲夏季风和降雨分布的变化呢?值得注意的是高原热源与区域或跨半球水汽流的相关矢量场亦反映了季风水汽输送“大三角扇形”影响域特征。青藏高原1950—2010年春季视热源有3阶段年代际变化特征,此3阶段春季高原视热源与夏季中国区域降水变化趋势特征吻合,两者年代际变化趋势具有显著的一致性,而近10年青藏高原春季视热源出现“降后回升”趋势,相应与前期热源和高原积雪等影响因子相关的中国区域“南涝北旱”的降水格局亦出现了转折。青藏高原春季热源可能对中国夏季降水具有某种程度的调制作用(图3)。(徐祥德,陆春谷,施晓晖等)
2.3 西南涡大气科学试验的观测布局理论与实践
我国是气象灾害十分严重的国家,西南涡是一个非常重要的灾害性天气系统,与我国夏半年的暴雨洪涝灾害密切相关,严重影响国民经济、社会发展和人民生命财产安全。基于西南涡理论研究与科学试验现状,阐明了西南涡大气科学试验的观测基础对西南涡基本信息、理论研究和业务预报的重要意义。从站点分布、设备技术、观测要素等方面,提出了西南涡大气科学试验观测布局的设计思想与技术原则。在此基础上,系统设计了西南涡大气科学试验的观测布局工程,并于2010年和2011年开展了2次西南涡大气科学试验,检验了观测布局设计思想的正确性,推动了西南涡研究与业务的进展。从西南涡大气科学试验的需求、现状和效果,进一步指出了加强其观测布局理论研究和具体实践,对我国经济发展、防灾减灾的重要意义。(李跃清,徐祥德)
2.4 夏季青藏高原地区近地层水汽进入平流层的特征分析
青藏高原为亚洲季风区的典型代表区域,研究其水汽进入平流层的过程和机理对认识全球气候和大气环境变化具有一定的现实意义。本研究基于中尺度气象模式(GRT)的模拟输出结果(2006年8月20—26日)驱动拉格朗日大气输送模式FLEXPART,通过追踪并解析气块的三维轨迹以及温度、湿度等相关物理量的变化特征,初步分析了夏季青藏高原地区近地层—对流层—平流层的水汽输送特征。研究结果表明,源于高原地区近地层的水汽在进入平流层的过程中受南亚高压影响下的大尺度环流和中小尺度对流的共同影响。首先,在对流抬升作用下,气块在短时间内(24 h)可抬升到9~12 km的高度,然后在南亚高压闭合环流影响下,相当部分气块在反气旋的东南侧穿越对流层顶进入平流层,并继续向低纬热带平流层输送,进而参与全球对流层—平流层的水汽循环过程,在对流抬升高度上气块位置位于高原的西北侧,然而气块拉格朗日温度最小值主要分布于高原南侧,两个位置上气块的平均位温差值可达15~35 K,这种显著的温度差异将导致气块进入平流层时“脱水”。比较而言,夏季青藏高原地区近地层水汽进入平流层的多寡主要与大尺度汽流的垂直输送有关,而深对流的作用相对较弱。(陈斌,徐祥德)
2.5 青藏高原关键区AWS与GPS水汽数据模式应用研究
开展了将青藏高原及周边新一代综合气象观测网获取的AWS以及GPS资料在模式中的变分同化应用研究,重点针对影响中国长江中下游流域的强灾害性天气系统,从监测角度进行高原强信号敏感区的研究。个例数值模拟研究表明,同化观测网中关键区观测数据对长江中下游地区强降水过程预报有改进,尤其是对暴雨预报和TS评分有明显提高。更长时间的诊断分析和数值试验结果进一步证明,观测网中关键区观测数据对长江中下游地区天气预报具有一定指示意义。(张胜军)
2.6 卫星遥感-探空观测应用研究
发展青藏高原关键区卫星遥感-探空观测综合分析技术,有助于解决高原地区常规探空站点稀疏和观测资料分辨率不高的难题。将现有站点L波段探空观测资料和TOVS卫星反演资料相结合的研究表明,利用时空分辨率较高的卫星资料结合探空资料的订正方法,是弥补常规观测网的不足与卫星遥感资料误差的重要途径。发展了高原关键区卫星遥感信息提取、融合再分析新技术;初步开发了适用于业务平台的高原关键区多源信息TOVS变分技术、WRF模式同化和应用新技术。(姚文清)
2.7 贵州泥石流预报研究
选取受典型强降水频发并引发泥石流灾害影响的贵州望谟地区作为研究对象,通过诊断分析研究了该地区局地强降水过程发生、发展的气象学条件;并选取该地区典型降水个例,重点进行了数值模拟。研究结果表明,望谟地区泥石流个例对应的强降水过程,均有较好的气象条件,即该地区存在明显的整层水汽输送通道,从低层到高层均有较好的垂直上升运动,且低层辐合、高层辐散的流场结构明显。本研究进一步提出,单从气象条件看待泥石流过程,会存在不确定因素;应加强前期地质条件不稳定积累的观测,从多元信息融合、同化技术途径尽可能使模式能模拟出高分辨率、细网格的降水和土壤湿度等关键影响因子。(张胜军)
2.8 青藏高原大气热源影响研究
利用站点逐日降水资料研究了中国大陆1961—2011年5—10月持续性暴雨事件发生次数的空间分布、时间变化及其季节演变特征,分析了持续性暴雨事件异常的环流形势,并讨论了青藏高原大气热源的可能影响。研究发现,中国大陆5—10月持续性暴雨事件的发生地主要集中在中国东部地区,逐年的发生次数具有明显的年际波动和年代际变化,且其季节内的变化与东亚夏季风的季节演变进程有密切的联系。通过对比和相关分析还发现,青藏高原前期的大气热源偏弱(强),将导致东亚夏季风偏弱(强),西南水汽输送亦偏弱(强),水汽聚集在中国南(北)方地区,最终使得夏季中国大陆的持续性暴雨事件偏多(少),初步揭示了青藏高原大气热源对中国大陆持续性暴雨事件的可能影响。(施晓晖)
2.9 L波段高分辨率探空数据应用
目前L波段探空可提供垂直高分辨率的“秒级”数据,L波段高分辨率探空数据与标准层探空数据的对比分析表明,L波段探空具有更为丰富的温、湿、风大气结构信息。考虑推进模式同化系统综合多源探测信息的技术系统发展,以提高业务数值模式降水预报水平。利用WRF三维变分系统对L波段探空进行垂直层次同化试验,采用L波段垂直高分辨率处理的探空站点为试验区,对5个降水个例的业务预报ETS评分及其综合分析表明,高垂直分辨率的L波段探空资料信息可明显改进温、湿、风场的预报效果,并改善了下游区域降水预报能力。(徐洪雄)
2.10 卫星资料多源信息应用分析研究
利用前期从1998—2004 年ISCCP 静止卫星云资料提取出的青藏高原对流系统,结合TRMM 卫星降水资料和JRA 再分析资料,研究了各类对流系统移出高原前后不同的动力、热力结构特征和降水分布特征。采用10年(1998—2007年)TRMM卫星的2A25降水资料,统计分析了青藏高原及其周边地区地表降水与降水厚度的关系,青藏高原及其周边地区地表降水与降水厚度不是简单的线性关系,且这个关系在各地区并不完全一致,青藏高原、华东华南和沿海地区存在明显的地区差异。(胡亮)
2.11 雨季四川盆地的降雨特征及其大气环流特征
利用高时空分辨率CMORPH资料反演的2003—2010年卫星估测降水数据,分析了雨季(6月20日至9月11日)四川盆地及其周边地区降水的空间变化和日变化传播特征。四川盆地是中国人口密集地区之一,有1亿人口居住于此,由于其位于青藏高原东侧背风区,雨季在夜间和凌晨常发生强降雨。雨季四川盆地位于青藏高原下游对流层中低层弱辐合区,以及对流层高层急流的南侧,在这样的大尺度环境下,主要考察降雨日变化和传播特征及其与盆地地形之间的关系。研究表明,局地降雨的最大峰值沿东南向由青藏高原(白天)向四川盆地(夜间)移动,降雨的次峰值沿东北向由云贵高原(晚间)向四川盆地(凌晨)移动。四川盆地及其周边地区降雨的移动特征与高原-盆地环流密切相关,而该局地环流是由盆地与周边山脉的高度差造成的。(钱婷婷)
2.12 近地层湍流通量观测资料模式应用在线与离线方案分析研究
近地层湍流通量计算对于中尺度数值模式有重要意义,湍流通量的参数化是当前大气边界层研究的重要课题之一。选择青藏高原东缘云南大理观象台边界层通量观测系统,离线测试了WRF区域模式中的两种常用的近地层参数化方案(MM5相似理论非迭代方案A和ETA相似理论迭代方案B),并将参数化方案计算结果与边界层铁塔涡动相关法的观测值进行对比分析。在大理观象台观测场不同植被随季节交替的状况下,根据边界层铁塔4层高度风速拟合,发现近地层空气动力学粗糙度随季节变化特征明显。将拟合的空气动力学粗糙度输入模式参数化方案进行通量计算。结果表明,稳定度是影响近地层参数化方案精度的重要因素,在不稳定条件下方案B低估了动量通量,方案A优于方案B,而在稳定条件下方案A低估了动量通量,方案B优于方案A,两种方案总体来看误差不大。大理边界层通量观测场农田植被交替的环境条件、不同季节下垫面植被类型的差异以及植被的稀疏,对近地层参数化方案湍流通量计算结果的精度有显著影响。方案B考虑了空气动力学粗糙度z0和热量粗糙度z0h的差异,不稳定条件下感热通量计算结果在裸土或稀少植被条件下明显优于方案A。针对方案B不稳定条件下感热通量计算结果在裸土下垫面仍出现高估的现象,利用Zeng等1998年提出的用辐射地表温度订正裸土下垫面感热通量方法订正后,计算结果有明显改善。(王寅钧,徐祥德)
2.13 2010年6月我国南方持续性强降水过程:天气系统演变和青藏高原热力作用影响
2010年6月我国南方发生持续性强降水,其强度与2008年6月强降水相当、超过近年来其他年份。但是,与2008年6月相比,2010年6月对流层中低层低值系统活动在青藏高原至长江中下游地区异常频繁,副热带高压位置异常偏西、强度偏强,导致低层异常风场辐合区及强降水区域相对偏北。分析2010年6月14—24日我国南方连续出现的4次持续性强降水过程发现,南亚高压、对流层中层的中纬度槽脊和西太平洋副热带高压以及低层切变线和东移低涡是造成持续性强降水的主要天气系统。利用WRF模式对2010年6月强降水过程实施显式对流集合模拟试验,在控制试验重现了观测到的地面降水和天气系统特征的基础上,在敏感性试验中将青藏高原的地表短波反照率修改为1.0,并对比两组模拟试验。结果表明,控制试验中青藏高原的地表感热加热作用使得高原及其周边地区的大气温度发生变化,相应的热成风平衡调整使得对流层低层至高层大气环流和天气系统特征发生显著变化,增强了我国南方的持续性降水。200 hPa高原西部形成反气旋性环流异常、东部形成气旋性环流异常,高原东部南下的冷空气加强,我国南方辐散增强;500 hPa高原北部的脊加强,我国东部的槽加深,副高西北侧的西南风明显增强,从高原向下游传播的正涡度也显著加强;850 hPa的低涡强烈发展并逐步东移,华南沿海的西南低空急流更为强盛,导致降水区的水汽辐合、上升运动及降水强度都增强(图4)。(罗亚丽)
2.14 基于订正CMORPH卫星-地面融合降水数据的中国南方短时强降水及暴雨日分布特征
以经过质量控制的1190个国家级气象观测站逐时降水量资料为标准,评估了2008—2013年暖季(4—10月)CMORPH卫星与地面站融合降水数据在中国南方6个典型降水区域出现不同等级降水时的产品质量,并在此基础上利用订正后的融合降水数据分析了出现短时强降水的暴雨日和未出现短时强降水的暴雨日的时空分布特征,结果表明:(1)对于短时强降水发生频次,融合降水数据对地形地貌造成的区域性差异更加敏感,在监测和研究短时强降水的局地特征方面具有优势,但是融合降水产品对不同等级的降水存在不同程度的误差,对融合降水量进行分区域、分等级的订正方法能够合理有效地减少误差。(2)仅占总降水事件1%左右的短时强降水事件对总降水量的贡献却达到16%,其发生频率最高的区域位于华南沿海、海南岛,其次是江南中部山区、浙江东部沿海、四川盆地和贵州南部等地。从月际变化来看,6—8月最为活跃,4—5月次之,9—10月除海南岛外较少发生短时强降水。(3)4—10月低于5‰的雨日出现短时强降水,但是出现短时强降水的暴雨日(即短时强降水暴雨日)占总暴雨日数的68%以上,同时平均有超过60%的短时强降水事件发生在暴雨日。短时强降水日的时空分布特征与短时强降水事件相类似,而非短时强降水暴雨日在4—8月主要出现在江南地区中部和长江中下游,9—10月出现在大巴山区和广西西南部(图5)。(罗亚丽)
2.15 华北地区山地-平原环流对暖季降水日变化的影响
为了分析热力驱动的山地-平原环流对华北地区暖季降水日循环的影响,利用中尺度数值预报模式WRF进行了降水日循环试验和敏感性试验,选用的资料为NCEP FNL再分析资料。日循环控制试验选取2004年6月17—24日作为模式的基础时段,以8天平均的00:00 UTC资料作为初始条件,8天平均的00:00 UTC、06:00 UTC、12:00 UTC、18:00 UTC循环作为侧边界条件,进行15天的积分。尽管在降水强度和落区方面与观测有一些差别,日循环控制试验成功模拟出了暖季降水的日变化特征,即日变化降水峰值信号在午后自燕山-太行山山脉开始向东南方向的华北平原地区传播。山地-平原环流的主上升支随时间向东南移动是日变化降水峰值东南传播的主要原因。无蒸发敏感性试验(关闭蒸发冷却的影响)和假-干敏感性试验(关闭潜热释放和冷却的影响)的结果与控制试验对比发现,潜热释放和蒸发冷却对山地-平原环流的维持和发展起着重要的作用。降水的蒸发冷却作用在山地-平原环流主上升支后方的对流层低层形成一“冷池”,“冷池”加强了对流的发生发展并且推动主上升支向东南方向移动。(宝兴华,张福青)
2.16 孟加拉湾风暴活动及其对我国降水的影响
活动于西北太平洋和北印度洋孟加拉湾两个洋面上的热带气旋均对我国降水产生影响。但与西北太平洋台风相比,对孟加拉湾风暴活动和影响机理的认识还很不足。过去一年孟加拉湾风暴的研究受到关注,主要包括孟加拉湾风暴的活动规律及其对我国天气的影响研究。研究表明,4—6月和9—12月是孟加拉湾风暴活动的两个高峰区,其降水影响区域主要是我国西南和长江中下游地区。风暴影响的关键环流形势在于其与西太平洋副热带高压(简称副高)、南支槽等系统的配合建立一支西南风低空急流,将孟加拉湾水汽输送到降水区。水汽追踪结果表明,风暴水汽经中南半岛进入中国云南,可输送至长江中下游。而中国西南和长江中下游降水区的水汽后向追踪发现,孟加拉湾风暴活动区是降水的重要水汽源地之一。绝大多数(约98%)孟加拉湾风暴低压中心不能移到我国,孟加拉湾风暴分裂云团移上青藏高原或云贵高原是引起我国强降水的重要方式之一,而孟加拉湾风暴分裂云团能否北上及其水汽输送能力大小与其结构变化有关。(李英)
2.17 快速涡丝化带中非绝热加热/冷却对热带气旋结构和强度的影响
利用数值模式研究了快速涡丝化带中非绝热加热/冷却对热带气旋结构和强度的影响。去除快速涡丝化带中的加热会使热带气旋强度减弱,去除冷却则会使气旋增强。快速涡丝化带中的非绝热加热对热带气旋内核尺度的增加起着重要作用,冷却则抑制内核尺度的增加甚至减小内核尺度。而同时去除快速涡丝化带中的非绝热加热和冷却可使内雨带活动受到抑制,但会在外核区域产生准周期活动对流环;类似的对流环活动也出现在仅去除快速涡丝化带中非绝热加热的试验中。如果移除快速涡丝化带中的非绝热冷却作用,热带气旋将发展成为环状热带气旋结构,外雨带活动被抑制(图6)。(李青青,端义宏)
2.18 我国东南沿海热带气旋极端降水的识别及其成因研究
完成了我国东南沿海热带气旋(TC)极端降水的识别分析。总结得出1958—2012年热带气旋极端降水集中分布在该地区沿海北部、中部和南部3个区域的基本特征,且这一分布特征与地形有很好的对应关系,表明地形在我国东南沿海热带气旋极端降水分布上具有十分重要的作用。
发展了一个台风“路径相似面积指数”。该指数的物理意义清晰:两条台风路径,它们的起始点的连线以及结束点的连线所围成的面积即为相似指数;该指数数值越小,代表两条路径越相似。该指数思路简洁、实用性强、具有良好的应用前景。(任福民)
2.19 强台风海葵(1211)近海急剧增强的数值研究
近海台风强度急剧增强是预报中的难点。利用新一代中尺度WRF模式对台风海葵(1211)近海强度急剧增强过程进行了数值模拟,研究了引起强度突变的可能机理以及相应结构变化。模拟结果表明,台风海葵的增强和急剧增强与低层水汽输入的突然增加和有利的高、低层辐散、辐合流场配置密切相关,且高、低层辐合、辐散流场同时增强比海葵台风强度迅速增强提前6 h。进一步的台风结构变化表明,台风径向风速和切向风速增大、暖心强度逐渐加强且暖心范围明显扩大并向低层扩展,以及垂直上升运动的逐渐增强等,都有利于其强度的维持和发展。(张胜军)
2.20 超强台风桑美(2006)登陆前后低层风廓线数值模拟分析
利用ARW-WRF模式,以垂直方向40个模式层(对低层加密)、水平方向最高1 km 的分辨率,对台风桑美(2006)进行数值模拟,模拟结果与实况基本一致。基于台风桑美(2006)1 km分辨率的模拟结果,对台风低层(海面或地表以上1500 m以下)风场结构进行了分析。结果表明,在台风登陆前,其最大风速半径附近存在水平风速在垂直方向有很强变化的风廓线,该类型风廓线的最大风速高度有明显变化,表现出类似急流的特征;而台风登陆后,其水平风速垂直变化明显减弱,即风廓线类型发生较大变化;另有一种水平风速在高层少变的风廓线类型在台风中是普遍存在的。还根据高层和低层两个切变因子,将台风登陆前的风廓线分为急流型、普通型和过渡型,并进一步分析各类风廓线在台风中出现的位置和急流高度。对急流型风廓线的形成原因探讨的结果表明,超/次梯度风在垂直方向上的变化是形成急流型风廓线的原因,而外围绝对角动量的输送在其中起关键作用。(端义宏等)
3 数值天气预报和模式关键技术
3.1 球面准均匀网格非静力大气动力模式研发
为满足未来数值天气预报发展的需求,克服现有模式在极地地区计算的技术难点,并瞄准球面多尺度模式发展的前沿问题,在改进模式动量方程三维科氏力计算的基础上,完善了GRAPES非静力模式在准均匀阴阳网格上的动力和算法设计,初步实现了模式动力框架在阴阳网格上的长期积分,并通过了计算结果验证。对三维大气的理想试验进行了计算试验,包括平衡流试验、斜压波试验、Rossby-Haurwitz波和地形Rossby波试验,证实了非静力模式框架改造的合理性、算法设计的正确性和地形处理能力(图7)。(彭新东)
3.2 基于历史资料的数值预报误差订正和在中短期预报中的应用试验
数值预报误差可以通过模式长期积分结果与历史资料的偏差来订正。在距平积分概念基础上,利用ECMWF再分析资料作为格点历史资料,对CAM3.0模式模拟的2008年我国南方雨雪冰冻天气和1998年长江流域暴雨过程的环流形势场进行了订正试验。由冬夏个例发现,500 hPa位势高度的距平相关系数和均方根误差均得到改善,其中全球距平相关系数大于0.6的预报时效延长1天以上。风、温、湿等环境场在不同区域也都得以改善,其中热带改善最为显著。在冬季个例中,温度场的短期预报校正幅度达到4.5 K。图8给出了纬向平均温度和湿度场CAM3.0模式预报、订正结果和ECMWF再分析的对比,订正后的误差显著减小。改变模式分辨率(在T85以下分辨率),则该方法对中短期数值预报都具有显著的订正效果(图8)。(彭新东)
3.3 云微物理参数化方案对模拟长期降水的影响
利用中国气象科学研究院双参数云微物理方案、Gaddard单参数云微物理方案及高精度WRF中尺度模式,对2008年西北太平洋地区季风爆发前后(5—6月)的平均降水、极端降水及水汽收支情况进行了分析。结果显示,模式能够较好地再现日平均降水的空间分布,但是高估小雨、低估中到大雨的出现频率,而对极端降水模拟得较好。由区域平均的水汽收支分析得出,强降水主要是由强的湿辐合造成,而在对流活动较少期,降水主要来自洋面的蒸发。此外,水汽的收支对云微物理过程比较敏感,在连续2个月的模拟中,云微物理过程通过影响大气潜热释放反馈影响到环境场环流,导致大尺度水汽辐合场的不同,这是不同微物理方案造成地面降水不同的最主要原因(图9)。(高文华)
3.4 基于单值数值预报的降水概率预报方法研究
利用1981年1月1日至2003年12月31日淮河流域59个站的降水观测及同时段美国GFS集合预报模式回算的24 h降水量集合平均预报资料,建立了条件亚正态分布函数的概率预报模型并得到集成预报。针对淮河流域子流域的试验结果表明,该方法生成的集成预报的均方根误差在所有子流域和各个季节的误差都显著降低,其中蚌埠至洪泽湖流域6月的均方根误差降低达3.11 mm。4个子流域通过该模型得到的集成预报的Brier技巧评分在0.16~0.61,说明该集成预报在整年都具有一定预报价值。该方法的优点是在概率化的过程中,考虑了历史资料的应用,不但实现了对数值预报的订正,而且还将数值预报的不确定性进行了量化,使预报包含的不确定性信息更多(图10)。(赵琳娜)
3.5 多尺度洪水模型的移植与引进
在前期的筹备与策划下,2013年6月引进由美国俄克拉何马大学和美国航空航天管理局的区域可视化和监测系统项目团队共同发展的分布式水文CREST模型。该模型在全球水文水资源模拟和实时气象地质灾害预报等方面有广泛应用,到2013年底已经完成在国家信息中心超级计算机上的运行调试,并选择3种业务常用且具有代表性的降水资料CMORPH、国家信息中心的格点降水资料以及雷达、地面和卫星的融合降水资料,在高分辨率卫星遥感DEM 等地表下垫面数据基础上,驱动分布式水文模型CREST。全国范围的水平空间分辨率1/8°(约10 km)的CREST 模型能够较好地模拟中国地区的基本水文过程及基本水文变量,为建立中国地区高分辨率洪涝实时监测预警系统,以及防灾减灾决策提供更实用的参考信息打下基础(图11)。(赵琳娜)
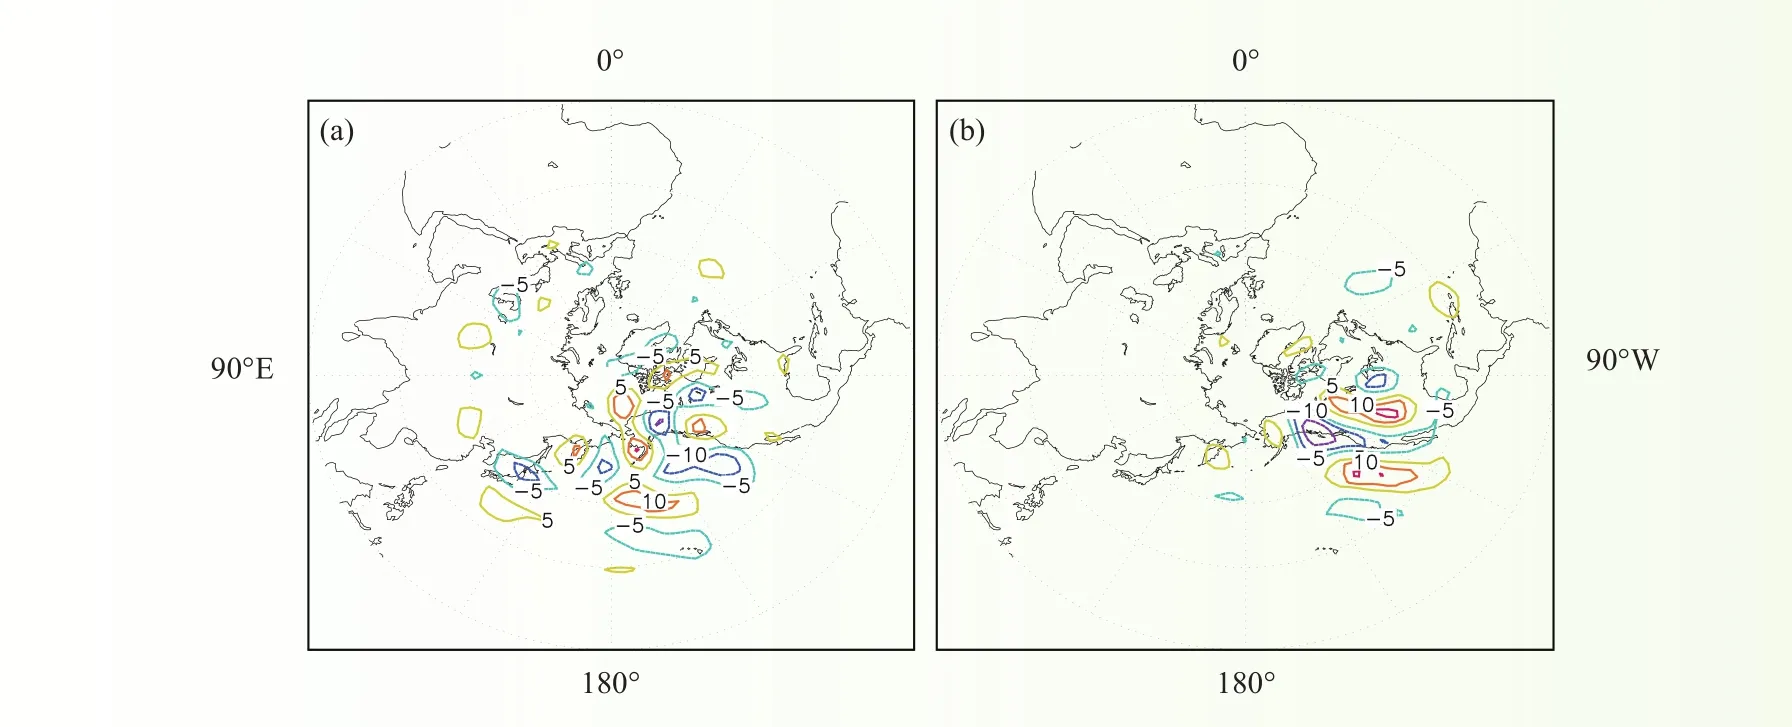
图 1 优化时间为8天500 hPa上激发北大西洋涛动事件发生的最优前期征兆:(a)NAO正位相事件的最优位势高度扰动;(b)NAO负位相事件的最优位势高度扰动(单位:dagpm)Fig. 1 Optimal precursors triggering NAO onset at 500 hPa with an optimization time of 8 days∶ (a) Optimal geopotential height anomalies triggering a positive NAO event; (b) optimal geopotential height anomalies triggering a negative NAO event (unit∶ dagpm)
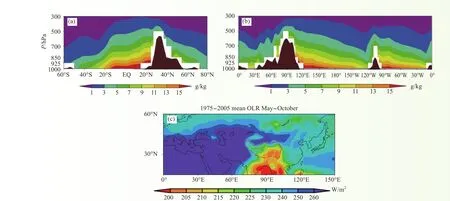
图 2 (a)1948—2006年夏季80°~110°E平均比湿高度-纬度剖面;(b)27.5°~35°N平均比湿高度-经度剖面;(c)1975—2006年夏季亚欧区域长波出射辐射(OLR)平均分布特征Fig. 2 (a) Altitude-latitude profile of 80º to 110ºE mean specific humidity in summer, mean field of various elements for 1948–2006; (b) altitude-latitude profle of mean specifc humidity of 27.5º to 35ºN; (c) mean distribution of outgoing long-wave radiation (OLR) in the Asia–Europe region for summers 1975–2006
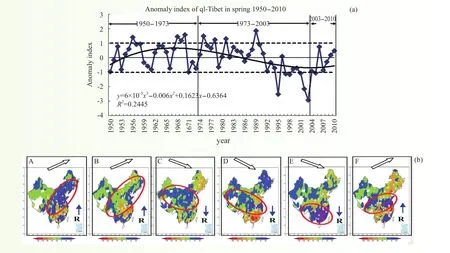
图 3 (a)春季青藏高原视热源年际变化及趋势曲线;(b)A—E为各年代中国大陆(3—8月)降水年代际距平场(相对1960—2000年平均值),F为2003—2009年中国大陆(3—8月)降水距平场(箭头为各年代主雨带北移或南压趋势)Fig. 3 (a)Interdecadal variations in apparent heat sources and its trend curve (solid line) for the Tibetan Plateau in spring; (b) fgures A–E show the precipitation interdecadal anomaly feld for the Chinese continental region (March–August) for each time period (relative to the average value for the years 1960–2000), fgure F shows the precipitation anomaly feld of the Chinese continental region (March–August) for 2003–2009. The arrows represent the northward or southward shifting trend of the main rain belt for each time period
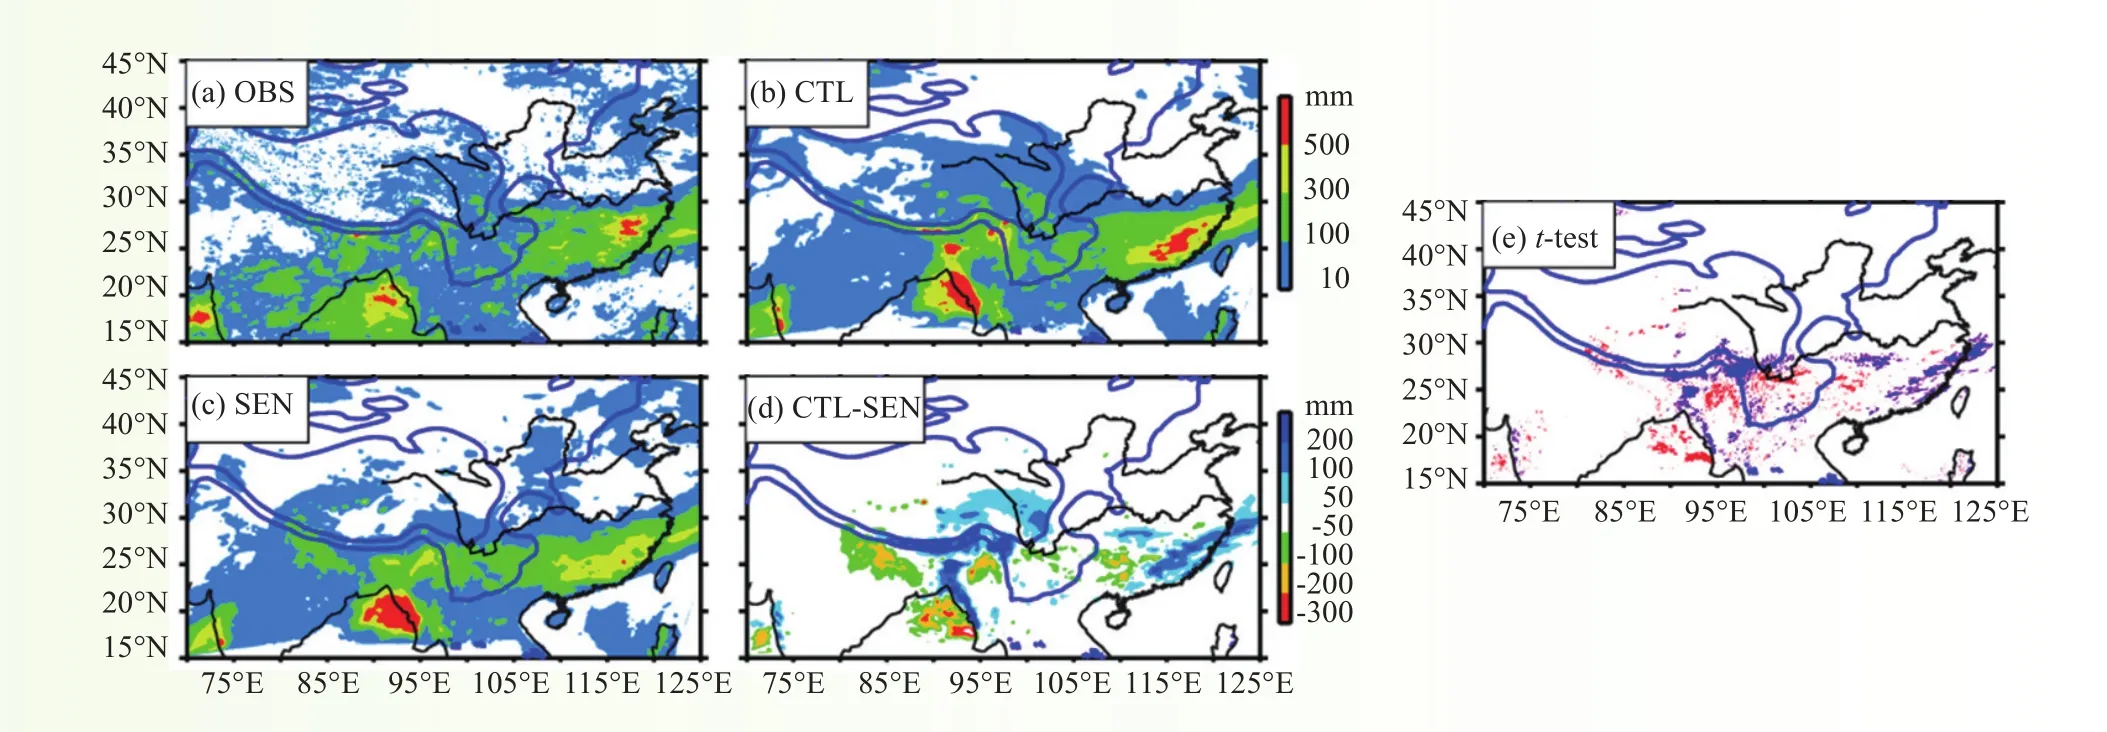
图 4 2010年6月14—24日累积降水量:(a)观测(OBS);(b)控制试验(CTL);(c)敏感性试验(SEN);(d)控制试验与敏感性试验之差(CTL-SEN);(e)差异的显著性检验(蓝(红)色阴影区为正(负)差异通过了95%的t检验区域,蓝线为1 km及3 km地形等高线,黑线为海岸线和长江、黄河)Fig. 4 Accumulated precipitation during 14–24 June 2010∶ (a) Observation (OBS); (b) control (CTL); (c) sensitivity (SEN) experiments; (d) difference in the accumulated precipitation between the control and sensitivity experiments (CTL-SEN); (e) examination of signifcant difference (Blue/red shading represents positive/negative differences that are signifcant at the 95% confdence level. Blue lines denote the 1 and 3 km terrain contours; black lines denote the coastline, the Yangtze River, and the Yellow River)
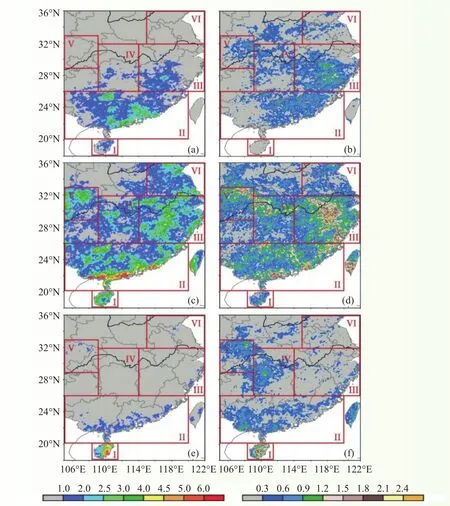
图 5 2008—2013年平均短时强降水日数(左列)和非短时强降水日数(右列)空间分布(a和b:4—5月;c和d:6—8月;e和f:9—10月)Fig. 5 Distribution of the number of annual mean heavy rainfall days with (left) and without (right) occurrence of the shortduration heavy rainfall during April–May (a, b), June–August(c, d) , and September–October (e, f) for the years 2008 to 2013
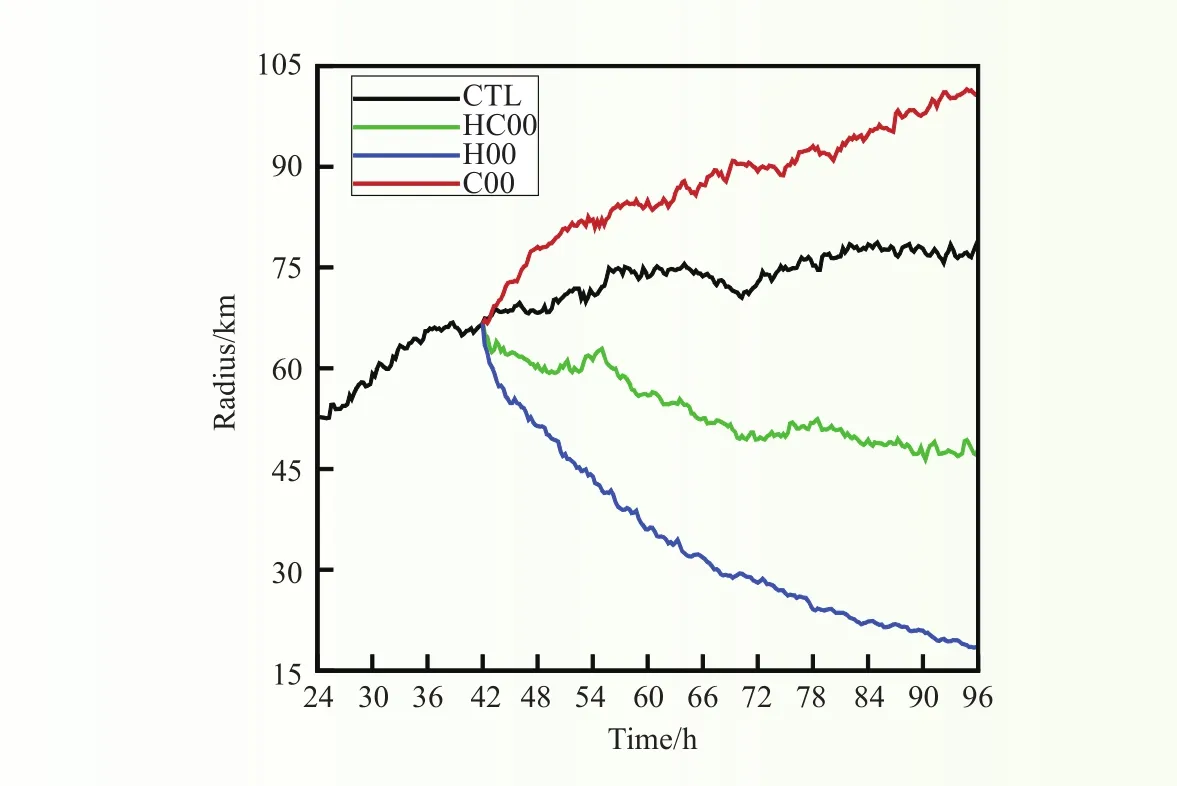
图 6 轴平均的25.7 m/s等风速半径随时间的变化Fig. 6 Time evolution of the radius of the azimuthal mean damaging force wind (25.7 m s-1)

图 7 山地激发Rossby波理想试验第15天的积分结果Fig. 7 Results of the mountain-induced Rossby wave test at day 15
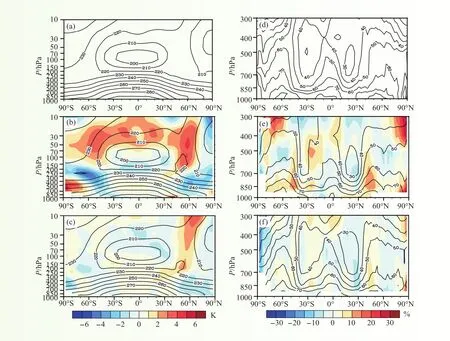
图 8 2008年1月9—24日模式预报(下)和订正(中)的纬向平均温度(K,左)、湿度(%,右)与ECMWF再分析场(上)的对比(彩色阴影为对应量与再分析场的偏差)Fig. 8 Zonal mean temperature (K, left), relative humidity (%, right) of model run (lower), and the corrected model run (middle) for 9 to 24 January 2008, in comparison with the ECMWF reanalysis (upper)
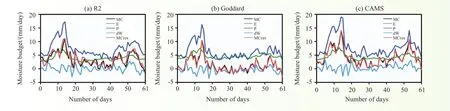
图 9 NCEP R2(a)、Goddard(b)和CAMS(c)模式模拟的区域平均湿收支演变(MC:水汽辐合,E:地面蒸发,P:降水,dW:局地变化)Fig. 9 Time evolution of the daily mean moisture budget from (a) NCEP R2, (b) Goddard, and (c) CAMS simulations. (MC∶moisture convergence, E∶ surface evaporation, P∶ precipitation, dW∶ precipitable water tendency)
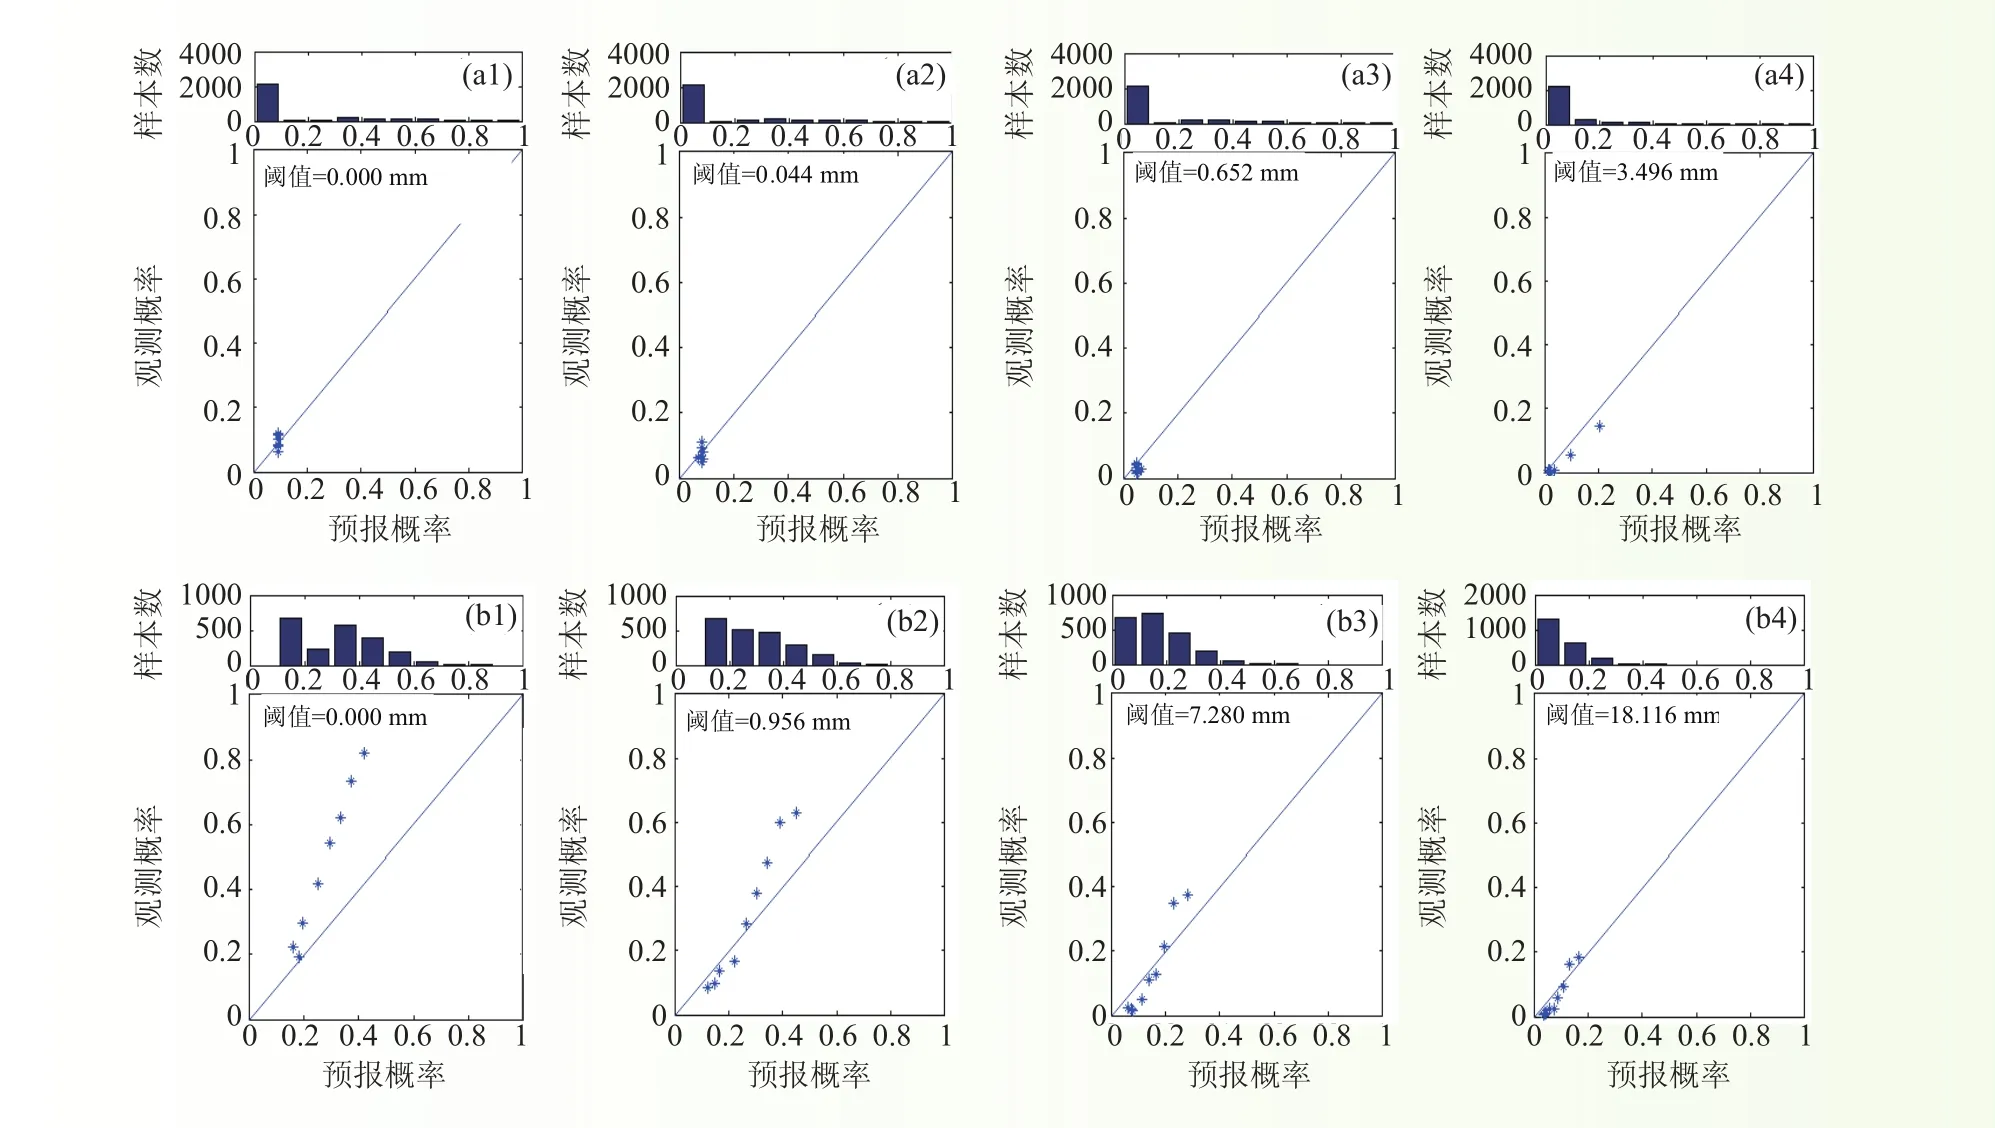
图 10 淮河上游大坡岭至息县流域冬季(a1~a4)和夏季(b1~b4)的可靠性曲线Fig. 10 Reliability diagram of the Dapoling to Xixian catchment in winter (a1–a4) and summer (b1–b4)
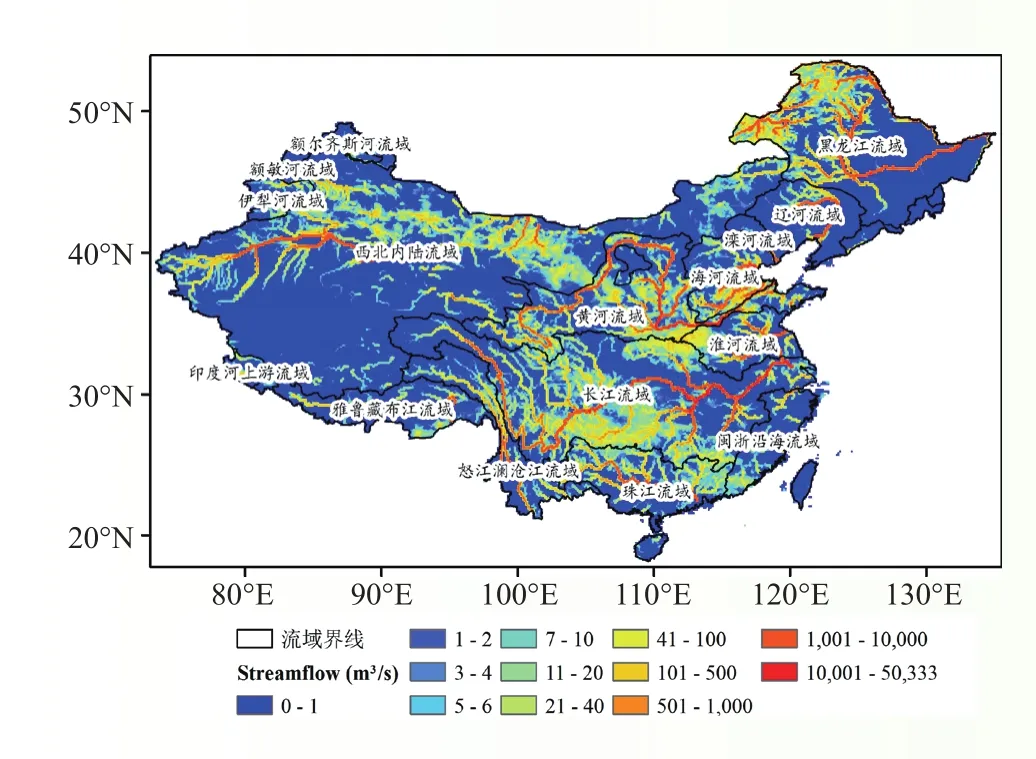
图 11 水平空间分辨率为1/8°的水文模型CREST系统模拟的2013年7月14日13:00的流量Fig. 11 The simulated streamfow from CREST with 1/8° spatial resolution
Advances in Research on Severe Weather
1 Severe weather monitoring technology and data convergence methods
1.1 Study and measurement of the water circle of the Third Tibetan Plateau Experiment in 2013
The measurement of cloud rainfall, which was the water circle measurement project of the Third Tibetan Plateau Experiment in 2013, was completed. Large quantities of data were collected in this experiment. The main developments are that a vertical measurement structure has been completed for the frst time using cloud radar, MRR2 radar, and lidar in the Tibet an Plateau and to the east of the Tibetan Plateau in China. Preliminary developments in cloud edge retrieval technology and the vertical profle of liquid/ice/rain/snow in cloud have been carried out using a variety of remote sensing techniques. The measurement capability of equipment produced in China has been tested and verifed on the plateau. The equipment provides large amounts of data for the study of the water circle and energy on the plateau, and preparatory work on rainfall measurement of clouds has been conducted for the third Tibetan Plateau experiment. (Cui Zhehu)
1.2 Study on dual polarimetric radar quality control and application algorithm
Funded by the National Natural Science Foundation of China “A Study on Cloud Phase State and Drop Distribution Change and Its Infuence on Precipitation Estimation by Polarimetric Weather Radar”, several quality control algorithms for dual polarimetric radar have been developed, and some retrieval algorithms for drop size distribution (DSD), hydrometeor phase identifcation, and quantitative precipitation estimation (QPE) have been studied using controlled radar data. Based on these data, the variation in DSD and its phases and its infuence on radar parameters and QPE have been analyzed during rainfall processes. The potential of dual polarimetric radar QPE has been assessed by comparison with surface gauges. The main innovations include introduction of the wavelet analysis method into the quality control of dual polarimetric radar data, and further verifcation of data quality and the effect of quality control by using ground distrometer data. (Hu Zhiqun)
1.3 Spectrum analysis of wind profle radar and retrieval of raindrop parameters
Use of the wind energy spectrum and the turbulence spectrum results in less focus on high altitudes. A fast Fourier transform is used to calculate the wind-energy spectrum density and the turbulent spectrum density at high altitude (1–5 km) using Wind Profle Radar measurements, and the distribution characteristics are analyzed. The features of the wind energy spectrum in cold, windy weather, widespread rainstorm, and severe convective weather are obtained. A direct method using precipitation echo spectrum parameters to estimate raindrop parameters is presented. Compared with the results for average diameter obtained using a terrestrial laser spectrometer, the results are relatively consistent. The innovation in this work is an expansion of the application range of wind profle radar, especially applied to inversion of precipitation microphysical parameters. (Ruan Zheng)
1.4 Local disaster weather warning technology using radar applied by Henan State Grid
The severe weather nowcasting system in an electric network from State Key Laboratory on Severe Weather (LaSW) was applied in the Henan Electric Power Research Institute. The key innovations are as follows. Based on 3-D radar reflectivity mosaic data, a nowcasting algorithm for convective precipitation, 0–1 h gale and hail forecasts has been produced. The software system was used in electric power transport to improve the nowcasting ability of thunderstorms, gales, hail, and local heavy rainfall. (Liu Liping, Wang Hongyan)
1.5 CINRAD quality control algorithms adopted by radar operational software of CMA
The CINRAD quality control algorithms for ground clutter, sea clutter, electromagnetic wave interference, clear echo detection, and radial velocity data processing for C-band radar developed by LaSW were used in Radar Operational Software Engineering. The detection results were examined by the CMA Meteorological Observation Center. (Liu Liping)
1.6 Optimal precursor triggering the NAO onset
Considering that the life cycle of the North Atlantic Oscillation (NAO) is about 10 days, we explored the optimal precursors of NAO events in winter from a meteorological viewpoint. We found that the optimal precursors are baroclinic wave trains that are localized on the northward fanks of the climatological Atlantic jet. Accompanied by the formation of the NAO, the wave trains undergo wave breaking, and the north–south variability of the zonal mean westerly anomaly forms. In addition, the role of the nonlinearity during the two NAO phases is explored (Fig. 1). (Jiang Zhina)
1.7 Wind feld characteristics in the lower troposphere and atmospheric stratifcation of the frst snowfall over North China in winter 2009
The first snowfall over North China in winter 2009 was investigated using numerical modeling and diagnostic analysis with a focus on the dynamic and thermodynamic effects of the wind field in the lower troposphere and the characteristics of atmospheric stratifcation. The results show that this snowfall was induced by the combined effect of the trough in the middle troposphere, the shear line in the lower troposphere, and the inverted trough on the ground. With southeastward movement of the influencing systems, the snow area moved southward. The easterly reflux that had important dynamic effects on the snowfall was mainly located at and below 850 hPa. On the one hand, the easterly refux and the westerly fux formed a wind convergence line that favored upward motion. On the other hand, the effect of the topography combined with the easterly refux triggered a southerly fow that prompted the transport of warm airfow into the snow area, resulting in frontogenesis when the warm airfow met the cold airfow. The easterly refux had thermodynamic effects in addition to dynamic effects, and played an important role in the convergence of water vapor over the snow area. There was a pronounced temperature drop in the lower troposphere during the snowfall. The temperature in the boundary layer and at 850 hPa fell below 0 °C and to −5 °C, respectively. This result suggests that to improve the forecasting of the nature of winter precipitation, close attention should be paid to the simulated characteristics of temperature stratifcation in the lower troposphere. (Xia Rudi)
1.8 Applicability and distribution of satellite-measured atmospheric water vapor profiles over the Tibetan Plateau region
We have built a comprehensive converged data set of water vapor from radiosonde observations in the Tibetan Plateau area and satellite observations, based on assessment and analysis of radiosonde and satellite observational data of water vapor in the Tibetan Plateau, thus providing a basis for climate analysis of the Tibetan Plateau, data fusion, and model assessment. First, we carried out quality control of the radiosonde observation data for 2003–2010, and then assessed the AIRS satellite observation data using the radiosonde data, putting forward a correction method of AIRS satellite observation water vapor data. At the same time, we collected and arranged the whole layer and hierarchy water vapor data for 1988–1999 and 2000–2001 from NVAP and analyzed the water vapor data for 2008–2011 from the IASI satellite. Combining the AIRS, IASI, NVAP, and radiosonde observations, we built a comprehensive data set of site observation in the Tibetan Plateau and satellite observation covering the time period 1988–2011. Using a corrected comprehensive water vapor data set, we analyzed the spatial and the water vapor high value feld in a plateau section located at a height of 500 hPa with higher moisture content than the surrounding region. The moist layer can reach up to300 hPa. The hierarchical water-vapor fux and the troposphere divergence feld indicate that this moist layer has some impact on the precipitation in the area around the plateau section and its downstream area. (Wang Donghai)
2 Structure and mechanisms of severe weather
2.1 Theoretical and application studies on forewarning and forecasting of downstream disaster weather from the Tibetan Plateau
The Tibetan Plateau plays an important role in the formation of the Asian monsoon circulation. As the“roof of the world,” it contains abundant glaciers, accumulated snow, rivers, lakes, and aquifers. From the perspective of the important role of Tibetan Plateau in the global atmospheric water cycle, we put forward the concept of Tibetan Plateau-world atmospheric “water tower,” summarize the relevant theoretical results of study on the world “water tower,” and describe the special mutual feedback effect of the vertical circulation water cycle structure and the ocean–atmosphere–land hydrological processes in the Asian region and within that hemisphere, all of which are closely related to the plateau. Through the analysis of the moisture transport structure in the East Asian area, we observed the moisture transport "big triangle area" and its source/ sink structure through the Tibetan Plateau to the plum Rain belt. Studies have also shown that the overall southwest–northeast topography of the Chinese Tibetan Plateau and Loess Plateau forms a kind of “power attraction” effect. This topography is closely related to the seasonal process of the Plum Rain belt from southeast to northwest in East Asia. The monograph also describes the construction of a new generation of comprehensive observation systems in the Tibetan Plateau and its surrounding area implemented by the China-Japan cooperation plan (JICA), and provides the applied research findings of the rain-snow-ice disaster in southern China in 2008 and some heavy rainfall events. Studies on the data applications of the new generation of comprehensive observation systems in the key zone of Tibetan Plateau have great significance for the improvement of forecasting capability and forewarning of downstream disaster weather from the plateau (Fig. 2). (Xu Xiangde, Lu Chungu, Shi Xiaohui)
2.2 Modulation of the apparent heat source of the Tibetan Plateau and interdecadal variations of the summer rain belt in China
As the Asian summer monsoon is the largest and most notable monsoon in the world, changes in its intensity may have a far-reaching infuence on the global climate and climate system, especially on the rainfall in South Asia and East Asia. On the other hand, as a huge elevated land “platform” covering about a quarter of the Chinese land area, the Tibetan Plateau forms a huge cylindrical heat source affecting the middle part of the troposphere, which can extend to the free atmosphere. We term this the hollow heat source column. Under the background of understanding global climate change, how does the infuence of plateau atmospheric heating alter the variation of the Asian summer monsoon and rainfall distribution? It is worth noting that the correlation vector fields between the plateau heat source and the regional or inter hemispheric water vapor flow also refect the large triangular infuence domain of monsoon water vapor transportation. There were three stages of interdecadal variation in the apparent heat sources of the Tibetan Plateau in spring between 1950 and 2010. This three-stage apparent heat source of the plateau in spring is consistent with trends in Chinese regional precipitation variation. Both interdecadal variation trends are markedly consistent. The apparent heat source of the plateau in spring shows a trend of rising again after a fall in the past 10 years. The regional precipitation pattern of “southern food and northern drought” in China, which corresponds to infuencing factors such as the early stage heat source and plateau snow cover, also plays an important role. The spring heat source of the Tibetan Plateau may to some degree have a modulating role on Chinese summer precipitation (Fig. 3). (Xu Xiangde, Lu Chungu, Shi Xiaohui, et al.)
2.3 Theory and practice of the observation and layout of southwest vortex atmospheric scientifc testing
China is a country that has very severe meteorological disasters. The southwest vortex is a very serious
disaster weather system and is closely related to food disasters caused by heavy rain in the summer half of the year in China. It has serious impacts on the national economy, social development, and the safety of people,s lives and property. Based on current southwest vortex theoretical research and scientific experiments, this paper expounds the important signifcance of observations and experiments in southwest vortex atmospheric science in terms of basic information, theoretical research, and business prediction of the southwest vortex. From discussion of site distribution, equipment technology, and observation elements, the design thought and technical principles of the observational layout for the southwest vortex atmospheric scientific experiment are described. On this basis, a system for engineering of the observational layout of the southwest vortex atmospheric scientifc experiment was designed, and two southwest vortex atmospheric scientifc experiments were developed in 2010 and 2011. Checking of the correctness of the observational layout design and promotion of progress in research and business of the southwest vortex was carried out. Finally, from the requirements, current status, and effect of southwest vortex atmospheric scientific testing, we stress the important signifcance of strengthening the observation layout, theoretical research, and concrete practice for Chinese economic development and disaster prevention and mitigation. (Li Yueqing, Xu Xiangde)
2.4 Water vapor transport from the atmospheric boundary layer to the stratosphere over the Tibetan Plateau region in summer
Identifcation of the main mechanism of water vapor transport from the atmospheric surface layer into the stratosphere over the Asian monsoon region, especially in the Tibetan Plateau (TP) region, plays a signifcant role in understanding global climate change and global environment. In order to investigate the processes relating to possible transport mechanisms of water vapor from the surface layer to the upper troposphere and stratosphere, we used a Lagrangian particle dispersion model FLEXPART driven by the hourly output generated from the Weather Research and Forecasting (WRF) model for the period 20 to 26 August 2006. Based on backward tracing analysis of three-dimensional trajectories and the changes in temperature, humidity, and other physical variables, our results show that small-scale convection lift and large-scale transportation are the two main factors responsible for the water vapor movement from the surface layer to the stratosphere. Air parcels from the surface layer can be lifted up to 9–12 km height via active convention within 24 hours, and then pass through the tropopause in the southeastern part of the TP, driven by the large-scale advection associated with the South Asian anticyclonic circulation. Most air parcels can be further transported to lower latitudes and affect the global troposphere–stratosphere water vapor budget. Air parcels at the cloud-top height are largely located over the northwestern part of the TP, whereas the locations of Lagrangian minimum temperature, i.e., where dehydration of air parcels occurs, are mostly located in the south of the TP. The potential temperature difference between these two regions is 15–35 K, implying signifcant dehydration of all air parcels. This result indicates that the mechanism of transport of water vapor from the atmospheric surface layer to the stratosphere over the TP region in summer is potentially controlled by a large-scale circulation associated with the southern Asian monsoon, and the small-scale circulation caused by convection plays a secondary role. (Che Bin, Xu Xiangde)
2.5 Assimilation of AWS and GPS observations over the “key sensitive area” in the Tibetan Plateau into a numerical model
To investigate the effect of the “key sensitive area” in the Tibetan Plateau (TP) on severe rainfall downstream in the Yangtze River Valley (YRV), observations from the AWS and GPS of the New Integrated Observational System over the TP were assimilated into the advanced research Weather Research and Forecasting (WRF) model through 3-dimensional variational data assimilation (3DAVR). The summerrainfall case and a set of one-month sensitivity experiments for June 2008 were analyzed, and the threat score was used to evaluate rainfall forecasting skill. The results show that the assimilation of these data in the southeastern edge of the TP help to adjust the structures of moisture, temperature, and wind feld, which improve the rainfall forecast for the YRV, especially heavy rainfall events. Both data analysis and numerical experiments demonstrate that the observations in the “key sensitive area” might improve the forecasting of high-impact weather in the YRV, and the former may be a good early-warning signal for the latter. (Zhang Shengjun)
2.6 Application study of satellite remote sensing-radiosonde observation
The development of a comprehensive analysis method of satellite remote sensing observations in key areas of Tibetan Plateau helps to solve the difficulties of sparse conventional sounding stations and lowresolution observational data. In addition, studies on a combination of the L-band sounding data from existing sites and TOVS satellite inversion data show that using the variational method that combines satellite data with high time-space resolution and sounding data is an important way to mitigate the defciency in conventional observation stations as well as deviation of the satellite remote sensing data. A new technique for extraction, integration, and reanalysis of satellite remote sensing information in key areas of plateau is developed. The multi-source information variational technique and the new WRF model assimilation and application method are initially developed. (Yao Wenqing)
2.7 Forecasting of debris fows in Guizhou Province
As a typical disaster area affected by frequent heavy rainfall and debris fows triggered by heavy rainfall, Wangmo in Guizhou Province is selected to detect influential factors causing heavy rainfall in this area. First, the meteorological condition for the heavy rainfall was detected with the use of diagnostic analyses. Then a numerical simulation was designed based on the example of a typical heavy rainfall. The results show that there are favorable meteorological conditions for all debris fow cases in the Wangmo region, i.e., there are remarkable vapor transport channels towards this region in the air, vertical ascending motions from low level to high level, and, in addition, obvious convergence at low level and divergence at high level. The meteorological conditions are not only the factors affecting the forecasting of debris fows, and observations of unstable geological conditions must be intensifed. Furthermore, in terms of techniques for the integration of multi-information and the assimilation technique used in the numerical model, some key factors, including the rainfall distribution and the high-resolution soil moisture, will help to improve the forecasting of debris fows. (Zhang Shengjun)
2.8 The effect of atmospheric heat sources in the Tibetan Plateau
Using site daily precipitation data, we studied the spatial distribution, temporal changes, and seasonal evolution of the frequency of sustained rainstorm events between May and October for the period 1961 to 2011 in mainland China. We analyzed the abnormal circulation situation in sustained rainstorm events, and discussed the possible infuence of the atmospheric heat source of the Tibetan Plateau. The results show that sustained rainstorm events between May and October in mainland China are mainly concentrated in eastern China. The yearly frequency of occurrence shows obvious interannual fuctuation and interdecadal variation, and its intraseasonal changes are closely related to the seasonal evolution process of the East Asian summer monsoon. Using comparison and correlation analysis, we also found that the atmospheric heat source at an early stage in the Tibetan Plateau is weak (strong), which will lead to weak (strong) East Asian summer monsoon and weak (strong) southwesterly water vapor transportation. Water vapor condenses in southern (northern) China, and eventually causes more (fewer) sustained rainstorm events in summer in mainland China. The analysis preliminarily reveals the possible infuence of the atmospheric heat source in the Tibetan Plateau on sustained rainstorm events on mainland China. (Shi Xiaohui)
2.9 Application of L-band high-resolution radiosonde data
At present, L-band sounding can provide high-vertical-resolution “seconds-level” data. Analysis of L-band high-vertical-resolution data and standard-layer radiosonde sounding data shows that the L-band sounding can provide richer information on atmospheric temperature, humidity, and wind. To improve the data assimilation system, the use of multi-detection information, and the skill of operational numerical model precipitation forecasting, we use the WRF three-dimensional variational data assimilation system (WRFDA) to evaluate the effect of high-resolution vertical-level L-band sounding on precipitation. Using operational L-band sounding site as a test case, the operational forecast ETS score and comprehensive analysis of fve precipitation cases show that high-vertical-resolution L-band sounding data can markedly improve the forecasting skill for temperature, humidity, and wind feld, and result in better rainfall prediction ability for the downstream area. (Xu Hongxiong)
2.10 Study and application of multi-source satellite data information
Using the convective systems (CS) initiated over the Tibetan Plateau from ISCCP data for 1998–2004, combined with precipitation data from Tropical Rainfall Measuring Mission (TRMM) precipitation radar (PR) and JRA reanalysis, we studied different dynamic thermal structures and precipitation distributions before and after the CS moves out of the plateau. The relationship between surface rain rate and depth of the rain system (rain depth) over the Tibetan Plateau and the surrounding area is also examined using 10-year TRMM PR measurements. The results show that the relationship is not entirely consistent in each area∶ the relationship in the Tibetan Plateau is signifcantly different from that in Southeast China and the coastal area of China. (Hu Liang).
2.11 Relevant analysis of rainfall characteristics and atmospheric circulation characteristics in the
rainy season in the Sichuan Basin
Using a precipitation estimate with high temporal and spatial resolution derived from satellite measurements by the morphing technique during 2003–2010, we examine the spatial variability and diurnal propagation of mean precipitation over the Sichuan Basin (SCB) and its adjacent mountainous regions in the rainy season (June 20–September 11). The SCB is one of the most populous areas in the world, and is home to more than 100 million people. It is located in the immediate lee (to the east) of the Tibetan Plateau (TP), which is prone to heavy precipitation that often peaks overnight and in the early morning. The large-scale environment over this region during the rainy period is characterized by weak low-to-mid tropospheric leeside convergence downstream of the TP and to the southern edge of the upper tropospheric jet streams. Under this fow confguration, our study links the unique diurnal variations in the precipitation pattern and propagation to the unique topography in this region. During the rainy season, the local diurnal precipitation maximum moves primarily downslope and southeastward, changing from peaking over the TP during the day to over the SCB at night. A secondary maximum moves northeastward downslope of the Yunnan–Guizhou Plateau toward the SCB between late evening and early morning. The movement of precipitation over the SCB and the adjacent regions is closely tied to multiple regional-scale mountain-plain solenoids resulting from the large contrast in terrain height between the basin and the surrounding mountain ranges. (Qian Tingting)
2.12 Online and offine application of a surface turbulent fux observation data model
Surface turbulent fux calculation is signifcant for mesoscale numerical modeling. Parameterization of turbulent fux is one of the important topics in the study of atmospheric boundary layers. We selected the Dali observatory boundary layer flux observation system at the eastern edge of the Tibetan Plateau and off-line tested two types of commonly used surface layer parameterization schemes in the WRF regional model (scheme A∶ MM5 similarity theory, noniterative; and scheme B∶ ETA similarity theory, iterative). We performed a comparative analysis of the calculated results of the parameterization scheme and the observed values ofboundary layer tower eddy correlation method. Under the condition that the vegetation varies seasonally at the Dali Observatory observation feld, from the boundary layer tower four-layer-height wind speed ftting, we found that there is obvious variation in the surface aerodynamic roughness in different seasons. The ftted aerodynamic roughness was input to the mode parameterization scheme for flux calculation. The results show that stability is an important factor affecting the surface layer parameterization scheme accuracy. Under unstable conditions, scheme B underestimated the momentum fux, and scheme A was better than scheme B. Under stable conditions, scheme A underestimated the momentum fux, and scheme B was better than scheme A. In general, the errors of these two schemes were not large. For environmental conditions with alternating farmland vegetation at the Dali boundary layer flux observation field, differences in surface vegetation in different seasons, and the sparsity of vegetation had a significant effect on the precision of the calculated surface layer parameterization fuxes. Scheme B considered the difference between the aerodynamic roughness (z0) and the heat roughness (z0h), and the calculated results for sensible heat fux under unstable conditions is obviously better than scheme A for bare soil or sparse vegetation conditions. For scheme B, under unstable conditions, the calculated results of sensible heat fux are still high for the surface with bare soil. After adopting a method using the radiometric surface temperature to correct the sensible heat fux on bare soil proposed by Zeng et al. (1998), the calculated results are signifcantly improved. (Wang Yinjun, Xu Xiangde)
2.13 Persistent heavy rainfall over southern China in June 2010: Evolution of synoptic systems and effect of heating of the Tibetan Plateau
Persistent heavy rainfall occurred over southern China during June 2010, with a magnitude comparable to that of June 2008 and exceeding that of other recent years. June 2010 was characterized by frequent occurrences of low-value systems in the middle and low troposphere between the Tibet an Plateau (TP) and the lower reaches of the Yangtze River, and a signifcantly intensifed West Pacifc subtropical high (WPSH), leading to more northward-located low-level anomalous wind convergence and rain bands compared to June 2008. Analyzing the four successive persistent heavy rainfall events over southern China during 14–24 June 2010, we found that the South Asian high, the middle-latitude trough and ridge, and the WPSH in the middle troposphere, as well as the shear lines and eastward-moving vortices in the lower troposphere, are the main synoptic systems that induced the persistent heavy rainfall. Moreover, an ensemble of convective-permitting simulations (CTL) was carried out using the WRF model for these rainfall events in June 2010. The ensemble mean successfully reproduces the observed evolution of precipitation and weather systems. Another ensemble of simulations (SEN) was carried out, which with identical to CTL except for the surface albedo over the TP and its southern slope being changed artificially to one. A comparison between CTL and SEN suggests that the surface sensible heating of the TP in CTL signifcantly affects the temperature distribution over the plateau and its surroundings. The thermal wind adjustment changes the atmospheric circulation and properties of synoptic systems from the lower to upper troposphere, which signifcantly intensifes the persistent heavy precipitation over southern China. Specifcally, at 200 hPa, anticyclonic and cyclonic anomalies are formed over the western and eastern plateau, respectively, which enhance the southward cold air intrusion along the eastern TP and intensifes the divergence over southern China. At 500 hPa, the ridge over the northern plateau and the trough over eastern China are strengthened, the southwesterly fows along the northwestern side of the subtropical high are intensifed, and the positive vorticity propagation from the plateau to the downstream is also enhanced signifcantly. At 850 hPa, low-pressure vortices are strongly developed and move eastward while the southwesterly low-level jet over South China coasts is intensifed in CTL, leading to stronger water vapor convergence and upward motion over the precipitation region (Fig. 4). (Luo Yali)
2.14 Correction of a satellite and rain-gauge merged precipitation dataset and analysis of the occurrence of short-duration heavy rainfall and heavy rainfall days over southern China
The quality of a satellite-rain gauge merged hourly gridded (0.1° by 0.1°) precipitation product is assessed by comparison with the quality-controlled hourly precipitation records from 1190 observation stationsover southern China during the warm season (April to October) of 2008–2013. The biases in the merged precipitation product are quantifed for four grades of precipitation intensity in six sub-regions, and used to correct the merged precipitation product for each region. The corrected precipitation product is analyzed to investigate the temporal and spatial characteristics of heavy rainfall days (>24 mm day-1) with and without the occurrence of short-duration heavy rainfall (>15 mm h-1). The main results are as follows. (1) Compared to the rain gauge records, the merged precipitation dataset can better refect the detailed spatial characteristics of short-duration heavy rainfall occurrence under distinctive terrain conditions; however, it underestimates the rainfall intensity and should be corrected according to the precipitation intensity over each region to reduce the biases properly. (2) The short-duration heavy rains make up about 16% of the total rainfall amount, regardless of their small contribution (1%) to the total rainfall occurrence. Short-duration heavy rainfalls occur most frequently over the coastal regions of South China and Hainan Island, and several secondary centers are located over the central Jiangnan Region, the coastal regions of eastern Zhejiang Province, the Sichuan Basin, and southern Guizhou Province. The short-duration heavy rains occur much more frequently during April–October than in the other months of the year. In decreasing order, the occurrence frequencies in June–August, April–May, and September–October shift toward smaller values. (3) The proportion of rainy days (>0.1 mm day-1) that include a short-duration heavy rainfall is <5‰. However, more than 68% of the heavy rainfall days contain short-duration heavy rainfall occurrences. Moreover, more than 60% of the short-duration heavy rains occur on heavy rainfall days. The temporal and spatial characteristics of the heavy rainfall days with short-duration heavy rainfall are quite similar to those of the short-duration heavy rainfall occurrences, while the characteristics of the heavy rainfall days without short-duration heavy rainfalls appear quite different. Heavy rainfall days are most common over the central Jiangnan Region and regions around the middle and lower reaches of the Yangtze River during April–August, and over regions around the Daba Mountains and southwestern Guangxi Province during September–October (Fig. 5). (Luo Yali)
2.15 Effects of the mountain-plains solenoid on the diurnal variation of warm-season precipitation over North China
Diurnal precipitation cycle numerical experiments using the Weather Research and Forecasting model are performed to examine the impact of a thermally-driven Mountain-Plains Solenoid (MPS) circulation on the diurnal variation in warm-season precipitation over northern China. We choose 17–24 June 2004 as a basis for our diurnal precipitation cycle simulation. The focus of the analysis is a 15-day simulation that used the 8-day average of the NCEP FNL gridded analyses at 00∶00 UTC as the initial condition, and the 8-day averages at 00∶00 UTC, 06∶00 UTC, 12∶00 UTC, and 18∶00 UTC as lateral boundary conditions (with diurnal variation only). Despite differences in the rainfall intensity and location, the control experiment successfully simulated the diurnal variation in warm season precipitation and southeastward propagation of the peak phase of the diurnal precipitation from the Yanshan–Taihang Mountain range to the North China Plains. The main upward branch of the MPS is primarily responsible for the southeastward movement of the rainfall belt that originated in the mountains. NOVAP (turning off the influence of evaporative cooling) and Fake-dry (turning off the infuence of latent heating and cooling) sensitivity tests are performed to study the role of latent heating release and cooling in maintenance and development of the MPS. In the low troposphere, the “cold pool” behind the main upward branch of the MPS resulting from vapor cooling when rain falls is responsible for the convective development and also pushes the southeastward movement of the main upward branch. (Bao Xinghua, Zhang Fuqing)
2.16 Cyclonic storm activity over the Bay of Bengal and its effect on precipitation in China
Tropical cyclones in both the western North Pacifc and the Bay of Bengal in the northern Indian Ocean can affect precipitation in China. However, research on the infuencing mechanism of the Bay of Bengal storms is lacking compared to that on typhoons. More attention has been paid to the study of cyclonic storms over the Bay of Bengal in the past year. Statistical and composite analyses show that there are two peaks in the Bayof Bengal storm activity, from April to June and from September to December. These peaks mainly affect the precipitation in Southwest China and the mid and lower reaches of the Yangtze River. The key mechanism for the impact of a storm is that a Southwest low-level jet between the storm and the western North Pacifc subtropical high can build up and transport water vapor from the Bay of Bengal to rainfall regions in China. Moisture forward tracking indicates that water vapor from storms enters Yunnan via the Indochina Peninsula and is then transported into the mid and lower reaches of the Yangtze River. Moisture backward tracking of precipitation areas also shows that the Bay of Bengal is a signifcant moisture source region.
The vast majority of the Bay of Bengal storms (about 98%) cannot move their central positions to China. However, some cloud clusters that split from the storms can move northward to the Tibetan Plateau or the Yunnan-Guizhou Plateau, which is one of the important ways that the storms over the Bay of Bengal lead to precipitation in China, based on statistical results from 2001 to 2011. The ability of storms to split cloud clusters and to transport water vapor to precipitation regions in China is closely related to changes in the storm structure. (Li Ying)
2.17 Effects of diabatic heating/cooling in the rapid flamentation zone on the structure and intensity of a simulated tropical cyclone
The effects of diabatic heating/cooling in the rapid filamentation zone (RFZ), within which inner rainbands are often active, on tropical cyclone (TC) structure and intensity are investigated based on idealized numerical experiments using a cloud-resolving TC model (TCM4). The results show that removal of heating (cooling) in the RFZ would reduce (increase) the TC intensity. Diabatic heating in the RFZ plays an important role in increasing the inner-core size, whereas diabatic cooling tends to limit the increase in inner core size or even reduce the inner core size of a TC (Fig. 6). Removal of both diabatic heating and cooling in the RFZ greatly suppresses the activity of inner rainbands, but leads to the quasi-periodic development of a convective ring immediately outside the inner core. A similar convective ring also develops in an experiment with the removal of diabatic heating only in the RFZ. With diabatic cooling removed only in the RFZ, an annularhurricane-like structure arises with the outer rainbands largely suppressed (Fig. 6). (Li Qingqing, Duan Yihong) 2.18 Identifcation of tropical cyclone extreme rainfall and its causes over Southeast China
Identifcation of tropical cyclone extreme rainfall over Southeast China has been completed. In summary, the distribution of tropical cyclone (TC) extreme precipitation during 1958–2012 was concentrated in the coastal northern, central, and southern parts of the region, which agrees well with the terrain of the area. This indicates that the terrain plays a very important role in the distribution of TC extreme precipitation over southeast China.
In addition, the project has also developed a TC track similarity area index (TSAI). The TSAI index has a clear physical meaning∶ for any two TCs, the area of the region enclosed by the two tracks, the line connecting the two starting points, and the line connecting the two end points is called TSAI; the smaller the value of the index, the more similar the two tracks. The TSAI index is simple, practical, and has good prospects for the future application. (Ren Fumin)
2.19 Numerical simulation of the rapid intensifcation of Typhoon Haikui (1211) over the offshore area of China
Forecasting of the rapid intensification of tropical cyclones over offshore regions remains unresolved. The non-hydrostatic WRF (weather research and forecast) model was used to study the rapid intensifcation of Typhoon Haikui (1211) over offshore China. The simulated results indicate that a remarkable increase in low-level moisture transport toward the inner core and a favorable large-scale background feld with low-level convergence and high-level divergence play a key role in the rapid intensifcation of Typhoon Haikui. The latter can be an indicator of the rapid intensity change of Typhoon Haikui about 6 hours in advance. Furthermore,analysis shows that structural changes, including the outward extension of the eyewall, the increase of vertical ascending motion, the radial and tangential wind speeds, and the extension of the warm core range outward and toward the lower layer, contribute to the maintenance and development of typhoon intensity. (Zhang Shengjun)
2.20 A high-resolution simulation of Typhoon Saomai (2006): Low layer wind profile around its landing
Typhoon Saomai (2006) is well reproduced using the WRF-ARW system with a finest horizontal resolution of 1 km and a vertical resolution of 40 model levels, in which the lower levels are densifed. Based on the 1-km simulated data for Typhoon Saomai (2006), the wind structure in the lower levels (below 1500 m height over sea level or terrain) over the typhoon is analyzed. Strong vertical shear of horizontal wind speed is observed near the radius of maximum wind during the time that the typhoon remained over the sea. Two shear factors are defned, one for the high levels and the other for the low levels. Vertical profles of horizontal wind speed are categorized into four types according to the two shear factors, two of which are stronger in shear and belong to jet-type profles. In addition, their locations in the typhoon and the jet heights for the four type vertical profles of horizontal wind are analyzed. The possible causes of the two jet type profles are also analyzed and discussed. The results show that the changes in supergradient/subgradient wind in the vertical direction should be responsible for the jet-type profles, and the advection of angular momentum also plays an important role. However, no jet-type profle was detected after the typhoon landed. (Duan Yihong, et al.)
3 Numerical weather prediction and key techniques in numerical modeling
3.1 Development of a nonhydrostatic atmospheric model on a spherical quasi-uniform Yin-Yang grid
To satisfy the requirements of future numerical weather prediction, the numerical model must be free of polar singularity and computational diffculty for the high-latitude region. We therefore reconstructed the dynamic core of the non-hydrostatic GRAPES model on a quasi-uniform Yin-Yang grid, and improved its dynamics and computational methods by introducing full three-dimensional Coriolis forcing in the momentum equations. Long-term integration of the new core is carried out on the Yin-Yang grid, and preliminary verification is given for tests with and without topography. Idealized three-dimensional testing, including balanced flow, baroclinic wave, Rossby–Haurwitz wave, and mountain-induced Rossby wave (Fig. 7), confrms the success of non-hydrostatic model reconstruction, the correctness of the computational design, and the ability of this new core to deal with topography (Fig. 7). (Peng Xindong)
3.2 Calibration of numerical prediction using historical data and its application to medium- and short-term forecasting
Errors in numerical prediction can be calibrated using the difference in long-term model integration and corresponding historical data. Based on the conception of anomaly integration, numerical results from CAM3.0 for the cases “ice storm 2008” and “Yangtze food 1998” are corrected, in which the gridded ECMWF reanalysis is taken as historical data. Both winter and summer cases illustrate the improvement in the anomaly correlation coeffcient (ACC) and the root mean square error (RMSE) for the geopotential height at 500 hPa. The predictability, denoted by ACC > 0.6, is shown to extend for more than 1 day. The predictions of wind, temperature, and humidity are improved in all regions, especially in the tropical zone. The correction to short-term temperature prediction, a maximum of 4.5 K, is the most obvious in the winter case. Zonal mean temperature and relative humidity of the CAM3.0 model run and the corrected results are illustrated in Fig. 8, compared with the ECMWF reanalysis. Errors are much decreased after correction. The correction is found to be insensitive to model resolution (lower than T85) in low shortterm predictions (Fig. 8). (Peng Xindong)
3.3 The impact of cloud microphysics schemes on long-term precipitation simulations
Simulated regional precipitation, especially extreme precipitation events, and the regional hydrologic budgets over the western North Pacifc region during the period from May to June 2008 were investigated with the high-resolution WRF regional model with explicit cloud microphysics. The results show that the WRF simulations can reasonably reproduce the spatial distributions of daily mean precipitation and rainy days. However, the simulated frequency distributions of rainy days showed an overestimation of light precipitation, an underestimation of moderate to heavy precipitation, but a good representation of extreme precipitation. Moreover, the water vapor budget analysis indicates that heavy precipitation results mostly from stronger moisture convergence; whereas, in less convective periods, the precipitation is more influenced by surface evaporation. The simulated water vapor budgets imply the importance in the tropical monsoon region of cloud microphysics, which affect the atmospheric latent heating, large-scale circulation and, subsequently, the precipitation (Fig. 9). (Gao Wenhua)
3.4 A method for generating a probabilistic quantitative precipitation forecast from single-value forecasts
The daily precipitation records of 59 rain gauges over the Huaihe Basin and the ensemble mean forecasts of 24 h cumulative precipitation of the reforecast data generated by the Global Forecast System (GFS) during the period from 1 June 1981 to 31 December 2003 are employed to construct a probability forecast model that can generate an ensemble forecast based on a conditional meta-Gaussian distribution. The experiment to verify how well the model works is performed for four catchments of the Huaihe Basin. The results show that the root mean square error (RMSE) of the ensemble forecasts generated by the new method introduced here decreases remarkably for all catchments and seasons. In particular, the RMSE is reduced by 3.11 mm in the stream between Bengbu station and Hongze Lake in June. The brier skill score of the ensemble forecasts of the four catchments is between 0.16 and 0.61, suggesting that the ensemble forecasts can be used throughout the year. The error correction of probabilistic quantitative precipitation forecasting is not ingest historical archive of forecasts and observations to estimate model parameters, but the uncertainty assessment of forecasting is also quantitative (Fig. 10). (Zhao Linna)
3.5 Transplantation and application of a multi-scale food model
The Coupled Routing and Excess STorage (CREST) distributed hydrological model is a hybrid modeling strategy that was developed by the University of Oklahoma and NASA SERVIR (The Regional Visualization and Monitoring System) Project Team. The model has been moved and is now successfully running on computers in the State Key Laboratory of Severe Weather, Chinese Academy of Meteorological Sciences by the transformation and application team. The CREST model can use gridded precipitation datasets (e.g., satellitebased precipitation estimates, interpolated rain gauge observations, weather radar) and high-resolution satellite remote sensing DEM and land surface datasets. CREST simulates the spatiotemporal variation of water and energy fuxes and storage on a regular grid with a reasonable grid cell resolution. Hydrological processes can be obtained by CREST with 1/8° (~10 km) spatial resolution. This is the frst step toward constructing a realtime high-resolution food forecasting and monitoring system. As an important part of the decision-making system, the food and fash food forecasting system is extremely important for disaster mitigation in China (Fig. 11). (Zhao Linna)
猜你喜欢
成都信息工程大学学报(2022年4期)2022-11-18
今日农业(2022年3期)2022-11-16
全球定位系统(2022年3期)2022-09-04
成都信息工程大学学报(2022年3期)2022-07-21
气象科学(2022年1期)2022-06-01
长江科学院院报(2022年5期)2022-05-19
成都信息工程大学学报(2021年5期)2021-12-30
军事文摘(2021年20期)2021-11-10
黑龙江气象(2021年2期)2021-11-05
科学大众(2020年10期)2020-07-24