气候系统与气候变化研究进展
2013-07-05 16:44
中国气象科学研究院年报 2013年0期
气候系统与气候变化
Climate System and Climate Change
气候系统与气候变化研究进展
2013年,气候系统研究所在东亚季风变异机理、气候预测理论与方法、古气候模拟、气候系统模式研发以及极地气候研究方面获得了显著进展。
1 东亚季风变异机理
1.1 近百余年东亚夏季风和中国东部夏季温度的年代际变化
东亚夏季风和中国东部温度变化是中国气候研究的两个关键问题,但对于两者联系的认识尚存在不明确之处。IPCC(2007)报告的东亚夏季风指数自1920年代起有持续的减弱趋势, 几乎无年代际波动,意味着过去百年对应于中国增暖的是夏季风减弱, 但这有悖于大陆温度升高有利于海陆热力差异增大和季风增强的传统认识。研究过去百年间两者的对应关系发现,与IPCC(2007)报告不同,重新计算的东亚夏季风指数在1960年附近有峰值,在1920年代后表现出显著的年代际波动, 而非单纯的减弱趋势(图1a)。夏季风和东部温度序列在过去百余年里的相关系数并不显著,但11年滑动相关显示出两者在多数时期存在年际正相关,这反映了大陆温度升高加剧海陆热力差异的副热带季风形成机理;同时滑动相关系数存在较大波动,说明两者的联系较为复杂(图1b)。进一步研究发现,过去百年里, 东亚夏季风有3段减弱期和2段增强期, 东部温度有2段增温期和1段降温期(图1c), 两者的年代际趋势并无稳定对应, 而是有多种配置, 当夏季风和东部温度年代际趋势相同时, 两者相关系数总是明显增大或为显著正值, 反之则相关系数迅速减小或为负值,这解释了图1b中滑动相关系数的波动,说明年代际尺度上中国东部温度对夏季风的影响要弱于年际尺度,影响夏季风年代际变化的可能是更大时空尺度的热力变化(图1)。(林祥)
1.2 东亚夏季风的年代际趋势与东亚-太平洋的大尺度温度变化
研究发现,近地面温度可能影响东亚夏季风变化的关键区域包括中国中东部、日本附近的西北太平洋、贝加尔湖附近的亚洲中高纬地区和暖池附近的赤道太平洋地区等。这些关键区反映了东西向的海陆热力对比、南北向的东亚中纬度地区和赤道之间以及中纬度和高纬度地区之间的热力对比关系对东亚夏季风的影响,这些不同区域间热力对比变化对夏季风的影响非常复杂。进一步研究显示,1960年代前后东亚夏季风由增强向减弱的年代际转变,对贝加尔湖附近的亚洲高纬度地区近地面温度由变冷向增暖的年代际转变具有重要的影响。(林祥)
1.3 亚洲夏季风爆发前后热带大气季节内振荡结构和演变特征对比
利用高分辨率的卫星资料和其他观测资料,选择赤道东印度洋地区为参考区域对20~50天的大气季节内振荡(ISO)做位相演变分析,通过位相合成方法,详细描述了该地区ISO的产生、发展传播及其垂直结构等三维结构演变过程的普遍特征,并对其季节变化进行了讨论。合成结果显示,在北半球夏季ISO对流最初在赤道西印度洋生成,随后向东扩展增强。当ISO对流东移到达赤道东印度洋时对流降水最强,当对流降水开始减弱时,赤道东印度洋地区的对流开始出现向北和向南的经向扩展,向北的传播明显强于向南的移动。不同季节ISO对流初始生成的位相/时间和地理位置不尽相同,印度夏季风爆发前对流降水最初生成于赤道西印度洋,随着时间位相的演变,ISO对流有明显的东移特征;而季风爆发后,ISO对流比季风爆发前晚一个位相出现,同时季风爆发后的ISO对流主要表现出向北传播的特征。对海温的季节内振荡分量的分析显示,季风爆发前的海温异常同样比季风爆发后的强度和范围大。ISO对流异常在不同季节的活动特征反映了海表温度和低层水汽分布的季节变化。从地面风场及辐散/辐合场特征看,地面辐合对赤道西印度洋一个新对流异常的产生起了重要作用。另外,海气相互作用同样也对ISO的产生起到了促进作用。(齐艳军)
1.4 从小时尺度考察中国中东部极端降水的持续性和季节特征
相对于日降水量,小时尺度降水资料可以更准确地反映降水强度并描述降水过程,因而更适用于极端降水阈值的确定及其特性研究。利用广义极值分布估计中国321个站最大小时降水量的分布函数,确定了5年重现期的小时降水强度阈值。阈值的空间分布呈现出明显的地域差异,西北地区阈值偏低,华北地区、长江中下游地区、华南沿海地区和四川盆地西部地区为高阈值中心。取各站5年一遇极端降水事件对其持续性特征和季节特征进行分析发现,在沿海地区、长江流域和青藏高原东坡极端降水事件的平均持续时间较长(超过12 h);中国北部地区持续时间较短。在具有较大海拔落差的复杂地形区,极端降水事件较平原地区更快地发展到峰值。华南地区4月就可有极端降水事件出现,而中国北方地区要到6月底才出现极端降水;全国大部分地区的年最晚极端降水在8—9月,但沿海地区、大陆南端和西南地区南部的少数站点在10月以后仍有极端降水发生。(李建)
2 气候预测理论与方法
2.1 冬季海冰与后期夏季欧亚大气环流的关系
利用NCEP/NCAR和JRA-25再分析资料,分析了冬季格陵兰西部海冰密集度与之后夏季欧亚大陆中高纬大气环流之间的关联。研究发现,冬季海冰密集度与后期夏季500 hPa位势高度异常显著相关,而位势高度异常与欧亚型850 hPa风场变率相呼应且对欧亚大陆北部降水有显著影响。纽芬兰南部的春季大气环流异常,与冬春季持续的海冰密集度和北大西洋海温异常一起,成为连接冬季海冰密集度与后期夏季欧亚大陆北部大气环流异常的桥梁。该研究结果表明,冬季海冰或许可以作为预测后期夏季欧亚大陆大气环流和降水变化的前期预测因子。(武炳义)
2.2 亚洲-太平洋涛动在中国南方地区冬季降水预测中的应用
亚洲-太平洋涛动(APO)具有很好的秋冬持续性,上一年10月的APO异常可持续至当年1月,影响1月东亚南部及其邻近海域的低层风场,进而调节中国南方地区降水。因此,前期10月APO与中国南方地区1月降水异常具有显著联系,可以作为指示中国南方地区降水多寡的一个前兆因子。(刘舸)
2.3 东亚冬季风在不同纬度上的差异
东亚冬季风在不同纬度上存在较大的差异。东亚中纬度和低纬度冬季风异常对应着中国冬季不同的温度和降水分布特征。在探讨冬季气候时,不能仅分析整个纬度上东亚冬季风的强弱变化,还应该综合考虑东亚中纬度和低纬度冬季风各自的影响。而且不同纬度的东亚冬季风对应着不同的大气环流特征,与之相联系的海温异常也不尽相同。在对东亚冬季风进行预报时,应尤为注意。(刘舸)
3 古气候模拟
3.1 模拟的过去130 ka古里雅冰芯δ18O记录的气候含义及其对海气系统的指示意义
采用中等复杂的UVic_ESCM地球系统气候模式,在太阳轨道和温室气体强迫下,以加速因子为50年模拟了过去130 ka古里雅冰芯δ18O记录的地理和季节气候含义及其对海气系统的指示意义。模拟8、9月的古里雅气温再现了古里雅δ18O记录的21 ka的岁差周期和43 ka的轨道倾角周期,并和它们同步变化,此外,古里雅δ18O记录还可能指示北半球8、9月的气温。岁差冷暖位相的差异存在两个异常模态,第1个模态呈现为地表气温和海表温度向极地增加,这可能与由岁差位相和轨道倾角同位相叠加造成的北半球太阳入射辐射增加有关。第2个模态呈现为地表气温和海表温度向赤道增加,这可能与岁差和轨道倾角反位相叠加造成的北半球极地入射辐射减少有关。此外,北大西洋的海温和古里雅8、9月的气温密切相关,其中古里雅地区的降水可能扮演了桥梁的作用。(肖栋)
3.2 晚白垩世(66 Ma)东亚气候以及CO2浓度对东亚气候影响的数值模拟
利用美国国家大气研究中心(NCAR)的全球气候系统模式CCSM2结合重建的古地理资料,研究了晚白垩世(66 Ma)东亚的古气候特征以及CO2浓度对东亚气候的影响。模拟结果表明,66 Ma时期东亚地区大范围盛行的风向和气压系统随季节有显著变化,由此可以推断东亚地区当时存在季风环流。此外,在当时偏暖的背景下,东亚冬季风和夏季风呈现出一致的变化特征,即冬季风和夏季风都比现代强。66 Ma时期与西太平洋相邻的大陆东岸降水比现代多,而在中纬度的内陆地区降水则偏少。虽然雨带的分布与现代情况相似,但在陆地上没有像现代东亚夏季梅雨带一样的多雨带,这说明青藏高原在现代东亚夏季梅雨形成中的重要性。此外,模拟的66 Ma时期东亚地区气候要比现代温暖,模拟的年平均温度与地质证据估计的温度比较接近。
在66 Ma时期,CO2浓度的降低引起东亚地区的气候发生显著的变化。东亚地区冬季风和夏季风在减弱。大部分地区,年平均温度降低,年总降水量减少。地表水分收支在东亚大陆的东部都是以负值为主,地面失去水分而变干燥,其中30°N以南的大陆沿岸最显著;与此相反,在东亚大陆的内陆地区,水分收支差异以0~0.5 mm/day的正值为主,地表得到水分而变潮湿。(陈军明)
4 气候系统模式研发
在气科院基本科研业务费专项的支持下,气候系统研究所模式从2009年起在德国马普气象研究所的大气模式ECHAM5 和美国地球物理流体动力学实验室(GFDL)的海洋模式MOM4基础上成功发展了一个包括大气、陆面、海洋和海冰的气候系统模式。
2010年底至2011年初气候系统模式的早期版本建立完成。该版本模式大气分辨率为T42L19(水平方向约2.8°,垂直19层,最高层到10 hPa),海洋模式采用3极格点,分辨率为2°×(1/3°~2°),垂直方向30层,各子模式通过GFDL的FMS耦合器耦合。陆面采自ECHAM5陆面过程。海冰模式为GFDL的SIS模式。针对ECHAM5模式垂直扩散采用半隐式方案这一特点,项目组发展了一套新的守恒的通量计算和插值算法,保持了海-气和冰-气界面的能量守恒,确保模式的稳定积分。该版本模式稳定积分超过400年,奠定了模式下一步发展改进的基础。
在早期版本的基础上,2012年通过提高大气模式垂直分辨率(从19层提高到31层)以及改进大气参数化方案,成功去除模式之前版本所需的通量订正项,实现模式自由耦合情况下的长期积分。该版本模式(T42L31×2degL30)模拟的海温、降水以及ENSO等特征较之前通量订正版本得到明显改善,显示了对ENSO季风关系的良好模拟性能及其对我国气候预测的潜在应用前景。
2013年模式在以下几个方面取得了进展:
(1) 改进海-陆边界格点的通量算法,保证海-陆边界格点的通量守恒,从而改善了大气顶能量不平衡现象,模式积分过程中海温和海冰的长期变化趋势得以减弱。
(2) 海洋模式分辨率提高至1°×(1/3°~1°),垂直50层,大气模式分辨率提高至T63L31(水平方向约2°),模式现可提供T42L31×1degL50和T63L31×1degL50两个版本运行。
(3)通过提高海洋模式分辨率、改进海-陆交界格点通量计算以及优化大气参数方案,新版本模式模拟的赤道太平洋温跃层季节循环得以改善。在前一版本中,模式模拟的赤道东太平洋温跃层深度在夏季无观测所显示的加深现象;而在新版本模式中,赤道东太平洋温跃层加深现象得到再现。得益于温跃层季节变化模拟的改善,模式对ENSO季节锁相特征的模拟得到显著改进。前一版本模拟的Nino3指数在冬季和夏季出现双峰值,与观测不符;而在新版本中,Nino3指数在冬季变率最大,与观测一致。鉴于ENSO对东亚气候的显著影响,这使得模式应用于ENSO以及东亚气候的季节预测成为可能。
(4)新版本模式中热带南印度洋夏季降水中心的模拟得到明显改善。如图2所示,两个版本模式均可以很好地再现全球夏季主要的降水中心及其分布,特别是对于亚澳季风区的夏季降水,模式表现了突出的模拟性能。对比两个版本模式可以发现,热带南印度洋降水中心在新版本模式中得到了再现,其位置和强度均与观测相符。
(5)在大气模式中加入了海冰模式隐式方案计算的通量余项并改进了反照率算法,完善了模式的能量守恒性质。
经过近几年的发展,气科院气候系统模式的框架已基本建立,基本具备参加CMIP模式评估的能力,模式模拟结果所显示的优良模拟性能表明该模式有望在今后的气候科研以及业务中发挥重要作用(图2)。(容新尧)
5 极地气候研究
5.1 南极冰盖中山站至冰穹A考察断面上降雪中氢氧稳定同位素比率的分布特征及其气候指示意义
在中国南极第24次考察期间,沿中山站至冰穹A(Dome A)长约1250 km的考察路线上,采集了表层降雪样品,测定其中的氢氧稳定同位素比率;沿考察断面通过观测得到14个点的年均气温,使用多重回归-克里格法模拟了整条断面上年均气温的分布。由此计算得出该区域δD和表面年均气温之间的关系为(6.4±0.2)%/℃,与东南极平均值非常接近。Dome A地区的过量氘特别高,远高于东南极平均值,说明该区域水汽来源于南半球低纬大洋表面。使用ECHAM5-wiso模型模拟了该区域降雪中的同位素比率,发现模型较好地模拟了δD,但是高估了δ18O的水平(图3),进而低估了过量氘的水平。导致模型模拟不准确的主要原因有两个:一是模型对水汽传输路径判断不准确,二是微观过程(如平流层沉降过程)未加考虑。通过次级分馏模型检验了断面上氢氧稳定同位素比率的空间分布,结果显示出3段不同的特征,其分界分别在海拔1900 m和2850 m、距海岸185 km和830 km处。这2个分界点揭示了考察断面有3个不同的水汽来源(图3)。(丁明虎)
5.2 南极冰盖物质平衡
两极冰盖作为全球气候系统的冷源,在气候变化中起到放大器和驱动器的作用,其储存的水,对全球海平面变化、水循环、大气热动力循环等造成巨大影响。过去几十年,通过多国科学家的努力,北极格陵兰冰盖在气候变化下的稳定性已经得到了较为清晰的结论;而南极冰盖特别是东南极冰盖的稳定性,及其对气候变化的响应过程,一直是争论的焦点,因此IPCC AR4将探明南极冰盖物质平衡作为一个指导性方向。本研究汇总了最近10年有关南极冰盖物质平衡的研究并综合前人研究结果,给出了较为准确的结论:西南极冰盖的东部正在减薄,西部却在增厚,南极半岛物质总量损失加剧;东南极冰盖的研究有较大的争议,但大部分研究都认为东南极冰盖物质正处于负平衡状态,它能否在当前全球变暖背景下保持其较为稳定的状态仍然没有定论。目前研究南极物质平衡主要依靠卫星遥感手段,而涉及未来预估的模型模拟准确性较差,未来应针对该方向加强工作。(丁明虎)
5.3 南极中山站地区大气臭氧特征的观测研究
极地大气臭氧变化是全球变化研究的重要内容,也是影响全球气候变化的重要因子。利用第4次国际极地年(IPY)期间我国南极中山站和相邻澳大利亚DAVIS站空基大气臭氧探空和探空、南极中山站地基Brewer臭氧总量和地面臭氧观测以及天基卫星遥感TOMS反演结果等资料,对南极中山站上空大气臭氧总量、地面臭氧和大气臭氧垂直分布的时间变化特征,以及中山站上空臭氧变化的长期变化趋势和特征参数等进行了诊断分析研究,讨论了大气臭氧垂直分布与大气动力结构关系,研究了春季南极臭氧洞期间上对流层-下平流层相互作用的基本过程。结果表明,春季平流层下部臭氧的严重损耗,与极夜过后平流层低温条件和极地平流层冰晶云表面消耗臭氧的光化学过程有密切关系。大气臭氧和温度的垂直结构及季节变化特征,对春季南极臭氧洞的形成和发展具有重要意义。目前只是在南极春季出现了臭氧洞,北极并没有出现过臭氧洞。在当前大气环境被污染的情况下,极地大气臭氧亏损的程度将更多地随大气环流,特别是极地涡旋中的低温状况而发生变化。
利用南极中山站大气监测站2008年全年地面臭氧连续观测资料,分析了地面臭氧的季节变化特征及本底浓度与风的关系。 地面臭氧浓度与紫外辐射(UVB)呈显著的负相关,臭氧损耗事件的发生与低温和站区北部海冰上的溴化物浓度高值区有密切相关。
利用台站观测的南极臭氧资料和NCEP/NCAR再分析资料,分析了南极臭氧近年来的变化特征和影响因子,探讨了南极臭氧洞期间中山站臭氧突变过程与大气动力的作用。结果显示,平流层氯和溴的卤化物当量(EESC)和平流层温度是影响南极臭氧洞面积的关键因子。EESC的年代际变化与臭氧变化趋势相似,臭氧的年际变化与平流层温度关系密切。(陆龙骅,卞林根)

图 1 (a)东亚夏季风指数(蓝色虚线)和中国东部夏季温度指数(红色虚线)及其年代际变化(对应颜色粗线);(b)夏季风和温度指数的11年滑动相关系数;(c)根据分段线性拟合法确定的夏季风(蓝色)和温度(红色)指数的年代际趋势变化Fig. 1 (a) East Asian summer monsoon index (blue dashed line), eastern China summer temperature index (red dashed line) and their decadal variation; (b) the 11-year running correlation coeffcient between East Asian summer monsoon index and eastern China summer temperature index; (c) changes in decadal trends of East Asian summer monsoon index (blue) and eastern China summer temperature (red) index
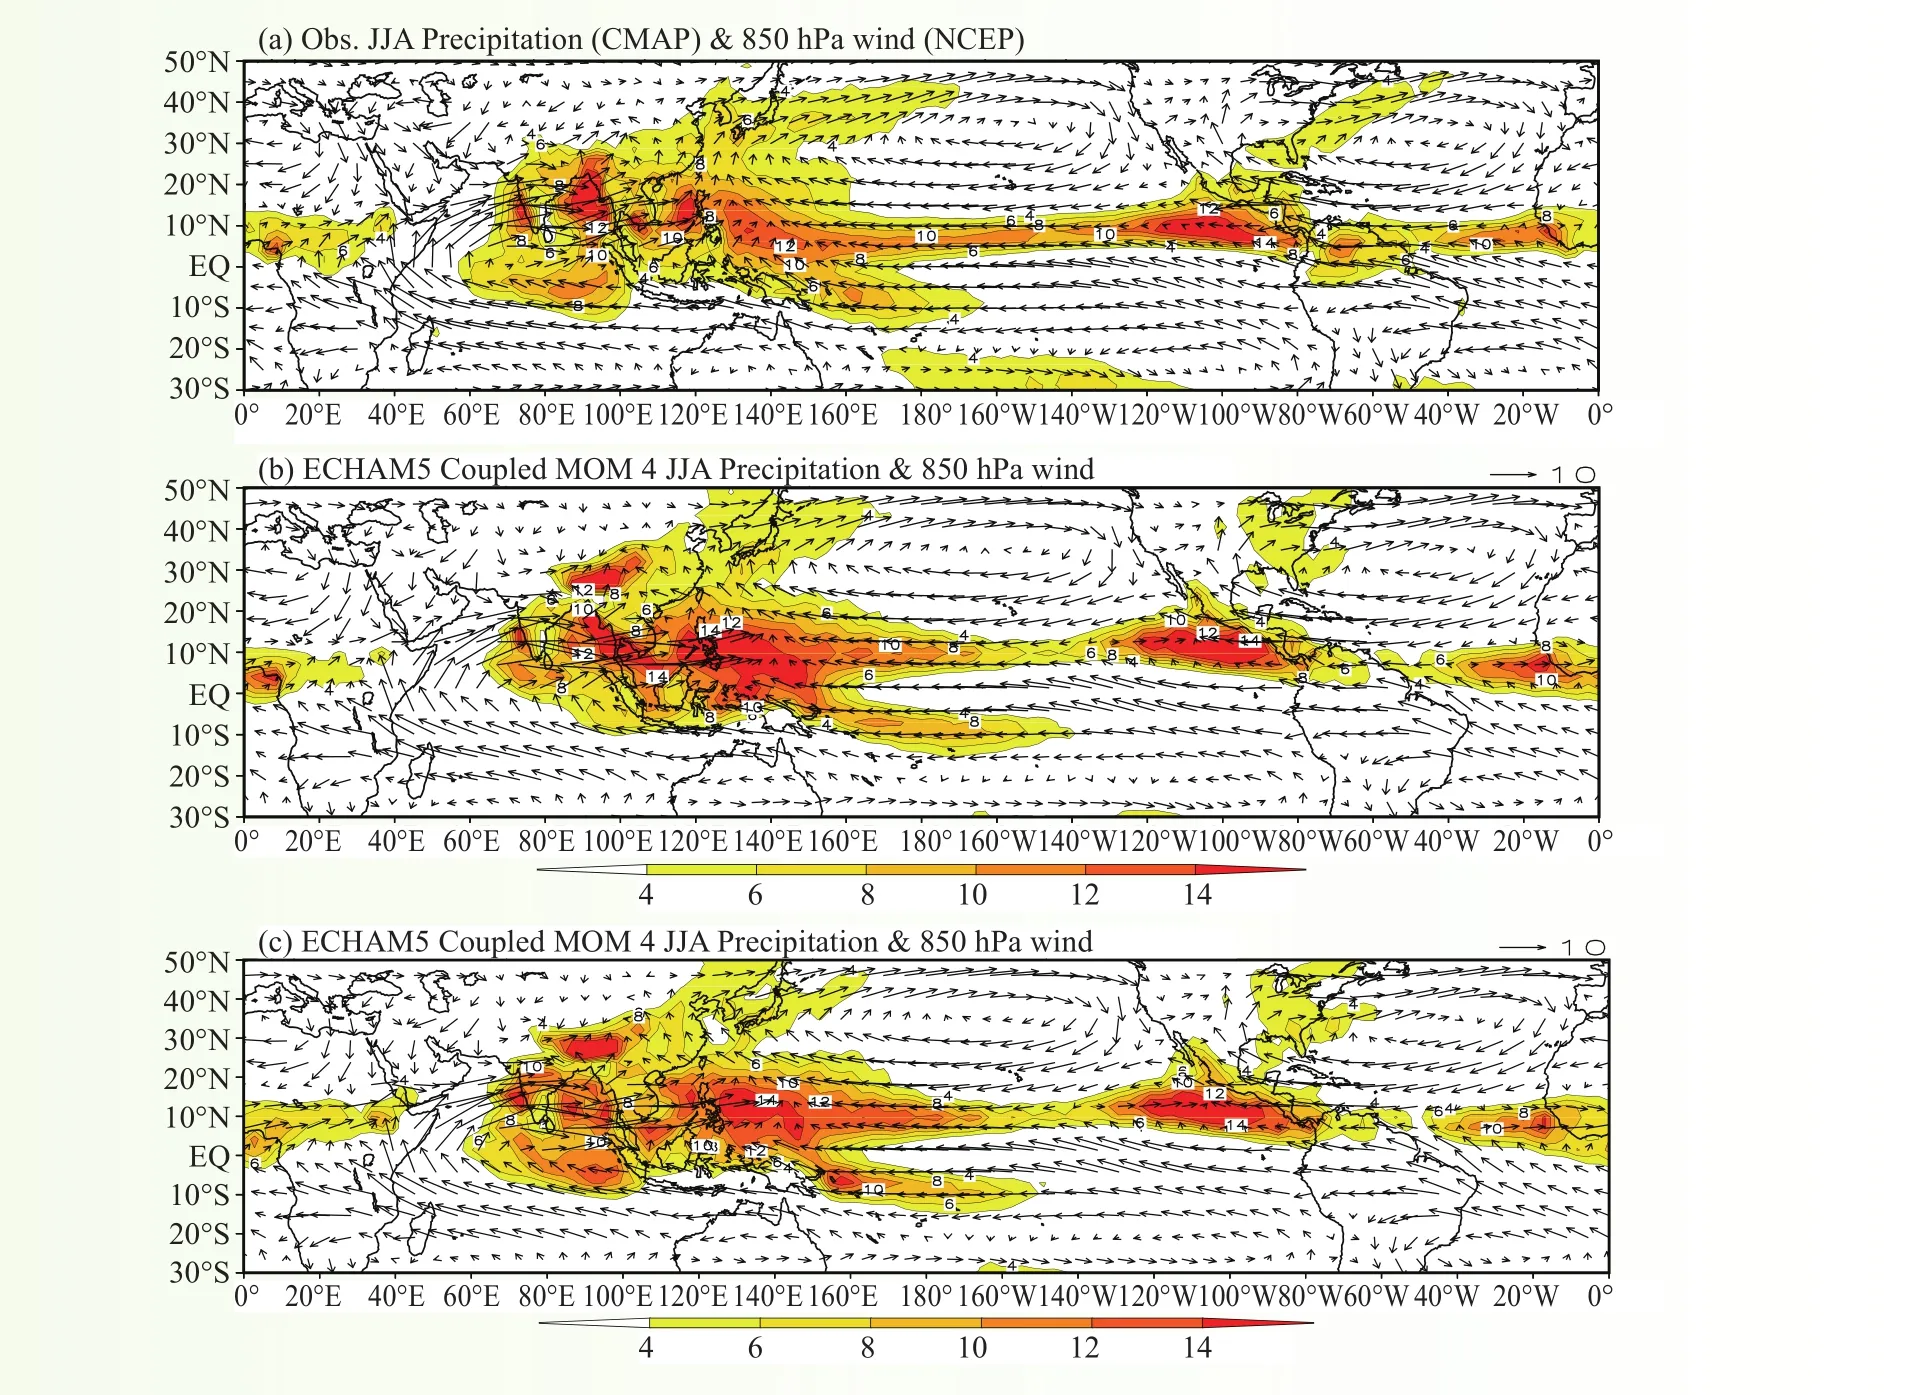
图 2 多年夏季平均降水(填色)和850 hPa风场(矢量)分布:(a)观测;(b)前一版本(T42L31×2degL30);(c)新版本(T42L31×1degL50)(风场单位:m/s;降水单位:mm/day;观测降水取自CMAP数据,850 hPa风场取自NCEP/NCAR 再分析资料)Fig. 2 Long-term mean JJA precipitation (shaded, unit∶ mm day-1) and 850 hPa wind (vector, unit∶ m s-1) from∶ (a) Observations; (b) the previous version (T42L31×2degL30); (c) new version (T42L31×1degL50). The observed precipitation is derived from the CMAP data, and the 850 hPa wind from the NCEP/NCAR reanalysis

图 3 降雪中实测同位素比率和ECHAM5-wiso模型模拟结果对比Fig. 3 The comparison of ECHAM5-wiso simulation with the in situ measurement
Progress in Climate and Climate Change Research
In 2013, the Institute of Climate System has achieved remarkable improvements in the felds of (1) the variability and mechanism of the East Asian monsoon; (2) theory and methodology of climate prediction; (3) palaeoclimate modeling; (4) the development of a climate system model; and (5) polar climate.
1 Variability and mechanism of the East Asian monsoon
1.1 Decadal variability of the EASM and SAT in eastern China
The East Asian summer monsoon (EASM) and surface air temperature (SAT) in eastern China are essential to understanding China’s climate; however, some questions remain regarding their relationship. As reported in the IPCC (2007), the EASM has weakened since the 1920s, without noticeable decadal variability, implying a connection between the on-land warming in eastern China and the weakening EASM. This contradicts the traditional concept that increasing temperature on land should intensify the land–ocean thermal contrast and strengthen the EASM. Our research has identifed some differences from the 2007 IPCC report, i.e., the recalculated EASM index (EASMI) exhibited signifcant decadal variability, with a peak near 1960 (Fig. 1a). The correlation, derived from an 11-year-running window, is signifcantly positive for most of the time period between 1880 and 2004, indicating a relationship between warming (cooling) in eastern China and strengthening (weakening) the EASM. However, some fuctuation exists for the correlation coeffcient, with the correlation insignifcant for the entire time span (Fig. 1b). During 1880–2004, there were three weakening periods and two intensifying periods for the EASM, whereas for the SAT in eastern China, two warming and one cooling period were recorded (Fig. 1c). When the EASMI and SATI shared a similar decadal trend, their correlation coeffcient was signifcantly positive or increased sharply, otherwise the coeffcient was negative or decreased. This explains the fuctuation of the correlation between the two. It should be noted that the decadal abrupt transition between these two indices does not concurrently occur. As such, there is no direct relationship between their trends, which implies that the key factors infuencing the EASM are more complex than merely the SAT in eastern China (Fig. 1). (Lin Xiang)
1.2 Decadal trend of the EASM and SAT in Asia-Pacifc regions
Local thermal conditions in some key regions of the Asia-Pacific may significantly influence the East Asian summer monsoon (EASM); these include middle-eastern China, the northwest Pacifc, the high latitude region near Baikal Lake, and the central tropical Pacific near the warm pool, which represents the thermal contrast between land and ocean, high latitude and latitude, and middle latitude and tropical zones. Further studies indicate that the decadal transition of the EASM occurring around 1960 might be attributable to significant transition of the surface air temperature (SAT) in the high latitude zone near Baikal Lake. (Lin Xiang)
1.3 Comparison on the structure and evolution characteristics of intraseasonal oscillations before and after onset of the Asian summer monsoon
We compared the structure and evolution characteristics of the intraseasonal oscillation (ISO) over the tropical Indian Ocean, before and after the Indian summer monsoon onset using high-resolution satellite and other observational data. A time series of 20- to 50-day fltered precipitation rates averaged over the eastern equatorial Indian Ocean (EEIO) was used as a reference to select strong ISO cases and construct composites of ISO behaviors over the tropical Indian Ocean. We focused on general characteristics, including the vertical structure of ISO during its life cycle, which comprises the initiation, development/propagation, and the decayphases of ISO precipitation anomalies among others. Differences in ISO-evolution features before and after the monsoon onset were compared and discussed. The composite showed that ISO precipitation anomalies frst appear in the western equatorial Indian Ocean, subsequently intensifying and expanding eastward along the equator. Then, these positive precipitation anomalies propagate northwestward and southwestward after the initial rain band reaching the EEIO. The northern branch is substantially stronger than the southern one. The timing and location of initial ISO precipitation anomalies after monsoon onset vary from those before monsoon onset. Before onset of the monsoon, the positive ISO precipitation anomalies initiate in the western equatorial Indian Ocean during Phase two and then propagate eastward along the equator. These precipitation anomalies initiate one phase later after the monsoon onset, and their propagation has a much more pronounced northward component in the EEIO. Anomalies in both ISO precipitation and sea surface temperature are of greater amplitude and larger area prior to the monsoon onset compared to following its after onset. Variations in the evolution of ISO precipitation anomalies before and after monsoon onset refect the differences in the background distributions of sea surface temperature and low-level specifc humidity. Surface wind convergence and air–sea interactions play a critical role in initiating each new ISO cycle. (Qi Yanjun)
1.4 Duration and seasonality of extreme rainfall (hourly rate) in the central-eastern part of China
The hourly rainfall rate, compared to total daily rainfall, more accurately represents rainfall intensity and process, and thus is a more suitable measure for the study of extreme rainfall events. The distribution functions of annual maximum hourly rainfall amount at 321 stations in China were quantified by the generalized extreme value distribution, and the threshold values of hourly rainfall intensity for a fve-year return period were estimated. Spatial distribution of the threshold indicates signifcant regional differences, with low values in northwestern China and high values in northern China, the mid and lower reaches of the Yangtze River valley, the coastal areas of southern China, and the Sichuan basin. The duration and seasonality of extreme precipitation events with five-year return periods were further analyzed. The average duration of extreme precipitation events exceeded 12 h in coastal regions, the Yangtze River valley, and on eastern slopes of the Tibetan Plateau, however, the duration in northern China was relatively short. Extreme precipitation events develop more rapidly in mountainous regions with large elevation differences, relative to events in fat plain areas. There are records of extreme precipitation occurring as early as April in southern China, whereas in northern China, extreme rainfall does not occur until late June. At most stations in China, the latest extreme precipitation in the year happens in August–September. Extreme rainfall later than October can be found only at a small number of stations in coastal regions, the southern end of the Asian continent, and the southern part of southwestern China. (Li Jian)
2 Theory and methodology of climate prediction
2.1 The relationship between winter sea ice and summer atmospheric circulation over Eurasia
Using NCEP/NCAR reanalysis and Japanese 25-year Reanalysis (JRA-25) data, this paper investigates the association between winter sea ice concentration (SIC) to the west of Greenland and the ensuing summer atmospheric circulation over the mid to high latitudes of Eurasia. We found that winter SIC anomalies were signifcantly correlated with ensuing summer 500 hPa height anomalies, which in turn dynamically corresponded to the Eurasian pattern of 850 hPa wind variability and significantly influenced the summer rainfall variability over northern Eurasia. Spring atmospheric circulation anomalies to the south of Newfoundland, which were associated with persistent winter–spring SIC and sea surface temperature (SST) anomalies in the North Atlantic, acted as a bridge linking winter SIC and summer atmospheric circulation anomalies over northern Eurasia. The implication of these results is that the winter SIC to the west of Greenland is a possible precursor for summer atmospheric circulation and rainfall anomalies over northern Eurasia. (Wu Bingyi)
2.2 An application of the Asian-Pacific Oscillation (APO) in predicting winter precipitation over southern China
The APO is a highly persistent autumn–winter event. Specifcally, the anomalous signal of the October APO is often maintained until the following January. Consequently, it may cause low-level winds over the southern part of East Asia and its adjacent oceans, and as a result modulate precipitation over southern China during January. As such, the APO index during the preceding October is significantly related to January precipitation over southern China, and can therefore be considered as an important precursory factor. (Liu Ge)
2.3 Differences of the East Asian winter monsoon between mid-high and low latitudes
The East Asian winter monsoon (EAWM) shows distinct differences between mid-high and low latitudes. The variations of mid-high and low latitudinal EAWMs correspond to different distributions of anomalous temperature and precipitation over China, respectively. Thus, to comprehensively understand the winter climate variations over East Asia, in addition to the EAWM strength across all (high, mid, and low) latitudes, the respective effects of the mid-high and low latitudinal EAWMs must be taken into account. For the variations of the EAWMs at different latitudes, related atmospheric circulation and sea surface temperature anomalies also differ. These variables should be comprehensibly understood when predicting the EAWM and associated winter climate over East Asia. (Liu Ge)
3 Palaeoclimate modeling
3.1 Modeling the climatic implications and indicative senses of the Guliya δ18O temperature proxy record for the ocean–atmosphere system during the past 130 ka
Using an intermediate-complexity UVic Earth System Climate Model (UVic Model), the geographical, seasonal implications and indicative senses of the Guliya temperature proxy found in the Guliya δ18O ice core record (hereinafter, the Guliya δ18O-temperature proxy record) were investigated under time-dependent orbital and CO2forcings, with an acceleration factor of 50 over the past 130 ka. The results reveal that simulated August–September Guliya surface air temperature (SAT) reproduced the 21 ka precession and 43 ka obliquity cycles of the Guliya δ18O-temperature proxy record, showing an in-phase variation with the latter. Moreover, the Guliya δ18O-temperature proxy record may also be an indicator of the August–September Northern Hemispheric (NH) SAT. Two anomalous patterns in SAT and sea surface temperature (SST) corresponded to the difference between the extreme warm and cold phases of the precession cycle in the Guliya August–September SAT. The frst anomalous pattern showed increases of SAT and SST toward the Arctic, which was potentially associated with an increase of NH incoming solar radiation caused by the in-phase superposition between precession and obliquity cycles. The second anomalous pattern involved increases of SAT and SST toward the equator, possibly due to a decrease of incoming solar radiation over the NH polar resulting from the anti-phase counteraction between precession and obliquity cycles. The summer (winter) Guliya and NH temperatures were higher (lower) in warm phases of the August–September Guliya than in cold phases. Moreover, in August–September, the Guliya SAT was closely related to the North Atlantic SST, wherein the Guliya precipitation might act as a “bridge” linking the Guliya SAT and the North Atlantic SST. (Xiao Dong)
3.2 Modeling East Asian climate and impacts of atmospheric CO2concentration during the Late Cretaceous (66 Ma)
Utilizing the Community Climate System Model version 2 from the National Center for Atmospheric Research (NCAR) and the reconstructed paleogeographic data, we simulated East Asian climate in the Late Cretaceous (66 Ma) and investigated the impacts of atmospheric CO2concentration on climate. The simulations showed that the large-scale pressure systems and prevailing wind directions exhibited remarkable seasonalvariation over East Asia, which indicated a monsoon feature over East Asia at 66 Ma. The East Asian winter and summer monsoons had a synchronous variation, that is, a strong (weak) winter monsoon accompanied a strong summer (weak) monsoon. In 66 Ma, there was more precipitation over the eastern coasts of Asia and less in the midlatitudes of inland areas. However, there was no Meiyu rain belt over land in the East Asian subtropics, similar to the present climate conditions. Moreover, the simulated Cretaceous climate over East Asia was warmer relative to the present day. Annual mean surface air temperature was higher over Asia at that time and closer to the estimation from geological evidence. During the Late Cretaceous, when atmospheric CO2concentration was reduced, the East Asian climate signifcantly changed, with weaker winter and summer monsoons over East Asia. The annual mean surface air temperature and annual total precipitation decreased for most land and ocean areas. The negative difference of surface water budget appeared mainly in the eastern part of East Asia, indicating a drier soil surface, whereas positive differences appeared in the midlatitudes of central western Asia, suggesting a wetter soil surface. (Chen Junming)
4 Development of climate system model
Under the support of the Basic Research Fund of the Chinese Academy of Meteorological Sciences, and through years of effort since 2009, the Institute of Climate System has successfully developed a climate system model, which consists of atmosphere, land, ocean, and sea ice components. This model was based on the Max-Planck Institute for Meteorology atmosphere model ECHAM5 and the Geophysical Fluid Dynamics Laboratory (GFDL) ocean model MOM4.
An initial version of the climate system model was completed in late 2010 to early 2011. A T42 resolution was used for the atmospheric model ECHAM5, with 19 vertical levels extending from the surface to 10 hPa. The ECHAM5 land model is used for the land component, sharing the same grid as the atmospheric model. A tripole grid was adopted for the oceanic model, with 30 unequal vertical levels. The zonal resolution of the ocean model was 2° and the meridional resolution varied poleward from 1/3° on the equator to 2° in middle and high latitudes. GFDL FMS Sea Ice Simulation (SIS) was used as the sea ice component and the land, atmosphere, ocean, and sea ice models were coupled via the GFDL FMS coupler. For the sake of the implicit scheme of vertical diffusion in the ECHAM5 model, an algorithm was developed to calculate the fuxes based on the interpolation algorithm of the FMS coupler and the flux algorithm of ECHAM5. This algorithm is capable of conserving the air–sea–ice interface fuxes; thus, effectively ensuring the long-term integration of the climate system model. This version of the model has been stably integrated over 400 years, which builds a consolidated base fundamental for the climate system model development.
In 2012, by increasing the vertical resolution of the atmospheric model (from 19 levels to 31 levels), as well as improving the atmospheric parameterization scheme, we successfully removed the flux correction term applied in the early version. This version (T42L31 × 2degL30) showed notable improvement on SST, precipitation, and ENSO features as well as the ENSO-monsoon relationship simulations, which can be potentially applied in the climate prediction of China.
In 2013, encouraging progress was achieved for the climate system model in the following areas∶
(1) An improved land-sea boundary fux algorithm ensures fux conservation on land-sea boundary grids. As a result, imbalances at the top of the atmosphere and the long-term trend in sea surface temperature and sea ice concentration are largely reduced.
(2) The ocean model resolution was increased to 1° × (1/3°–1°) with 50 vertical levels. The resolution of the atmospheric model was increased to T63L31. The coupled model can now be confgured by a T42L31 or T63L31 atmospheric resolution.
(3) Thanks to improvements in ocean model resolution and the land-sea flux algorithm as well as the atmospheric parameterization scheme, the new version exhibits significant improvements on the equatorial thermocline seasonal cycle and ENSO phase locking. In the previous version, deepening of the easternequatorial Pacifc thermocline during summer was absent. However, in the new version, this deepening was realistically reproduced. Due to improvements of the thermocline seasonal cycle, the unrealistic result of double peaks of Nino3 index seasonal variance, appearing in both winter and summer seasons in previous versions, was largely eliminated, with a maximum value occurring in winter. Given the signifcant impact of ENSO on the East Asian climate, the improvement of the ENSO simulation suggests promising application of the model for ENSO forecasting and seasonal climate prediction.
(4) The tropical summer rainfall center in the southern Indian Ocean was also well reproduced. As shown in Fig. 2, both versions can capture the main feature of the global summer rainfall, especially for the Asian–Australian summer monsoon rainfall region. However, the rainfall center in the tropical South Indian Ocean was found to be more realistically reproduced in the new version, with both the location and strength more consistent with observational data.
(5) The latest version includes the residual ice–air fux due to the addition of the implicit calculation of ice model into the atmospheric model and the optimized albedo calculation, which improved the conservation property of the model energy. As a result of several years of continuous development, the major framework of the CAMS climate system model has been established. This model has shown a capability to participate in the assessment of CMIP. Preliminary simulations by the model display promising performances in climate variability and it is expected that the model will play an important role in climate research and operational applications (Fig. 2). (Rong Xinyao)
5 Polar climate
5.1 Climatic significance of stable isotopes in surface snow along a traverse from Zhongshan station to Dome A, East Antarctica
Samples of surface snow were collected for stable isotope analysis along a 1250 km transect from Zhongshan station to Dome A (East Antarctica) from 28 December 2007 to 8 Feburary 2008, during the 24th Chinese National Antarctic Research Expedition. The annual mean air temperature was also calculated by multiregression and the Kriging method, based on 14 in situ values. The local relationship between δD and surface temperature was (6.4 ± 0.2) % per °C, very similar to the average for East Antarctic. The deuterium excess showed a pattern of high values over Antarctica, particularly at Dome A, indicating that the moisture of Dome A is from low latitude ocean surface. We compared our data with an atmospheric general circulation model that includes stable water isotopes (ECHAM5-wiso). The model simulation captured the right levels of δD, but overestimated δ18O (Fig. 3). A comparison of the ECHAM5-wiso deuterium excess during the summer with our observations also confirmed an underestimation. We concluded that the climatological ECHAM5-wiso simulation might correctly resolve the processes leading to high excess levels, which may relate to the specifc local moisture transport paths, as suggested by atmospheric reanalyses. However, the model clearly underestimates the strength of these processes, as indicated by the bias in the simulated deuterium excess values. Another reason for the model–data mismatch may be related to processes, such as stratospheric deposition, not resolved in the model. Spatial distribution of δ determined by a sub-Rayleigh model showed that there are three patterns along the route. The boundary between these areas occurred at altitudes of 1900 and 2850 m, approximately 185 and 830 km from the coast, respectively, suggesting three sources of summer moisture (Fig. 3). (Ding Minghu)
5.2 An up-to-date review of mass balance over Antarctic
As the cold source of the global climate system, polar ice sheets are the amplifers and drivers in global warming. The solid water in polar ice sheets has a huge impact on global sea level change, water cycles, and atmospheric circulation. During the past decades, the stability of the Greenland ice sheet has been clearlyassessed by scientists; however, the stability of Antarctica, especially the east Antarctic ice sheet, is still under debate. Thus, the mass balance of Antarctic ice sheet was raised as a key issue in the IPCC AR4. To clarify the latest progress on the issue, we summarized the studies conducted from 2002 to 2012, with the following relatively accurate conclusion∶ the eastern part of west Antarctic ice sheet has kept thinning, while the western part is growing. In the meantime, the Antarctic Peninsula has heavily lost mass, there are still some controversies among studies on the east Antarctic ice sheet; however, most of the evidences show that east Antarctica has also a negative mass balance and there is no conclusion to whether it will stabilize under climate warming. The majority of these studies relied on satellite remote sensing, with the results on future prediction less credible. This requires more research energy focused on the modeling in the future work. (Ding Minghu)
5.3 Observational research on atmospheric ozone over Zhongshan station area, Antarctica
The atmospheric ozone change over polar regions as one of the most important factors affecting global climate change is an important issue for the study of global change. Using air-based atmospheric ozone sounding, surface-based Brewer total ozone amount and surface ozone observation and space-based satellite remote sensing TOMS retrieved results during the fourth International Polar Year (IPY), over Zhongshan station and Davis station, this project performed diagnostic analysis on the long-term trend and characteristic parameters of ozone change. We discussed the relation between the atmospheric ozone vertical distribution and the atmospheric dynamic structure, and further studied the interaction between the upper troposphere and the lower stratosphere during the Antarctic ozone period in Spring. The evidence shows that ozone lost in spring is closely related to low polar night temperatures and the process of PSC photochemical destruction ozone in the stratosphere. The vertical characteristics and seasonal variation of ozone and temperature enable a meaningful understanding of the formation and development of Antarctic ozone deletion. Currently, the ozone hole appears only in spring over the Antarctic and not over the Arctic. Under present levels of atmospheric environmental pollution, the change of atmospheric ozone depletion over the polar regions will be more dependent on the atmospheric circulation, especially the low temperature in the polar vortex.
Seasonal variation in surface ozone and the relationship between the background ozone concentration and wind were evaluated using 2008 data at Zhongshan station, Antarctica. The ozone depletion events at Zhongshan station were directly related to lower temperatures and higher BrO concentrations. Backward trajectory analysis revealed that the ozone depletion events were predominately caused by the high BrO concentrations.
Infuencing factors, variations, and trends of the Antarctic ozone hole in recent decades were analyzed. The sudden change processes of ozone at the Zhongshan station and the effect of atmospheric dynamic processes on ozone changes were also discussed using satellite and ground-measured ozone data at two Antarctic stations as well as the NCEP/NCAR reanalysis data. Results show that equivalent effective stratospheric chlorine (EESC) and stratospheric temperature are two important factors infuencing the ozone hole. Decadal changes in EESC are in agreement with those of the ozone hole, and interannual variations of ozone are closely related to stratospheric temperature.
Our observational research on the characteristics of Antarctic atmospheric ozone increases the precision of space- and surface-based observed total ozone concentrations, and provides useful information for numerical simulation and theoretical analysis, furthering the understanding of the role of Antarctic ozone change in global climate change. (Lu Longhua, Bian Lingen)
猜你喜欢
今日农业(2022年4期)2022-11-16
金桥(2022年6期)2022-06-20
煤气与热力(2021年10期)2021-12-02
小哥白尼(趣味科学)(2020年12期)2021-01-18
小哥白尼(神奇星球)(2020年12期)2021-01-18
科学大观园(2020年18期)2020-09-16
国际汉学(2020年1期)2020-05-21
学生天地(2019年32期)2019-08-25
商周刊(2018年19期)2018-12-06
红领巾·探索(2018年12期)2018-01-26