
Measurement of the neutron-induced total cross sections of natPb from 0.3 eV to 20 MeV on the Back-n at CSNS
2024-04-25 07:14JieMingXueSongFengYongHaoChenHanYiMinXiaoPinJingChengXinXiangLiRongLiuYiWeiYangZiJieHanDaJunZhaoHaoQiangWangBaoQianLiJiRongZhaoLeiXunTangWenLuoBoZheng
Nuclear Science and Techniques 2024年2期
Jie-Ming Xue · Song Feng · Yong-Hao Chen · Han Yi · Min Xiao · Pin-Jing Cheng · Xin-Xiang Li ·Rong Liu · Yi-Wei Yang · Zi-Jie Han · Da-Jun Zhao · Hao-Qiang Wang · Bao-Qian Li · Ji-Rong Zhao ·Lei-Xun Tang · Wen Luo · Bo Zheng
Abstract The neutron-induced total cross sections of natural lead have been measured in a wide energy range (0.3 eV—20 MeV) on the back-streaming white neutron beamline (Back-n) at the China Spallation Neutron Source.Neutron energy was determined by the neutron total cross-section spectrometer using the time-of-flight technique.A fast multi-cell fission chamber was used as the neutron detector, and a 10-mm-thick high-purity natural lead sample was employed for the neutron transmission measurements.The on-beam background was determined using Co, In, Ag, and Cd filters.The excitation function of natPb(n,tot) reaction below 20 MeV was calculated using the TALYS-1.96 nuclear-reaction modeling program.The present results were compared with previous results, the evaluated data available in the five major evaluated nuclear data libraries (i.e.,ENDF/B-VIII.0, JEFF-3.3, JENDL-5, CENDL-3.2, and BROND-3.1), and the theoretical calculation curve.Good agreement was found between the new results and those of previous experiments and with the theoretical curves in the corresponding region.This measurement obtained the neutron total cross section of natural lead with good accuracy over a wide energy range and added experimental data in the resonance energy range.This provides more reliable experimental data for nuclear engineering design and nuclear data evaluation of lead.
Keywords Neutron-induced total cross section · Natural lead · Time-of-flight · TALYS-1.96 · CSNS Back-n white neutron beamline
1 Introduction
With the development of new-generation nuclear energy systems, such as the 4th-generation reactor and the acceleratordriven subcritical system (ADS), more stringent requirements have been proposed for the measurement of neutron reaction cross sections of a series of important nuclides, including higher accuracy, wider energy range, and more reaction types[1].The neutron-induced total cross section is a measure of how likely a neutron is to interact with the nucleus.This is an important parameter in the study of nuclear physics and can provide basic information regarding the internal structure of atomic nuclei and their components.Lead (Pb), which is selected as the main coolant, is an important shielding material for advanced lead-cooled fast reactors (LFRs) [2].Therefore, the accuracy of the neutron-induced cross sections of Pb directly affects the reliability of the LFR’s physical design.In addition to its use in nuclear facilities, lead is also of interest in nuclear physics.It is a heavy element with an extraordinary electric field near the atomic nucleus (i.e., the electric field intensity near the surface of the lead atomic nucleus is as high as 1023V/m) [3].The electromagnetic scattering of neutrons under the action of the Coulomb field can be extracted by measuring the high-precision neutron-induced total cross section and neutron electric polarizability; thus, the neutron charge radius [3, 4] can be obtained.Overall, measuring the neutron-induced total cross section of lead is important for both practical and theoretical reasons, as it helps develop safer and more efficient nuclear technologies and improves our research on physical phenomena.
In recent decades, a large number of experimental measurements of the neutron-induced total cross-section data of lead have been conducted internationally, and relevant data have been collected in the EXFOR library [5].However, there were differences between these experimental data in certain energy regions, particularly in the resonance energy region(1 keV—1 MeV).Only two measurements have been recently reported in the narrow resonance-energy region [6, 7].Moreover, the existing measurement data were obtained based on different spectrometers in different energy regions; therefore, the experimental efficiency is low and the uncertainty is generally large, which is not conducive to the evaluation of nuclear reaction data.Furthermore, there are differences in the neutroninduced total cross section of lead in the five major evaluated nuclear data libraries (i.e., ENDF/B-VIII.0 [8], JEFF-3.3 [9],JENDL-5 [10], CENDL-3.2 [11], and BROND-3.1 [12]).Therefore, there is a strong demand to obtain a high-precision neutron-induced total reaction cross section of lead through a single measurement over a wide energy range.
This paper reports a new measurement of the neutroninduced total reaction cross sections ofnatPb in the energy range from 0.3 eV to 20 MeV on the back-streaming neutron beamline (Back-n) at the China Spallation Neutron Source (CSNS).Neutron energy was determined using the neutron total cross-section spectrometer (NTOX) through the time-of-flight (TOF) technique.The excitation function of the nuclear reaction ofnatPb(n, tot) below 20 MeV was calculated using the TALYS-1.96 nuclear-reaction modeling program.The measured neutron-induced total reaction cross sections ofnatPb were compared with previous results extracted from the EXFOR library, the evaluated libraries,and the theoretical calculation curve.
2 Experimental method and setup
2.1 Method of neutron-induced total reaction cross-section determination
The neutron-induced total reaction cross section was determined in a transmission experiment by attenuating the neutron beam through the target [13].The transmission rate is the ratio of the neutron counting rate through a sample to the neutron counting rate without a sample.This method has high measurement accuracy because it does not require the absolute measurement of the neutron fluence rate and does not consider the detection efficiency.The transmissionTat incident neutron energyEiis given by Eq.(1).
whereCandC0are the neutron-counting rates of the detector with the sample inside and outside the beam, respectively.
The relationship between the neutron total cross sectionσand the transmission is given by Eq.(2).
wherendis the areal density given by the product of the number density of atomsnand the sample thicknessd.
The time-of-flight (TOF) technique is typically used to determine incident neutron energy [14].It determines the neutron energy by measuring the time at which the neutron flies over a fixed distance.In TOF measurements, the incident neutron energy is expressed by Eq.(3).
wheremnis the mass of the neutron,cis the speed of light,Lis the neutron flight length, and TOFnis the neutron flight time.The relativistic effect considered as the neutron energy was relatively high.
2.2 Experimental setup
The Back-n white neutron source and its supporting spectrometer system provide a powerful platform for measuring and researching nuclear data.On the Back-n, neutrons are produced by 1.6 GeV proton-induced spallation reactions on a tungsten target.It can provide high-throughput,wide-energy-range pulsed neutrons.The acquisition of the complete total neutron cross section throughout the entire energy spectrum via a solitary measurement has the potential to significantly enhance both the experimental efficiency and accuracy [15—17].In the experiment, the accelerator was operated with a proton beam power of approximately 125 kW and a pulse repetition rate of 25 Hz.The doublebunch mode was used.The incident proton pulse was in two bunches, approximately 70 ns (FWHM) wide and 410 ns apart.The experimental setup is shown in Fig.1.The double-bunch mode results in the superposition of the event distributions for two bunches.To extract the single-bunch distribution from the smeared double-bunch distribution,it was necessary to perform double-bunch unfolding, as described in Sect.3.4.
Charged particles emitted from the opposite angle to the incident proton beam were deflected by a magnet to obtain a neutron beam.Subsequently, the neutron beam was collimated using a neutron beam switch and collimator before being directed into the experimental area.The experimental setup based on the NTOX spectrometer [18] consisted of neutron flight tubes, an automatic sample changer, and a multi-cell fission chamber [19].A neutron collimator was installed on the inner wall of the neutron flight tubes.During the experimental measurements, the entire tube remained in a vacuum state.The automated sample changer can be remotely controlled.The multi-cell fission chamber can be filled with similar or different 8 pieces of samples, and four235U (235U-1,235U-2,235U-4,235U-5) and four238U (238U-1,238U-2,238U-4,238U-7) high-purity samples were used in this experiment.The chamber was filled with a gas mixture of 90% Ar and 10% CF4at 800 mbar.The detector was connected to the MesytecMSI-8 preamplifier.It was then connected to the electronics and the Back-n general DAQ system, which was developed by the University of Science and Technology of China, and was used to digitize and store signals from the preamplifiers [20, 21].
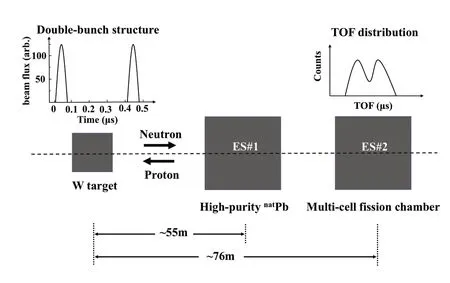
Fig.1 Layout of the experimental setup
Selecting excessively thick samples for the neutron total cross-section experiment increases the contribution of neutron scattering, whereas excessively thin samples will make the transmission significantly large, resulting in an increase in the uncertainty of the total cross section.Therefore, a suitable sample thickness should be selected such that the transmission is between 0.5 and 0.7.In the present study,a high-purity cylindrical natural lead with a thickness of 10 mm was used for the transmission measurements.The characteristic parameters of the sample are listed in Table 1.The uncertainty in the sample thickness determination was within 0.07%.The cumulative irradiation time for the sample was 142 h and 50 h for the measurement without the sample.
3 Data analysis and result
After completing the transmission measurements for thenatPb sample, the raw data were processed offline using the ROOT framework [22].This includes the determination of the neutron flight time, calibration of the exact neutron flight path length, normalization of the data, subtraction of the experimental background, analysis of fission events as a function of neutron energy, and obtaining the transmission spectrum of the sample to obtain the total neutron cross sections.
3.1 Neutron flight time determination and flight path calibration
According to Eq.(3), to obtain fission events as a function of the neutron TOF and energy, it is necessary to know the exact time zero and the length of the neutron flight path.The spallation reaction of the proton beam bombarding the tungsten target to produce neutrons produces a large number of high-intensityγ-flash promptly.Theγ-flash at the speed of light arrived at the detector earlier than the neutrons; thus,the time difference between the detectedγ-flash and the measured neutron signal can be used to calculate the flight time of neutrons TOFn.The calculation formula is shown in Eq.(4).
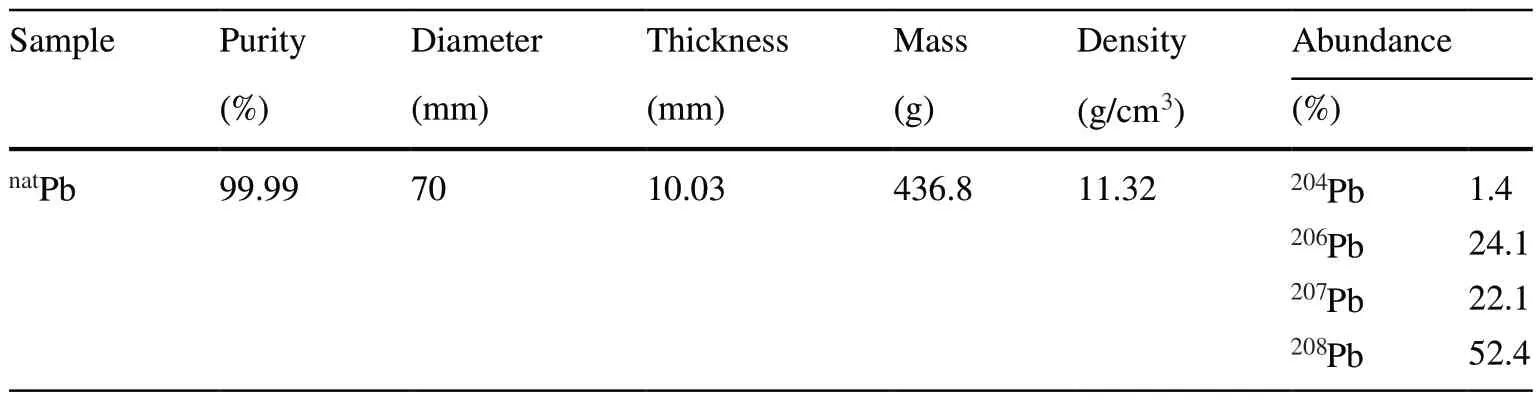
Table 1 Characteristic parameters of the nat Pb sample
whereTnis the neutron arrival time determined by the fission signal,Tn0is the generation time of the neutron,Tγis the time at which theγ-flash is detected, and TOFγis the flight time ofγ-flash from the target to the fission chamber.
The neutron flight path calibrations were performed with resonance peaks of 8.774 eV, 12.385 eV, and 19.288 eV for235U.Tnof the resonance peak can be obtained by fitting the fission time spectrum with a Gaussian function [23].The neutron flight distance can be obtained by fitting the relationship between the resonance peak energy and the neutron arrival timeTnin Eq.(5).
The fitting results for235U fission cells are listed in Table 2.The flight paths of the four238U fission cells were not calibrated because of the small response of the reaction in lowenergy regions.The fission chamber was set up with a fission cell spacing of approximately 19 mm, and the flight path corresponding to the238U fission cells was consequently increased by 19 mm.
3.2 Background subtraction
For the experimental measurement of the neutron-induced total reaction cross section, it is important to deduct the background.The presence of an experimental background increases the measured neutron transmission, resulting in a smaller cross section.
The background in a time-of-flight measurement consists of two components [14].The first is the background, which is independent of the neutron beam intensity, and its time structure.This background can be determined by measuring the time at which the proton beam is switched off.In this study, this type of background mainly originates from the alpha decay of the fission cells.Thirty-five hours of beam-offmeasurements were performed, and it was found that the background signal amplitude was significantly low compared to the neutron signal amplitude.This can be subtracted by setting a threshold, as shown in Fig.2.The second part is related to the generation and transmission of the neutron beam, which varies with time.It includes theγ-flash produced by the scattering target and the neutrons scattered by the surrounding walls,floor, and instruments.
The TOF and amplitude statistics of the signals from each fission cell were obtained, resulting in a sample-out TOFamplitude 2D distribution and amplitude distribution of235U-1 and238U-1 cells, as shown in Fig.2.A clear boundary area between the small-amplitude background signals and the neutron signals is shown.The distribution of the amplitudes was derived through a statistical analysis of the signal amplitudes on each fission cell, as shown in Fig.3.The solid blue and dashed black lines in the figure correspond to the sampled-out signal amplitude distribution of the235U-1 fission cell and the alpha background signal amplitude distribution, respectively, shown in Fig.2.The lowest value of the valley was selected as the signal discrimination threshold.The background signal below the threshold was subtracted from subsequent analysis.After the analysis, there was no influence of alpha particles at the threshold, and alpha particles only accounted for 0.0007% of the neutron signal.

Fig.2 (Color online) Alpha signal time-amplitude 2D distribution and sample-out TOF-amplitude 2D distribution of the 235U-1 and 238 U-1 cells

Table 2 Neutron flight calibration of 235 U fission cells

Fig.3 (Color online) Sample-out amplitude distribution of the 235U-1 cell
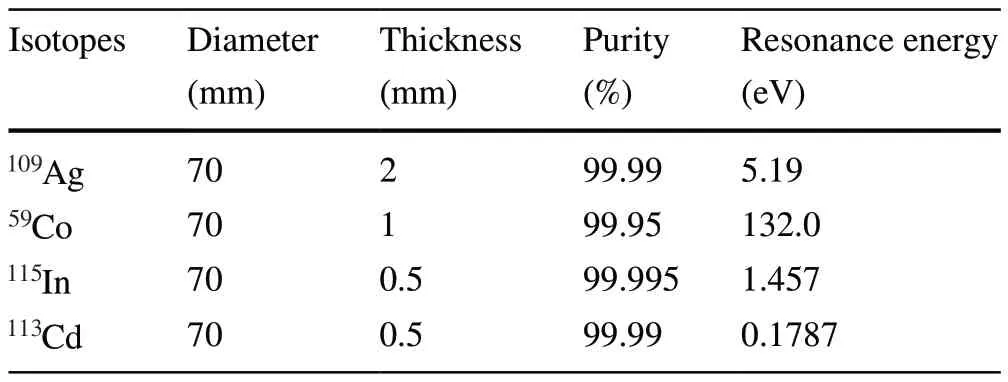
Table 3 Characteristic parameters of the filters
To estimate the on-beam neutron background more accurately, we measured the Co, In, Ag, and Cd filters.The filters were inserted in front of thenatCr samples.The measurement of the neutron-induced total reaction cross sections ofnatCr will be published in the future.The fission events as a function of neutron energy were measured under the same experimental conditions, and different filters had different resonance peaks to maximize the absorption of neutrons in the beam.The characteristic filter parameters are listed in Table 3.There are many depressions in the lowenergy region, each corresponding to the resonance of one characteristic energy.The fission events as a function of the neutron energy of the filters and the corresponding neutroninduced total cross sections are shown in Fig.4.
During the measurement time of 22 h, the neutron counts within the energy range from 1.34 to 1.55 eV, 4.84 to 5.37 eV, and 123 to 140 eV were 81, 83, and 73, respectively.Compared with the neutron count of the beam, the neutron counts of the background were significantly small.Therefore, this portion of the background was ignored.
3.3 Neutron transmission analysis

Fig.4 (Color online) Fission events as a function of neutron energy of the filters and the corresponding neutron-induced total cross sections from ENDF/B-VIII.0

Fig.5 (Color online) Normalized fission events as a function of neutron energy and the corresponding transmission measured by 235 U fission cells
The fission events as a function of neutron energy were obtained using Eq.(3) after subtracting the background.During the experiment, the proton beam intensity was simultaneously recorded.These data were proportional to the neutron yield and could be used as a normalization parameter for the fission events as a function of neutron energy.To increase the neutron counts and reduce the statistical error, the neutron counts counted by individual fission cells can be combined [24].The normalized fission events of the superimposed235U and238U fission cells as a function of neutron energy are shown in Figs.5 and 6.Because the multi-cell fission chamber has a serious resonance region in its fission material, with the235U resonance peak in the 1 eV—1 keV energy region being clearly visible in the figure.The statistical uncertainties in the neutron counts are mostly within 1%.Starting from Eq.(1), the neutron transmission after considering the background and normalization factors can be expressed by Eq.(6).
Fig.6 (Color online) Normalized fission events as a function of neutron energy and the corresponding transmission measured by 238 U fission cells
whereMandM0are the signal counts of the beam-on measurements with and without the sample placement, respectively.BandB0are the background counts of the beamon measurements with and without the sample placement,respectively.PandP0are the normalized constants based on the monitored counts of the proton beam.
The transmission spectra corresponding to the fission events of235U and238U as a function of neutron energy are shown in Figs.5 and 6.The sample transmission was approximately 0.7 in the low-energy region.Due to the small number of counts in the low-energy region, the transmission fluctuates significantly in this energy region.The neutron transmissions obtained from the235U and238U fission cells were compared, as shown in Fig.7.The result indicates that the data analysis and experimental results are consistent.
3.4 Double-bunch unfolding
The CSNS accelerator usually operates in a double-bunch mode to increase beam power and neutron intensity.This mode involves the presence of two identical proton bunches within a single pulse, separated by a fixed interval of 410 ns.This double-bunch effect results in the superposition of the neutron TOF spectrum, which introduces non-negligible uncertainty in the neutron TOF measurement, particularly in the high-energy region.To recover the original fission events as a function of neutron TOF corresponding to the single-bunch mode, an unfolding algorithm based on the iterative Bayesian method was used to solve this problem.The detailed principle and algorithm derivations can be found in [25].The fission events of235U and238U as a function of neutron TOF and energy obtained in the experiment were performed using the DemoUnfolding_v3.4 code in the energy ranging from 10 keV to 20 MeV and 1 MeV to 20 MeV, respectively.The fission events as a function of neutron TOF in the double-bunch mode were set with a linear uniform distribution of 41 ns per channel, and the fission events as a function of the neutron energy were set to 100 bins per decade, with five iterations.

Fig.7 (Color online) Comparison of the neutron transmissions obtained from the 235 U and 238 U fission cells
3.5 Result and uncertainty analysis
Based on the neutron transmission spectrum, the energydependent neutron total cross sections can be obtained using Eq.(2).Owing to the large amount of data in the evaluation databases, the evaluation data were compared separately.Figure 8 shows a comparison of the evaluated data of thenatPb neutron-induced total reaction cross sections from the five main nuclear databases (i.e., ENDF/B-VIII.0, JEFF-3.3,JENDL-5, CENDL-3.2, and BROND-3.1) and the ratio of other evaluation databases over CENDL-3.2.Significant differences were observed among the evaluation databases in the resonance-energy region.
Figure 9 shows the comparison of the neutron-induced total reaction cross sections ofnatPb measured by235U fission cells with the experimental data available in the EXFOR library and the CENDL-3.2 evaluation data in the energy range from 0.3 eV to 1 keV.The experimental results were generally in good agreement with the CENDL-3.2 library.In this energy region, the neutron-induced total reaction cross section is basically a straight line.Experimental measurements show significant fluctuations around 4 eV due to low neutron counts.The Ta-181 material wrapped around the spallation target exhibits high neutron absorption near 4.28 eV.Previous experimental results for this energy region were relatively few, and the measurement results of Muhrer et al.[26] were consistent with our results; however, their uncertainties were relatively high.The measurement results of Havens Jr et al.(data from the EXFOR library) were lower than ours.

Fig.8 (Color online) Comparison of the evaluated data of the nat Pb neutron-induced total reaction cross sections from the five main nuclear databases and the ratio of other evaluation databases over the CENDL-3.2 library
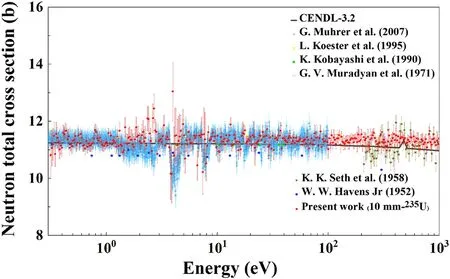
Fig.9 (Color online) Neutron-induced total reaction cross sections of nat Pb compared with previous experimental data and the CENDL-3.2 library in the energy range from 0.3 eV to 1 keV
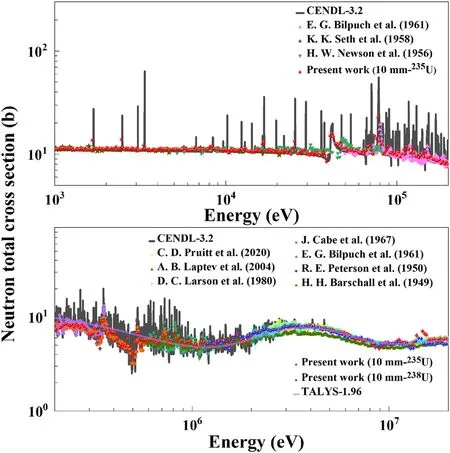
Fig.10 (Color online) Neutron-induced total reaction cross sections of nat Pb compared with previous experimental data, the CENDL-3.2 library, and the theoretical calculation curve by TALYS-1.96 in the energy range from 200 keV to 20 MeV
Figure 10 shows the neutron-induced total reaction cross sections ofnatPb after unfolding, as measured by235U and238U fission cells.These measurements were compared with previous experimental data and the CENDL-3.2 evaluation data in the energy range from 1 keV to 20 MeV.Good agreement was found between the present and previous experimental results as well as with the CENDL-3.2 evaluation data.In the energy range from 1 keV to 200 keV, multiple resonance peaks were measured experimentally, which showed good agreement with the CENDL-3.2 library.However, some of the resonance peaks were not obvious, and the experimental data were generally smaller than the CENDL-3.2 data.This is mainly because the incident proton pulse had a spreading width of approximately 70 ns, whereas the resonance peak of Pb is extremely narrow and requires an energy resolution of 0.1%.There were also few experimental measurements in this energy region, and the measured resonance peaks remained inconsistent.In the energy range from 200 keV to 20 MeV, the experimental results in the highenergy region are consistent with CENDL-3.2 evaluation data.Furthermore, there are many experimental results in the EXFOR library, and the measurement data of Pruitt et al.[27] and Larson et al.(data from the EXFOR library)agree well with our measurement results, except for the results of Laptev et al.[28].
As shown in Eq.(2), the uncertainty of the total cross section is mainly due to the uncertainties of the atomic density of the sample and the transmission.The uncertainty in transmission is related to the statistical uncertainty in the neutron counts.Uncertainty can also arise during double-bunch unfolding.The unfolding code uses an iterative method to calculate the error of each channel,including the error of the fission events as a function of neutron TOF and energy.The uncertainty of the neutron total cross section is given by Eq.(7).
whereeinande0are the uncertainties in unfolding with and without placing a sample, respectively.
For the measurement of thenatPb sample of 10 mm thickness, the energy points (bins) were 779 and 89 with the235U and238U fission cells, respectively.The experimental uncertainties of the total neutron cross section were within the ranges of 0.74—10% and 2.8—12% with the235U and238U fission cells, respectively.Uncertainties below 2% were found at 32.6% of the energy points, and uncertainties below 5% were found at 92.3% of the energy points with235U fission cells.Uncertainties below 4% were found at 49.4% of the energy points, and uncertainties below 6% were found at 91% of the energy points with238U fission cells.
3.6 Theoretical calculation
TALYS is a computer program for the analysis and prediction of nuclear reactions, developed by Koning et al.[29] of the Nuclear Research and Consultancy Group (NRG) in the Netherlands.It is used to calculate nuclear reactions involving neutrons, photons, protons, deuterons, tritons,3He, and alpha particles with energies ranging from 1 keV to 200 MeV through an optimal combination of reliable nuclear models,flexibility, and user-friendliness.The TALYS program considers various nuclear models, usually categorized as optical, direct-reaction, pre-equilibrium, compound, and fission models, all driven by a comprehensive library of nuclear structures and model parameters.The details of the theory and application of the TALYS program are described in Ref.[29].The theoretical calculations of the excitation function of the neutron total cross sections ofnatPb were performed using the TALYS-1.96 program, for which the excitation curve in the neutron energy range from 200 keV to 20 MeV is shown in Fig.10 for comparison.The code was used with the default options, using the optical model parameters from Koning and Delaroche [30].Overall, the trend of the total cross section calculated using TALYS-1.96 shows good agreement with the experimental data.The two results are in high agreement in the nonresonant region but do not reflect the resonant region well.Further studies on the theoretical model of the nuclear reactions of lead are necessary.
4 Conclusions
The neutron-induced total reaction cross sections ofnatPb in the energy range from 0.3 eV to 20 MeV have been measured using the transmission method on the Back-n beamline at CSNS.The neutron energy was determined using an NTOX spectrometer through the TOF technique.The fission events as a function of neutron energy, transmission spectrum, and neutron-induced total reaction cross sections within this energy region were derived by processing raw data acquired from transmission measurements, employing precise techniques such as neutron flight time determination, neutron flight path calibration, and meticulous background subtraction.To determine the on-beam neutron background level,fission events as a function of neutron energy were measured using Co, In, Ag, and Cd filters under the same experimental conditions.Unfolding was performed in double-bunch mode.Good agreement was found between the measured data, previous measurements, and the evaluated data available in the five major evaluated nuclear data libraries.The experimental uncertainties of the neutron-induced total reaction cross section measured with the 10-mm-thick sample were within the ranges of 0.74—10% and 2.8—12% with the235U and238U fission cells, respectively.The uncertainties at most energy points were below 5%, indicating the high quality of the measured data.On this basis, the TALYS-1.96 program was used to calculate the excitation function ofnatPb(n, tot) reaction in the energy region 200 keV to 20 MeV.The calculation results were obtained and compared with the reported data and the CENDL-3.2 library.This measurement obtained the neutron total cross section of natural lead with good accuracy over a wide energy range and added experimental data in the resonance energy range.This provides more reliable experimental data for the nuclear engineering design and nuclear data evaluation of lead.
In the future, a6Li-containing scintillator-based detector will be developed for the application in neutron-induced total reaction cross-section measurements.A fast scintillator-based neutron-induced total reaction cross-section(FAST) spectrometer is under construction, and its physical design has been completed [31].The FAST spectrometer has better performance and higher detection efficiency in low-energy regions.
AcknowledgementsThe authors would like to thank the operating crew of the CSNS for providing a stable neutron beam for the measurements.
Author ContributionsAll authors contributed to the study conception and design.Material preparation, data collection, and analysis were performed by J-MX, SF, Y-HC, HY, MX, P-JC, X-XL, RL, Y-WY,WL, and BZ.Experiment was performed by J-MX, SF, Y-HC, MX,D-JZ H-QW, and L-XT.The first draft of the manuscript was written by J-MX and revised by SF and Y-HC.All authors commented on previous versions of the manuscript.All authors read and approved the final manuscript.
Data Availability StatementThe data that support the findings of this study are openly available in Science Data Bank at https://cstr.cn/31253.11.sciencedb.j00186.00349 and https://doi.org/10.57760/sciencedb.j00186.00349.
Declarations
Conflict of interestThe authors declare that they have no competing interests.
 Nuclear Science and Techniques2024年2期
- Nuclear Science and Techniques的其它文章
- Nuclear charge radius predictions by kernel ridge regression with odd-even effects
- Unbound 28 O, the heaviest oxygen isotope observed: a cutting-edge probe for testing nuclear models
- Development of CONTHAC-3D and hydrogen distribution analysis of HPR1000
- Total ionizing dose effect modeling method for CMOS digital-integrated circuit
- A fast forward computational method for nuclear measurement using volumetric detection constraints
- Artificial neural network-based method for discriminating Compton scattering events in high-purity germanium γ-ray spectrometer