
A fast forward computational method for nuclear measurement using volumetric detection constraints
2024-04-25 07:14QiongZhangLinLvLin
Nuclear Science and Techniques 2024年2期
Qiong Zhang · Lin-Lv Lin
Abstract Owing to the complex lithology of unconventional reservoirs, field interpreters usually need to provide a basis for interpretation using logging simulation models.Among the various detection tools that use nuclear sources, the detector response can reflect various types of information of the medium.The Monte Carlo method is one of the primary methods used to obtain nuclear detection responses in complex environments.However, this requires a computational process with extensive random sampling, consumes considerable resources, and does not provide real-time response results.Therefore,a novel fast forward computational method (FFCM) for nuclear measurement that uses volumetric detection constraints to rapidly calculate the detector response in various complex environments is proposed.First, the data library required for the FFCM is built by collecting the detection volume, detector counts, and flux sensitivity functions through a Monte Carlo simulation.Then, based on perturbation theory and the Rytov approximation, a model for the detector response is derived using the flux sensitivity function method and a one-group diffusion model.The environmental perturbation is constrained to optimize the model according to the tool structure and the impact of the formation and borehole within the effective detection volume.Finally, the method is applied to a neutron porosity tool for verification.In various complex simulation environments,the maximum relative error between the calculated porosity results of Monte Carlo and FFCM was 6.80%, with a rootmean-square error of 0.62 p.u.In field well applications, the formation porosity model obtained using FFCM was in good agreement with the model obtained by interpreters, which demonstrates the validity and accuracy of the proposed method.
Keywords Nuclear measurement · Fast forward computation · Volumetric constraints
1 Introduction
As the exploration of oil and gas reservoirs has gradually deepened, the use of unconventional reservoirs has been increasing in proportion and has gradually become one of the main resources for petroleum production.Nuclear measurements, typically obtained using neutron porosity and gamma density tools, play a critical role in reservoir evaluation.However, in unconventional reservoirs characterized by various lithologies, complex pore structures, diverse fluid types, heterogeneity, and thin layers [1, 2], nuclear responses are heavily impacted, causing difficulty in obtaining accurate formation information from a single type of measurement[3].To obtain reliable formation parameters, multiple logging tools based on different physical principles and comprehensive analysis are usually needed.Hu developed a multiphysics model to extract key features of logs, including natural gamma, density, neutrons, resistivity, and acoustics,to predict rock mechanical parameters [4].Chen introduced a symbolic regression model that used different sources of data to evaluate reservoir heterogeneity [5].The main drawback of these methods is that they require the use of multiple tools,which means that the measurement process can be expensive and heavily relies on the knowledge of tool operators.Therefore, an idea was proposed to determine the formation parameters by updating them in the simulation model until their response matches that of the measurement.Tang obtained the net inelastic and capture spectra based on Geant4 simulations to guide the separation of inelastic and capture gamma rays for measurements [6].Mehana integrated production analysis with simulations to predict reservoir oil recovery[7].Although these attempts are meaningful, obtaining reliable results from simulations in different logging environments can be extremely time-consuming, making it almost impossible to obtain nuclear tool responses in real time using conventional methods such as Monte Carlo [8].
In recent years, a fast forward computational method(FFCM) has been proposed.To realize real-time updates of the formation model, Shao developed a gamma-log-based FFCM and applied it in different downhole environments[9].Qin proposed an FFCM by constructing a series of nonlinear functions to describe the logging responses for different boundary distances of formations [10, 11].Similarly, FFCM can also be used for the dynamic monitoring of directional wells [12].Luycx and a research team from UT Austin introduced the concept of the flux scattering function into FFCM, which utilizes the spatial scattering flux to improve the accuracy of the simulated tool responses[13—15].Liu proposed an improved flux sensitivity function (FSF) method by extending the Taylor expansion to the second order to minimize the perturbation of environmental changes, thus significantly improving accuracy [16].However, the existing FFCMs do not consider the detection volume of detectors and only correct the FSFs of different detectors in an iterative manner.Therefore, by considering a priori information, that is, the detection volume of different detectors, a novel FFCM using volumetric detection constraints is proposed.The detection volume can be considered the maximum region that a detector can detect and can typically be defined by the depth of investigation pertaining to each detector.Because the detection volume contains key information, such as the direction of tool measurement and the angle of the wells, this enables the proposed method to accommodate more environmental variables simultaneously and could be feasible in more complex environments.
Section 2 presents relevant nuclear physics theories based on which an FFCM is developed.Section 3 describes how the method is implemented in an existing neutron porosity tool and tested in both simulated and experimental environments.The results are discussed in detail.Section 4 presents the conclusions.
2 Methodology development
In this section, an FFCM using volumetric detection constraints is designed; its implementation workflow is illustrated in Fig.1.A preset data library, including the detection volume and FSF, is first built using Geant4 [17—21],a software that simulates the passage of particles through matter.A weighted migration length is obtained by inputting the environmental parameters of the target model, including lithology, borehole parameters, rock layer, and angle of deviated well.Then, the most suitable base case, including the corresponding correction function and flux sensitivity functionFSFB, is selected by the migration length using the distance method [22].The weighted migration length is input into the correction function to obtain the final corrected migration length.Finally, the detector counts are calculated by substituting the final migration length andFSFBinto the detector response model, and the formation porosity is calculated based on the near-to-far detector count ratio.
2.1 Detector response model development
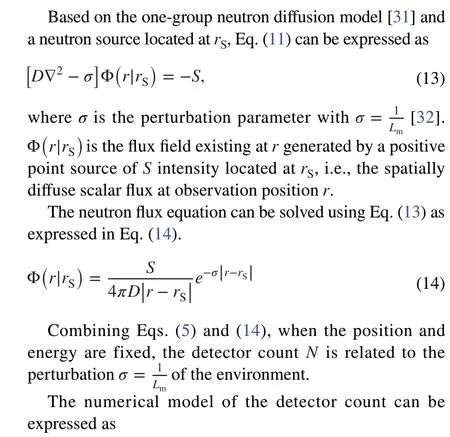
To obtain the model form of the detector response and ensure that the accuracy of the FFCM meets the requirements, a numerical model of the detector response was obtained based on the perturbation theory [23].Perturbation theory is a mathematical method for determining the approximate solution of a problem under a small perturbation based on the exact solution of an existing relevant problem.Its underlying formula can be written as
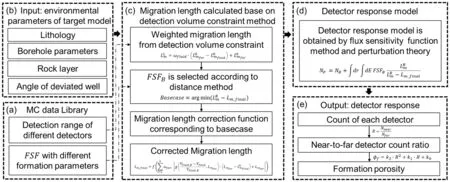
Fig.1 Workflow of FFCM constrained by detection volume implementation

According to Eqs.(4) and (6), the difference between the base and perturbed counts at a certain spatial position due to the single neutron energy is given by
Because the energy of the americium—beryllium neutron source is a fixed energy spectrum, it can be considered as a linear superposition of neutron sources with multiple single energies.The detector has a certain volume; therefore, it must be integrated over space, as shown in Eq.(8).

whereDis the diffusion coefficient, given by Eq.(12).
2.2 Detection volumetric constraints method
The detection volume contains important information such as the tool position, tool direction, and angle of the wells.For example, in the case of a high-angle well, the detection volume of the tool is inclined and the proportion of each layer in the detection volume differs from that of vertical wells.Therefore, the detection volume can be introduced to constrain the effect of perturbation to obtainin Eq.(15)and optimize the detector response model to achieve a highaccuracy calculation.
An open-hole well consists mainly of two parts: a borehole filled with water and a formation.The hydrogen content of the formation rock mainly originates from the water in the pores; therefore, the hydrogen content of the borehole fluid is much larger than that of the formation rock, and the borehole fluid has a greater ability to slow down neutrons.Therefore, the particle transport path of neutrons in the borehole is shorter than that in the formation.According to Eq.(14),it can also be proved that the particle transport trace in the borehole is shorter when the neutron flux decays to the same value.This implies that the detection volume can be approximated as an ellipsoid, which is further demonstrated using the actual tool in Sect.3.1.
Assuming that the well slope angles in theX,Y, andZdirections areθx,θy, andθz, respectively, the detection volume equation is given by Eq.(16).


When the borehole diameter and lithology are fixed,the variation in counts is caused by formation porosity.Therefore, the corrected migration length valueLmfinaland the correction value ΔLmcan be obtained using Eqs.(18) and(19), respectively.Owing to the difference in the mechanical structure, the correction values are different for various detectors of different tools.
whereL0mis the initial migration length calculated in an infinite medium with a point source.
Based on Eq.(19), the migration length correction formulaffor various detectors in each base case can be fitted using Eq.(20), and the fitted data are the eigenvalues and adjacent data of the standard model.
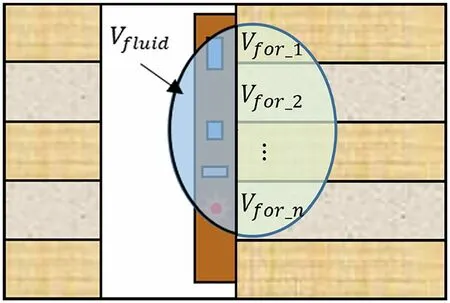
Fig.2 (Color online) two-dimensional detection volume schematic
When the vertical resolution of the logging tool is not sufficiently high, or when thin layers are present, the tool detects signals from multiple geological layers simultaneously, as shown in Fig.2, which is commonly referred to as a pileup.This may result in logging data that do not accurately represent the characteristics of individual layers but rather a combination of their characteristics.Therefore, to accurately calculate the detector responses,it is necessary to consider the influence weight of the different geological layers detected by the detector in the response, which is achieved by weighting the migration length.Within the effective detection volume, let the detected volume of theithrock layer beVfori(i=1,2,…,n) ,the corresponding migration length of theithrock layer beLmfori(i=1,2,…,n) , and the detected volume of the borehole liquid beVfluid.A two-dimensional schematic of the detection volume for multiple rock layers is shown in Fig.2.
The detection volumes for different rock layers and borehole fluids can be calculated using Eqs.(21) and (22),respectively.
where BD denotes the borehole diameter and ∩ denotes the intersection of the detection volume with the formation or borehole.
When the borehole diameter is not equal to the standard borehole diameter, the borehole fluid volume around the tool changes, affecting the neutron transport and causing a variation in the detector count.The standard model is based on a fixed borehole diameter and does not consider the influence of the borehole fluid.When the borehole diameter changes, the weight of the borehole fluid influence is no longer equal to zero.A migration length weighting method is given by Eq.(23).

To select the base case that best matches the environmental perturbation, the distance method shown in Eq.(28)is used.
According to Eqs.(9) and (27), the detector response using volumetric detection constraints is given by
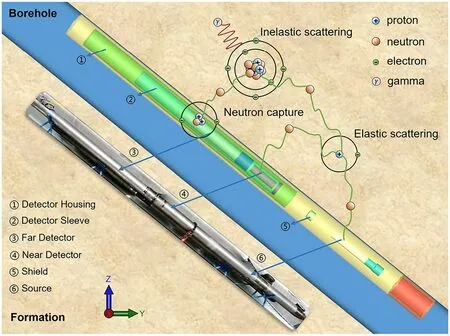
Fig.3 (Color online) neutron porosity logging model
3 Verification
3.1 Implementation in a neutron porosity tool
Neutron porosity logging is an important technique for evaluating reservoirs.This method is applicable to any wireline porosity tool and is discussed in this study based on a wireline neutron porosity tool.The neutron porosity tool was offset to obtain more information about the formation during logging.As shown in Fig.3, the tool with a241Am-Be source is placed in a fluid-filled borehole and attached to the borehole wall [33].Two thermal neutron detectors filled with3He are placed 380.2 mm and 618 mm from the source, and a shield made of a tungsten—nickel alloy is placed between the source and detectors to shield the axial gamma rays.The detailed parameters of the neutron porosity tool are listed in Table 1.During logging, neutrons are emitted into the formationand reach the detector for collection through processes such as elastic scattering, inelastic scattering, and capture.To simulate deep penetration problems, the Geant4 physics list called “shielding” is used, which is specifically designed for this purpose.
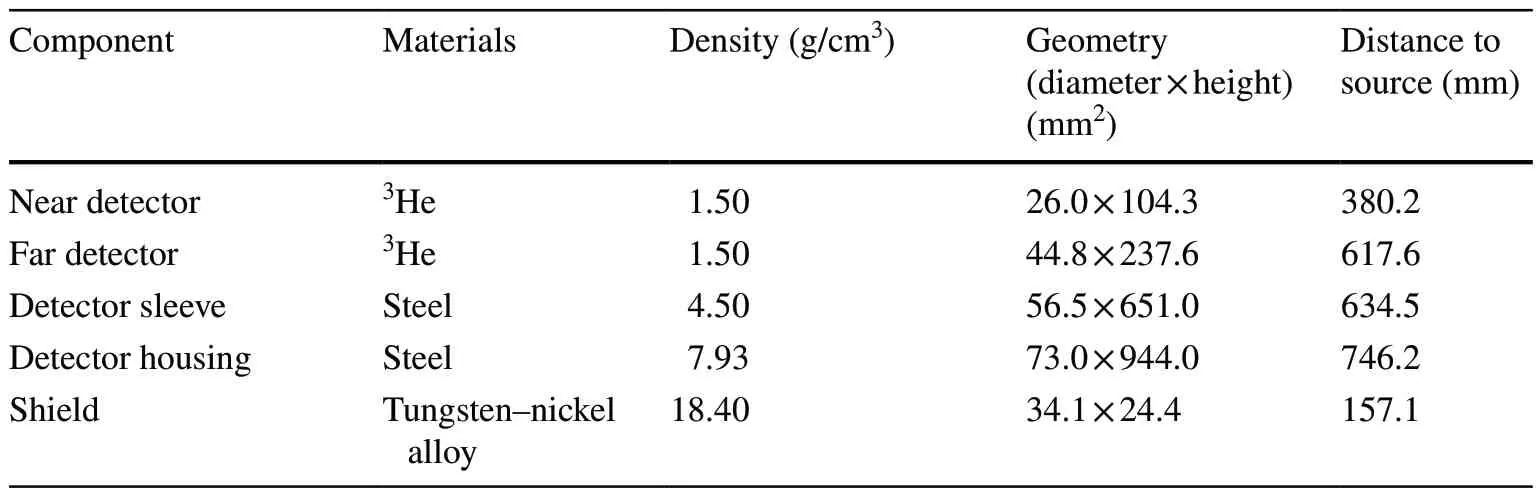
Table 1 Neutron porosity tool parameters

Table 2 Database parameters for the FFCM
To ensure the accuracy of the model in a short computation time, the neutron logging model is described by a two-dimensional Cartesian coordinate system [34], that is,integration overX, where the formation is vertical to theZ-axis and the neutron porosity tool is symmetrical about theZ—Yplane.The space around the tool is divided into grids with axial and radial boundaries to collect neutron flux.To build an FFCM covering multiple environments, a data library containing various parameters of borehole diameter, borehole fluid salinity, and porosity was constructed,as listed in Table 2.The corresponding migration length values were calculated for different formation porosities.In this case, the standard borehole diameter for the base case was 311.2 mm and other environmental parameters of the base case are listed in Table 2.The total computational time for the database was 210 h.It should be noted that as the number of environmental factors increases, larger databases are required to ensure computational accuracy.
In this study, Geant4 was used to construct a neutron porosity logging model and obtain a data library.The conversion equation for the detector ratio and porosity is given by Eq.(30) [35, 36] and can be obtained from the detector ratio data in the data library.
whereϕfis the measured porosity andRis the near-to-far detector ratio.
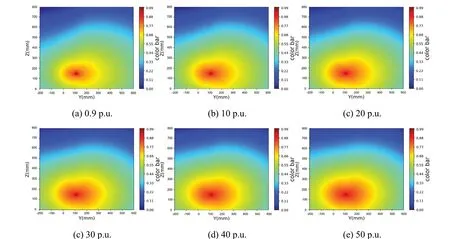
Fig.4 (Color online) normalized forward flux distribution at 311.2 mm borehole diameter with different formation porosities

Fig.5 (Color online) normalized adjoint flux distribution of near detector at 311.2 mm borehole diameter with different formation porosities
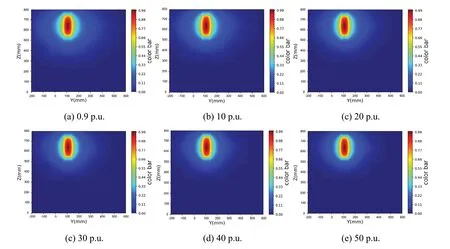
Fig.6 (Color online) normalized adjoint flux distribution of far detector at 311.2 mm borehole diameter with different formation porosities

Fig.7 (Color online) normalized flux sensitivity function of near detector at 311.2 mm borehole diameter with different formation porosities
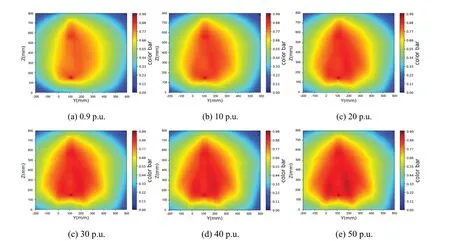
Fig.8 (Color online) normalized flux sensitivity function of far detector at 311.2 mm borehole diameter with different formation porosities

Table 3 a , b, and c of near and far detectors in different environments
The established data library contains the response of the model in different environments, including the forward flux,adjoint flux, and FSFs.The two-dimensional distributions of the forward and adjoint fluxes were obtained using Eq.(14).To better show the distribution, the normalized flux distribution and FSF are shown in Figs.4, 5, 6, 7, 8.As shown in Fig.4, the forward neutron flux gradually decreases in all directions centered at the location of the source and is more widely distributed in the formation direction because the slowing ability of the formation to neutrons is weaker than that of the borehole fluid.The adjoint flux is acquired by setting the adjoint source on the detector; thus, the distribution of the flux centered on the detector and decreasing in all directions is presented in Figs.5 and 6.Because the increased porosity of the formation increases the hydrogen content of the formation and thus enhances the scattering effect on neutrons, regardless of the forward flux or adjoint flux, the normalized neutron flux distribution is more concentrated at the source center or adjoint source center with increasing porosity of the formation.As shown in Figs.7and 8, greater flux sensitivity values are available in the source and detector regions because these regions have the highest neutron flux recorded in the detector, which reflects the contribution of neutrons to the detector in each region.The flux sensitivity functions reflect the common characteristics of the forward and adjoint fluxes; that is, the sensitivity values are more concentrated near the source and detector as the porosity of the formation increases, and the sensitivity values are not concentrated in the part of the tool between the source and detector because of the shielding effect inside the tool [37].
After obtaining the FSF, it is necessary to obtain the three parameters,a,b, andcfor the detection volume in Eq.(16).The transport tracks of the neutron particles that arrived at the detector were collected using Geant4.The maximum distance reached by 90% of the detected neutrons was defined as the maximum detection volume.Thea,b, andcof various detectors in different environments are listed in Table 3.
From Table 3, without considering the angle of the well and direction of the tool, the detection volume is mainly related to the location of the detector and formation migration length, which are slightly influenced by the borehole diameter because the tool is attached to the borehole wall.Therefore, the detection volume can be determined based on the migration length of the base case to constrain environmental disturbance.Thus, a preset data library is built, and the FFCM can be computed according to the pseudocode shown in Appendix.
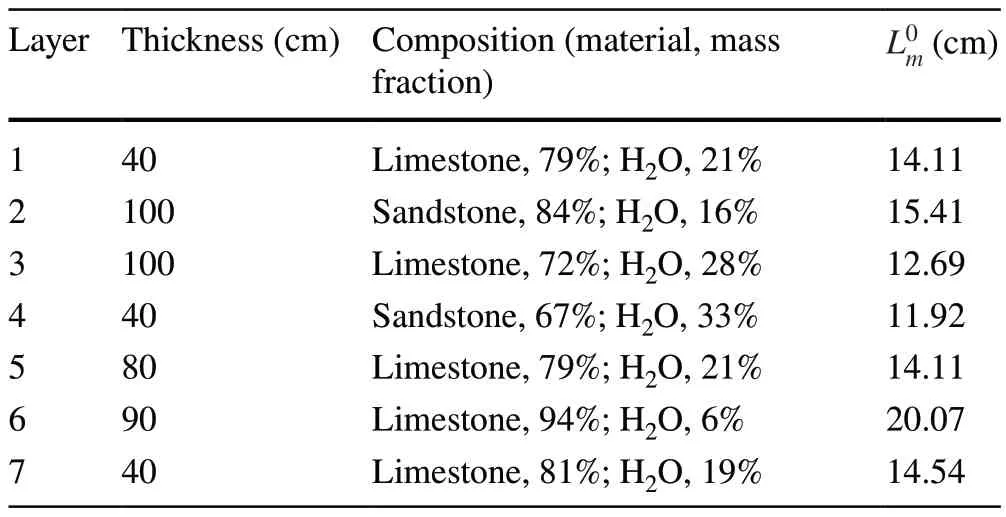
Table 4 The formation parameters in case 1

Table 5 The formation parameters in case 2
3.2 Simulated data verification
To ensure the validity of the FFCM, a test database containing variations in environmental parameters, such as borehole diameter, lithology, and porosity, was established.Set the number of source particles to 2×10⁹so that the statistical error in detector response counts is less than 2% and converges [8], and each model requires more than 5 h of computing using 110 threads on Intel® Xeon(R) Platinum 8280 CPU @ 2.60GHz × 224.The formation in the logging model is composed of alternating sandstone or limestone with different porosities, and the borehole is filled with fresh water.The wireline neutron tool moved continuously frombottom to top, sampling the formation at 100 mm intervals to obtain the detector response.The method was validated in two cases: a vertical well (Case 1) and a high-angle well(Case 2).
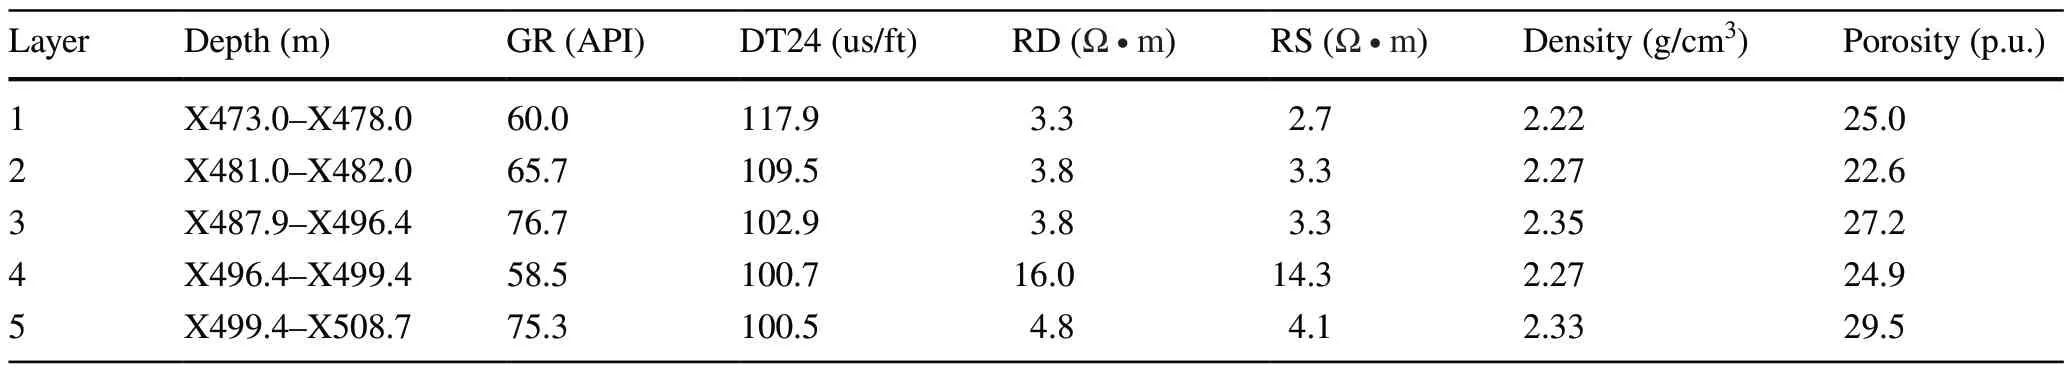
Table 6 The formation parameters from interpretation
Case 1 was designed using a model with different lithologies, formation thicknesses, and porosities for a nonstandard borehole diameter of 350 mm.A schematic of the model is shown in Fig.9, and its specific parameters are listed in Table 4.The calculation results of the FFCM in Case 1 are shown in Fig.10, where Track 1 and Track 2 are the normalized counts of the near and far detectors,respectively, and the normalization formula is shown in Eq.(31), which represents the probability of a neutron emitted from the source reaching the detector.MC near det counts and FFCM near det counts represent the counts of near detectors from MC and FFCM, respectively, and MC far det counts and FFCM far det counts represent the counts of far detectors from MC and FFCM, respectively.Track 3 shows the formation porosity logs of the MC and FFCM obtained using Eq.(30), which are called the MC Porosity and FFCM Porosity, respectively.Track 4 shows the absolute and relative errors of the FFCM and MC simulation results, where the red lines are the error lines of 1 p.u.and 8%, respectively.
whereNnormalizedis the normalized count.NSandNare the number of source particles and the detector count,respectively.
As shown in Fig.10, 50 measurement points were obtained by sampling at a sampling interval of 100 mm in the Case 1 formation model at a depth of 4.9 m.As shown in Tracks 1—3, the results of the FFCM calculations are in good agreement with the MC simulation results in terms of trends and values, both for detector counts and formation porosity.As shown in Track 4, the absolute error of FFCM is mostly below 1 p.u., and the relative error is mostly below 6%, with a maximum absolute error of 1.19 p.u., the maximum relative error of 6.80%, and the root-mean-square error(RMSE) of 0.62 p.u.
Case 2 is a high-angle well model with the Y-axis angleθybeing 10°, while the other axis tilt anglesθxandθzare zero and borehole diameter is 311.2 mm.The working state of the wireline neutron log was simulated to study the results of FFCM with different formation thicknesses and porosities, as shown in Fig.11.A schematic of the Case 2 model is presented in Fig.11 and Table 5.
As shown in Fig.12, 46 measurement points were obtained by sampling at a sampling interval of 100 mm in the Case 2 formation model, which had a depth of 4.5 m.In Tracks 1—3, the calculated logs of FFCM and MC coincide well and show a good matching performance.According to Track 4, the absolute error of FFCM is mostly below 1 p.u.and the relative error is mostly below 6%, with a maximum absolute error of 1.09 p.u., a maximum relative error of 6.54%, and an RMSE of 0.56 p.u.Based on the validation of two simulation cases, the good agreement between FFCM and simulations verifies the validity and reliability of the novel algorithm.

Fig.10 Calculation results of the FFCM in case 1
Once the database has been constructed, FFCM takes less than 1 s to execute, which provides a significant advantage in complicated scenarios that typically require heavy amounts of Monte Carlo modeling.For instance, in Case 2,the conventional Monte Carlo method requires the computation of a minimum of 46 models with the correct parameters,which would take 230 h with 110 threads on Intel® Xeon(R)Platinum 8280 CPU @ 2.60 GHz × 224.Considering the additional calculations of other model parameters during the curve-matching process or longer, well-segmented processing requirements, the Monte Carlo method requires more time.However, using FFCM, each model in Cases 1 and 2 can be computed in less than 1 s regardless of the computational hardware parameters, enabling real-time data processing.
3.3 Experimental part: field application
To evaluate the performance of FFCM, it was applied to a field well.The experimental well is located in the southern part of Liaodong Bay in the Bohai oil field and is drilled with a 241.3 mm (9.5 inch) bit.During logging, the tool slides against the borehole wall from the bottom to the top and is sampled at 76 mm intervals.The sieve residue log shows that the logging section is dominated by sandy mudstone formations, and borehole fluid sampling shows that borehole fluid has a density of 1.18 g/cm3with a salinity of 94 kppm.The compositions of the formations with different porosities and borehole fluids were obtained to calculate the initial migration lengthL0m.In addition, the experimental well requires real-time measurements of the borehole diameter and angle of the well, which provides more accurate inputs to the method.The pseudocode of the method is shown in Appendix, and its input is a formation model that includes the lithology, borehole parameters,and formation properties.By iteratively updating the input formation model to ensure that the calculated porosity log of the FFCM matches the measured porosity log of the tool as much as possible, the final porosity model with multiple layers can be used to assist in the rapid completion of formation analysis to support the formation of a layered interpretation.By utilizing the FFCM, as described above, the limitations of the baseline calculation method can be overcome, and the pileup problem can be resolved,resulting in accurate properties of different geological layers.However, although the proposed method may introduce some errors compared to a full Monte Carlo simulation, it remains the optimal choice that balances time and accuracy considerations.
The formation model obtained using the FFCM method in the X475—X515 well section was compared with the interpretation results, as shown in Fig.13.Track 1 shows the borehole diameter log (CAL), natural gamma log (GR), and DEVOD log, reflecting the angle of the well.RD, RS, and RMSF in Track 2 denote the investigated deep double lateral resistivity log, shallow investigated double lateral resistivity log, and micro-spherically focused resistivity log, respectively.DT24 in Track 3 represents the acoustic slowness.Measured Porosity and Measured Density are the measured values from the neutron porosity and gamma density tools,respectively.Tracks 2 and 3 are important bases for the interpretation.The FFCM-calculated porosity (FFCM Porosity)log in Track 4 was obtained by iteratively and continuously updating the formation model, which matched well with the measured porosity.The FFCM Formation Model of Track 5 is the final formation model corresponding to Track 4, and the Interpretation Model is the formation model obtained by synthesizing and analyzing a variety of measured logs; its detailed parameters are listed in Table 6.
The GR log value of Track 1 in Fig.13 was approximately 75 API, which is consistent with the sieve residue log,indicating that the lithology was mainly composed of sandy mudstone.The borehole size of the measurement section was maintained at 9—13 in because of the enlargement of the borehole, and the angle of the well in this section increased from 25 to 30°, as indicated by the DEVOD log of Track 1.After multiple updates of the formation model,the FFCM-calculated porosity of Track 4 matched the measured porosity well.In addition, the formation porosity model of Track 5 was in good agreement with the model results provided by the interpreters, proving the validity and reliability of the FFCM constrained by the detection volume.
4 Conclusion
This paper proposes an FFCM that uses the detection volume to constrain environmental perturbation to optimize the detector response model, which is derived from perturbation theory and the Rytov approximation.The proposed FFCM was verified using a neutron porosity tool.Two cases were simulated based on various environmental disturbances,including the porosity, borehole, lithology, and slope angle of the well.The maximum relative error of porosity between FFCM and Monte Carlo simulations was 6.80%, and RMSE was 0.62 p.u.Regarding the field application, the formation model of FFCM matched with the interpretation results.The validity and reliability of the proposed FFCM were demonstrated.In addition, the proposed FFCM analyzed each model in less than 1 s, thus meeting the real-time application requirements for field use.
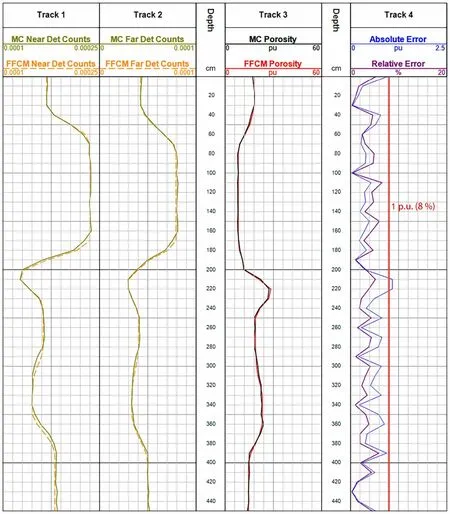
Fig.12 (Color online) calculation results of the FFCM in case 2
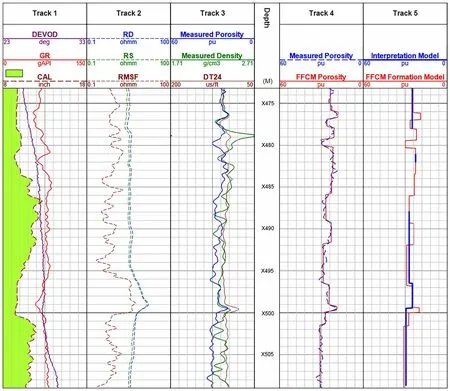
Fig.13 (Color online) calculation results of the FFCM in field
Appendix
Pseudocode of the FFCM using detection volumetric constraints for neutron porosity tool.
FundingThis work is supported by National Natural Science Foundation of China (Nos.U23B20151 and 52171253).
Data availabilityThe data that support the findings of this study are openly available in Science Data Bank at https:// cstr.cn/ 31253.11.scien cedb.j00186.00375 and https:// doi.org/ 10.57760/ scien cedb.j00186.00375.

?
DeclarationsConflict of interestThe authors declare that they have no competing interests.
Author contributionsAll authors contributed to the study conception and design.Material preparation, data collection, and analysis were performed by Qiong Zhang and Lv-Lin Lin.The first draft of the manuscript was written by Qiong Zhang, and all authors commented on previous versions of the manuscript.All authors read and approved the final manuscript.
 Nuclear Science and Techniques2024年2期
- Nuclear Science and Techniques的其它文章
- Measurement of the neutron-induced total cross sections of natPb from 0.3 eV to 20 MeV on the Back-n at CSNS
- Nuclear charge radius predictions by kernel ridge regression with odd-even effects
- Unbound 28 O, the heaviest oxygen isotope observed: a cutting-edge probe for testing nuclear models
- Development of CONTHAC-3D and hydrogen distribution analysis of HPR1000
- Total ionizing dose effect modeling method for CMOS digital-integrated circuit
- Artificial neural network-based method for discriminating Compton scattering events in high-purity germanium γ-ray spectrometer