
Development of CONTHAC-3D and hydrogen distribution analysis of HPR1000
2024-04-25 07:14HuiWangJingJingLiYuanChangGongLinLiMingDing
Nuclear Science and Techniques 2024年2期
Hui Wang · Jing-Jing Li · Yuan Chang · Gong-Lin Li · Ming Ding
Abstract An in-house code, CONTHAC-3D, was developed to calculate and analyze thermal—hydraulic phenomena in containments during severe accidents.CONTHAC-3D is a three-dimensional computational fluid dynamics code that can be applied to predict gas flow, diffusion, and steam condensation in a containment during a severe hypothetical accident, as well as to obtain an estimate of the local hydrogen concentration in various zones of the containment.CONTHAC-3D was developed using multiple models to simulate the features of the proprietary systems and equipment of HPR1000 and ACP100, such as the passive cooling system, passive autocatalytic recombiners and the passive air cooling system.To validate CONTHAC-3D, a GX6 test was performed at the Battelle Model Containment facility.The hydrogen concentration and temperature monitored by the GX6 test are accurately predicted by CONTHAC-3D.Subsequently, the hydrogen distribution in the HPR1000 containment during a severe accident was studied.The results show that the hydrogen removal rates calculated using CONTHAC-3D for different types of PARs agree well with the theoretical values, with an error of less than 1%.As the accident progresses, the hydrogen concentration in the lower compartment becomes higher than that in the large space,which implies that the lower compartment has a higher hydrogen risk than the dome and large space at a later stage of the accident.The amount of hydrogen removed by the PARs placed on the floor of the compartment is small; therefore, raising the installation height of these recombiners appropriately is recommended.However, we do not recommend installing all autocatalytic recombiners at high positions.The study findings in regard to the hydrogen distribution in the HPR1000 containment indicate that CONTHAC-3D can be applied to the study of hydrogen risk containment.
Keywords Hydrogen risk mitigation · Pressurized water reactor · HPR1000 · Thermal hydraulic · CONTHAC-3D
1 Introduction
During severe accidents in pressurized water reactors(PWR), large quantities of hydrogen generated by zirconium water and steel steam reactions are released into the containment, creating a flammable gas mixture, which may challenge the integrity of the containment.Hydrogen distribution inside containments during severe accidents has always been a major concern, which has manifested as a core focus of research on thermal—hydraulic phenomena.Of the three severe accidents that have occurred in the history of nuclear power development, at least two have occurred because of hydrogen combustion or explosion phenomena.Passive autocatalytic recombiners (PARs) are widely used in PWR containment to mitigate the hydrogen risk during severe accidents.Lumped parameter codes are often used to evaluate the hydrogen risk in containments and effectiveness of PARs during accidents.For example, Omid et al.[1] studied thermal—hydraulic parameters inside the containment of a WWER-1000/v446 nuclear power plant (NPP) during a double-ended cold leg accident.The hydrogen distribution inside the containment was simulated for a long time (using CONTAIN and MELCOR), and the effects of the recombiners were analyzed using MELCOR.Farhad et al.[2] investigated core melting, gas production, and gas release in a core catcher using MELCOR.Xiao et al.[3] developed a thermal—hydraulic code, MITAP-PRHRS, to analyze the steady and transient characteristics of the PRHS, which uses simple models to predict complex physical processes, ignoring spatial differences in thermal—hydraulic variables, such as the differences in fluid density, concentration, and temperature.Therefore, these types of codes cannot provide an accurate estimate of the local hydrogen risk [4].
In recent years, the use of computational fluid dynamics(CFD) codes has increased in thermal—hydraulic analyses[5, 6].CFD can also be used to analyze hydrogen behavior within PWR containments and PAR performances.Wang[7] described the recent progress in CFD applications in PWR thermal—hydraulics studies and presented the major challenges and promising directions of the CFD method in nuclear reactor engineering.In the PHARE project “Hydrogen Management for the VVER440/213”, CFD calculations using GASFLOW, FLUENT, and CFX were performed for the Paks NPP, wherein a severe accident scenario involving the release of hydrogen was modeled [8].The SUSANA project aims to support stakeholders using CFD codes for safety engineering design and the assessment of fuel cell and hydrogen (FCH) systems and infrastructure through the development of a model evaluation protocol [9].Visser[10, 11] developed a CFD model using ANSYS-FLUENT to simulate the distribution of hydrogen in the containment of an NPP during a severe accident.In the CFD study of PARs, the one-step reaction model is widely used [12—14].Although this model is simpler than the chemical reaction mechanism model [15], it nevertheless requires high computational resources on account of the scale of the containment.Commercial CFD codes consider spatial variations in fluid properties; however, such codes require a large control volume to simulate the detailed behavior of thermal—hydraulic systems, and the safety equipment used in NPPs, such as PARs and passive containment heat removal systems,are required to be added in the form of user-defined functions [16].CFD code developers and end-product users are acutely aware of the need for qualification of the predictions of this type of codes [17].The need for large amount of computing resources and extensive validation work poses significant challenges in the development of CFD codes.Natural circulation and mixing in containment volumes are three-dimensional phenomena, and a number of CFD-type codes, such as GOTHIC, TONUS, and GASFLOW, have been specially developed to deal with these phenomena.In this type of codes, the meshes employed according to CFD standards are extremely coarse that rely on correlations over resolution of the boundary layers and underlying physics.As the CFD-type codes employ majority of the safety system models and are fully verified, they are primarily used in the nuclear industry.The GASFLOW program, developed by KIT and used for hydrogen risk analysis in containments,has been validated against various internal calculation models [18—20].Chen [21—23] developed the CYCAS code and validated its turbulent buoyancy flow and combustion models.
Similar to the CFD-type codes, the in-house code CONTHAC-3D developed in this study is also a three-dimensional CFD code, which can be applied to predict gas flow,diffusion, and steam condensation in a containment within the course of a hypothetical severe accident, as well as to estimate the local hydrogen concentration in various zones of the containment.CONTHAC-3D can also be used to predict the fluid dynamics, chemical kinetics, conjugate heat,mass transfer, aerosol transportation, and other related phenomena.Moreover, CONTHAC-3D was developed with many models to simulate the features of the proprietary systems and equipment of HPR1000 and ACP100, such as the PCS, PARs, and PAS models.The PCS model is typically coupled with the PCS system code in CONTHAC-3D.
2 Computational model
2.1 Conservation equations
The flow field description of CONTHAC-3D relies on four differential equations: the mesh volume conservation, mass conservation (continuity equation), momentum conservation, and energy conservation equations.Turbulent- and laminar-flow conditions are considered.In CONTHAC-3D,these conservation equations are implemented in the form of finite volume integrals, and the corresponding control volume depends on the storage locations of the controlled variables.
Here,Vis the control volume,Ais the envelope of the control volume, v is the fluid velocity vector, m is the grid velocity vector,ρrepresents density, n represents the outer unit normal vector of surfaceA,pis the pressure,Eis the total energy, and g represents the gravitational vector.The above conservation equations establish a general description of the flow field under the arbitrary Lagrange—Euler method.During the development process, the influence of the various models involved in the mainstream flow field is reflected in the conservation equation in the form of the attached source terms.In CFD calculations, the control term of the energy conservation equation is often modified to a specific internal energy [24], and the divergence term in the equation is integrated to obtain the mass conservation, momentum conservation, and energy conservation equations used to describe the flow field in CONTHAC-3D, as shown in Eqs.(5)—(7):
HereSrepresents the source term,Irepresents the specific internal energy, T represents the viscous stress tensor, q represents the heat flux vector, subscriptρrepresents the mass term, andmrepresents the momentum term.From left to right, the mass conservation equation presents the transient convection and source terms.From left to right, the momentum conservation equation presents the transient, convective,pressure, gravity, viscosity, and source terms.From left to right, the energy conservation equation presents the transient, convection, pressure work, thermal convection, and source terms.
For calculations inside the containment, the fluid is often composed of multiple components.Therefore, the mass conservation equation must be refined into a component conservation equation as follows:
where J is the mass diffusion and subscriptirepresents the component.From left to right, the entire composition conservation equation includes the transient, convection,diffusion, and source terms.
2.2 Convective heat transfer model
If the temperatures of the fluid and wall surface are different,convective heat transfer occurs, which is one of the most fundamental and important physical phenomena in containment.In CONTHAC-3D, Newton's cooling formula is used to model the heat transfer as follows:
where the subscript s represents the surface of all solid structures in contact with the grid.In CONTHAC-3D,a one-dimensional structural heat conduction model is used.Because the generation of solid structures depends on the grid, the surface areaAsof the above solid structures can be directly obtained based on the grid size without interpolation.
In CONTHAC-3D, the Reynolds analogy method is used to model the thermal boundary layer, and the single-phase convective heat transfer coefficienths[25] is obtained using the Chilton—Colburn empirical analogy formula:
whereτis the shear stress,Pris the Prandtl number of the fluid, and the subscript c represents the grid center.Further,vcdenotes the central velocity vector of the first layer of mesh in contact with the wall.The shear stressτis expressed as:
wherev*denotes wall shear velocity.The direct calculation of the wall shear velocity requires extremely fine grids to accurately derive the corresponding turbulent motion near the wall.Therefore, the calculation of the wall shear velocity in CONTHAC-3D is dependent on the empirical relationship[26] and is obtained using a Reynolds number of 130.7 near the wall, which as the boundary to distinguish the motion state of the thermal boundary layer:
The program can calculate the corresponding convective heat transfer coefficient by combining Eqs.(10) and (12) as follows:
In CONTHAC-3D, the Prandtl number for laminar flow near the wall is assumed to be approximately 1; therefore, this term is omitted from the calculation in Eq.(13).When the steam mass fraction is large, condensation or evaporation can lead to an increase in the mass transfer rate near the wall.As the mass transfer rate increases, there is a suction effect near the wall, making the thermal and aggregation boundary layers of the non-condensable gases thinner.A decrease in the thickness of the boundary layer further increases the temperature and concentration gradients near the boundary, thereby increasing the heat and mass transfer coefficients.The opposite effect is observed on the liquid film evaporation surface,
where the heat and mass transfer coefficients decrease.Bird and Stewart developed corresponding correction coefficients for this purpose [27], which can be used to determine the increase or decrease in the heat and mass transfer coefficients.The corrected heat transfer coefficient is obtained as:
where, the superscript * represents the correction value and the correction coefficient Γsis a function of the rate factorfand is expressed as:
wherėmsis the surface mass flux.In CONTHAC-3D, only mass transfer by evaporation or condensation is considered.
2.3 Passive autocatalytic recombiner model
Chemical reactions related to combustible gases are important phenomena in containment, and hydrogen is the main component of these combustible gases.A relatively simple chemical reaction model is used in CONTHAC-3D to simulate chemical reactions related to hydrogen.For the components involved in the reaction, oxygen, hydrogen, and water vapor should satisfy the following chemical equation:
wherėωindicates the reaction rate, i.e.,
The difference between this model and the combustion chemical reaction model lies in the presence of catalytic devices, leading to changes in the reaction rate calculation depending on the model of PARs.The recombination performance, that is, the mass of hydrogen burned down on the catalysts per unit time, is provided by the manufacturer as its main characteristic.This value is approximated by an empirical expression that depends on the parameters at the recombiner inlet (pressure, temperature, and component fractions—hydrogen, oxygen, and water steam).In general,the hydrogen removal rate of different types of PARs is calculated as follows:
whereRatedenotes the hydrogen removal rate of the PARs,the minimum volume fractionYminis assumed to be 0.5%,and the efficiency of the PARs isη, The values of the coefficientsk1andk2and the general volume fractionYΩare related to the relative concentrations of hydrogen and oxygen in the flow field near the inlet of the PARs and the type of PARs.The actuation setpoint of most PARs is when the mole fraction of hydrogen is greater than 2% and then the PARs will stop to remove hydrogen until the mole fraction of hydrogen is below 0.05%.
3 Program development
In this study, FORTRAN was used to develop CONTHAC-3D.In CONTHAC-3D, the implicit continuous fluid Eulerian arbitrary Lagrangian methods are used to determine the discrete solutions of the equations.CONTHAC-3D can solve the flow and heat transfer problems of compressible fluids in three-dimensional Cartesian and cylindrical coordinates and adopts physical and turbulent models suitable for thermal—hydraulic analysis inside the containment.The solution process for CONTHAC-3D is illustrated in Fig.1a.

Fig.1 Development of CONTHAC-3D.a Calculation Process of CONTHAC-3D.b Parallel solving functions
When each round of stepping is completed, the time step required for the subsequent calculation is determined.In addition to determining the user input restrictions on the solver, the program calculates and limits the time-step size based on the flow field changes and calculations.CONTHAC-3D also has parallel-computing capabilities.When performing calculations, it allocates corresponding programs to various threads based on the number of cores entered and then decomposes the tasks, as shown in Fig.1b.
Given a solving functiony=f(x1,x2,x3···xn), wherex1,x2,x3···xnmust be solved circularly and no dependency relationships exist amongx1,x2,x3···, andxn, the result of the computation is eventually passed back to process 0 through the message passing interface (MPI) when using different threads.In addition to loop decomposition at the process level,y=f(x1,x2,x3···xn) can also be decomposed at the algorithm level to obtain sub functionsh1,h2···hithat can be used for multithreaded computing.After each existing thread completes the parallel calculation ofh1,h2···hi, the results are passed back to process 0 through the MPI interface, and finally,y=f(x1,x2,x3···xn) =g(h1,h2,h3···hn) is used to complete the calculation ofy.
4 Code verification and validation
4.1 Model test of passive autocatalytic recombiner
Various strategies have been proposed to mitigate the potential risks of flammable gas mixtures, including using igniters and PARs, which are considered the most attractive mitigation methods [28, 29].Various igniter and PAR models can be employed in the CONTHAC-3D program.In this study, four types of PARs are selected to test the PAR model in CONTHAC-3D.The manufacturer of each type of PAR provides empirical relationships for the hydrogen removal rates, which are verified through experiments.To ensure the stability of the ambient gas components corresponding to the location of the PAR, the recombiner was placed in a large cubic space (100 m × 100 m × 100 m) during validation.Under different hydrogen concentrations, the theoretically calculated value of the hydrogen removal rate of the PAR was compared with the value calculated using the CONTHAC-3D code, as shown in Fig.2.

Fig.2 Model test of passive autocatalytic recombiner
As shown in Fig.2, the theoretical values of the four types of PARs are in good agreement with the values calculated using the CONTHAC-3D code, with a maximum error of less than 1%.The accuracy of the PAR models in the CONTHAC-3D code was verified.Passive autocatalytic recombiners were installed in the main system compartments and in large spaces or domes of the containment.The test results indicate that passive PAR models can be used for hydrogen distribution analysis in real containments.
4.2 Battelle model containment experimental verification
4.2.1 Experimental equipment and conditions
The Battelle model containment (BMC) test facility (Germany) studies the response of the containment vessel of the Biblis NPP under accident conditions.The layout of its internal compartments is illustrated in Fig.3a, and the connections of the rooms are shown in Fig.3b [30], which depicts a schematic of the containment model of the Biblis PWR at a length ratio of 1/5.The BMC is a cylindrical concrete building of height 9 m and diameter 11 m, with a free gas volume of 625 m3.
The interior of the BMC is divided into nine circular regions, named R1—R9.The BMC device is used to conduct a series of helium injection experiments and experimental studies on the performance of a PAR (FR-90/1) [31, 32].For example, In the PAR GX6 test, the PAR was positioned next to the inner wall of R5.During the test, the steam inlets were located at R5, R6, and R8, and the corresponding blower was arranged above the steam inlet to ensure uniform mixing of the flow field.The bottom of R8 was equipped with the corresponding hydrogen release pipelines.Intermittent openpressure outlets and pressure-relief pipes were provided in each compartment to prevent excessive pressure in the container.During hydrogen injection, the blower and outlet were closed to prevent hydrogen leakage.The transient mass flow rates at each inlet under GX6 operating conditions are depicted in Fig.3c.
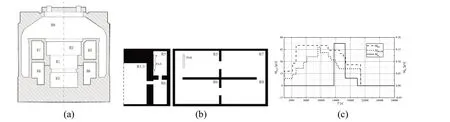
Fig.3 Geometry of the BMC test device and mass input.a Sectional view of the BMC test device.b Connections of rooms.c Transient mass flow rate at each inlet
A three-dimensional model of the BMC was constructed using the CONTHAC-3D software.The initial and boundary conditions of the three-dimensional BMC model were set based on the experiment.Internal reservoirs with a constant pressure were also included to simulate the sump valves.The geometry of the PAR box was matched by adjusting the mesh size.Seven axial meshes were used to simulate the one-dimensional axial flow inside the PAR.Walls with openings were defined to separate the PAR box from the remaining fluid zones, and heat exchange between the PAR walls and surrounding fluid cells was simulated.The buoyancy-driven axial flow from the recombiner was redirected into a radial flow at the box exit.The test facility contains many components; therefore, corresponding heat sinks were added to the three-dimensional model of the BMC.
4.2.2 Calculation results and analysis
The hydrogen concentration, pressure, and temperature in the five compartments, as well as the temperature at the top of the PAR, were monitored using the GX6 test.By comparing the changes in the temperature and hydrogen concentration obtained from the experiments and CONTHAC-3D calculations, the ability of the CONTHAC-3D code to simulate the effects of PARs, vapor condensation, and mixed flow in large spaces can be confirmed.The mass and energy releases shown in Fig.3b were used as inputs.
The calculation also yields temperatures at different locations, and a comparison with the test results is shown in Fig.4a—f.The calculated temperature agrees well with the GX6 test result.The maximum absolute deviation of the temperature in each compartment does not exceed 9.81 K,and the maximum relative deviation does not exceed 3.029%.However, the deviation at the top of the PAR is relatively large, with a maximum absolute deviation of 74.51 K and a maximum relative deviation of 13.71%.The experimental and calculated changes in the hydrogen concentration in the different compartments are shown in Fig.4g—k.The calculated results agree well with the experimental results.The maximum absolute deviation of the hydrogen volume fraction does not exceed 0.007.The reason for the differences between the experiments and CONTHAC-3D code may be attributed to the low concentration of hydrogen,resulting in measurement and calculation errors of the PARs.A comparison between the calculated transient pressure in the container and test results is shown in Fig.4l.The absolute deviation does not exceed 14,830.0 Pa, and the relative deviation does not exceed 1.51%.
5 Study on hydrogen mitigation measures of HPR1000
5.1 HPR1000 containment model
The HPR1000 containment, which is used to restrict the release of radio-nuclides after severe accidents, consists of a cylindrical compartment and a hemispherical dome,with an inner diameter of approximately 47 m, a height of approximately 68 m, and a total free volume of approximately 88,000 m3.The primary compartments of the containment and equipment are shown in Fig.5a.Passive autocatalytic recombiner systems are being considered for mitigating the possible effects of hydrogen release during severe accidents in the HPR1000 containment.Such recombiners can installed at different locations within the containment, as shown in Fig.5a.Only the major primary system components, such as the reactor vessel, steam generators,pumps, and pressurizer in the HPR1000 containment, are modeled based on the CONTHAC-3D code; the general layout of the grid is illustrated in Fig.5b.
To match the location of the wall or equipment in the CONTHAC-3D model with the actual location of the wall or equipment in the containment, 34, 72, and 86 grids were set in the radial, circumferential, and height directions, respectively.The first node of the radial grid is located on the containment axis, the last node is located on the outer wall of the containment, and the second and third nodes are located on the outer wall of the pressure vessel and the annular cavity wall, respectively.In the circumferential direction, the nodes are uniformly distributed, with one calculation grid arranged every 5°.In the height direction, they are densely arranged below the operating platform and sparsely arranged above the operating platform.The total number of computational cells is approximately 210,000, and the average cell size in the primary system compartments is approximately 4 m3.
5.2 Accident scenario
In the study, one of the dominant plant damage states defined by the level 2 PSA study for HPR1000 is selected as the accident scenario.The initiating event is the loss of the main feed water to the steam generator.Following the start of the accident, the water level on the secondary side decreases rapidly, and the heat transfer between the primary and secondary circuits deteriorates rapidly.The primary circuit releases heat by opening the pressurizer safety valves, while the coolant in the primary circuit drains through the pressurizer safety valves into the relief tank; consequently, the relief tank ruptures, the disc damaged by the high pressure.After a certain period of time, the core begins to become exposed.When the core outlet temperature exceeds 650 °C,the operators open the quick relief valve of the primary circuit according to the operating instructions.The pressure in the primary circuit decreases and the safety injection tank is automatically injected.Subsequently, the core begins to produce hydrogen.Because of the long duration of the injection process in the safety injection tank, the core produces a large amount of hydrogen.Owing to the lack of an active safety injection system, there is no continuous injection of cooling water injection after the safety injection tank is emptied,and the primary circuit gradually heats and boils, exposing the core again.
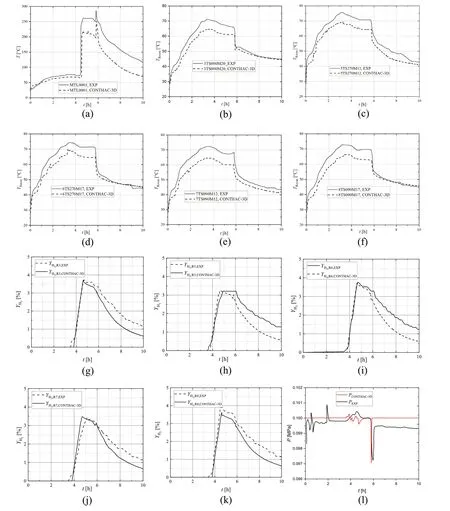
Fig.4 Hydrogen concentration in the containment.a Top of the PAR b R3 compartment c R5 compartment d R6 compartment e R7 compartment f R8 compartment g R3 compartment h R5 compartment i R6 compartment j R7 compartment k R8 compartment l Transient pressure of the containment

Fig.5 (Color online) Containment model of HPR1000 and the mass input.a Main compartments of HPR1000.b Containment model of HPR1000.c Source input of CONTHAC-3D
As the core continues to heat, another zirconium—water reaction occurs, resulting in a second hydrogen release pulse.The release of steam into the containment precedes the release of hydrogen.Therefore, in terms of the hydrogen risk, it is not necessary to calculate the full accident sequence because hydrogen is not present in the beginning.This allows a considerable reduction in the total time simulated in the calculations by defining their start as the beginning of the hydrogen release.The mass and energy released into the containment are defined via an external source table based on MAAP4 calculation [33].The steam and hydrogen flow rates that are input to CONTHAC-3D are shown in Fig.5c, wherein the initial time for hydrogen generation is set as zero for the CFD simulation.
5.3 Calculation results and analysis

Fig.6 (Color online) Hydrogen distribution at different times.a t = 1200 s b t = 2500 s c t = 4000 s
The distribution of hydrogen in the containment at different times during the accident is shown in Fig.6.As shown in Fig.6, the distribution of hydrogen is mainly affected by the released source term and flow in the compartments within the containment.Owing to the large initial momentum of the mass and energy released, the hydrogen emitted from the holes on the wall between the pressure relief box compartment and large space into the dome directly reaches the dome and then moves along the dome wall toward the lower space.The perturbation effect of steam is significantly stronger than the buoyancy effect of hydrogen.Therefore,although the hydrogen concentration in the early stages of the mass and energy release is relatively high in the broken room and the compartment connected to the broken room,as well as in the dome and the large space, in the later stage,the hydrogen concentration is continuously diluted and compressed into the lower compartment with the increase in the steam release, resulting in a higher hydrogen concentration in the lower compartment compared to that in the large space.This leads to a high hydrogen risk in the lower compartment.
The burnable cloud volumes of different compartments are presented in Fig.7a.Owing to the damage to the rupture disc of the pressurizer relief tank, the volume of flammable gas in the surge line room and pressurizer room is significantly affected by the release source.The volume growth of the flammable gas in the steam generator (SG) and main pump rooms lagged behind that of the gas in the pressurizer room.The combustible mixture cloud volumes in 1# SG room and 1# pump room are lower than those in other corresponding rooms.Because the relief tank room is adjacent to 1# SG room, the steam and hydrogen mixture is emitted from the holes between the pressurizer room and large space and then flows toward the dome under inertia.After reaching the dome, it moves downward along the dome surface and directly enters the SG and pump rooms, opposite to the broken room.Therefore, a situation exists wherein the volume of combustible gas cloud in the rooms on the side of the broken room is less than that in the opposite rooms.After 3500 s, the only source term corresponds to the steam, without hydrogen, released from the relief tank rupture disc was.The newly released steam has a good dilution effect on the original flammable mixture.Therefore, the a drastic decrease in the volume of the burnable cloud in the surge-line and pressurizer rooms is observed first, which is followed by a decrease in the volume of the burnable cloud in the SG and pump rooms.
The release rate of concentrated hydrogen was very high,and a large amount of hydrogen is released within a short period of time.As shown in Fig.6, in the early stage of hydrogen release, the distribution of hydrogen in the containment is relatively dense, whereas the PARs are evenly placed inside the containment; the PARs have a limited hydrogen removal capacity.Therefore, during the period of time when concentrated hydrogen is released, the hydrogen removal effect of the PARs is not significant.As shown in Fig.7b, during the period of concentrated hydrogen release,the amount of hydrogen released by the PARs is relatively small.Therefore, during this period, PARs have a negligible effect with regard to eliminating hydrogen risk.However,with the diffusion of hydrogen, PARs play a significant role in the later stages.The hydrogen removed by the PARs and the hydrogen remaining in the containment are depicted in Fig.7b.The total amount of hydrogen removed by each PAR is shown in Fig.7c.
PAR1, PAR2, and PAR6 are located in the pressure relief tank and surge tube compartments, and PAR3, PAR4, and PAR5 are installed on the bottom floor of the three steam generator compartments.The hydrogen removal capacity of PAR1—PAR6 is lower than that of the PARs located in other compartments mainly because these PARs are placed in lower positions.These locations exhibit relatively high hydrogen concentrations during the later stages of the accident.The hydrogen first reaches the dome and then enters the bottom compartment, downward along the dome.Therefore, the PAR located in the bottom compartment begins to remove hydrogen at a later stage.Although the pressure relief tank compartment has a high hydrogen concentration,a large amount of water vapor is emitted by the pressure relief tank compartment before the release of hydrogen,which reduces the oxygen concentration in the compartment.Therefore, the PAR in the pressure relief tank compartment did not exhibit an appreciable hydrogen removal effect.

Fig.7 (Color online) Results of the MSLB in HPR1000.a Burnable cloud volume; b Hydrogen in the containment PARs; c Hydrogen removed by different
As the accident progresses, the lower compartment inside the containment has a higher hydrogen risk than the large space inside the containment.To ensure that the PARs in the compartment perform better, the placement height of the PARs near the floor of the compartment should be appropriately increased.However, considering the uncertainty of the direction and location of the break during an accident,it is not recommended that all PARs ae installed at high positions.
6 Conclusion
This study proposes a three-dimensional thermal and hydraulic containment simulation code, named CONTHAC-3D, with independent intellectual property rights.
• The hydrogen removal rates for different types of PARs were determined, and the calculated values agree well with the experimental values.To validate CONTHAC-3D, a GX6 test was performed at the BMC facility.The hydrogen concentration and temperature evaluated using the GX6 test are accurately predicted by CONTHAC-3D.The test results indicate that CONTHAC-3D can be used to study the hydrogen distribution in a real-world NPP containment.
• Therefore, using the example of the third-generation NPP HPR1000, a study was conducted on the hydrogen distribution and mitigation measures in the HPR1000 containment simulating an accident scenario depicting the loss of the main feed water.The results show that the distribution of hydrogen is primarily affected by the released source term and flow in the compartments within the containment.Owing to the large initial momentum of the mass and energy released, the hydrogen emitted from the holes on the wall between the pressure relief box compartment and large space into the dome directly reaches the dome and then moves along the dome wall toward the lower space.In the early stage of the accident, the rooms on the flow path of hydrogen and the dome present significant hydrogen risk.However, as the accident progresses, the hydrogen concentration in the lower compartment becomes higher than that in the large space.In other words, at the later stage of the accident, the lower compartments present a higher hydrogen risk than the dome and large spacer.
• Compared with the amount of hydrogen released, the amount of hydrogen removed by the PARs during the period when concentrated hydrogen is released is small;therefore, during this period, PARs have negligible effect on hydrogen risk elimination.However, with the diffusion of hydrogen, the PARs play a significant role in the later stages.When the PAR is placed on the floor of the compartment, the hydrogen removal rate is low, and we recommend appropriately increasing the installation height of these PARs.However, we do not recommend installing all PARs at high positions.The study findings show that the CONTHAC-3D program can be used to study hydrogen mitigation measures in real containment systems during severe accidents.
Authors contributionAll authors contributed to the conception and design of this study.Material preparation, data collection, and analysis were performed by all authors.The first draft of the manuscript was written by HW, and all authors commented on the previous versions of the manuscript.All authors have read and approved the final version of the manuscript.
Data availabilityThe data that support the findings of this study are openly available in Science Data Bank https:// cstr.cn/ 31253.11.scien cedb.j00186.00130 and https:// doi.org/https:// doi.org/ 10.57760/ scien cedb.j00186.00130.
Declarations
Conflict of interestThe authors declare that they have no competing interests.
 Nuclear Science and Techniques2024年2期
- Nuclear Science and Techniques的其它文章
- Measurement of the neutron-induced total cross sections of natPb from 0.3 eV to 20 MeV on the Back-n at CSNS
- Nuclear charge radius predictions by kernel ridge regression with odd-even effects
- Unbound 28 O, the heaviest oxygen isotope observed: a cutting-edge probe for testing nuclear models
- Total ionizing dose effect modeling method for CMOS digital-integrated circuit
- A fast forward computational method for nuclear measurement using volumetric detection constraints
- Artificial neural network-based method for discriminating Compton scattering events in high-purity germanium γ-ray spectrometer