Seismic performance evaluation of water supply pipes installed in a full-scale RC frame structure based on a shaking table test
Wu Houli, Guo Endong, Wang Jingyi, Dai Xin and Dai Chenxi
1.Key Laboratory of Earthquake Engineering and Engineering Vibration, Institute of Engineering Mechanics,China Earthquake Administration, Harbin 150080, China
2. Key Laboratory of Earthquake Disaster Mitigation, Ministry of Emergency Management, Harbin 150080, China
Abstract: As an important part of nonstructural components, the seismic response of indoor water supply pipes deserves much attention.This paper presents shaking table test research on water supply pipes installed in a full-scale reinforced concrete (RC) frame structure.Different material pipes and different methods for penetrating the reinforced concrete floors are combined to evaluate the difference in seismic performance.Floor response spectra and pipe acceleration amplification factors based on test data are discussed and compared with code provisions.A seismic fragility study of displacement demand is conducted based on numerical simulation.The acceleration response and displacement response of different combinations are compared.The results show that the combination of different pipe materials and different passing-through methods can cause obvious differences in the seismic response of indoor riser pipes.
Keywords: water supply pipe; different materials; shaking table test; amplification factor; seismic fragility
1 Introduction
Nonstructural components (NSCs) are systems and elements that do not contribute to structural loadbearing but serve important functions.The seismic performance of buildings relies on the structural system and the functionality of their NSCs.Previous seismic investigations and reports have shown that the failure of NSCs will cause serious economic losses, which may even exceed the losses caused by structural damage(Myrtleet al., 2005; Anajafi and Medina, 2019).Even when structural damage is low, significant economic losses can also be caused by nonstructural damage(Mirandaet al., 2012).Compared with structural components, NSCs are expensive and more prone to damage due to their lower capacities (Reitherman and Sabol, 1995; Taghavi and Miranda, 2003).As an important part of NSCs, the seismic response of indoor water supply pipes deserves much attention.In the 2010 Chile earthquake, approximately fifty percent of buildings equipped with fire sprinkler systems showed signs of water leakage (Mirandaet al., 2012).In the 2011 Tohoku Pacific earthquake, 42% of the damaged piping systems experienced leakage (Mizutaniet al., 2012).The failure of indoor pipelines has seriously affected the lives of residents and greatly increased the repair cost.
Several experimental and numerical simulation studies have been conducted to investigate the seismic performance of indoor piping systems.On the component level, static tests (bending fatigue tests, monotonic and cyclic tests) have been presented in some literature.Antaki and Guzy (1998) conducted bending fatigue tests on carbon steel pipe specimens.Wittenbergheet al.(2010) also conducted bending fatigue tests to analyze the failure mechanism of pipe joints, and the test results were in good agreement with the finite element analysis results.Tianet al.(2013) conducted monotonic and cyclic tests on 48 pressurized sprinkler piping tee joint specimens with various materials and pipe diameters.Based on quasi-static tests and numerical simulation,Shanget al.(2019) conducted a seismic fragility study on flexible pipeline connections in a base-isolated medical building.In addition to studies on the component level,the researchers also focused on the seismic performance of piping systems on the system level.Goodwinet al.(2005) conducted shaking table experiments on typical hospital piping systems.The research identified the capacity characteristics of a hospital piping system with and without bracings and identified the system’s weak points.Hoehleret al.(2009) carried out shaking table experiments on piping systems installed in a full-scale seven-story supporting building.The pipe acceleration amplifications were focused and compared with code provisions in the research.The results suggest that the accelerations of the pipes obtained from the test were slightly higher than those predicted by ASCE 7-05 provisions.Tianet al.(2014a) tested three fullscale pressurized sprinkler specimens constructed of different materials and joint arrangements.Damage to sprinkler heads, failures of vertical hangers, and a completed branch line fracture was observed.Next,nonlinear dynamic response-history analyses were employed to verify the experimental results and enrich the research content (Tianet al., 2014b).Focusing on fire sprinkler piping systems, Soroushianet al.(2014,2015a, 2015b, 2016) and Jenkinset al.(2017) conducted a series of studies.Based on experiments and numerical simulations, seismic fragility studies of fire sprinkler piping systems were performed, and the support force,joint rotation, and relative displacement were set as demand parameters.These analyses considered various pipe designs, pipe diameters, branch lengths, junction types, and sprinkler pipe details.
In addition to experimental and numerical simulation studies, many theoretical analyses have been carried out.For seismic damage assessment purposes, NSCs are often classified into two categories: “accelerationsensitive” or “displacement-sensitive” (FEMA, 2012).Acceleration-sensitive components usually refer to components that are supported on a floor system only and that are not sensitive to the relative deformation from one floor to another floor.Displacement-sensitive components refer to components that are usually attached at several points throughout the height of a structure,also referred to as deformation-sensitive components.The floor response spectrum (FRS) approach is utilized to estimate seismic force demands on accelerationsensitive NSCs.Many papers focus on this issue, and Wanget al.(2021) published an excellent review of relevant research.In the case of displacement-sensitive(multiple supported) NSCs, the reported research is significantly less extensive (Lee and Penzien, 1983;Burdisso and Singh, 1987; Dey and Gupta, 1998, 1999),with an emphasis on decoupling the equations of motion of the supporting structure from those of the secondary system.In particular, Pardalopoulos and Pantazopoulou(2015) point out that the seismic response of multiple supported NSCs depends primarily on the relative displacements between successive support points.The analytical formulation indicates that the seismic response of displacement-sensitive NSCs is the result of the correlation between the supporting structure and the frequency content of the seismic excitation, which is exacerbated two times, the first time by the vibration of the building and the second time by the vibration of the attachments.
To evaluate the seismic performance of NSCs,including indoor piping systems, many excellent studies have been carried out by conducting experiments,analytical simulations, and theoretical analyses.In previous experimental studies, almost all testbeds were composed of steel frames, and the pipe systems were fixed on them through fixing and supporting systems.However, in reality, many pipes are installed in reinforced concrete (RC) buildings and they penetrate floor slabs and walls of the supporting structures.In this case, the seismic force is mainly transmitted to the pipe through the floor slabs.During past earthquakes, this type of pipeline has incurred considerable damage.
In this research, a shaking table experiment of indoor water supply pipes was designed and conducted.A fullscale RC frame building was used as the supporting structure and all pipes were installed in it.Three types of pipes were selected, each with a distinct material, and three methods for passing pipes through the reinforced concrete floor slabs were designed.In the test, different passing-through methods were designed by using different fillers.The purpose of this research is to evaluate the seismic performance of different combinations of various pipe materials and passing-through methods.In this paper, a detailed description of the shaking table test design is presented.The damage to the supporting structure and to the pipe system are observed and recorded.FRSs are generated and compared with code provisions.The effects of characteristics of seismic wave and damping ratio are discussed.Different material pipes and different kinds of fillers are selected, and the seismic responses of different combinations are compared.The pipes used in the test include steel plastic composite pipe(SP), aluminum plastic tube (AP), and PVCU.The fillers used in the test include asbestos cement, jute, and epoxy resin.The most prominent innovation of this test is the combination of different material pipes and different methods for penetrating the floor slabs.To date, no other experiment has carried out such a design.Note that this research is part of interrelated studies and the authors intend to present the efforts and results with as much detail as possible.
2 Experimental setup
2.1 Test-bed structure
As part of a series of interrelated tests, the geometric dimensions of the RC frame structure are almost the same as those of the masonry structure, which has been discussed in previous work (Wuet al., 2022).In this test, the geometric dimensions of the RC frame structure are shown in Fig.1, and a photo of the test model and design data are shown in Fig.2.Steam-pressurized concrete blocks and M7.5 mixed mortar were used to construct the infill walls with a thickness of 120 mm.C30 concrete was selected for the whole model.The floor slabs are poured concrete slabs with a thickness of 80 mm.The cross-section width of the RC beam is 150 mm and the cross-section height is 200 mm,and the cross-section size of the frame column is 200 mm ×200 mm.The concrete cover thickness of the floor slab, column and beam is 15 mm, 20 mm and 20 mm,respectively.Figure 3 shows the reinforcement details of the supporting structure.The parameters of reinforcement and concrete used are shown in Table 1.The frame model weighs approximately 12.5 t, the base weighs approximately 7.3 t, and the total weight of the model is approximately 19.8 t.

Fig.1 Geometric dimensions of test-bed structure (unit: mm)
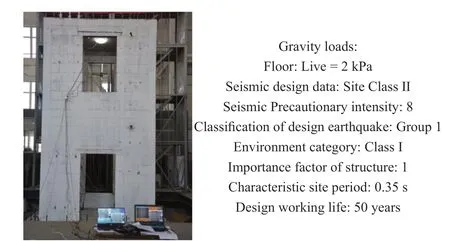
Fig.2 Model picture and experimental design parameters
2.2 Piping layout
In this experimental research, a full-scale RC frame structure was used as the test-bed, and both water supply pipes and gas pipes were installed in it.This research focuses on the seismic performance of water supplypipes; thus, the contents of gas pipes are not presented herein.Nine water supply riser pipes were installed in the test-bed and were independent of each other; three of them were connected to the service pipes.Pipes and fillers with different material properties were used in this research, and were combined to evaluate the difference in the seismic performance of indoor water supply pipe systems.The parameters of all pipes, including nine riser pipes and three service pipes, are shown in Table 2.

Table 1 Parameters of materials (unit: MPa)
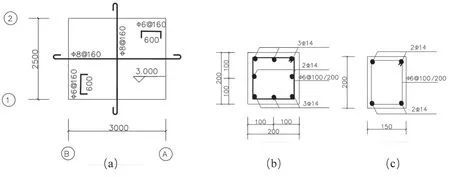
Fig.3 Reinforcement of the model (unit: mm): (a) details of first and second floors; (b) details of columns; (c) details of beams
The pipes used in the test include SPs, APs, and PVCUs.The fillers used in the test include epoxy resin,jute, and asbestos cement.Note that one of the reasons for choosing these pipes and fillers is that they are widely employed in China.Riser pipes were fixed on the infill walls through braces and clamps, which were set at elevations of 0.2 m, 1.6 m, and 4.2 m.At the bottom of each riser, a valve was fitted, and a pressure gauge was attached at the top to facilitate the observation of pipeline leakage.All water supply risers were filled with water and pressured to 101 kPa before loading.At the elevation of 3.3 m, a joint was set for each riser.T-joints were used to connect risers and service pipes, while the 1-joints were set on other risers.For all three service pipes, J1 was connected to JL2, J2 was connected to JL5,and J3 was connected to JL8.
Installation positions of all pipes are shown in Fig.4.The reserved holes on the first and second-floor slabs are presented in Figs.4(a) and 4(b) shows the reserved holes in the infill walls.The construction details of the risers passing through the reinforced concrete floors and the service pipes passing through the infill walls are shown in Fig.5, which are common pipe installation methods in actual buildings in China.The large-diameter casing pipe was installed on the floor or wall in advance, then the water supply pipe was put into the casing pipe, and the space between the casing and the water supply pipe was filled with filler.For different passing-through methods,the only difference is the type of filler in this test.
Example pictures of piping installation are shown in Fig.6.Different passing-through methods are shown in Fig.6(a).The valves and supports at the bottom of the risers, as well as the pressure gauges and top floor load, are presented in Figs.6(b) and 6(c), respectively.All braces are anchored on the infill walls, and example pictures of anchoring details on both sides of the infill walls are shown in Figs.6(d) and 6(e).The joints and service pipe are shown in Fig.6(f), and Fig.6(g) presents the service pipe passing through the infill wall.
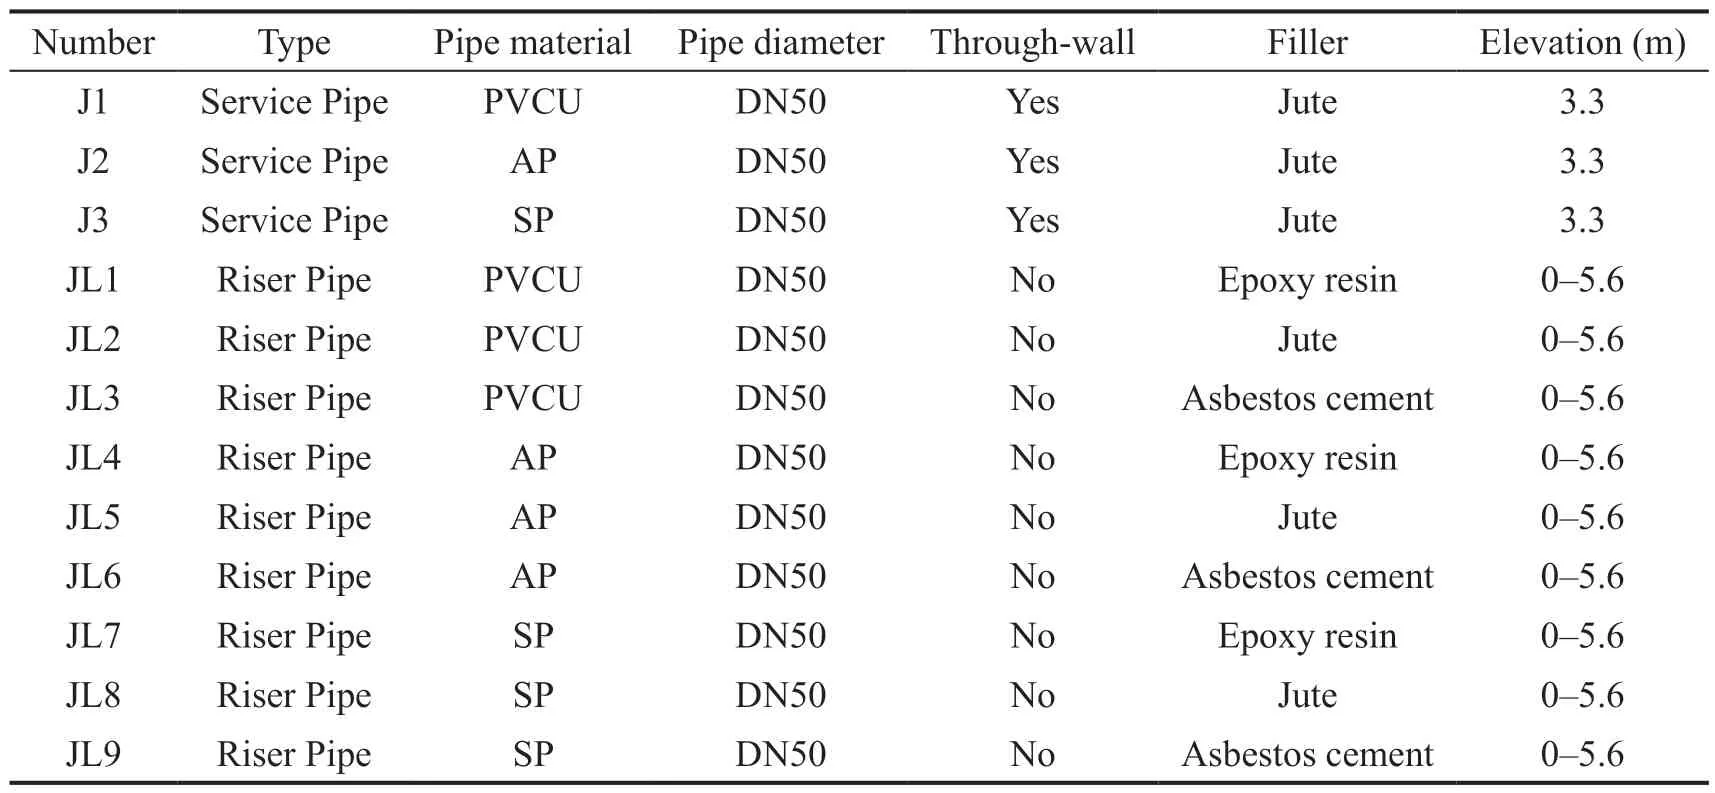
Table 2 Pipe installation parameters
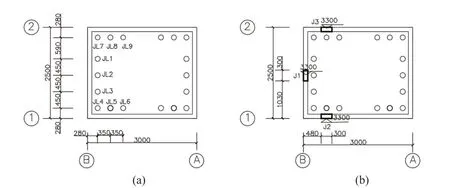
Fig.4 Pipe installation positions (unit: mm): (a) reserved holes on the floor slabs; (b) reserved holes in the infill walls
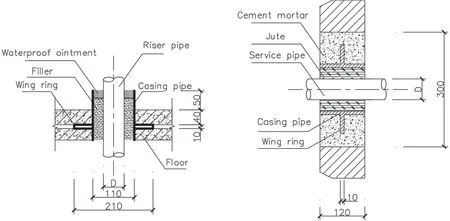
Fig.5 Construction details (unit: mm): (a) risers passing through floors; (b) service pipe passing through infill walls
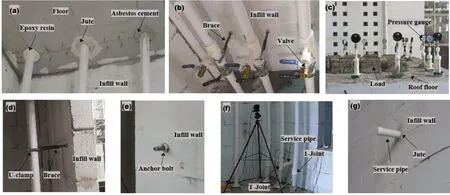
Fig.6 Example pictures of piping installation
2.3 Instrumentation and loading protocol
Accelerometers and pull rope displacement sensors were used to measure the structure and pipe responses.Each riser was monitored by an accelerometer.In this test, it was difficult to measure the relative displacements of the pipes with the pull rope displacement sensor,and the displacement data was obtained by numerical simulation.The responses of the structure were monitored by a combination of accelerometers and displacement sensors.The acceleration and displacement responses of the base, first floor, and second floor were measured in both theXdirection andYdirection.Figure 7 depicts the exact locations of the sensors installed on the supporting building.The parameters of all sensors involved are shown in Table 3.
According to GB 50011-2010 (2010), three seismic ground motions were selected: El-Centro record, Chi-Chi record, and San Fernando record.Table 4 lists these earthquake records used in the test.Figure 8 showsseismic response spectra of three selected records and specifications.During the test, white noise scanning was conducted to detect changes in the natural frequencies before and after each excitation.

Table 3 Parameters of sensors
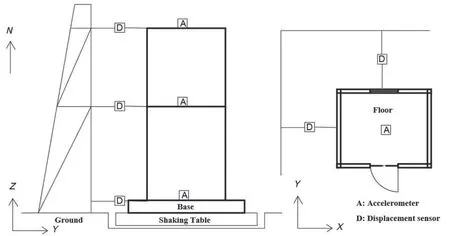
Fig.7 Sensor arrangement of the supporting structure

Table 4 List of earthquake records used in the test
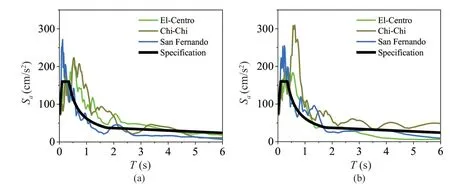
Fig.8 Seismic response spectra of the earthquake records: (a) X direction; (b) Y direction
Ground motions were input in both theXdirection andYdirection, and the ratio of ground motion amplitude in theXdirection to that inYdirection was 1:0.85 in terms of GB 50011-2010 (2010).Table 5 lists the test program and the designed peak ground accelerations (PGAs) of theXdirection andYdirection.Due to the doors and windows, the stiffness of the supporting structure in the two horizontal directions was different.The response of the riser pipe was the key point of the test, so the change in loading directions was considered under high earthquake intensities.Due to damage to the infill walls and concerns that the blocks would fall and hit the test equipment, they were only loaded to sequence 17.
3 Experimental results
3.1 Damage observation
During the test, the ground motions were input according to the sequence in Table 5, and the loading processes were recorded by four cameras installed in the test-bed structure.After each loading, pictures and detailed sheets were used to record the damage phenomenon of the testbed structure and piping system.The locations and shapes of structural cracks as well as the corresponding sequences were recorded in detail.The damage to pipe joints, clamps, pipe bodies, valves,and the change of pressure gauge readings were also recorded.
During sequences 2, 3, and 4, there was no visible crack on the infill walls, which met the designexpectation.From sequence 6 (El-Centro wave 0.20 g),visible cracks began to appear on the walls.With the increase of input motion intensity, the cracks extended continuously.During sequence 11 (Chi-Chi wave 0.40 g),the block began to break and fall.During sequence 17(Chi-Chi wave 0.62 g), the infill walls were seriously damaged, which were about to separate from the frame and collapse, and the test was stopped.After all loading,the infilled walls of the first floor were severely damaged,while only a few cracks appeared on the infill walls of the second floor.Example pictures of structural damage are shown in Figs.9(a), 9(b) and 9(c).It is well known that the shear force of the ground floor is greater than that of the second floor, and this can explain why the damage to the infill walls of the ground floor is much more serious than that of the second floor.

Table 5 Test program
The first visible crack at the fixed position of the brace appeared during sequence 8 (San Fernando wave 0.20 g).As the loading continues, some bolts for fixing braces started to loosen and the cracks at the fixed points extended continuously.After sequence 17 (Chi-Chi wave 0.62 g), due to the serious damage of the infill walls and the loosening of part of the bolts, more than half of the braces and u-clamps of the first floor failed.Note that the failure of all supporting components was almost caused by the cracking of the infill walls at the anchorage position and the loosening of bolts.There was no fracture or serious deformation of the clamps.Example pictures of failure of supporting and fixing components are shown in Figs.9(d) and 9(e).During the whole experiment, all pipes and joints did not break or leak, and there was no obvious deformation after all loading.Moreover, there was little change in the readings of all pressure gauges.
3.2 Structural response
The acceleration and displacement responses of the base, first floor and second floor were measured in this test.Most code-based seismic design provisions consider acceleration-sensitive components by specifying equivalent static design forces, and displacementsensitive components by applying drift limits or relative displacement limits (Filiatraultet al., 2021).In terms of ASCE 7-16 (2017), the equivalent static design force of NSCs is:
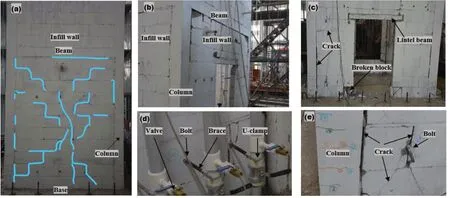
Fig.9 Examples of observed damage
The term [1 + 2(z/h)] refers to an estimation of floor acceleration amplification, which is the ratio of the peak floor acceleration (PFA) to the peak ground acceleration (PGA).zrepresents the height of the floor,andhrepresents the roof height of the structure.Similar expressions exist in other specifications, such as Chinese GB 50011-2010 (2010) and Eurocode 8 (CEN, 2004).According to GB 50011-2010, [1+z/h] representsPFA/PGA, and for Eurocode 8, [1 + 1.5(z/h)] is adopted.In recent studies, Pardalopoulos and Manolis (2021) and Pardalopoulos and Lekidis (2021) demonstrated that the peak absolute acceleration developing along the height of a vibrating structure depends on the deformed shape that the structure obtains at the instant of its peak seismic response.ThePFAdeveloping at levelzof the RC frame structure is estimated according to Eq.(2).
wherePRAis the peak roof acceleration, andψ(z) is the deflected shape of the RC frame structure at the instant of its peak seismic response.The floor acceleration amplifications of the supporting structure in this test were calculated for all excitations, and the results were compared with the values of the code provisions and the values deriving from application of the methodology introduced by Pardalopoulos and Mandis (2021) and Pardalopoulos and Lekisdis (2021).Figure 10 shows a comparison of the test results with GB 50011-2010(2010), ASCE 7-16 (2017), Eurocode 8 (CEN, 2004),and Pardalopoulos’ methodology.The mean value is basically consistent with GB 50011-2010 (2010), the maximum value of the experimental results is basically consistent with Eurocode 8 (CEN, 2004), and the amplification factors estimated by ASCE 7-16 (2017)are overestimated.Similarly, through comparison, it is found that thePFA/PGAvalues of the first floor deriving from Pardalopoulos’ methodology are very close to the values of GB 50011-2010 (2010), the mean, and the 84%of all test data.However, in terms of the data obtained in this test, the amplification factors of the second floor estimated by this method may be slightly overestimated.
Interstory drifts were also calculated and Fig.11(a)shows the results of all excitations.The maximum value exceeds 0.04, which shows that the testbed structure has good ductility.Figure 11(b) shows the relationship between interstory drift and floor acceleration amplification.Obviously, the floor acceleration amplification factor decreases with the increase of story drift.This is because the yielding of the testbed structure reduced the floor acceleration amplifications (Soroushianet al.,2016), which is not reflected in existing seismic design requirements (Wieseret al., 2013).

Fig.10 Floor acceleration amplifications: (a) X direction; (b) Y direction
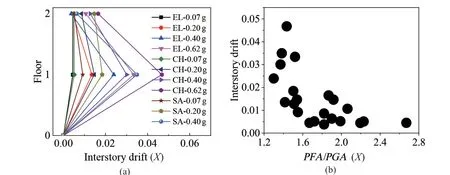
Fig.11 (a) Interstory drift; (b) trend between interstory drift and PFA/PGA
3.3 FRS and NSC amplification factor
TheFRSin terms of accelerations is usually employed for the seismic design of NSCs.For NSCs,the seismic input motions are derived from the floors in the supporting building at which they are attached rather than from ground motions (Filiatraultet al., 2021).TheFRSapproach can be summarized as computing floor response spectra for various levels, and amplification will vary as a function of the component period.In Eq.(1),the NSCs amplification factor,ɑp, is the ratio of peak component acceleration (PCA) toPFA.Based on the measured floor acceleration time histories of the RC frame structure, the normalizedFRSwere generated and compared with ASCE 7-16 (2017), and the results are shown in Fig.12.
Figure 12(a) shows the individual, mean, mean minus standard deviation and mean plus standard deviation of all of theɑpspectra with a 0.05 damping value.The period (Tp) is normalized by the fundamental period of the supporting building (T) and the spectra were compared with the ASCE 7 provision.From the figure, the maximum value of parameterFRS/PFAis 5.52 with a mean plus standard deviation of 3.9, which is 1.56 times the ASCE 7-16 limit value (2.5).The figure shows that when the period of the component is near the fundamental period of the structure (Tp/Tis approximately equal to 1), the values of mean, mean plus standard deviation and ASCE 7-16 are close to each other.However, in a wide range of periods, the ASCE 7-16 component amplification factor underestimates the computed values.This point of view has been mentioned in a previous study (Anajafi and Medina, 2018).Note that the maximum value ofɑpspectra does not appear at the fundamental period of the supporting structure (Tp/T=1).In this test, through white noise scanning, the first three modal periods of the supporting structure are 0.256 s,0.072 s and 0.045 s, respectively.
The meanɑpspectra under three different seismic wave excitations are shown in Fig.12(b).There are obvious differences in spectra ordinates under different seismic waves.During San Fernando excitation, the maximum of mean spectra ordinate is 3.9 obtained atTp/T=0.61.However, the value of the El-Centro excitation is 2.2, and the value of the Chi-Chi excitation is 2.03 at this position.During Chi-Chi excitation, the maximum of the mean spectra ordinate is 3.17 obtained atTp/T=2.4.However, the value of the El-Centro excitation is 1.74, and the value of the San Fernando excitation is 1.25 at this position.The mean spectrum under El-Centro excitation is very similar to ASCE 7-16 (2017).It can be concluded that the seismic wave characteristic has a significant effect on the acceleration amplification factor of NSC.Note that there is a slight difference in the spectral values of the three waves aroundTp/Tequal to 1.

Fig.12 (a) First-floor spectra with 0.05 damping value normalized to PFA and comparison with code provision; (b) comparison of FRS normalized to PFA under different seismic waves
A 5% damping value was adopted to compute the absolute accelerationFRSshown in Fig.13, and most of the previousFRSstudies have adopted this value.However, little evidence exists to suggest that a value of 5% is appropriate in all cases (Anajafi and Medina,2019).Archilaet al.(2012) conducted modal testing to determine the modal parameters of 11 NSCs, and the results showed that the damping value of the test pipeline system was in the range of 0.4%-2.6%.In several publications (Tianet al., 2014a, 2014b; Tatarsky and Filiatrault, 2019), the damping value of piping systems varies between 2% and 12.7%.Recent studies(Anajafi and Medina, 2019; Kazantziet al., 2020) use the damping modification factor (DMF), which is defined as theFRSwith a given damping ratio relative to theFRSfor a 5% damping ratio, to quantify the influence of the damping value,ξ, on the seismic responses of NSCs.
Figure 13(a) shows the meanɑpspectra with different damping values.The spectral ordinates with different damping values vary greatly.It can be concluded that changing the damping will significantly change the results when calculatingFRS.Figure 13(b) illustratesDMFs computed based on floor spectra assumingξvaries from 2% to 10%.Anajafi and Medina (2019) concluded that the NSC damping and tuning period ratio (Tp/T) are two parameters that significantly affect the ordinates of a floor spectrumDMF.This point of view can be verified by the test data presented in Fig.13(b).In general, the value of the damping ratio can significantly affect the outcomes, and the 5% damping value is not applicable to all NSCs.More comprehensive research is needed on this problem.In addition, the ASCE 7-16(2017) component amplification factor underestimates the computed values in some range of periods, and Fig.13(a) shows that this trend is more obvious for a low damping ratio.
3.4 Seismic performance evaluation of piping system
The seismic demand of NSCs is controlled by two basically different filters that are connected in series;that is, the filtering effect of the supporting building and the filtering effect of NSCs.Pardalopoulos and Pantazopoulou (2015) point out that the seismic response of displacement-sensitive NSCs is the result of the correlation between the supporting structure and the frequency content of the seismic excitation, exacerbated by two times: one for the vibration of the building and one for the vibration of NSCs.However, in more recent research of Pardalopoulos and Manolis (2021), and Pardalopoulos and Lekidis (2021), it is demonstrated that for displacement-controlled secondary systems,the seismic excitation and vibration of the supporting structure is reflected by the building’s deflected shape at the instant of its peak seismic response.In this test, since all pipes are installed in one structure, the deflected shapes of the supporting structure related to different risers are the same.The main purpose of the experimental research is not to accurately evaluate the specific seismic response parameter values of each riser (such as internal force,deformation, etc.).The real concern is to explore whether there are differences in seismic response of different combinations under conditions that the deflected shape of the supporting structure and the clamp constraint are the same for all pipes.Many variables, including whether connected with the service pipe, different pipe materials, and different fillers, were designed.It is worth noting that, of the three fillers, epoxy resin is the softest,asbestos cement is the stiffest, and jute is between the two.Similarly, among the three types of pipes, SP has the highest stiffness, PVCU is the softest, and AP’s performance sits in the middle.Different combinations have different vibration characteristics, and this design aims to assess the influence of the vibration of the piping system on its seismic demand.
In this research, the acceleration amplification factor,ɑp, is used as one of the parameters to measure the seismic differences between different combinations.This does not mean that the riser is an acceleration sensitive component.Due to all pipes being installed in one testbed structure, the deflected shape of the supporting structure and the clamp constraint related to different risers are the same.In this case, it is reasonable to useɑpas a parameter to compare the difference in seismic response between different combinations in this research.For example, such as JL1 and JL3, the deflected shape of the supporting structure, clamp constraint, cross-section and material of the two risers are exactly the same.Under these circumstances, greater acceleration obviously means greater internal force and pipe deformation.Also, the acceleration data is directly measured by the acceleration sensor, eliminating errors in the calculation and methodology.
In the experiment, the accelerations of all combinations are measured.All risers’ acceleration amplification factors (ɑp) are calculated by normalizing the peak piping system acceleration by thePFAof the supporting structure, and theɑpvalues of all pipes are shown in Table 6.The statistical metrics maximum,minimum, average, and median are used to comparetheɑpvalues of different pipes.The maximum values of all pipes range from 2.76 to 4.83, which obviously exceeds the maximum limit of ASCE 7-16 (2017) with a value of 2.5.The average values range from 1.86 to 2.59, and only the value of JL8 exceeds the limit of 2.5.The median values range from 1.37 to 2.30, and all values are less than 2.5.Based on the average and median values, for indoor riser pipes, it is reasonable for ASCE 7-16 (2017) to set 2.5 as the maximum limit of the acceleration amplification factor.

Table 6 Acceleration amplification factors of all pipes
The most prominent innovation of this experiment is the combination of pipes with different materials and different methods for penetrating the RC floor slabs.Pipe JL1 is made of PVCU (soft) and epoxy resin (soft),whereas pipe JL3 is made of PVCU (soft) and asbestos cement (hard).The sole distinction between JL1 and JL3 is the employment of various fillers.As shown in Table 6, the maximum amplification factor of JL1 is 3.61, the minimum value is 1.32, the average value is 2.14 and the median value is 1.90.However, the maximum amplification factor of JL3 is 3.55, the minimum value is 1.04, the average value is 1.89 and the median value is 1.37.Regardless of the maximum value, minimum value, average value or median value, the values of JL1 are greater than those of JL3.Pipe JL7 is made of SP(hard) and epoxy resin (soft), whereas pipe JL9 is made of SP (hard) and asbestos cement (hard).Similar to JL1 and JL3, the difference between JL7 and JL9 is only the use of various fillers.The maximum amplification factor of JL7 is 2.89, the minimum value is 1.43, the average value is 1.86 and the median value is 1.64.However,the maximum amplification factor of JL9 is 2.95, the minimum value is 1.5, the average value is 2.06 and the median value is 2.Regardless of the maximum value,minimum value, average value or median value, the values of JL9 are greater than those of JL7.
To more clearly reflect the seismic response differences of different combinations, box plots of JL1,JL3, JL7, and JL9 were generated and compared, as shown in Fig.14.Figure 15 shows example comparisons of acceleration time history for these pipes.It can be clearly revealed that the response of JL1 is greater than that of JL3, and that the response of JL9 is greater than that of JL7.Through the comparison of the test data, it can be observed that when the material properties of the pipes are similar to the material properties of the filler(e.g., JL1 and JL9), a greater acceleration response occurred.When the material properties of the pipes differ significantly from those of the fillers (e.g., JL3 and JL7),the acceleration response tends to be smaller.Inspired by this observation, for indoor pipes that penetrate walls or floors, the material property differences between fillers and pipes can be fully utilized to reduce damage during earthquakes.High stiffness pipes should be combined with flexible fillers, and low stiffness pipes should be combined with rigid fillers.

Fig.14 Comparison of acceleration amplification factors of different pipes: (a) box plots of JL1 and JL3; (b) box plots of JL7 and JL9
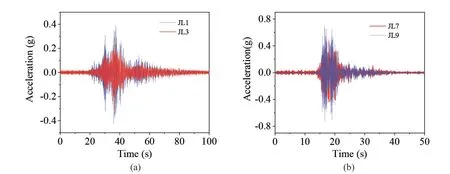
Fig.15 Example acceleration comparison: (a) JL1 and JL3 under Chi-Chi wave 0.20 g; (b) JL7 and JL9 under San Fernando wave 0.20 g
In Section 3.3, it has been shown that the seismic wave characteristics have an obvious influence on the acceleration amplification factors of NSCs.During San Fernando excitation, the maximum spectra ordinate is greater than that of El-Centro and Chi-Chi.Here, the test data were applied to verify this conclusion.The acceleration amplification factors of all riser pipes under different seismic excitations are presented in Fig.16, and the statistical parameters (maximum, minimum, average,and median) are shown in Table 7.The parameters under the San Fernando wave are significantly greater than those under the El-Centro wave and Chi-Chi wave.The same conclusion can be drawn that the seismic wave characteristic has a significant effect on the acceleration amplification factor of NSC.
3.5 Seismic fragility analysis
Seismic fragility is defined as a conditional probability function, and the cumulative normal distribution function described in Eq.(3) can be used to approximate the exceedance probability of demand exceeding capacity (Nielson and DesRoches, 2007).
The parameterSdrepresents the demand’s median,Screpresents the median estimated capacity,βD|IMrepresents the demand’s logarithmic standard deviation in relation to theIM,βcrepresents the component capacities’ logarithmic standard deviation, and Φ ()· is the cumulative normal distribution function.Equations (4)and (5) can be used to estimateSdandβD|IM(Cornellet al., 2002).

Fig.16 PCA/PFA box plots under different seismic excitations

Table 7 Acceleration amplification factors under different wave
The parameterdiis the peak demand that corresponds to theith motion among the totalNmotions.
Certain previous studies have applied this experimental fragility methodology to study the seismic performance of piping systems, and pipe displacement was chosen as an important engineering demand parameter (EDP) (Soroushianet al., 2014; Jenkinset al., 2017).In this test, it was difficult to measure the displacement of the pipes with the pull rope displacement sensor, and the displacement data could only be obtained by numerical simulation.The analytical model of the piping subsystem was developed in ABAQUS software.Notably, for NSCs, the seismic input motions come from the floor slabs in the supporting structure at which they are attached rather than from ground motions.In the numerical models, the building structure was not taken into account, pipes, fillers, pipe braces, and clamps were modeled, and the measured floor motions were employed as the input excitations.The pipes were modeled by shell elements; the fillers were modeled by solid elements with homogeneous properties; the braces were modeled by beam elements with constant properties; and the clamps were modeled by truss elements.Furthermore,the contacts between the pipes and the fillers, as well as the contacts between the pipes and the clamp, were wellconsidered.A friction surface was arranged between the pipe and the filler, and the pipe and the clamp were tied together.A modulus of elasticity of 1102 MPa, yield strength of 40 MPa, and density of 1350 kg/m3were assigned to the pipe PVCUs.The pipe SPs were modeled with elasticity of 112500 MPa, yield strength of 235 MPa,and density of 4340 kg/m3.The fillers were modeled by elastic materials, and the elastic modulus of epoxy resin and asbestos cement were set to 800 MPa and 30000 MPa, respectively.The braces and clamps were modeled with an elasticity of 206000 MPa, yield strength of 325 MPa, and density of 7800 kg/m3.
For the riser, a larger relative displacement response means a larger internal force and a higher possibility of damage caused by collisions between the pipe and surrounding components.Clearance shall be provided around all pipes passing through walls and floors in accordance with NFPA 13 (2011).Based on the relevant provisions of NFPA 13 (2011), Soroushianet al.(2014)developed four displacement limit states (LSs) to discuss the seismic performance in terms of pipeline collisions.LS1, LS2, LS3 and LS4 correspond to pipe displacement demands that exceed thresholds of 15 mm, 25 mm, 50 mm,and 80 mm, respectively.After evaluation and comparison,these thresholds were adopted in this study.The dispersion,βc, was set to a constant value of 0.4, which is a typical value for nonstructural systems (ATC-58, 2013).In this section, numerical simulations were conducted,maximum displacements for different combinations were adopted for fragility analysis, andPFAwas the onlyIMconsidered.Equation (4) can be rewritten in the logarithmically transformed space as Eq.(6):
Figure 17 shows the relationship of displacement demands andPFAs for different combinations and the corresponding regression parameters.Displacement fragility curves for JL1, JL3, JL7, and JL9 were developed using Eq.(3).Table 8 shows the lognormal parameters that characterize the piping displacement fragility from the regression analysis for the four analyzed combinations.For the four limit states, the fragility parameters of JL1 are smaller than those of JL3, and the fragility parameters of JL9 are smaller than those of JL7.The piping displacement fragility curves are shown in Fig.18.Pipe JL1 was compared with JL3 in Fig.18(a), and pipe JL7 was compared with JL9 in Fig.18(b).A comparison of parameters in Table 8 and fragility curves in Fig.18 reveal that JL1 and JL9 are more prone to damage than JL3 and JL7.

Fig.17 Regression fitting for different combinations

Table 8 Comparison of displacement fragility parameters
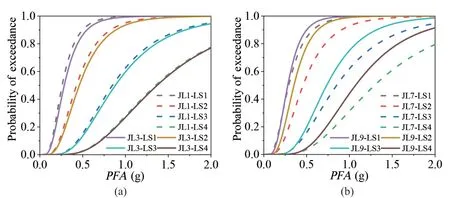
Fig.18 Comparison of displacement fragilities for different combinations
When a pipe with high stiffness is combined with a rigid filler, it can produce a greater displacement response.Similarly, the displacement response of the combination of a low stiffness pipe and flexible fillers is larger than that of the combination of a low stiffness pipe and rigid filler.The results of the displacement fragility analysis are consistent with the result of the measured acceleration amplification factor.Inspired by these observations, for indoor pipes that penetrate walls or floor slabs, the material property differences between fillers and pipes can be fully utilized to reduce damage during earthquakes.High stiffness pipes should be combined with flexible fillers, and low stiffness pipes should be combined with rigid fillers.However, for specific quantification, more research is needed.
4 Summary and conclusions
In this paper, a detailed description of a shaking table experiment of indoor riser pipes installed in a RC frame structure is presented.The design of the test model and the test process are introduced.The damage observed during the test is described.FRSand its influencing factors (damping and characteristics of seismic waves)are discussed.The acceleration amplification factors of riser pipes are discussed and the seismic responses of different combinations are compared and evaluated.Finally, a seismic fragility study of displacement demand is conducted based on numerical simulation.The main results are as follows:
(1) ASCE 7-16 may overestimate the floor acceleration amplification (PFA/PGA).The maximum value of the NSCs amplification factor (ɑp) is not always obtained at the fundamental period of the supporting structure.Theɑpvalue estimated by ASCE 7-16 is accurate near the fundamental period of the structure,but it may underestimate the acceleration demand in some range of periods.This trend is more obvious for a low damping ratio.
(2) Pipe amplification factors obtained from experimental data are comparable to factors obtained from theFRS.As demonstrated by theFRSand measured data, seismic wave characteristics have a significant impact on the amplification factor of NSCs.
(3) For indoor risers, the combination of different pipe materials and methods for penetrating the reinforced concrete floor can cause obvious differences in seismic response.High-stiffness pipes should be combined with flexible fillers, while pipes with low-stiffness should be matched with rigid fillers.This difference in material properties can be fully utilized to partly reduce seismic damage to the indoor piping system.
Acknowledgment
This work was supported by Scientific Research Fund of Institute of Engineering Mechanics, China Earthquake Administration (Grant Nos.2021EEEVL0204 and 2018A02).
 Earthquake Engineering and Engineering Vibration2024年1期
- Earthquake Engineering and Engineering Vibration的其它文章
- Reliability-based life-cycle cost seismic design optimization of coastal bridge piers with nonuniform corrosion using different materials
- Finite element model updating for structural damage detection using transmissibility data
- Experimental study on seismic reinforcement of bridge foundation on silty clay landslide with inclined interlayer
- A novel mitigation measure for normal fault-induced deformations on pile-raft systems
- Longitudinal vibration characteristics of a tapered pipe pile considering the vertical support of surrounding soil and construction disturbance
- Resilient performance of self-centering hybrid rocking walls with curved interface under pseudo-static loading
