Experimental study on seismic reinforcement of bridge foundation on silty clay landslide with inclined interlayer
Lei Da, Xiao Hanmo, Ran Jianhua, Luo Bin, Jiang Guanlu and Xue Tianlang
1.College of Civil Engineering, Sichuan Agricultural University, Dujiangyan 611830, China
2.Sichuan Higher Education Engineering Research Center for Disaster Prevention and Mitigation of Village Construction, Dujiangyan 611830, China
3.School of Civil Engineering, Southwest Jiaotong University, Chengdu 610031, China
Abstract: A shaking table test for a bridge foundation reinforced by anti-slide piles on a silty clay landslide model with an inclined interlayer was performed.The deformation characteristics of the bridge foundation piles and anti-slide piles were analyzed in different loading conditions.The dynamic response law of a silty clay landslide with an inclined interlayer was summarized.The spacing between the rear anti-slide piles and bridge foundation should be reasonably controlled according to the seismic fortification requirements, to avoid the two peaks in the forced deformation of the bridge foundation piles.The “blocking effect” of the bridge foundation piles reduced the deformation of the forward anti-slide piles.The stress-strain response of silty clay was intensified as the vibration wave field appeared on the slope.Since the vibration intensified, the thrust distribution of the landslide underwent a process of shifting from triangle to inverted trapezoid, the difference in the acceleration response between the bearing platform and silty clay landslide tended to decrease, and the spectrum amplitude near the natural vibration frequency increased.The rear anti-slide piles were able to slow down the shear deformation of the soil in front of the piles and avoid excessive acceleration response of the bridge foundation piles.
Keywords: silty clay landslide; inclined interlayer; shaking table test; anti-slide pile; bridge foundation pile
1 Introduction
With the rapid development of regional economic integration and engineering technology, bridge engineers have developed and applied anti-slide piles and other supporting structures to strengthen bridge foundations during landslides in areas prone to high intensity earthquakes.At present, there are many experimental and theoretical studies on landslide reinforcement by anti-slide piles.Koutsabeloulis and Griffiths (1989),Adachiet al.(1989), Liang and Zeng (2002), Chen and Martin (2002), and Martin and Chen (2005) obtained the stress and deformation law of soil arches between piles through theoretical calculation, which were based on model tests and numerical analysis, and expounded the deformation characteristics of anti-slide piles and sliding soil when they cooperatively bore forces.
In addition, the developmental characteristics of the soil arch under different working conditions have been analyzed, and the influence of physical and mechanical soil parameters on the forced deformation of a pile body has been discussed.In addition, the development characteristics of soil arches under different working conditions have been analyzed, and the influence of the physical and mechanical conditions of the soil on the stress and deformation of the pile was also analyzed.Zhouet al.(2004) proposed a formula for calculating the reasonable pile spacing of anti-slide piles in landslide reinforcement by analyzing the deformation characteristics of a soil arch under different working conditions and verified the feasibility of this method by comparing the actual engineering sites.Zhaoet al.(2006) assumed that the force transmission path of soil arches between anti-slide piles was parabolic.On the basis of satisfying the stress equilibrium conditions of the soil arch and anti-slide piles, according to the analytical calculation results, an improved calculation method of anti-slide pile spacing was proposed (Nianet al., 2008).Raoet al.(2019) extended the two-dimensional limit stress-strain analysis to the three-dimensional working condition, and obtained the upper limit of the slope safety factor according to the mechanism of rotation failure.Thus, it was concluded that the “end effect”generated when the slope was damaged had little effect on the optimal position of the pile but had a significant effect on the slope safety factor.Their method can be used to evaluate the stability of a slope reinforced by anti-slide piles.At present, the world has entered a new active period of plate movement (Liuet al., 2009; Liet al., 2019), and the anti-slide piles are used to strengthen bridge foundation on landslides with inclined interlayers.The reinforcement scheme adopted, for the purpose of seismic resistance, is generally determined based on practical experience or rough calculation applying the limit equilibrium theory.The lack of systematic and indepth scientific research has brought technical obstacles to improve the quality of project construction.
When the bridge foundation is built in a landslideprone area, the “slope effect” is prominent in earthquakes(Zhouet al., 2016).Zouet al.(2020) took the bridge foundation reinforced by anti-slide piles as an example on a gravel soil landslide site, and proposed that the deformation on both sides of the pier foundation is greatly different based on the model test, and the service performance is affected by the dynamic response of the soil.In the interaction of seismic soil-pile-structure,Lianget al.(2017, 2019) analyzed the dynamic response characteristics of pile groups supporting bridge structures of different stiffness by loading uniform and non-uniform seismic waves, and expounded the influence of the wave passage effect on the forced deformation of foundation piles of a long-span cable-stayed bridge, which provides useful reference for model test design.On this basis, it is of great significance to deeply analyze the characteristics of cooperative forced deformation of anti-slide piles and the bridge foundation in different geological conditions.
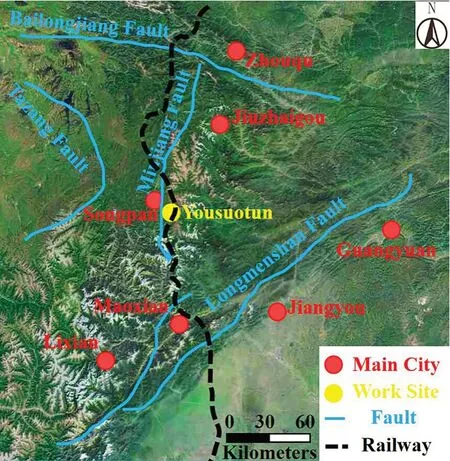
Fig.1 Geology status of the Chengdu-Lanzhou Railway
The Chengdu-Lanzhou Railway extends from the Chengdu plain to the eastern edge of the Qinghai-Xizang Plateau, which passes through the Longmenshan,Minjiang fault zones in the northwest of Sichuan province and the south of Gansu province.The regional geological structure is complex (Duet al., 2012; Yang,2012), as shown in Fig.1.In this study, a shaking table test study was carried out based on the Yousuotun worksite where the bridge foundation was strengthened by anti-slide piles on silty clay landslide.By loading the El Centro waves with different acceleration peaks,the deformation characteristics of bridge foundation piles were obtained, and the stress and deformation characteristics of a silty clay landslide with inclined interlayer were expounded.Then the time-frequency domain characteristics of acceleration response of rocksoil mass and foundation piles were analyzed.Finally,the evolution process of landslide failure was discussed,and the cooperative working law of anti-slide piles and bridge foundation piles was summarized.The results revealed the characteristics of collaborative stress and deformation of anti-slide piles and bridge foundation piles and obtained the acceleration response and deformation development law for a silty clay landslide with inclined interlayer, which provided a technical reference for seismic reinforcement design of engineering structures under similar conditions.
2 Shaking table test design
2.1 Introduction of test equipment
The HS-40t unidirectional electro-hydraulic servo drive shaking table independently designed by Southwest Jiaotong University (Li and Yang, 1996) was used in the test.The main components are shown in Fig.2.The common performance indexes are shown in Table 1.As shown in Fig.3, the length × width × height of the rigid model box is 3.7 m × 1.5 m × 2.1 m, which is fixed on the shaking table surface by bolts.The side wall is equipped with tempered glass, which is convenient for model filling and experimental observation.The outer frame of the model box is composed of square steel,which provides the necessary strength and stiffness.

Fig.2 Hydraulic shaking table
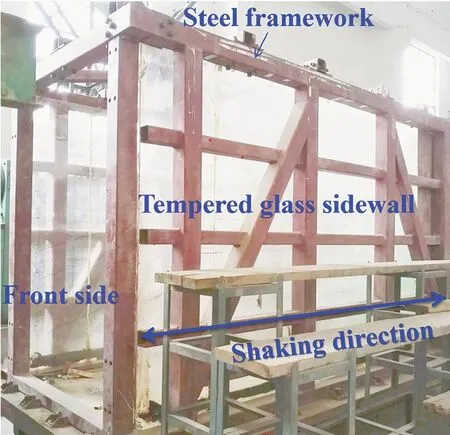
Fig.3 Rigid model box
2.2 Similarity design
To minimize the influence of the boundary effect(Zhuanget al., 2016; Ilankatharan and Kutter, 2010; Chen and Li, 2015), the geometric size of the engineering site is reduced by 40 times, so that the ratio of the plane size of the landslide model to the structure meets the premise of greater than five (Louet al., 2000).With length,weight and acceleration as control factors, the similarity relationship between the main physical quantities is derived according to the three similarity theorems (Liet al., 2011; Luoet al., 2016).Cis defined as the similarity ratio of physical quantities between the prototype and the model.The similarity criteria are shown in Table 2.The similarity constants were derived according to the dimensional analysis method (Linet al., 2018; Lin and Wang, 2006).With mass (M), length (L) and time (T)as the basic dimensions, three basic similarity constants were obtained: geometric similarity constant, stress similarity constant and density similarity constant.Since the gravity field is constant and the acceleration similarity ratio meetsCa=Cg=1, the similarity constants of the other physical quantities are determined according to the established similarity criteria, as shown in Tables 3, 4 and 5, which correspond to the geotechnical model, pier foundation pile, anti-slide piles and vibration wave loading, respectively.
2.3 Model construction
The silty clay layer was made by adjusting the content of fine sand and water in local silty clay.The sliding surface is a mixture of bentonite and silt (Hungret al.,2014; Gratchevet al., 2007) with a mass ratio of 1:1.The fine breccia soil layer is simulated by a mixture of coarse gravel and fine gravel to meet the requirements of similar physical and mechanical properties.The bedrock is a mixture of red clay, fine sand, cement and water,and the mass ratio of the four materials is 1:0.55:1:0.25.According to the GB/T 50081-2019 (2019), the elastic modulus of bedrock is 16.4 GPa and meets the condition in the “Railway Engineering Geology Manual” (China Railway First Survey and Design Institute, 1999) by comparing the experience data.A layer is filled every 10 cm in the vertical direction, and the physical and mechanical parameters of rock and soil are shown in Table 6.To reduce the friction between the landslide model and the box wall, a transparent glass paper is laid on the inner side of the toughened glass, and the surface is coated with Vaseline.The eight centimeters thick polyethylene foam board and rubber pad are paved onboth sides of the box (Zhanget al., 2018) to reduce the reflection effect of the seismic wave (Zhaoet al., 2019).
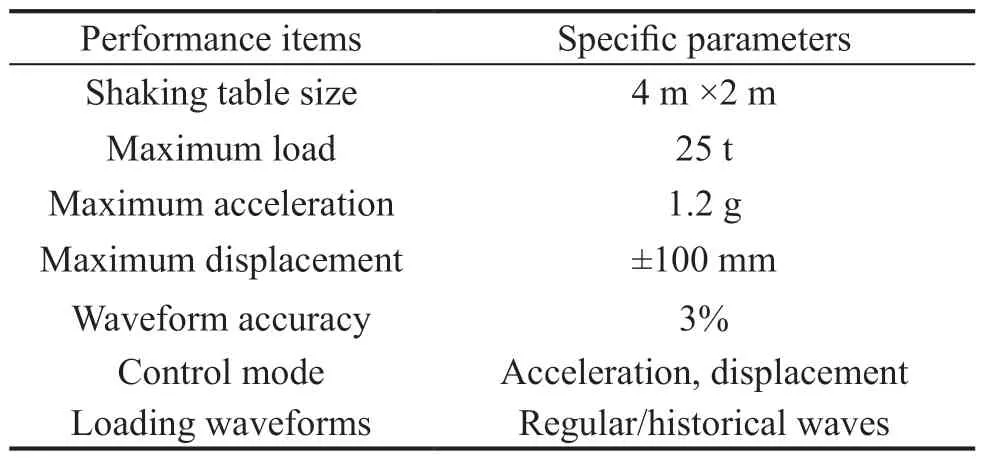
Table 1 Performance parameters of the shaking table
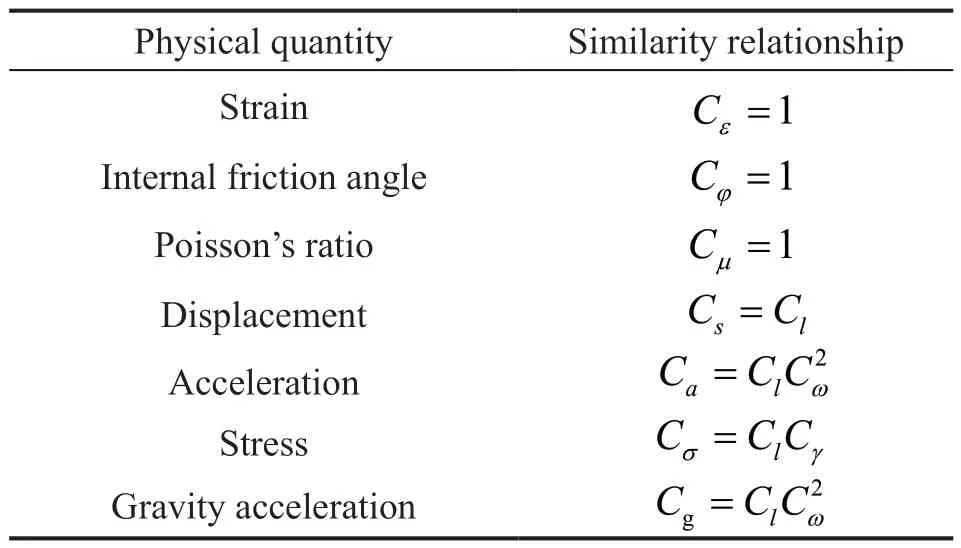
Table 2 Similarity criterions of physical quantities
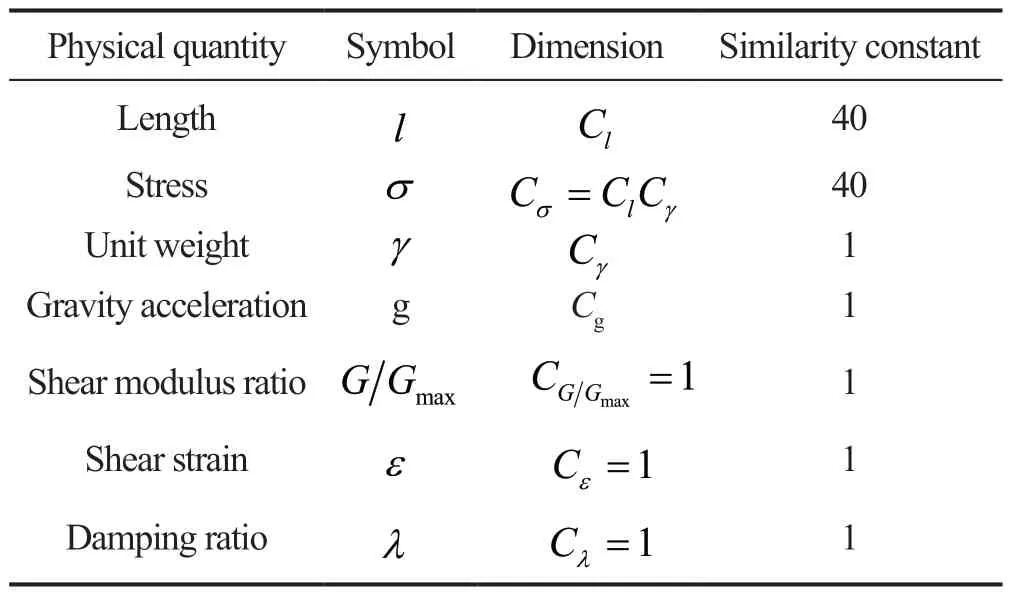
Table 3 Similarity constants of geotechnical model

Table 4 Similarity constants of bridge piles and anti-slide piles
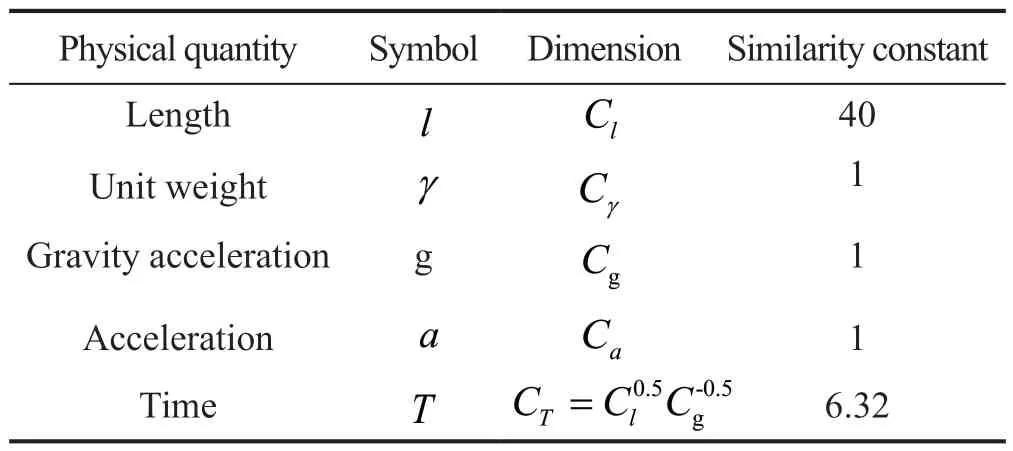
Table 5 Similarity constants of seismic wave loading
To simulate the physical and mechanical properties of the prototype engineering site, the models of the bridge foundation piles and anti-slide piles were constructed by using micro-concrete (Shen and Lu, 2010; Yanget al.,2002).The mass percentage of coarse and fine aggregate is shown in Table 7.There are seven anti-slide piles in the front row and nine anti-slide piles in the back row.The pier and foundation are designed and manufactured according to the similarity ratio.The parameters are shown in Table 8, and the structure of the steel skeleton is shown in Fig.4(a).The level orthogonal method is adopted in the mix proportion test.The sand ratio is controlled at 40%.The water-cement ratio and bonecement ratio are used as the main variables.According to GB/T 50081-2019 (2019), the mix proportion parameters were determined by the compressive strength of the standard test blocks, as shown in Fig.4(b).An iron box with a sliding track was welded on the top of the pier,and two 2.5 kg weights were dragged on the track to simulate the dynamic response of the adjacent box girders at the top of the pier, as shown in Fig.4(c).The landslide model after filling is shown in Fig.4(d).
2.4 Layout of measurement points
The measuring points are arranged in Fig.5.A total of seventeen earth pressure cells are embedded in the vicinity of the bridge pier and anti-slide piles, filled with fine sand (1-2) cm thick around the earth pressure cells, as shown in Fig.6(a), to monitor the horizontal thrust.The horizontal accelerometers laid on the soil layer, bedrock and bearing platform are 7, 2 and 1,respectively, which are used to analyze the acceleration response of the landslide and the pier pile.A horizontal accelerometer is fixed on the shaking table surface to check the output vibration waveform.Five phosphate bronze bands bonded with strain gauges are dispersedly embedded in the landslide, and the bottom is embedded in the bedrock.Before the test, the wire used for a hanging strip was cut offto make the top of the strip free.As shown in Figs.6(b) and 6(c), the bending deformation degree of the phosphor bronze strip during vibration can indirectly reflect the deformation of the soil.The strain gauges are pasted on both sides of the model pile.Since the horizontal thrust of the anti-slide section of the landslide is small, the number of measuring points set on the front row of the anti-slide piles is small.In total,four horizontal displacement meters are located at key positions such as the top of the anti-slide pile, the pile cap and the slope toe, and the flexural deformation of the pile is reflected by measuring the horizontal displacement.The technical parameters of the test elements are shown in Table 9.
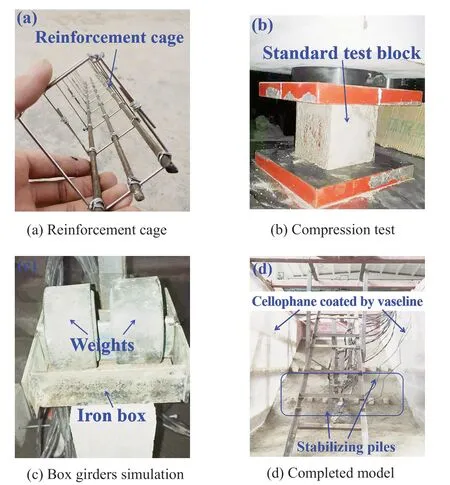
Fig.4 Photographs of shaking table model test

Table 6 Basic parameters

Table 7 Mass percentage of coarse and fine aggregate

Table 8 Parameters of micro-concrete structure

Fig.5 Layout of measuring points: (a) sectional drawing of test model; (b) top view of test model
2.5 Seismic wave loading
As shown in Fig.7, the El Centro wave (Yang, 2013;Yeet al., 2012) was selected for continuous loading, and the peak acceleration gradually increased according to 0.1 g.Before the formal loading, the Gaussian white noise wave excitation with the peak acceleration of 0.08 g was carried out to test the natural frequency of the landslide model and analyze the spectral response characteristics of different soil layers.The loading process is shown in Fig.8.
3 Dynamic response analysis
3.1 Spectral response characteristics

Fig.6 Test elements in landslide model

Table 9 Sensor parameters
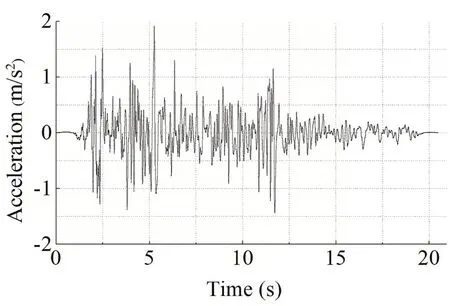
Fig.7 Acceleration-time curve of El Centro wave
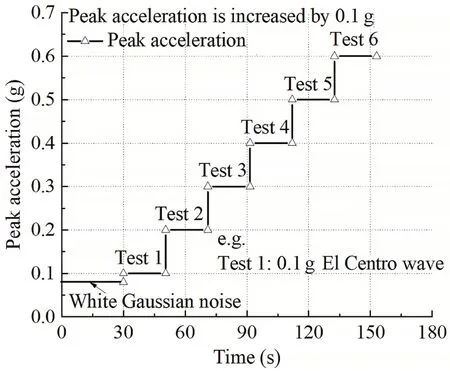
Fig.8 Loading steps
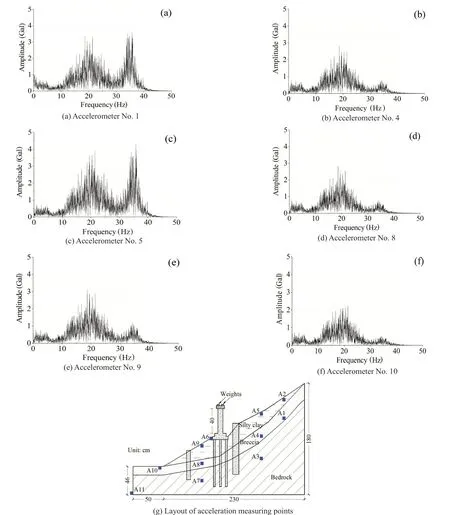
Fig.9 Fourier spectrum of different measuring points
After the loading of the Gaussian white noise wave, the time-history curves of the accelerometers in the landslide were analyzed by fast Fourier transform.Figure 9 shows that there are two peaks in the Fourier spectra of accelerometers No.1 and No.5, which are 20.4 Hz and 34.1 Hz, respectively, indicating that the landslide model contains first-order and second-order natural frequencies.For accelerometers No.4 and No.5 with equal horizontal coordinates and different vertical coordinates, the spectrum peak of the latter is larger than that of the former.There is a filtering effect in the up-transmission of the Gaussian white noise wave, and the coupling response near the natural frequency of the soil will be enhanced.Accelerometers No.8, No.9 and No.10 are located in the anti-sliding section or slope toe of the landslide.The dynamic response of these places is weak, and the Fourier spectrum amplitude is small.Due to the strong output power of the Gaussian white noise wave at (0-5.5) Hz during loading, the Fourier spectrum amplitude appears in this frequency band.The piezoelectric crystal of accelerometer No.2 was damaged and data collection failed.
Taking the operating conditions of the El Centro wave with acceleration peaks of 0.1 g and 0.4 g as an example for spectrum analysis, in Fig.10 and Fig.11,the Fourier spectrum of No.11 accelerometer shows that the energy of the El Centro wave is concentrated in the frequency band below 10 Hz.There are three peaks in the Fourier spectrum of accelerometers No.5 and No.9.The first peak is the spectral characteristics of the El Centro wave.The second and third peaks are located near the natural frequency of the landslide model, so the spectral amplitude is amplified.In the same loading condition, the Fourier spectrum amplitude of No.5 and No.9 accelerometers are compared.The former is larger,indicating that the stronger the acceleration response of the measuring point, the larger the Fourier spectrum amplitude.
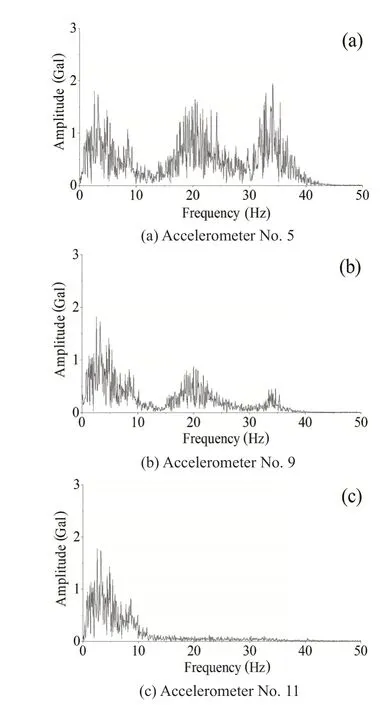
Fig.10 Spectrum analysis of 0.1 g El Centro wave loading
3.2 Trends in horizontal displacement
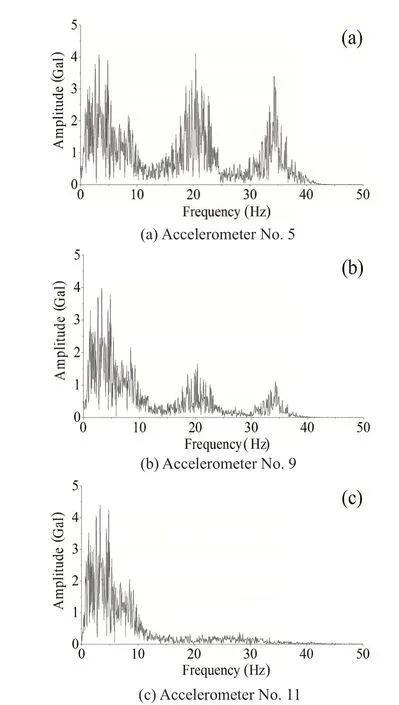
Fig.11 Spectrum analysis of 0.4 g El Centro wave loading
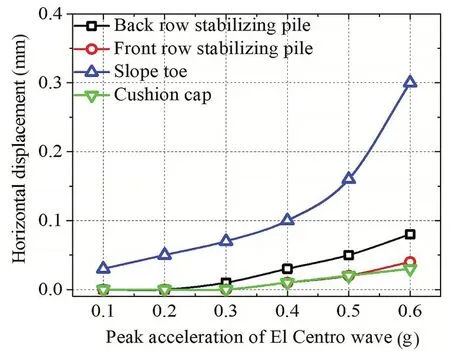
Fig.12 Horizontal displacement curve
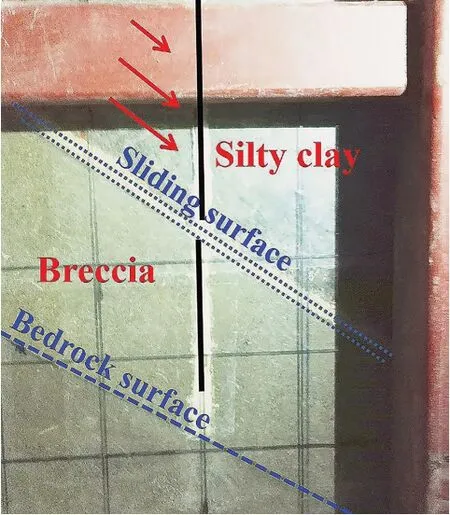
Fig.13 Silty clay sliding along slip surface
Figure 12 shows that the horizontal displacement of each measuring point increases with the increase of the peak acceleration of the El Centro wave.The front row anti-slide pile is located in the anti-slide section of the landslide, and the deformation of the pile body is very small, resulting in a small increase in the horizontal displacement of the pile top.As shown in Fig.13, the displacement of silty clay along the sliding surface is very small, and the back row anti-slide piles bear most of the landslide thrust.Therefore, with the increase of vibration, the horizontal displacement of the pile top gradually exceeds that of the front row anti-slide piles.The dynamic load on the pier foundation pile during vibration comes from three forces: (1) horizontal inertial force of soil between the bridge pier and the back row anti-slide piles; (2) the landslide thrust shared by pier foundation piles, which is due to the backward anti-slide piles compressing the soil mass; and (3) the inertial force of superstructures such as the pier and box girders acting on the pile foundation.Under the combined action of the above factors, the bearing platform appears to have horizontal displacement.When the peak acceleration is below 0.3 g, the reflection effect of the vibration wave on the slope surface is limited, and the amplification effect of the vibration wave field formed by the incident wave and the reflected wave on the landslide thrust is relatively small, resulting in the horizontal displacement of the top of the front row anti-slide pile being 0.Meanwhile, the back row anti-slide piles resist the landslide thrust, so that the forced deformation of the bridge pile foundation is small, and the horizontal displacement of the cushion cap is 0.With the increase of the peak acceleration, the vibration wave field increases the deformation of the soil and leads to the linear increase of the horizontal displacement of the front row anti-slide pile.The deformation of the bridge pile foundation increases with the combined action of the landslide thrust and the inertial force of the superstructure and soil, and the horizontal displacement of the cushion cap increases gradually.Therefore, the horizontal displacement of the top of the front row anti-slide pile and the cushion cap are basically consistent.In the same loading condition,the displacement at the slope toe is the largest.With the increase of the peak acceleration of the El Centro wave,the horizontal displacement curve changes from linear to nonlinear, and the amplitude increases.
3.3 Distribution of soil pressure
With the increase of the peak acceleration of the El Centro wave, the shape of the peak distribution of soil pressure above the sliding surface has undergone a triangular, rectangular and inverted trapezoidal change in Fig.14(a).When the peak acceleration is 0.1 g to 0.3 g,the sliding deformation of the soil is relatively small,and the friction energy consumption is limited.The peak value of the PGA amplification factor is 1.36 to 1.44.The peak earth pressure increases along the pile depth and is distributed in a triangle.When the peak acceleration increases to 0.4 g, as the reflection of the vibration wave appears on the slope surface, the reflected wave and incident wave form a complex vibration wave field that lead to the deformation increase of the sliding body, and the soil damping ratio increases, resulting in the peak value of the PGA amplification factor decreasing to 1.19, and the peak earth pressure presents a rectangular distribution.When the peak acceleration reaches 0.5 g to 0.6 g, the vibration wave field near the slope surface makes the plastic deformation of the upper part of the sliding body significantly increase, the soil shear modulus decreases, the peak value of PGA amplification factor decreases to 1.11-1.17, and the peak distribution of earth pressure becomes an inverted ladder.Since the shaking table model test does not fully satisfy the similarity relationship, the back row anti-slide piles can be approximated as a rigid body.The bearing section and embedded section of the pile body are, respectively,affected by the landslide thrust and anchoring force in vibration waves loading, and the pile body tends to turn forward.The minimum earth pressure is near the rock-soil interface, which is the rotating point of the pile body.As shown in Fig.14(b), the peak value of the soil pressure on the front side of the rear anti-slide pile is an inverted triangle distribution.Since the net distance between the pier foundation and the rear anti-slide pile is only 7.5 cm, the anti-slide pile leans forward during vibration, compressing the front soil and making the peak value of the top soil pressure larger.As shown in Fig.14(c), due to the influence of the vibration wave field near the slope, the peak value of soil pressure is larger in the upper part of the sliding body, and there is a certain peak value of soil pressure in the fine breccia soil,which provides resistance for the pier foundation piles.Figure 14 (d) shows that the peak soil pressure above the sliding surface is very small.In addition, compared with the rear anti-slide pile, the horizontal thrust of the front anti-slide pile is very small.
3.4 Variation law of pile shaft bending moment
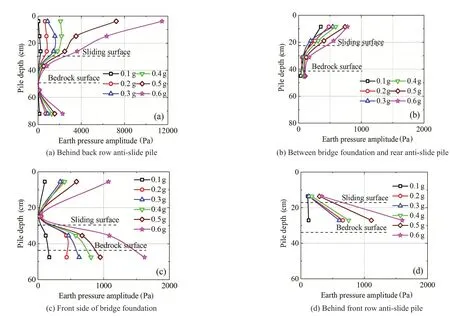
Fig.14 Distribution of peak earth pressure
The strain gauges are pasted on the anti-slide piles,and the front and back side of the pier foundation.The strain value is measured in a Wheatstone quarter bridge circuit, and the bending moment of the pile is calculated using the following formula, whereEis the elastic modulus of the micro-concrete,Iis the moment of inertia,EIis the flexural stiffness of the pile shaft,ε+andε-are the micro-strains on the tension side and the compression side, respectively, andhis the linear distance between the measurement points on the tension side and the compression side, respectively, of the same section.
Figure 15(a) shows that the peak bending moment of the rear anti-slide piles is triangularly distributed, and the maximum value appears near the bedrock interface.The anchoring force of the bedrock resists most of the landslide thrust.The flexural deformation occurs in the part above the rock-soil interface of the rear anti-slide pile, and the rotation point of the pile body is near the bedrock interface, which is consistent with the analysis results of the peak earth pressure.In Figs.15(b) and 15(c),when the peak acceleration of the El Centro wave is in the range of 0.1 g-0.5 g, as the inertial force of the superstructures such as the pier and box girders, the peak bending moment is located at the top of the front and rear foundation piles.Under the resistance of soil around the pile, the bending moment at the top of the pile decreases along the pile depth, and the minimum value appears near the sliding surface.The bending moment of the pile in fine breccia soil and bedrock reduces the flexural deformation of the pile.When the peak acceleration is 0.6 g, a certain bending moment appears on the top of the rear foundation piles under the action of the inertial force of the superstructure.Compared with the silty clay, the deformation modulus of the fine breccia soil is relatively large, and the force transmission effect is better.When the back row antislide piles compress the soil forward, the peak bending moment of the pile body appears near the sliding surface rather than silty clay.With the increase of the pile depth,the compression deformation of the fine breccia soil decreases, and the minimum bending moment appears near the rock-soil interface.Due to the anchoring force of the bedrock, there is a certain peak bending moment in the embedded section of the rear foundation piles.As the action of the pile group effect, the front foundation piles and the rear foundation piles are subject to cooperative deformation.In 0.6 g vibration wave loading, as the action of soil resistance around bridge foundation piles,the peak bending moment of the front foundation pile at the top and bottom of the sliding mass decreases with the increase of the distance, and decreases to a certain minimum value in the sliding body.The peak value of the bending moment of the front row anti-slide piles is very small, as shown in Fig.15(d), which is consistent with the results of the aforementioned soil pressure peak analysis.
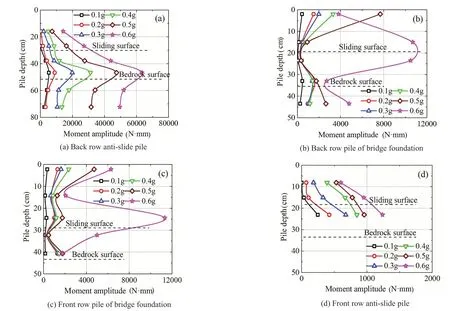
Fig.15 Moment distribution of the anti-slide piles and bridge foundation
As the shaking table model test could not satisfy all of the similarity relationship, in order to deeply analyze the relationship between the pile position of the rear anti-slide piles, peak acceleration and the forced deformation of the bridge foundation piles, a threedimensional numerical simulation model is established according to the prototype site, as shown in Fig.16 for targeted numerical calculation and analysis.When the peak acceleration of the vibration wave is 0.05 g-0.5 g,the net distance between the rear anti-slide pile and bearing platform changes within the range of 1 m-13 m.The pile position of the rear anti-slide pile is shown in Fig.17 and the horizontal displacement of the bridge foundation pile top is shown in Fig.18.For the loading condition of 0.05 g to 0.4 g vibration wave, when the net distance between the anti-slide pile and bearing platform is 5 m, the horizontal displacement of the bridge foundation pile top is the minimum.For the loading condition of 0.5 g vibration wave, when the net distance between the anti-slide pile and bearing platform is 3 m,the horizontal displacement of the bridge foundation pile top is the minimum.With the increase of the peak acceleration, the optimal clearance between the rear anti-slide pile and bearing platform decreases.As the peak accelerations of vibration waves are the same, the percentage of the maximum and minimum horizontal displacement fluctuate within the range of 108%-113%for different pile positions of the rear anti-slide piles.

Fig.16 Three-dimensional numerical simulation model of prototype site
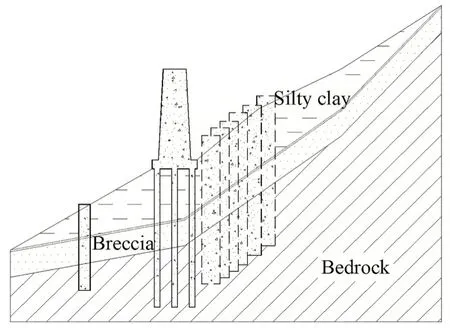
Fig.17 Sketch map of pile position of rear anti-slide pile
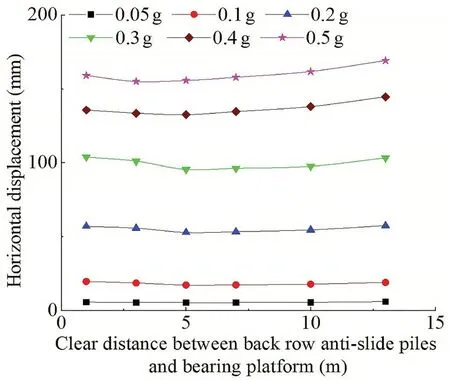
Fig.18 Horizontal displacement of bridge foundation pile top in different loading conditions
3.5 Distribution of peak ground acceleration (PGA)amplification factor of landslide model
The PGA (peak ground acceleration) amplification factor (Wuet al., 2020) is a ratio of peak acceleration in the time history curve of the measuring point and the peak acceleration of the shaking table.Combined with the horizontal and vertical coordinates of the measuring points, the two-dimensional equipotential map of the PGA amplification factor is obtained.

Fig.19 Contour plots of PGA amplification factor distribution of landslide model
As shown in Fig.19, the PGA amplification factor of the sliding section of the landslide is large, and the dynamic response is strong.The PGA amplification factor decreases gradually along the burial depth direction, and the peak acceleration of the vibration wave increases during the upward propagation.Since the net distance between the pier foundation and the back row anti-slide pile is only 7.5 cm, there is dynamic interaction between the two and the bearing platform has acceleration response under vibration.The bedrock is approximately regarded as a rigid body, and the PGA amplification factor is maintained at a low level.Table 10 shows that the peak value of the PGA amplification factor of the landslide decreases from 1.44 to 1.11 during the increase of the El Centro wave acceleration peak.Similarly, the PGA amplification factor of the bearing platform decreases from 1.20 to 1.07.It can also be seen that the difference of acceleration response between the bearing platform and the landslide has a decreasing trend.As the peak acceleration of the El Centro wave increases, the shear modulus of soil decreases and the damping ratio increases, resulting in the decrease of the PGA amplification factor of the landslide model.

Table 10 PGA amplification factors of different seismic wave loading
3.6 Law of landslide deformation
According to the bending strain test data of phosphorus bronze belt, combined with the coordinates of measuring points, the landslide deformation equipotential maps are drawn.Figure 20 shows that the deformation of the landslide slope and sliding surface is large.The large deformation of soil near the slope is caused by the fact that the clay-cemented slope creates conditions for the reflection of vibration wave, and the complex vibration wave field appears.In addition,due to the sliding trend near the sliding surface during vibration, the shear deformation of the soil increases,so the bending deformation of the phosphorus bronze belt is aggravated.Due to the reinforcement effect of the back row anti-slide piles, the shear deformation of the soil between it and the pier is controlled to some extent, which avoids the excessive acceleration response of the bearing platform.When the peak acceleration of the El Centro wave increases from 0.1 g to 0.6 g, the deformation of the landslide model increases.
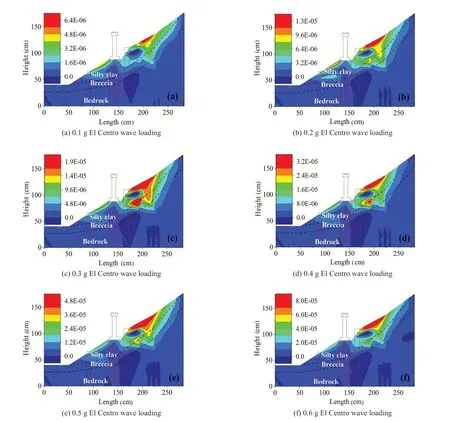
Fig.20 Landslide deformation
4 Conclusion
According to the prototype site of a bridge foundation reinforced by anti-slide piles on a silty clay landslide area with an inclined interlayer, a landslide model with a scale of 1:40 is designed and manufactured.By loading waves with different acceleration peaks, the deformation characteristics of the front-rear anti-slide piles and bridge foundation piles are analyzed, and the spectral response characteristics of landslide soil are discussed.The acceleration response characteristics and deformation characteristics of the silty clay landslide are summarized, and the following conclusions are obtained.
Taking the horizontal displacement of the bridge foundation pile top as the assessment index, there is an optimal clearance between the rear anti-slide pile and bearing platform.For the bridge foundation located in the sliding section of the landslide, when the peak acceleration of the El Centro wave is less than 0.4 g,the optimal clearance is 5 m; when the peak acceleration of the El Centro wave is 0.5 g, the optimal clearance is 3 m.As the vibration intensifies, the optimal clearance between the rear anti-slide pile and bearing platform decreases.When the pile positions of the rear anti-slide piles are different, the percentage of the maximum and minimum horizontal displacements vary within the range of 108%-113%.The optimal design of the pile position of the rear anti-slide piles is conducive to the forced deformation of the bridge foundation piles.
The vibration wave field is formed by the interaction of the incident wave and reflected wave.Under the influence of this field, with the increase of the peak acceleration of the vibration wave, the stress-strain response of the silty clay near the slope surface intensifies.The distribution of landslide thrust on the back side of the back row anti-slide piles has experienced the change process of a triangle, rectangle and inverted trapezoid.The appropriate distribution of the landslide thrust should be adopted according to the actual situation in the design of anti-slide piles.Because of the “blocking effect” of bridge foundation piles, the stress and deformation of the front row anti-slide pile is very small; in other words, the back row anti-slide pile plays a major role in seismic reinforcement.
There is a filtering effect when the vibration wave propagates upward in the landslide.The amplitude of the spectrum near the natural frequency will be amplified.The stronger the acceleration response of the measuring point, the greater the Fourier spectrum amplitude.The PGA amplification factor of the landslide shows layered distribution from the surface to the interior,and the acceleration response at the slope surface is the strongest.As the spacing between the bridge pier foundation and the rear row anti-slide piles is too close,there is a dynamic interaction between them, so that the bearing platform has a certain PGA amplification factor.As the vibration intensifies, the difference in acceleration response between the bearing platform and landslide tends to decrease.
Due to the effect of the vibration wave field and soil slip, the deformation near the sliding surface, the slope surface and the sliding section is relatively large.The back row anti-slide piles bear most of the landslide thrust,which reduces the shear deformation of the soil in front of the piles and avoids excessive acceleration response of the bearing platform.As the peak acceleration of vibration wave increases, the deformation of the landslide shows an increasing trend.
Acknowledgement
This research was supported by the Sichuan Science and Technology Program (Grant No.2023NSFSC0894)and Major Project of the Science and Technology Research and Development Program of the Ministry of Railways of China (Grant No.Z2012-061).
 Earthquake Engineering and Engineering Vibration2024年1期
- Earthquake Engineering and Engineering Vibration的其它文章
- Reliability-based life-cycle cost seismic design optimization of coastal bridge piers with nonuniform corrosion using different materials
- Time-domain dynamic constitutive model suitable for mucky soil site seismic response
- Finite element model updating for structural damage detection using transmissibility data
- A novel mitigation measure for normal fault-induced deformations on pile-raft systems
- Longitudinal vibration characteristics of a tapered pipe pile considering the vertical support of surrounding soil and construction disturbance
- Resilient performance of self-centering hybrid rocking walls with curved interface under pseudo-static loading
