Finite element model updating for structural damage detection using transmissibility data
Ahmad Izadi and Akbar Esfandiari
Department of Maritime Engineering, Amirkabir University of Technology, Tehran 15875-4413, Iran
Abstract: This paper presents a new finite element model updating method for estimating structural parameters and detecting structural damage location and severity based on the structural responses (output-only data).The method uses the sensitivity relation of transmissibility data through a least-squares algorithm and appropriate normalization of the extracted equations.The proposed transmissibility-based sensitivity equation produces a more significant number of equations than the sensitivity equations based on the frequency response function (FRF), which can estimate the structural parameters with higher accuracy.The abilities of the proposed method are assessed by using numerical data of a two-story two-bay frame model and a plate structure model.In evaluating different damage cases, the number, location, and stiffness reduction of the damaged elements and the severity of the simulated damage have been accurately identified.The reliability and stability of the presented method against measurement and modeling errors are examined using error-contaminated data.The parameter estimation results prove the method’s capabilities as an accurate model updating algorithm.
Keywords: damage detection; model updating; output-only; transmissibility; sensitivity equation
1 Introduction
Structural health monitoring (SHM) and damage detection of engineering structures are of great importance.In-service engineering structures such as mechanical, civil, marine, and aerospace may expose destructive factors, including overestimated load,fatigue, corrosion, accident, and human errors.Failure of these structures could lead to human disasters, economic losses, and environmental problems.Hence, many structural damage identification methods have been proposed to prevent these failures over the past decades.
The vibration-based damage identification methods are based on the concept that structural damage changes the structural parameters such as stiffness and damping ratio and consequently affect structural responses and inherent parameters.By comparing the indices obtained from structural responses in healthy and damaged states by appropriate algorithms, the position and severity of structural damage can be determined.Most critical studies focused on the changes in natural frequencies (Cawley and Adams, 1979; Salawu, 1997),mode shapes (Salawu and Williams, 1995), frequency response functions (Wanget al., 1997; Thyagarajanet al., 1998), modal curvature (Ditommasoet al.,2015, 2021; Iacovinoet al., 2018; Hsuet al., 2019),modal strain energy (Weiet al., 2016), static response(Hjelmstad and Shin, 1997; Renet al., 2019), transfer function parameters (Sohnet al., 2004), flexibility(Gao and Spencer, 2002; Doeblinget al., 1996), and mechanical impedance (Huynhet al., 2017; Providakiset al., 2015).In addition, new approaches have been developed to improve the performance of the mentioned methods, such as neural networks (Beheshti Avalet al.,2020), Hilbert (Hanet al., 2014), wavelet transform(Kankanamgeet al., 2020; Nagarajaiah and Basu, 2009)and time-domain methods (Zhanget al., 2013).The performance of any structural health monitoring method is highly dependent on many factors, including the type of structure, response sensitivity, structural geometry,structural and environmental loading, and sensors (Tanget al., 2019).
The finite element model (FEM) updating process is an inverse problem for estimating unknown structural parameters leading to a more accurate prediction of structural responses (Marwala, 2010).An FEM updating algorithm tuned structural parameters to minimize the deviation between the measured and numerically calculated structural responses.Many studies, such as optimum matrix updating methods (Zimmerman and Kaouk, 1994), statistical model updating methods(Xiaet al., 2002) and methods of FEM updating by various sensitivity equations, have been conducted to detect structural damage.Araujo dos Santoset al.(2005) presented a damage detection method based on frequency response functions sensitivities.Esfandiariet al.(2013) presented an improved FEM updating method based on a sensitivity equation using natural frequency data to detect any number of localized damage which induces stiffness reduction in a structure.Vahedi and Khoshnoudian (2018) presented a sensitivity-based FEM updating method using earthquake displacement response in the frequency domain and the frequency response function of a structure due to ground excitation.Pedramet al.(2018) developed a frequency domain model updating method using the power spectral density function for damage identification of plates and shells.Esfandiari (2020) validated the capabilities of an enhanced sensitivity relation for the structural FEM updating and estimation of damage parameters of extensive damage cases using a subset of the measured frequency response function (FRF) and natural frequency data of a laboratory concrete beam.Nandakumar and Shankar (2016) and Renet al.(2019) used experimental transfer function data to identify defects of beam models.Razavi and Hadidi (2020) presented a sensitivity-based FEM updating technique for damage identification in large space structures.
Modal testing and identification of modal parameters have been among the main issues in damage detection and structural health monitoring based on dynamics.Modal parameters can be obtained from input and output measurement data through the frequency response function (FRF).Furthermore, identifying damage under real engineering; that is, operating conditions pose a problem in structural analysis because it would be challenging to generate excitation in such structures.Therefore, one of the most critical challenges of the model updating methods is the requirements and limitations of excitation load on large and complicated structures.Excitation loads are mandatory in most damage detection methods and as the input of the structural analysis.However, controlled excitation is difficult or impossible in actual and operational conditions.Moreover, some forces applied to the structures caused by sea waves,wind, vibrations, moving vehicles, earthquakes, and sudden excitation loads cannot be measured.In this case,output-only response measurements will be available,and an output-only damage detection method must be implemented (Zhouet al., 2017).Hence, output-only methods efficiently resolve the effect of the above inevitable factors.In recent years, transmissibility methods have mainly been applied as an output-only method.These methods depend on the output data, and there is no requirement to measure the excitation load.Zhou and Abdel Wahab (2017) presented transmissibility damage indicators for structural damage identification.Zhouet al.(2017) proposed a new transmissibility function to enhance its performance in distinguishing undamaged from damaged scenarios.Zhouet al.(2018)presented a transmissibility method based on the data measured by the ultrasound scan on a steel pipe.Khalil and Aljanaideh (2018) applied the transmissibility operators to detect structural damage to aircraft wings using FEM-based software.Yanet al.(2019) reviewed and discussed the state of the art and challenges to transmissibility function analysis that cast SHM in the context of system identification.Zhuet al.(2014)proposed a structural damage identification method based on the transmissibility concept in the state-space domain without input measurements.
A new FEM updating approach based on the sensitivity of the transmissibility data is presented herein.The proposed sensitivity equation expresses the relation of the changes in the transmissibility data as a function of the changes in the structural design variables.The extracted equations are solved by the least square method to estimate the changes in the structural parameters.A weighting method is also used to improve the estimation results.Noise-contaminated transmissibility data of the frame and plate models are used to verify the proposed sensitivity equation’s capability.The formulation of the sensitivity equation yields a robust FEM updating algorithm against modeling and measurement errors.
2 Theoretical development
The frequency-domain response of anndegree of freedom structure can be expressed as:
whereF(ω) andX(ω) are (n× 1) vectors of applied force and response, respectively.ωis the frequency of the excitation load.The transfer function,H( )ωis an(n×n) matrix that is defined as:
whereM,C, andKare(n×n) matrices of mass,damping, and stiffness, respectively, and j= -1.The transmissibility function is defined as the ratio of the frequency domain structural responses at two different points:
whereXi(ω) andXj(ω) are the structural responses at theith andjth degree of freedoms, respectively,assuming that a single concentrated load is applied at thebth DOF, the transmissibility function is obtained based on the transfer function entries as:
H ib(ω) andH jb(ω) are the entries of the transfer function matrix.Structural damage caused changes in transmissibility function by the amount of ΔT( )ωas:
Also, the derivative of the transfer function can be expressed as (Esfandiariet al., 2013):
By substituting Eq.(7) into Eq.(6), the derivative of the transmissibility function is expressed as:
Based on Taylor’s expansion and ignoring the higher-order terms, the changes in the transmissibility function are expressed as:
The changes in the impedance matrix are a function of the changes in structural parameters as:
Assuming that structural damage only leads to changes in the stiffness matrix, the mass and damping matrix changes are negligible.Hence the change of the transmissibility function is expressed as:
The variation of the structural stiffness matrix can be explained as the sum of the changes of the element level stiffness matrices:
whereneis the number of the total structural elements in the stiffness matrix.The variable ΔnPis the unknown parameter representing the relative variations of thenth stiffness parameter.By substituting Eq.(12) into Eq.(11):
Equation (13) can be expressed in the following matrix form:
Sn(ω) is the transmissibility function’s sensitivity relation concerning the stiffness parameters change.
All equations corresponding to different measurements and excitation locations should be solved simultaneously to estimate unknown structural parameters.The accuracy of the predicted parameters depends on various factors, including types and locations of excitations, sensor placement, accuracy of the mathematical model, numerical methods used for the solution of the system of equations, and selected frequency ranges for FEM updating.Adequate attention to these factors leads to minimal FEM updating errors.In this study, the least square method is used for parameter estimation.
Generally, a large amount of data is provided by frequency-domain methods at wide ranges of excitation frequencies.Since transmissibility data are obtained by the ratio of the measured FRF at two different points,there is more information than the primary frequency domain data.Based on the FRF data, the number of equations isk×n×m.In the sensitivity-based method using transmissibility data, there areequations.k,n, andmare the number of excitation frequencies (frequency range), the number of excitation points, and the number of measurement locations,respectively.Hence, the transmissibility-based method is expected to yield more accurate parameter estimation results.
Since FRF and consequently transmissibility data are of different magnitude, the information of some sensitivity equations may affect the information of other sensitivity equations.This adverse effect can be mitigated by the proper weighting of the sensitivity equations.In the present study, the rows of the sensitivity equation are weighted by their second norm, so all sensitivity equations have the same effect on the results of estimating the parameters (Esfandiari, 2017).
3 Numerical applications
In order to study the abilities of the presented damage identification method, it is examined for FEM updating of frame and plate structures.Different damage cases are considered to show the effect of damaged elements’number, position, and severity on the proposed method’s accuracy and robustness.Structural responses are numerically simulated using the FEM method.
3.1 Errors
There are always challenges in practical applications due to error-contaminated results.These errors are usually caused by environmental effects, sensor, random,and signal processing errors.There are also errors in numerical modeling that result from idealization in FEM, mesh size in FE, material properties, inaccuracy of the assumed boundary conditions, and mass modeling.Measurement and modeling errors both lead to deviations in the obtained results.Since these parameters are included in the sensitivity equations, they will harm the results of estimating the parameters.Therefore, ensuring that the proposed method withstands these adverse effects is crucial.In numerical methods, different types of errors are simulated by adding random numbers to the FE data (Hajela and Soeiro, 1990a, 1990b).
3.1.1 Measurement errors
Measurement errors inherently pollute all measured structural responses.Hence, knowing the effects of measurement errors on damage identification results is crucial (Hjelmstadet al., 1992).In order to simulate this type of inaccuracy in the experimental process, random values are added to the numerically calculated structural responsesas:
Xdis the noise-contaminated data, andEpis the error value.To investigate the effects of different error levels on the results of FEM updating, uniformly distributed random errors of 5%, 10%, and 15% magnitude are added to the simulated data proportionally.
3.1.2 Modeling errors
The results of FEM updating are affected by unavoidable modeling errors such as mass modeling errors.Inaccuracy of mass assumption causes errors in estimating analytical responses that will be used to construct the sensitivity equation (Mottersheadet al., 2011).The proposed method uses structural mass parameters to obtain structural responses, frequency response, and transmissibility.In most cases, structural damage affects the stiffness parameters but does not affect the mass parameters, and the mass parameters are the same in the initial and damaged structures.Nevertheless, the assumed mass parameters may not be precisely specified.A 5% uniformly distributed random error is added to the mass parameters to simulate the modeling error.
3.1.3 Coefficient of variations
In order to investigate the robustness of the predicted parameters and study the scattering of results, the mean of the estimated parameters and their coefficient of variations (standard deviation divided by mean value or COV) of the estimated parameters are evaluated.Fifty sets of error-infected data are intended for structural parameter estimation.
3.2 Frame structure
A two-bay two-story frame structure model is considered to investigate the abilities of the proposed damage detection method.The frame geometry is demonstrated in Fig.1.FEM analysis is performed to simulate the experimental data using two-node frame elements.The number of elements is 40, and the number of nodes is 39.All frame elements are aluminum material with Young’s modulus (E) of 67 GPa and a mass density of 2700 kg/m3.Each element have a 25 cm length, with cross-section areas (A) of 3.6 cm2and the moment of inertia (I) of 0.2644 cm2(Esfandiari, 2017).
Flexural rigidityEIand axial rigidityEAare the unknown parameters of the frame elements.The behavior of these parameters influences the structural responses of a frame structure.Considering the axial and flexural stiffness in the model updating process is necessary.However, in most cases, the value of axial rigidities is high, and their variation does not influence the structural behavior.Hence, considering the axial rigidity as an unknown parameter leads to ill-conditioned sensitivity equations.In these cases, the flexural rigidities are the dominant parameters.Therefore, the flexural rigidities are considered unknown parameters in the model updating process.
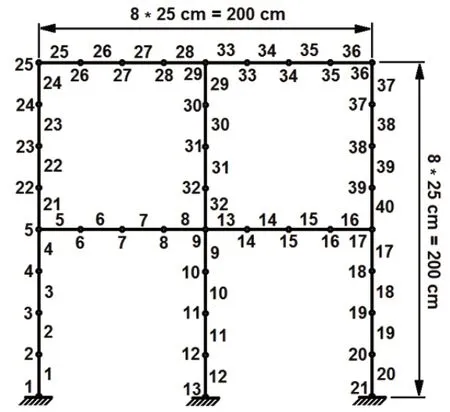
Fig.1 Two-bay two-story frame model
Four damage cases are considered for parameter estimation.The characteristics of these damaged cases are shown in Table 1 (Esfandiari, 2017).Five natural frequencies of the intact and damaged structure are also proposed in Table 2.
The transmissibility curves related to excitation at points 2, 3, 4, and 5 and measurement at points 1 and 2are shown in Fig.2.The intersection of transmissibility curves determines the natural frequencies.
In sensitivity-based FEM updating methods using frequency domain data, results are highly influenced by excitation frequency ranges, selection of excitation points, quality of measurement data, weighting method,and the ability of the sensitivity function to express the changes in structural response.Failure to select the correct excitation frequency ranges will not lead to the correct model updating.Any sensitivity equations should be able to express the changes of the desired functions.For highly nonlinear functions, the extracted sensitivity equation may not express the change of the structural responses or indices accurately at all excitation frequencies.Hence, the excitation frequencies must be selected at the region where the sensitivity equation is accurate.As presented in Fig.2, changes in the transmissibility function in the vicinity of resonances are significant, and a truncated sensitivity relation might express such highly nonlinear behavior.Hence, these regions of excitation frequencies must be excluded from the model updating process.Due to the more significant number of equations generated in methods based on the transmissibility sensitivity equation than methods based on the FRF sensitivity equation, the excitation frequency ranges can be considered more negligible, which is very useful and decisive in the time and cost of experiments.This study considers the frequency ranges of 1-3, 4-5,6-9, 11-21, and 25-27 Hz for all damage cases.The selected frequency ranges are shown in Fig.3.The locations and DOFs of excitations are shown in Fig.4.
The presented sensitivity equation is used to identify the location and severity of structural damage.The actual and predicted parameter changes using errorcontaminated data are proposed in Fig.5(a) to Fig.8(a).The figures indicate the location and severity of the actual damage ratios with the white bars.Other bars also indicate the location and severity of the simulated structural damage ratios.
The parameter estimation results show that the proposed method can accurately localize and quantify structural damage using highly error-contaminated data.The coefficient of variations (COV) of the estimatedparameters using error-contaminated data is plotted in Fig.5(b) to Fig.8(b).Low COVs of the estimated results indicate the accuracy and low dispersion of the predicted structural parameters.
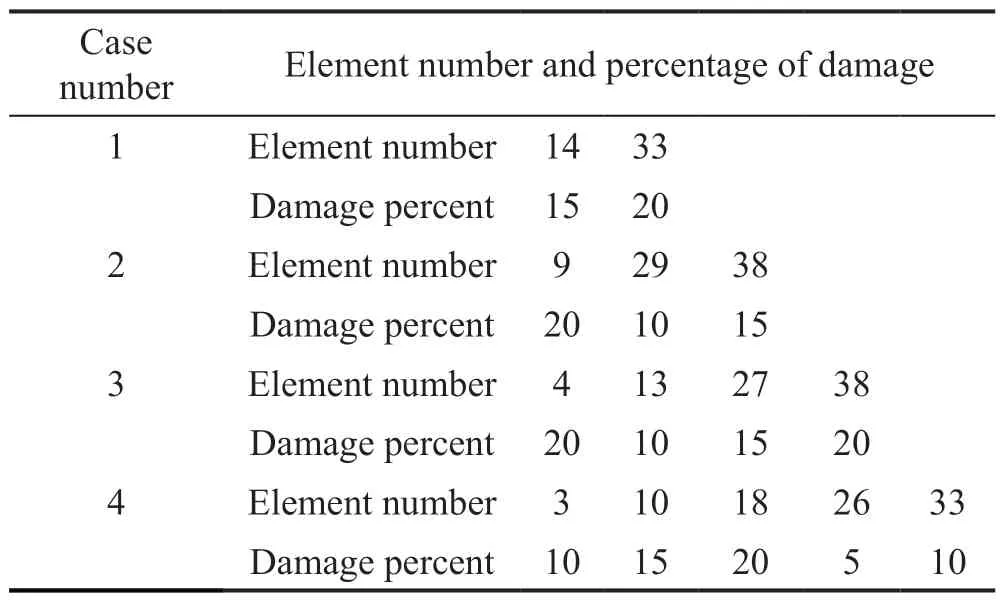
Table 1 Damage cases and reduction percentage of stiffness(damage) of frame elements
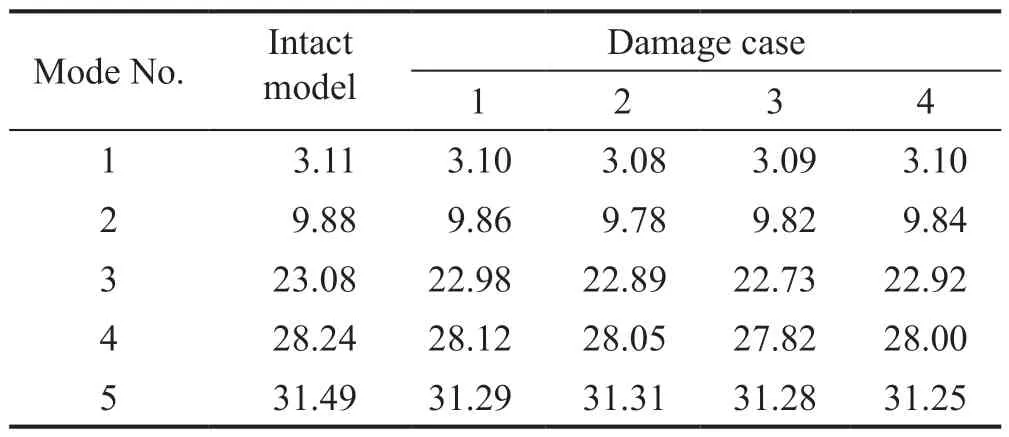
Table 2 Five natural frequencies of the intact and damaged structure (Hz)
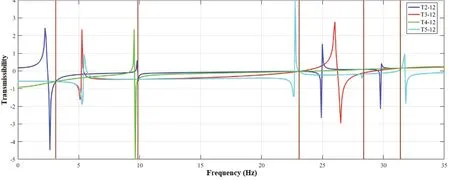
Fig.2 Four transmissibility diagrams related to excitation at points 2, 3, 4, and 5 and measurement at points 1 and 2 ()

Fig.3 Selected frequency ranges for all damage cases

Fig.4 Locations and DOFs of (a) excitations (shown by E) and (b) measurements (shown by M)
The parameter estimation results considering measurement and mass modeling errors are plotted in Fig.9(a) to Fig.12(a).The COV values of predicted damage parameters are plotted in Fig.9(b) to Fig.12(b).
The parameter estimation results indicate that the method is accurate enough in the presence of measurement and mass modeling errors.To classify and evaluate the accuracy and the confidence level of the damage detection results quantitatively, some indicators are used.
3.2.1 Closeness index
The accuracy of the estimated parameters can be investigated by the closeness index (CI).CIis an index for assessing the conformity of the predicted damage and actual damage (Esfandiariet al., 2013):
3.2.2 Damage missing error
The damage missing error (DME) is the second indicator of accuracy measure that is defined as (Araújo dos Santoset al., 2005):
NTis the number of elements that are actually damaged.If the actual damaged element’s location is determined correctly,0= ; otherwise, it will be1 =.This index assesses the method’s accuracy for localization of the truly damaged elements.IfDME= 0,all actual locations of the damaged elements are correctly identified.

Fig.5 (a) Predicted and actual damage ratios considering 5%, 10%, and 15% measurement errors for damage case 1; (b) coefficient of variations (COVs)
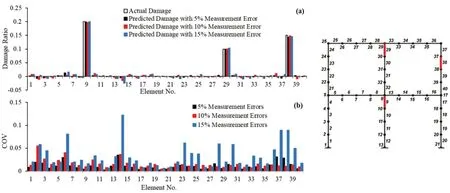
Fig.6 (a) Predicted and actual damage ratios considering 5%, 10%, and 15% measurement errors for damage case 2; (b) coefficient of variations (COVs)
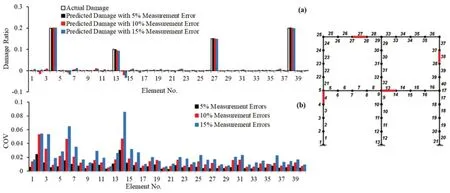
Fig.7 (a) Predicted and actual damage ratios considering 5%, 10%, and 15% measurement errors for damage case 3; (b) coefficient of variations (COVs)
3.2.3 False alarm error
The false alarm error (FAE) is the third indicator of accuracy measure that is defined as (Araújo dos Santoset al., 2005):
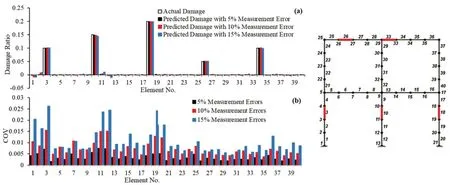
Fig.8 (a) Predicted and actual damage ratios considering 5%, 10%, and 15% measurement errors for damage case 4; (b) coefficient of variations (COVs)
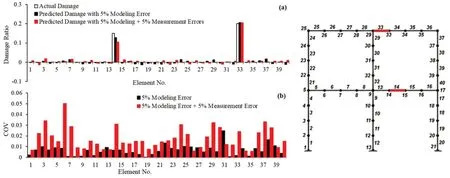
Fig.9 (a) Predicted and actual damage ratios considering 5% modeling and 5% measurement errors for damage case 1; (b) coefficient of variations (COVs)

Fig.10 (a) Predicted and actual damage ratios considering 5% modeling and 5% measurement errors for damage case 2; (b) coefficient of variations (COVs)
NFis the predicted number of damaged elements, and if the predicted damaged elements are truly damaged,= 0; otherwise, it will be= 1.TheFAEindex assesses whether or not the predicted damaged element is truly damaged.IfFAE=0 , then all predicted damaged elements are truly damaged elements.
These two damage indexes rely on identifying the damage location, and nothing is stated about damage severity.A comparison of the damage indexes of predicted results is given in Table 3.Low values ofDMEandFAEindicate high levels of precision in parameter estimation.
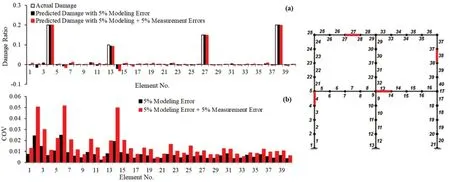
Fig.11 (a) Predicted and actual damage ratios considering 5% modeling and 5% measurement errors for damage case 3; (b) coefficient of variations (COVs)

Fig.12 (a) Predicted and actual damage ratios considering 5% modeling and 5% measurement errors for damage case 4; (b) coefficient of variations (COVs)
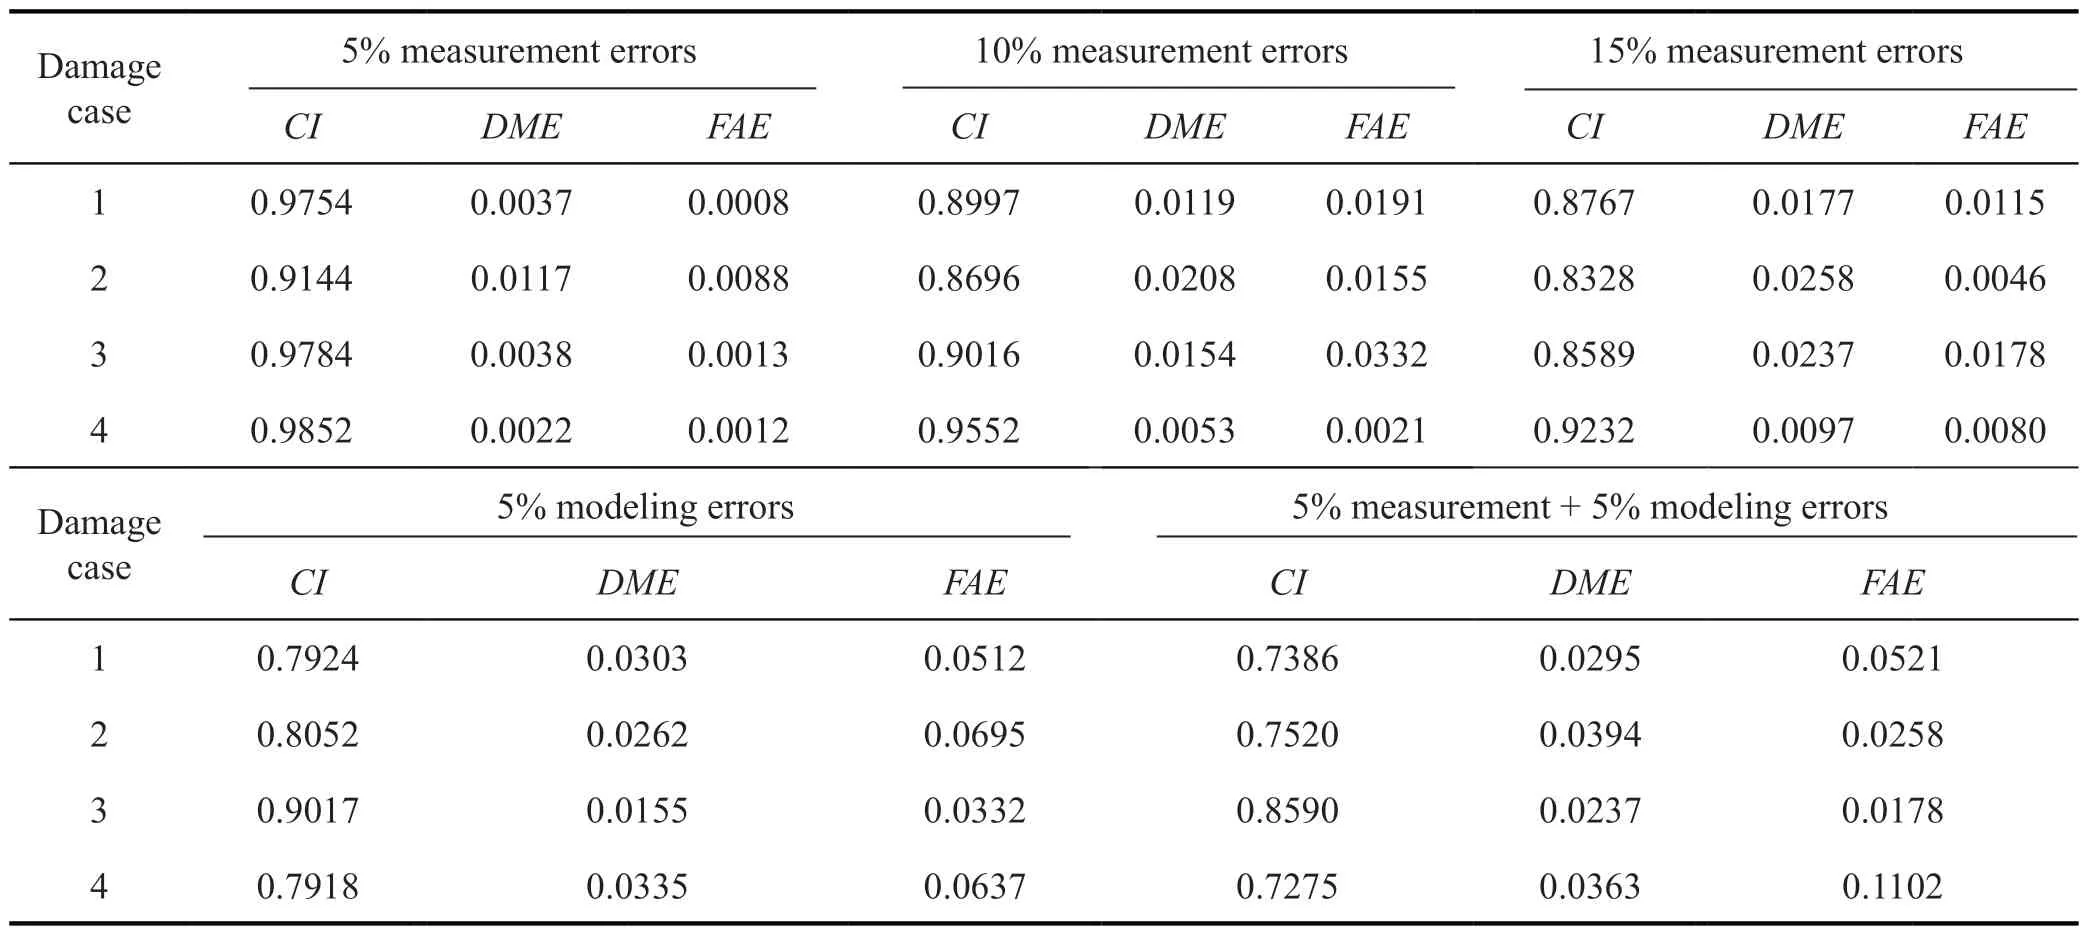
Table 3 Damage indices (CI, DME and FAE) of the damage cases considering measurement and modeling errors
3.3 Plate structure
Plate components are used in many engineering structures such as ships, aircraft, and jacket platforms.Plate structures are more complicated than truss and frame structures.The performance of the proposed algorithm is examined for model updating and damage identification of these types of structures.The numerical model of a single-support steel plate structure with dimensions of 500 mm × 500 mm × 5 mm, Young’s modulus (E)of 210 GPa, the mass density of 7800 kg/m3, and the Poison ratio of 0.3 is considered for numerical simulation.The FEM of the plate has 20 zones, and each zone is divided into four quadruple elements.The FE model consisted of 80 elements, 99 nodes, and 270 DOFs.Each node has one transitional and two rotational DOFs.The transitional DOFs along thez-axis are used to apply excitation load and response measurement.The plate structure model is shown in Fig.13.
Five damage cases have been investigated to evaluate the effect of damaged elements’ number, location, and severity on the parameter estimation results, along with simulation of measurement and modeling errors.Table 4 shows the characteristics of the damaged cases.
The first five natural frequencies of intact and damaged plate structures are presented in Table 5.The excitation frequency ranges of 1 to 145 and 480 to 680 Hz are considered for all damage cases.The selected frequency ranges are shown in Fig.14.The excitation and measurement locations (DOFs) are shown in Fig.13.The transmissibility curves related to excitation at points 2, 3, 4, and 5 and measurement at points 1 and 2are shown in Fig.15.The intersection of transmissibility curves determines the natural frequencies.
The results of the finite element model updating considering measurement and mass modeling error are plotted in Fig.16(a) to Fig.20(a).
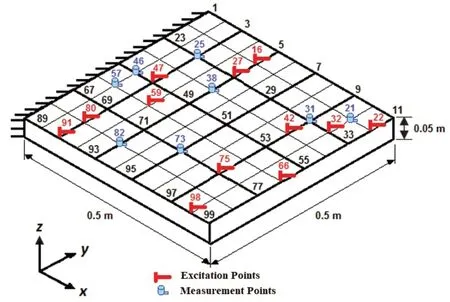
Fig.13 Plate structure model and locations of excitation and measurement points
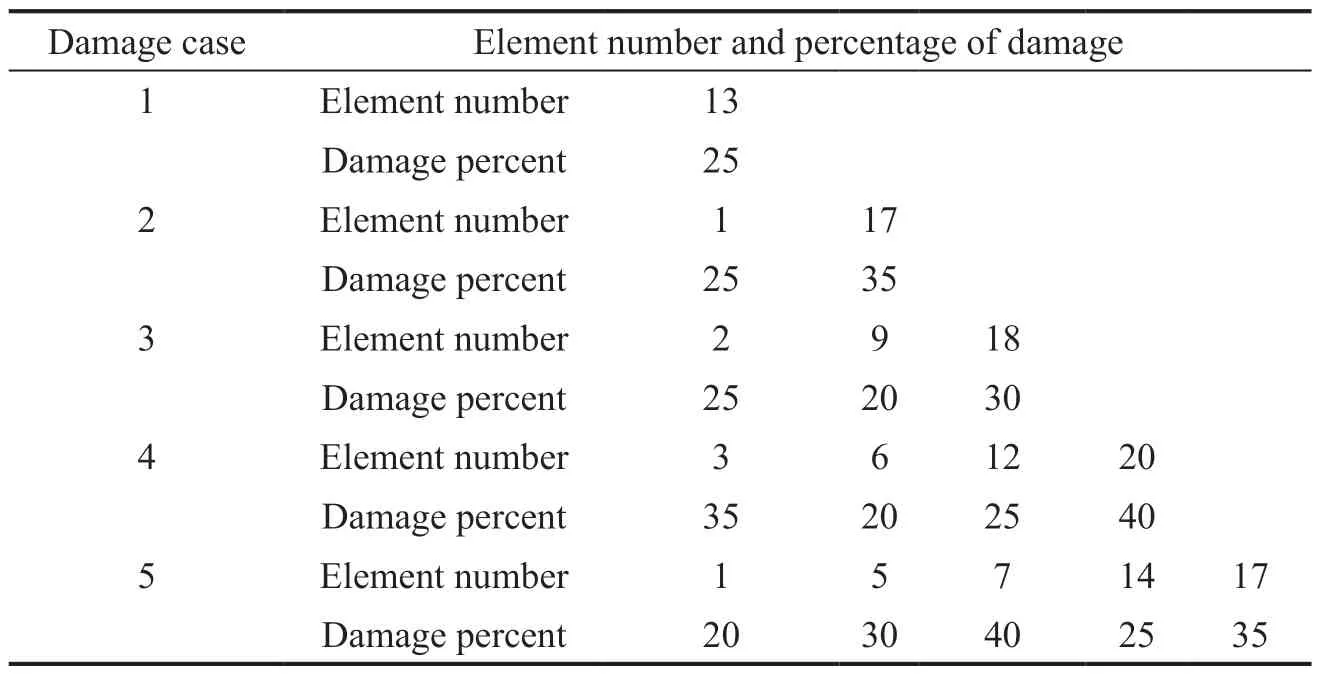
Table 4 Percentage of stiffness reduction (damage) of plate elements
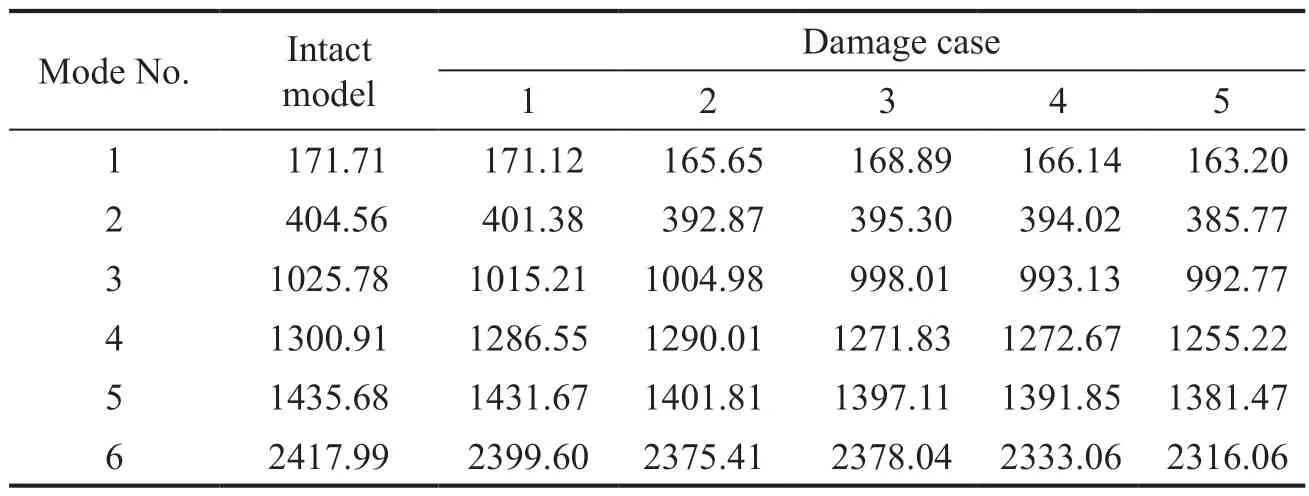
Table 5 Natural frequencies of the intact and damaged plate models (Hz)

Fig.14 Selected frequency ranges for all damage cases

Fig.15 Four transmissibility diagrams related to excitation at points 2, 3, 4, and 5 and measurement at points 1 and 2()
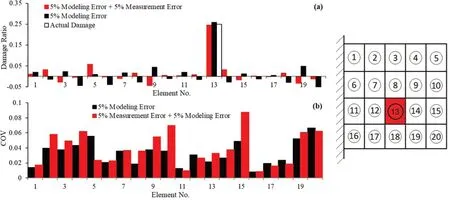
Fig.16 (a) Predicted and actual damage ratios considering 5% modeling and 5% measurement errors for damage case 1;(b) coefficient of variations (COVs)
The parameter estimation results indicate that the presented parameter estimation method can accurately localize and quantify structural damage using highly error-infected data for the plate models.The coefficient of variation (COV) of the parameter estimation is plotted using error-infected data in Fig.16(b) to Fig.20(b).Low COVs of the parameter predictions indicate the accuracy and low dispersion of the predicted structural parameters.TheCI,DME, andFAEvalues for the estimated parameters are also given in Table 6.the evaluated indices indicate the accuracy of the predicted parameters of the plate model by the proposed sensitivity equation.

Fig.17 (a) Predicted and actual damage ratios considering 5% modeling and 5% measurement errors for damage case 2;(b) coefficient of variations (COVs)

Fig.18 (a) Predicted and actual damage ratios considering 5% modeling and 5% measurement errors for damage case 3;(b) coefficient of variations (COVs)
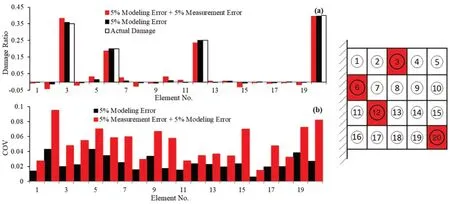
Fig.19 (a) Predicted and actual damage ratios considering 5% modeling and 5% measurement errors for damage case 4;(b) coefficient of variations (COVs)

Fig.20 (a) Predicted and actual damage ratios considering 5% modeling and 5% measurement errors for damage case 5;(b) coefficient of variations (COVs)

Table 6 Damage indices (CI, DME and FAE) of the damage cases considering measurement and modeling errors
4 Conclusions
This study developed a new sensitivity equation based on the transmissibility data.The stiffness parameters are updated to identify damage location and severity.The finite element models of a two-bay two-story frame and a single support plate structure simulate the structural responses.The effects of modeling and measurement errors on model updating results were considered by adding uniform distributed random errors to the numerical data.The predicted parameters’ robustness was investigated by evaluating the mean coefficient of variation of the estimated parameters.The parameter estimation results prove the capability of the proposed method against modeling and measurement errors.The coefficients of variations of the updated parameters indicate low scattering of the parameter estimation.
 Earthquake Engineering and Engineering Vibration2024年1期
- Earthquake Engineering and Engineering Vibration的其它文章
- Reliability-based life-cycle cost seismic design optimization of coastal bridge piers with nonuniform corrosion using different materials
- Time-domain dynamic constitutive model suitable for mucky soil site seismic response
- Experimental study on seismic reinforcement of bridge foundation on silty clay landslide with inclined interlayer
- A novel mitigation measure for normal fault-induced deformations on pile-raft systems
- Longitudinal vibration characteristics of a tapered pipe pile considering the vertical support of surrounding soil and construction disturbance
- Resilient performance of self-centering hybrid rocking walls with curved interface under pseudo-static loading
