Resilient performance of self-centering hybrid rocking walls with curved interface under pseudo-static loading
Su Xing, Yan Shi, Sun Xianglei and Wang Tao
1.School of Civil Engineering, Shenyang Jianzhu University, Shenyang 110168, China
2.PetroChina East China Design Institute Co., Ltd., Qingdao 266000, China
3.Qingdao Country Garden Bolin Real Estate Co., Ltd., Qingdao 266100, China
Abstract: Frame and rocking wall (FRW) structures have excellent resilient performance during earthquakes.However,the concrete at interfacial corners of rocking walls (RWs) is easily crushed due to local extreme compression during the rocking process.An innovative RW with a curved interface is proposed to prevent interfacial corners from producing local damage, enhancing its earthquake resilient performance (ERP).The precast wall panel with a curved interface is assembled into an integral self-centering hybrid rocking wall (SCRW) by two post-tensioned unbonded prestressed tendons.Moreover,two ordinary energy dissipation steel rebars and two shear reinforcements are arranged to increase the energy dissipation capacity and lateral resistance.Two SCRW specimens and one monolithic reinforced concrete (RC) shear wall (SW) were tested under pseudo-static loading to compare the ERPs of the proposed SCRW and the SW, focusing on studying the effect of the curved interface on the SCRW.The key resilient performance of rocking effects, failure modes, and hysteretic properties of the SCRW were explored.The results show that nonlinear deformations of the SCRW are concentrated along the interface between the SCRW and the foundation, avoiding damage within the SCRW.The restoring force provided by the prestressed tendons can effectively realize self-centering capacity with small residual deformation, and the resilient performance of the SCRW is better than that of monolithic SW.In addition, the curved interface of the SCRW makes the rocking center change and move inward, partially relieving the stress concentration and crush of concrete.The rocking range of the rocking center is about 41.4% of the width of the SCRW.
Keywords: self-centering hybrid rocking wall (SCRW); monolithic shear wall (SW); earthquake resilient performance(ERP); curved interface; rocking center
1 Introduction
Earthquakes, as a type of destructive natural disaster,usually endanger human life safety and social economy.Traditional monolithic concrete shear walls are widely used in high-rise building structures in seismic areas due to their large in-plane stiffness and high bearing capacity.However, due to the complexity and uncertainty of earthquakes, previous earthquake damage investigations(Fintel, 1995; Zhang and Jin, 2008; Sun and Yan, 2015)show that monolithic shear wall structures are often severely damaged with large residual deformation after major earthquakes.Traditional criteria in the seismic design of reinforced concrete (RC) structures consider zones where plastic hinges can develop.Due to yielding in the plastic hinges, structural ductility can be achieved, with energy dissipation under cyclic loading and a reduction in seismic inertial action.This behavior,however, results in severe damage to the structure after the design earthquake, and hence the need for difficult and expensive repair work.Therefore, the seismic performance goal of building structures is gradually tilted from ensuring life safety to restoring the structural functionality of buildings, to achieve the purpose of no or minimal residual deformation of building structures after earthquakes.Furthermore, the new design criteria that are not only linked to human safety at the ultimate limit state (ULS) but also consider damage-limiting performance.Among these, self-centering (SC) seismic structures have attracted much research attention in the earthquake engineering community.Compared with traditional seismic structures, the most prominent feature of the SC structures is that the residual deformation can be completely or basically recovered after unloading.The SC structures produce little residual deformation, and can be restored to normal use with or without a small amount of maintenance after earthquakes (Zhou and Lu, 2011;Naserpour and Fathi, 2022).The self-centering hybrid rocking wall (SCRW) is mainly composed of three parts:shear wall, post-tensioned unbonded prestressed tendons and energy dissipators (Huet al., 2018).Such structures combine the performance of self-centering and energy consumption, which produce little residual deformation,and can be restored to normal use with or without a small amount of maintenance after earthquakes.An opening joint between the bottom of the wall and the foundation is set to produce the SCRW, which can decrease the lateral stiffness of the wall, providing nonlinear behavior and increasing the deformation ability of the wall.The constraint at the bottom of the rocking wall under the horizontal load can be relaxed, therefore, the wall can rotate slightly along the surface within both ends of the wall, which effectively reduces the bearing capacity demand of the wall and the foundation.
Three types of typical hysteresis curves of conventional monolithic shear wall, prestressed-only rocking wall (RW) and SCRW are shown in Fig.1.For the last two RW structures, the unbonded prestressed tendons, if left in the unbonded prestress range over a certain length, may remain in the elastic stage during rocking.Therefore, the restoring force provided by the elastic prestressed tendons will essentially prevent the occurrence of residual lateral displacements.Since the concrete is not bonded to the tendons, considerably less cracking is induced than in monolithic shear walls that rely solely on bonded reinforcements to provide the lateral force resistance.The behavior of such a structure can be described as bilinear elastic, and cosmetic damage is restricted to the bottom corners of the RW structure.By armoring the ends of a prestressed concrete shear wall with steel plates and embedding a mating steel plate in the foundation, which makes it possible to avoid any damage, the concept was first proposed by Mander and Cheng (1997).One potential disadvantage of this purely bilinear elastic structure is the lack of energy dissipation capacity, as shown in Fig.1(a).By incorporating energy dissipators such as low yield strength reinforcements(Restrepo and Rahman, 2007; Zhouet al., 2021a)between the shear wall body and the foundation, a level of hysteretic damping can be introduced to reduce the structure’s response to seismic excitation, while still ensuring that the SC characteristics provided by the combination of gravity and prestressing force are preserved (Fig.1(b)).In addition, monolithic shear wall structures can dissipate large amounts of energy, see Fig.1(c), but this is provided through structural nonlinear deformation and damage that results in degradation in the stiffness, as well as residual deformation (Holdenet al.,2003).In contrast, prestressed-only structures dissipate little energy, which is expected to lead to displacement demands larger than for those structures in which energy dissipation can take place.The SC hybrid structures incorporating energy dissipators can be designed to combine the benefits of both structures, thus providing a good dissipation and showing SC characteristics as well as no damage.
Scholars have done much research on SCRWs,which has resulted in a good understanding of their behavior and guidelines for their design.Kuramaet al.(1999) proposed a direct displacement-based seismic design method for SCRWs.Recommendations are given for the selection of wall design characteristics, such as the initial stress, location and unbonded length of posttensioned tendons, height of RW, the number of spiral reinforcements, etc.The corresponding analytical model was established, and nonlinear time history analysis was performed in DRAIN-2DX using the beam-column element in fiber model, which showed that the SC concrete walls exhibited nonlinear elastic behavior in design basis earthquakes and were virtually undamaged.Huet al.(2013) established a finite element numerical analysis model and theoretical analysis model of an SCRW containing both prestressed tendons and dampers,which focused on the way to simulate the prestressed tendons, dampers, and horizontal connections between the RW and foundation.A numerical simulation of the SCRW subjected to repeated loading was carried out and the results were compared with those from the theoretical analysis.The results show that the hysteresis curve of the SCRW displayed a characteristic “flagshape” hysteretic response under repeated loading, and there was no residual displacement after it unloaded completely.In terms of experiments, Prezeet al.(2002,2004) showed that unbonded prestressed precast concrete shear walls have good SC performance and can be used in high-intensity seismic areas.Holdenet al.(2003)and Smithet al.(2013) studied the seismic performance improvement between the SCRW and conventional monolithic precast shear wall.The results show that the SCRW has excellent energy dissipation and SC ability without residual drifts.

Fig.1 Schematics of RC wall hysteresis curves: (a) prestressed-only RW; (b) SCRW; (c) monolithic shear wall
The research studies described above focused on the overall seismic performance, but ignored the damage to the rocking element itself.The corners of RC rocking elements will crush during the rocking motion, and these structures should be specially retrofitted.Vertical cracks and splitting of the concrete cover at the wall toes were observed while rocking in the tests of three prestressed concrete walls (Lu and Wu, 2017).Xuet al.(2018) showed that spalling and crushing of concrete often occur at the bottom corners of the SC walls under cyclic loadings, causing the loss of tendon force and SC capability, and potentially triggering out-of-plane buckling.Therefore, corners of the SCRW need to be designed with less damage to avoid crack and stress concentration.Armoring steel plates are typically embedded in the toes of traditional rocking walls to limit the risk of damage caused by the concentration of compressive stresses at the wall base during rocking(Mander and Cheng, 1997).Experimental tests have shown that such damage can be avoided completely when armoring systems are combined with the use of fiber-reinforced concrete (Solberget al., 2009).Since it is not always easy to install an efficient armoring system, the response of wall toes without an armoring system is of interest.To prevent severe damage at the bottom of the walls when rocking, pin connection was proposed by Wadaet al.(2009).Cuiet al.(2019)employed polyurethane elastomer in rocking walls to prevent the corners from being crushed during the rocking motion.The rocking walls performed well in cyclic tests, exhibiting little damage and no flexural cracks.To prevent the bottom of the rocking wall from being damaged during rocking, rubber pads are set at the corners, and the lower part of the rocking walls are fabricated with high-strength grout (Liet al., 2020).Due to the insufficient tensile capacity of rubber, the rubber bearings may become damaged or even fail during the ground motion (Huet al., 2017).Moreover, Xuet al.(2018) removed the easily damaged elastoplastic feet and replaced them with the disc spring device (DSD),which is an axial SC energy dissipation device designed by combining disc springs and exhibits a high stiffness and bearing capacity.Under this mechanism, the SCSWDSD exhibits typical flag-shaped hysteretic behavior and has a robust SC capability.However, the concept of low damage to concrete components has still not been adequately realized in current research studies.
The above summaries show that both experimental and theoretical research of SCRWs has reached a relatively mature stage.However, there are fewer articles that systematically compare the resilience performance of monolithic SWs and SCRWs in combination with specific resilience performance indexes as well as the resilience indexes’ limits specified by the three-level fortification target for conventional structures, and the four-level fortification target for resilient structures.This study also focuses on the damage-limiting performance of SC walls and proposes an SCRW with curved interfaces.Although many of the studies noted above have been proposed to avoid damage and stress concentration in corners, most of them propose new devices or material to replace the RC in the corners.A disadvantage of this approach is that the devices or materials are embedded in the elements which are difficult to remove and replace after a strong seismic event.Furthermore, it is not always easy to install an efficient device in the process of retrofitting SCRW.Therefore, there are few studies that change the structural form of SC walls to achieve damagelimiting design of SCRW corners.The retrofitting of the SCRW into an SCRW with curved interface not only avoids the complicated installation of new devices leading to difficult removal after the earthquake but can also effectively solve the problem of damage to the corners of the wall, and effectively release the stress concentration, which truly achieves the goal of damagelimiting performance of SCRW.Therefore, in this study,the indicators affecting the resilient performance of the SCRW are analyzed in detail based on experimental studies and compared with the conventional monolithic shear wall to illustrate the superiority of seismic performance and resilient behavior in the SCRWs.The curved interface in the SCRW, and the change of stress concentration phenomenon combined with experimental and theoretical analysis, is discussed as well as how to achieve damage-limiting performance of the wall corner.
2 Overview of pseudo-static test
2.1 Specimen design
The purpose of this test is to verify the SC and energy dissipation mechanisms of the SCRWs, as well as the earthquake resilient performances (ERPs)compared with a conventional monolithic shear wall.To this end, a pseudo-static loading test scheme was adopted.A total of three specimens were made in this experiment, numbered as SW-1, RW-1, and RW-2,among which SW-1 is a traditional monolithic shear wall for comparison, and RW-1 and RW-2 are both SCRWs.Except for the different yield strengths of the energy-dissipating bars and initial prestress values, the other parameters are the same.Based on the design code of RC structures of China, the concrete strength grade is C35, the reinforcements of specimens are all made of HRB335 steel bars, and the unbonded prestressed tendons with a nominal diameter of 12.7 mm in the SCRW specimens are used.The initial pre-stressfpiof the SCRW specimens are 0.35fptkand 0.45fptk,respectively (fptkis the standard value of the ultimate strength of prestressed tendons, which is 1860 MPa).The dimensions of the tested RW are 2800 mm (height) ×1400 mm (width) ×160 mm (thickness), and the heightwidth ratios are both 2.The top of the tested SCRW is equipped with a reinforcing area reinforced by a dense mesh of rebars, and steel plates are embedded at the top and both ends of the top.An RC base is designed to support the SCRW, forming the rocking surface between the bottom of the upper SCRW and the RC foundation.The reinforcements and prestressed tendons passing through the rocking surface are designed to bear the bending moment and lateral force.Meanwhile, the friction along the rocking surface is also expected to provide a part of the lateral resistance.In addition, the edge areas at both ends of the conventional shear wall are configured to simulate the actual reinforcement of the wall in a real project.The schematics of the monolithic shear wall and the SCRWs are shown in Figs.2 and 3,respectively, where PT,RE, andRSdenote prestressed tendon, energy-dissipating reinforcement, and shear reinforcement, respectively.The vertical axial load for all the test walls was determined to be 200 kN.More details on the test walls are given in Table 1.The radius of the curved interface is 137 mm.
For the monolithic shear wall, the longitudinal reinforcements passing through the bottom surface between the shear wall and the foundation are used for both connecting the shear wall to the foundation and dissipating seismic energy in earthquakes, which is the major cause for the residual deformation of the shear wall in the lateral reciprocating loading (Danget al.,2014).However, the main reason why there is almost no residual deformation for the SCRW with energy dissipators is that it has the powerful SC ability provided by prestressed tendons and the gravity of SCRW.It is generally believed that for the SCRWs with energy dissipation devices, the SC effect occurs only when the resisting bending moment provided by the prestressed tendons is greater than that provided by energy dissipation devices (Stantonet al., 1997).To quantify the SC ability provided by the prestressed tendons and the energy dissipation capacity provided by the energydissipating bars, the moment contribution ratioλgiven by the NZS 3101: Part 1 (2006) was used in this study to reflect the relative configuration ratio of energydissipating bars and prestressed tendons in the structure,which in turn determines the relative capacity of SC and energy dissipation:
whereλis the bending moment contribution ratio,Mprsis the contribution of prestress to bending capacity,MNis the contribution of axial compression to bending capacity,Msis the contribution of energy-dissipating bars or other energy-dissipating devices to bending capacity.
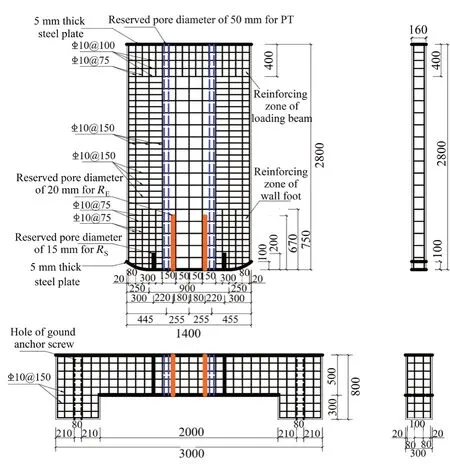
Fig.2 Schematic of reinforcement in details of SCRW specimens RW-1 and RW-2

Fig.3 Schematic of reinforcement in details of monolithic specimen SW-1

Table 1 Main design parameters of specimens
For self-centering shear wall (SCSW) structures,the ACI ITG-5.1-07 (2007) mentioned that to meet the requirement where the energy consumption ratio is not less than 1/8, the bending moment contribution of the energy-consuming reinforcements shall not be less than 25% according to the research of Kurama (2002) (the corresponding bending moment contribution ratio is 3).The SC ability of SCSWs basically disappears when the bending moment contribution of the energy-dissipating bars reaches 40% (the corresponding bending moment contribution ratio is 1.5).A reasonable design of the bending moment contribution ratio can ensure that the structure has sufficient energy dissipation capacity and at the same time has the advantage of SC for the SCRWs.Therefore, it is critical to study the limit of the bending moment contribution ratio.At the same time, ACI ITG-5.2-09 (2009) suggested that the calculation formula of the minimum initial prestress to ensure that the wallbase opening is closed after the earthquake is in Eq.(2).
Among them,Apsdenotes the cross-sectional area of the prestressed tendons,fpidenotes the initial prestressing force,Nis the sum of the self-weight of the wall and the vertical axial forces,Asis the total cross-sectional area of the energy-dissipating reinforcements, andfudenotes the ultimate tensile strength of the energy-dissipating bar.Equation (2) shows that the restoring forces provided by both prestressed tendons and vertical axial forces should be greater than the energy dissipation forces from the energy-dissipating rebars to ensure sufficient SC capacity of the SCRWs.Therefore, the initial prestress of the prestressed tendons in the test should meet the requirements of the above recommendations, and the main design parameters of each test specimen are shown in Table 1.
2.2 Production of specimens
The three specimens were produced in two different ways.The construction procedure of the conventional monolithic concrete shear wall was adopted for specimen SW-1.Moreover, for specimens RW1 and RW-2 of the SCRWs, the procedure of prefabricating the foundation and the wall, separately, and then assembling was adopted.Before the concrete was poured, the PVC conduits were pre-buried at a given position of the prestressed tendons, and the energy-consuming bars and shear reinforcements were reserved in both sides near the middle of the rocking wall root after the plain reinforcements were bounded to the support formwork of the rocking wall.In addition, holes were reserved at the positions of the concrete foundation corresponding to the prestressed tendons, energy-consuming bars,and shear reinforcements.After rebars were all in the given positions, the concrete was casted into the formwork, and then cured for 28 days.After that, the RC wall was assembled with the foundation for testing after the concrete reached the expected strength.The prestressed tendons, energy-dissipating bars and shear reinforcements were inserted into the corresponding reserved holes.Two ends of each prestressed tendon were fixed through special prestressed anchorages at the bottom of the foundation and the top of the rocking wall.Meanwhile, a mechanical sensor was installed to measure the real-time change values of the prestressed tendon.The prestressed anchorage and mechanical sensor were separated by a 10 mm thick steel plate to prevent the damage of sensor, as shown in Fig.4.The energy-dissipating bars were fixed at the bottom of the foundation with a special anchorage of reinforcement, as shown in Fig.5.
2.3 Mechanical properties of material
The concrete strength grades of all the specimens are C35, the reinforcements are made of HRB335, and the prestressed tendons are made of seven-wire steel strands with ultimate strengthof 1860 MPa (fptk= 1860 MPa)and nominal diameter of 12.7 mm (Φs= 12.7 mm).The main design parameters of the specimens are shown in Table 1.The measured mechanical properties of concrete are shown in Table 2, and the measured mechanical properties of reinforcements and prestressed tendons are shown in Table 3.
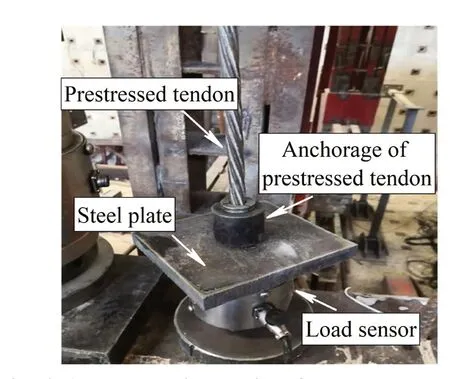
Fig.4 Anchorage in details of prestressed tendon
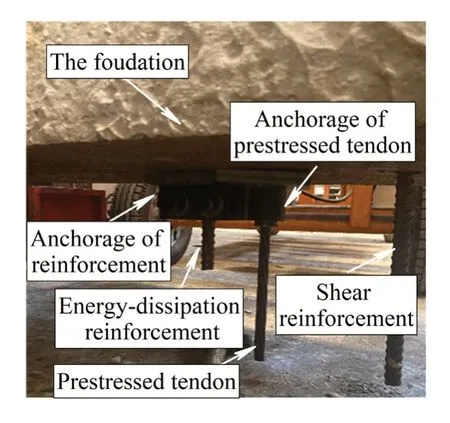
Fig.5 Assemblage of base and reinforcements
2.4 Experimental program
In this test, a pseudo-static loading scheme was carried out with an MTS produced electro-hydraulic servo actuating system in the Structural Engineering Laboratory of Shenyang Jianzhu University, China.The loading scheme was formulated with reference to the “Seismic Test Regulations for Buildings of China”(JGJ/T101-2015, 2015).The schematic of loading setup is shown in Fig.6.The vertical axial force was applied by a hydraulic jack with the rated force of 200 kN, and the horizontal loading was also applied by an MTS produced electro-hydraulic servo actuator.The ACI ITG-5.1-07(2007) suggested that the drift of the SCRW during the loading process should not exceed the drift limitθlimto prevent the prestressed tendons from yielding or breaking during the loading process, and its expression is shown in Eq.(3).
wherehwandlwdenote the height and width of the SCRW, respectively.The aspect ratios of the specimens are 2.0, and the drift limit calculated according to Eq.(3)is about 2.1%.In order to have a deeper understanding of the mechanical characteristics of the SCRW in thisloading process, the test completed sign was determined when either each prestressed tendon yielded, or the drift of the rocking wall reached 3%.However, for the monolithic shear wall, the end of loading is marked as when the horizontal load-carrying capacity dropped to 85% of the maximum value.

Table 2 Compressive strength of concrete
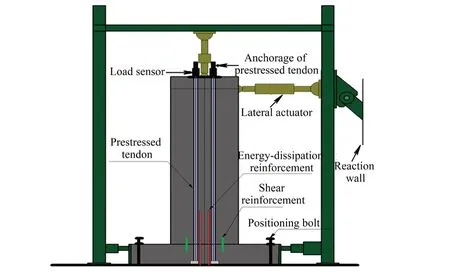
Fig.6 Schematic of experimental setup

Table 3 Mechanical properties of reinforcing steel and strand
The specimens in the test were loaded by both force and displacement control schemes, as shown in Fig.7.A photo of the experimental setup is shown in Fig.8.For the monolithic shear wall experiment, a vertical force of 30 kN was preloaded before starting the test to eliminate the internal unevenness of the specimen and check whether the experimental equipment and each measuring instrument worked properly.When formally loaded, a lateral force of 20 kN was taken as the first stage.The load control stage had two cycles for each loading level,whereas the displacement control stage had two cycles for each lateral drift level.The “3/4-rule” (Priestley and Park, 1987) was employed in the loading scheme.Specifically, in the load control stage, the SW-1 was monolithically loaded until the applied force equaled 3/4 of the nominal yield force,Fy, which was obtained from a moment-curvature analysis of the wall base section.The wall yield displacement,Δy, was then determined as 4/3 times the average peak displacement reached within this cycle.The yield displacement is 3.8 mm.Then the loading scheme was changed to the displacement control stage.For the following stage, there was also two cycles for the same peak displacement until the specimen failed.The end of the monolithic shear wall test was marked as when the lateral load-carrying capacity had dropped to 85% of the maximum value.For the SCRW experiment, similarly, a vertical force of 16 kN was preloaded in the SCRW specimen before starting the test to eliminate the internal unevenness of the specimen and check whether the test equipment and each measuring instrument were in normal operation.When officially loaded, a lateral force of 10 kN was loading for the first stage.For each stage, there was also two cycles with the same peak loading force until the tested SCRW yielded with the yield displacement of 8 mm.Then the loading scheme was also changed to the displacement control one, and the loading step was the displacement of 8 mm.Considering the unpredictability of the SCRW test, the loading would be terminated if one of the following phenomena occurs:
(1) Each prestressed tendon yields.
(2) The drift of the SCRW reaches 3%.
(3) The body of the SCRW slips.
(4) The SCRW is seriously damaged.
(5) Each energy-dissipating bar is damaged.
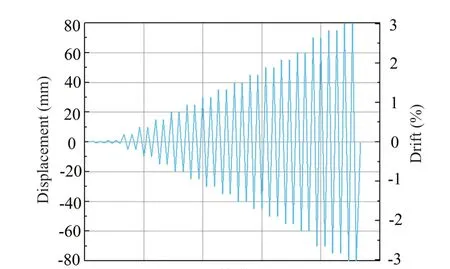
Fig.7 Loading scheme
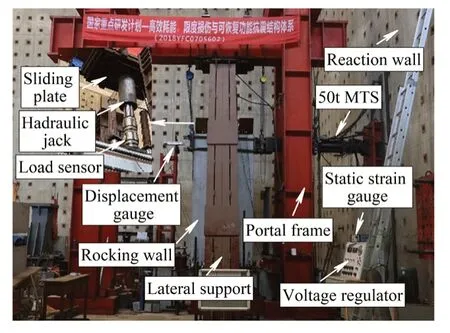
Fig.8 Photo of experimental setup
2.5 Measurement system
The loads, displacements, and prestressing forces of the prestressed tendons of each specimen were measured in the tests, and the measurement point arrangement of the typical specimen RW-1 is shown in Fig.9.The lateral displacement gauges (D7, D8 and D9) arranged along the SCRW height were used to measure the lateral displacements at the positions of different heights in each loading step.Moreover, a lateral displacement gauge (D6) was arranged on the side surface of the foundation to measure the slip of the foundation.Five more displacement gauges (from D1 to D5) were arranged at the root of the SCRW specimen to measure the opening and closing uplifts of the joint between the SCRW and the foundation.In addition, two load sensors were arranged at the ends of the two prestressed tendons,therefore, the real-time change values of the prestressing forces during the whole test process can be obtained through the load sensors.
3 Analysis of test results
3.1 Test phenomenon and failure modes
For the monolithic shear wall SW-1 specimen,a bending-shear failure mode was observed.Lateral cracks appeared in the corners at the bottom of the SW-1 specimen during the early stage of loading, and extended and gradually developed into inclined cracks during the medium stage of loading.Finally, the concrete in the corners peeled offand the reinforcements were broken or buckled, with the bearing capacity declined.The experimental phenomena of specimen SW-1 at the wall roots under the drifts of 0.04%, 0.17%, 0.95% and 1.25%,are shown in Fig.10.The above four drifts roughly corresponded to those of the conventional shear wall SW-1 at the states of concrete cracking, reinforcement yielding, ultimate and failure.The failure mode for SW-1 is shown in Fig.11.
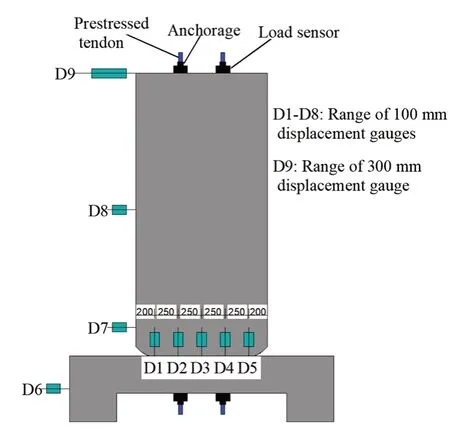
Fig.9 Measurement point arrangement

Fig.10 Experimental phenomena of specimen SW-1 in different drifts: (a) θcr=0.04%; (b) θy=0.17%; (c) θpe=0.95%; (d) θde=1.2%
For the SCRW specimens of RW-1 and RW-2, the opening joint between the bottom of the rocking wall and the foundation gradually enlarged during the loading process.Compared with the number and length of cracks for the monolithic shear wall specimen of SW-1, there were almost no cracks in both RW-1 and RW-2 under the same drift during the rocking process.The failure mode of the SCRW specimens were the excessive deformation(rotation), which may concentrate at the opening joint between the bottom of the rocking wall and foundation,effectively reducing the damage of the wall itself.In the end, the rocking wall showed little lateral slips along the rocking surface, demonstrating the effectiveness of the shear reinforcement in the test.The typical failure mode of the SCRW specimens is shown in Fig.12.There were few cracks in the SCRW specimens even if they had reached the destruction level (θde= 1.2%).
3.2 Hysteresis curves
The hysteresis curves of all specimens of SW-1,RW-1 and RW-2 are shown in Fig.13, in which the vertex displacements had been deducted from the displacements caused by the base slip.In the hysteresis curve in Fig.13(a), it was found that the curve at the early loading stage was basically in straight lines, and the envelope areas of hysteresis loops were narrow and small, which denotes the specimen was in an elastic working state with little residual deformation.As the cracks appeared in the corners at the bottom of specimen SW-1, the areas of the hysteresis loops started to gradually increase.As the cracks gradually developed,the areas of hysteresis loops kept increasing until the outermost reinforcement yielded, and the specimen entered the displacement control stage.Then, the stiffness degradation of the specimen accelerated, and the residual deformation continued to increase, and the hysteresis curves became more plump with the increase of the loading displacement.At the end of the loading,the concrete on both sides of the SW-1 foot was crushed,and the outermost concrete was pulled off.At the same time, the lateral bearing capacity dropped sharply.

Fig.11 Overall failure mode of specimen SW-1
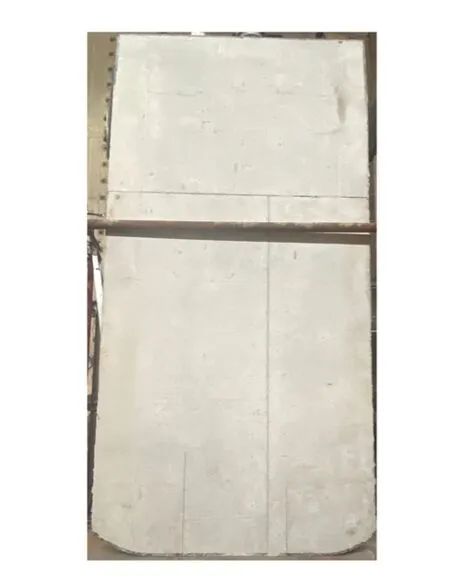
Fig.12 Overall failure mode of specimen RW-1
The hysteresis curves of RW-1 and RW-2 are shown in Figs.13(b) and 13(c).Note that the hysteresis curves display a characteristic “flag-shape” hysteretic response under the combination of prestressed tendons and energy-dissipating bars, which verifies the excellent ability of SC and energy consumption.At the beginning of loading, the specimens are approximately in an elastic state.An uplift at the specimen corners could be observed, and the initial state of rocking is reached with the increase of loading displacement.Then, the interfaces between the SCRW and the foundation alternatively open and close (called the breathing effect),and the slope (stiffness) of the hysteresis curves were significantly reduced, signifying that the curves reached the started rocking point.Meanwhile, the envelope area of the hysteresis loop is still small with a very narrow shape, and the main energy consumption comes from the rocking deformation of the SCRW.The envelope area of the hysteresis loop begins to increase after the energyconsuming reinforcement yields.Then, the hysteresis curves become plump, and the stiffness begins to deteriorate.Elastic restoring forces can be provided all the time during the rocking due to the material properties of prestressed tendons.As a result, the SCRW specimens have almost no residual deformation, verifying the excellent resilient performance.
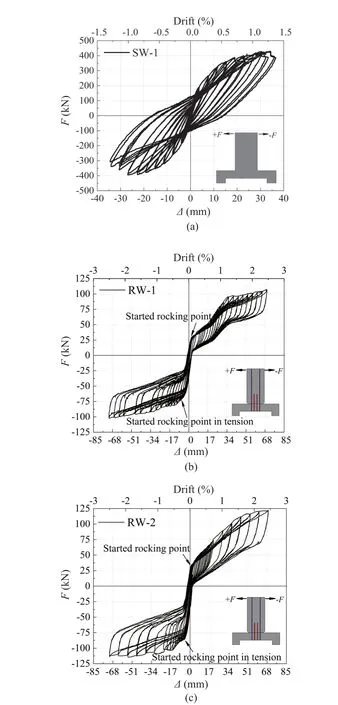
Fig.13 Hysteretic curves of specimens: (a) Specimen SW-1;(b) Specimen RW-1; (c) Specimen RW-2
All the residual deformations after unloading of the SCRWs are much smaller than that of the monolithic RC shear wall, indicating the superior SC ability of the SCRWs.However, it can also be seen from Figs.13(b)and 13(c) that the hysteresis curves do not return to the original point of loading, which was mainly due to the weak shear strength at the connection between the SCRW and the foundation, resulting in a small amount of slippage along the interface under the lateral load.At the same time, the hysteresis loop area of the SCRW is smaller than that of the monolithic RC shear wall,indicating that the energy consumption capacity of the latter is better than that of the former.The interface of the rocking wall and the foundation can open by cutting offthe connection of the vertical reinforcement at the shear wall edges, and the energy consumption of the reinforcement at the wall edge is greatly reduced.However, the energy consumption capacity of the SCRW with energy-dissipating reinforcements has been greatly improved compared with the prestressed-only rocking wall (Perezet al., 2007).
The envelope area of the hysteresis loop is always smaller in the second cycle than in the first cycle during the same loading step, and the envelope area of the hysteresis loop becomes larger with the increase of loading steps.This might be because the cyclic loading can lead to the accumulation of damage to the components and the slippage in the anchorage of the prestressed tendons, resulting in the degradation of the strength and stiffness of the specimens.Under the continuous cyclic loading, the damage accumulation of the energy dissipator is much more serious; therefore,the peak value and slope of the lateral bearing capacity in the second cycle of cyclic loading is lower than in the first cycle.
In addition, the initial prestress and yield strength of energy-consuming bars of RW-2 increase compared with RW-1.It can be seen from the hysteresis curves that increasing the initial value of prestressing force can improve the early stiffness and lateral resistance of the SCRW.When the hysteresis curves are in the elastic stage, the rocking wall with the smaller initial prestress has better energy dissipation capacity than that with the larger one, which is because the larger initial prestress will limit the deformation of the rocking wall and the cracking of the concrete.The specimen RW-2 with higher yield strength of energy-dissipating bars has better abilities of energy consumption and self-centering, and the hysteresis curves are plumper when the hysteresis curves are in plastic stages.
3.3 Skeleton curves
In the pseudo-static test, all the peak load points of the cyclic loading of the hysteresis curve are connected to form an envelope curve, and the skeleton curves of the three specimens are shown in Fig.14.The characteristics of the skeleton curves can be described as follows.
(1) The skeleton curve of the monolithic shear wall SW-1 presents a typical “S” shape, which denotes that the skeleton curve rises rapidly before reaching the peak load, and after reaching the peak load, the skeleton curve first slowly descends and then drops sharply after the outer reinforcement is broken.The skeleton curves of the RW-1 and RW-2 for the SCRWs show a typical“multi-lines” shape.According to the related research of Kuramaet al.(1999) on the SCRW, the point where the skeleton curve in Fig.15 had an obvious turning can be called the softening point.At the softening point, the stiffness of the wall decreases significantly due to the gradual increase in the opening of the wall-foundation joint.
(2) The bearing capacity of specimen RW-2 at the softening point increases as the initial prestress increases,as shown in Fig.15.Specimen RW-2 with larger initial prestress has higher stiffness in the elastic stage than that with a smaller one.The change in skeleton curves is produced by the combination of prestressed tendons and energy-consuming reinforcements with the increase of loading displacement.The stiffness of specimen RW-2 after the softening point increases due to the increase of yield strength of the energy-dissipating bars.The specimen RW-1 with lower yield strength of the energyconsuming bars yields first, and the yield load was smaller than that of RW-2.It can be concluded that the value of initial prestress will affect the elastic stiffness of the skeleton curves before the softening point.In addition, the strength of the energy-dissipating bars will affect the plastic stiffness of the skeleton curves after the softening point, yield load and yield deformation of the SCRWs.
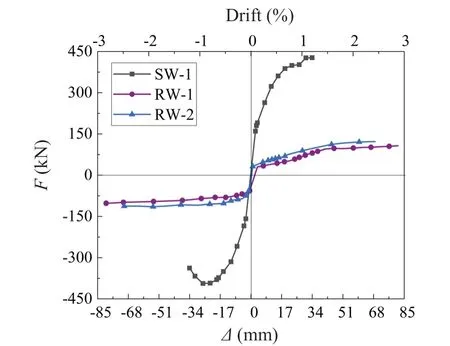
Fig.14 Skeleton curves of all specimens
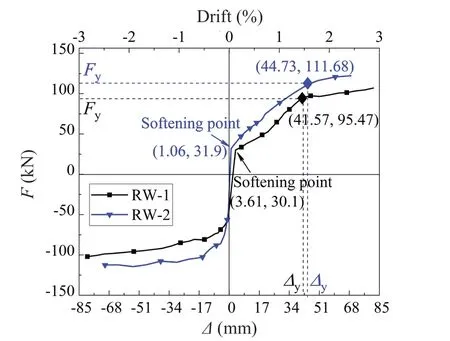
Fig.15 Skeleton curves of SCRW specimens
3.4 Resilient performance
The resilient performance of a structure is evaluated mainly from the following four aspects: (1) High strength and little damage; (2) Excellent ability of deformation;(3) Superior SC ability, which can return to its original position without residual deformation after undergoing major deformations; (4) Superior energy dissipation capacity.The structures combining the above four advantages are called resilient structures.Based on the damage of the SCRW discussed in the above section, the resilient performance of the SCRW will be studied from the three aspects of deformation, SC ability, and energy dissipation capacity in the following section.
In this study, the resilient performance index is available for reference, combined with the three-level seismic fortification goal of “not damaged in minor earthquakes, repairable in moderate earthquakes, and not collapsed in major earthquakes” in China.The drift limits of RC structures are shown in Table 4(Zhanget al., 2013).Therefore, the curves of different resilient indicators under different seismic drift limits can be obtained, and the improvement of the seismic performance of the SCRW is further illustrated according to the capacity of ductile deformation, SC performance,and energy dissipation capacity, in which MI E, MO E,and MA E denote minor, moderate, and major earthquakes in the curves describing different resilient indicators,respectively.
3.4.1 Capacity of ductile deformation
In seismic design, the term “ductility” refers to the ability of a structure to withstand large-amplitude cyclic deformations in the inelastic range without a large reduction in strength.During these cyclic deformations,resilient structures are often able to dissipate large amounts of energy.The displacement ductility coefficient required for a typical structure designed by the codes in China may vary from 1 for elastic structures to 6 for ductile ones, depending on the level of seismic design force required for the strength of the structure.

Table 4 Drift limits of existing reinforcement concrete structures
The displacement ductility coefficientμis used to measure the deformation capacity of the SCRW and monolithic shear wall structures, and its expression is shown in Eq.(4).
whereΔuandΔydenote the destructive displacement and yield displacement of the specimen, respectively,and the determination method is shown in Fig.16.The destructive displacementΔuis the corresponding displacement of the ultimate load on the skeleton curves.The yield displacementΔyadopts the equivalent elasticplastic yield displacement based on the reduced stiffness suggested in Park (1989), which corresponds to the Y point in Fig.16.
The displacement ductility coefficient of monolithic shear wall specimen SW-1 is 1.83, and the ductility coefficient of the SCRW specimens RW-1 and RW-2 are 1.96 and 1.91, respectively, after calculation.The displacement ductility coefficients of the SCRW RW-1 and RW-2 is slightly larger than that of SW-1 according to the calculation method of yield displacement suggested by Park (1989).This is because the “yield displacement”calculated according to Fig.16 is much larger than the displacement of the specimen entering the nonlinear point, which is shown in Fig.15.At the same time, the displacement corresponding to the peak load of rocking wall is selected as the failure displacement, which is smaller than the actual failure displacement.Since the SCRWs did not fail, the loading process was terminated in advance before the descending section appeared.Therefore, the failure displacement method selected for the shear wall was the same as that of the rocking wall for the sake of comparison, and both were smaller than the actual failure displacement.As a result, the displacement ductility coefficients calculated by Eq.(4) were smaller than the actual ones.In fact, the damage of the SCRW is much later than the monolithic shear wall SW-1, so that the deformation capacity of the former is much larger than the latter.
3.4.2 Self-centering performance
In addition to the decrease in damage and superior deformation ability of the SCRWs compared with monolithic shear wall, another significant advantage of resilient performance is SC capacity, which is evaluated by the SC coefficient and residual deformation.
(1) The calculation formula of SC coefficientγis shown in Eq.(5), whereΔrdenotes the residual deformation of the structure or component after unloading, andΔmrepresents the maximum deformation in the same hysteretic loop.The SC coefficientγis used to measure the SC ability of the structure or the component.The better the SC performance is, the larger the SC coefficient is, and its value is between 0 and 1.
(2) The deformation of the specimen as unloading to zero after all levels of loading is called residual deformation, which is a major indicator to evaluate the SC performance of the SCRW.Considering that there is a certain error in the force of the specimen during the cyclic loading, the absolute residual deformationΔr,ais used in this study to analyze the SC performance of each specimen.The first cycle of each loading level is taken as the basis for calculating the residual deformation.The expression is listed in Eq.(6).
whereΔr,pdenotes the residual deformation in push loading andΔr,trepresents the residual deformation in tension loading.The SC coefficientsγof the SCRWs are all around 90%, which is shown in Figs.18 and 19.Combined with the drift limit in the structural seismic code, the SCRWs are maintained elasticity in minor earthquakes without any residual deformation.There was little residual deformation in moderate earthquakes.The residual deformation of the SCRW was only 3-4 mm in major earthquakes, proving the superior SC and seismic performance.The residual deformation of the SCRW was mainly due to the loss of prestressing forces caused by the loosening and slippage of the prestressed tendon anchorage in the later stage of loading.At the same time, comparing the SC coefficientγand absolute residual deformationΔr,aof the two rocking specimens,the specimen RW-2 with increased initial prestress has a higher SC coefficient, indicating that increasing the initial prestress can improve the SC performance of the SCRWs.

Fig.16 Definition of yield and ultimate displacements
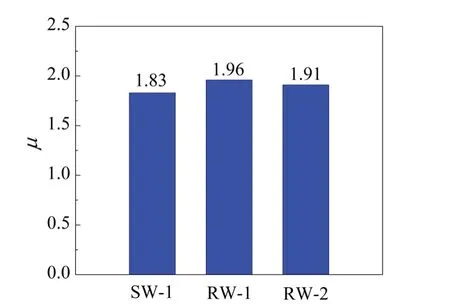
Fig.17 Displacement ductility factors of all specimens
From Fig.20, when the monolithic shear wall specimen SW-1 cracked and yielded in the early stage of test loading, a few residual drifts had been generated,but the residual drifts of the SCRW specimen RW-1 and RW-2 are almost 0.The residual drifts of all specimens increased as the peak displacement increased in the later stage of test loading.Specimen SW-1 failed whenθwas equal to 1.2%, and the residual drift was 1.05%,which exceeded 50% of the maximum displacement of specimen SW-1.The maximum drifts of specimen RW-1 and RW-2 were 2.5%, and the residual drifts were 0.13% and 0.17%, respectively, which was only about 5%-6% of the maximum displacement of the SCRW.Moreover, the residual drifts of RW-1 and RW-2 were much less than the limit of residual drift allowed by the four-level seismic fortification target of resilient structures.The allowable residual drift limit of fourlevel seismic fortification target is 0.5% (Zhouet al.,2021b).The SCRWs have better SC ability compared with monolithic shear walls and increasing the initial prestress can effectively reduce the residual displacement and improve the SC performance.
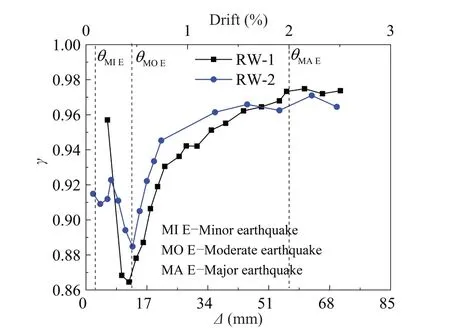
Fig.18 SC coefficients of RW-1 and RW-2
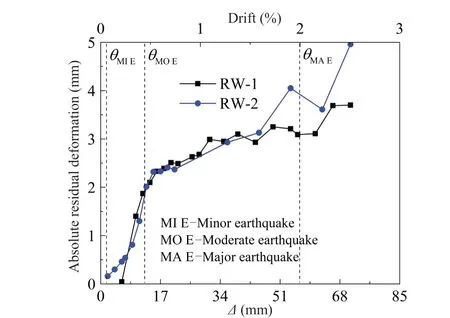
Fig.19 Absolute residual deformation of RW-1 and RW-2
3.4.3 Energy dissipation
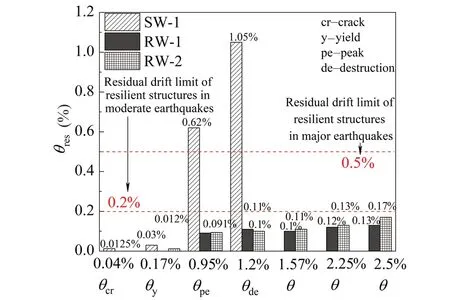
Fig.20 Residual drifts of all specimens
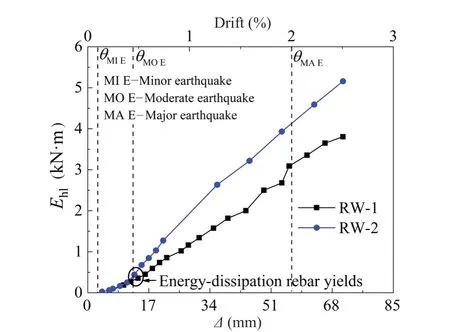
Fig.21 Energy dissipation in a hysteretic loop of the SCRWs
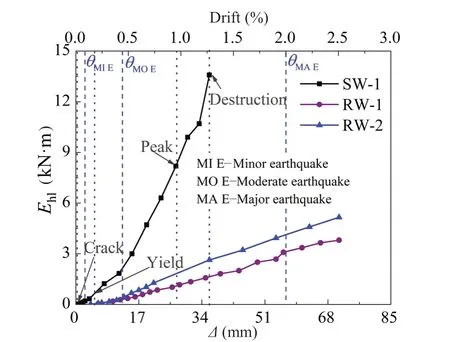
Fig.22 Energy dissipation in a hysteretic loop of all specimens
The energy dissipation of each hysteretic loop was used to compare the energy consumption of each specimen in this study, as shown in Figs.21 and 22.The energy dissipation of each specimen increased as the displacement increased.The energy dissipation of shear wall specimen SW-1 was increased after entering the plasticity state, meanwhile, the energy consumption of the SCRW specimens RW-1 and RW-2 increased gradually after the yield of each energy-dissipating rebar.The energy consumption of the monolithic shear wall specimen SW-1 in its main stages such as cracking, yielding, ultimate, and failure were all larger than those of SCRW specimens RW-1 and RW-2.The energy consumption of the specimen SW-1 reached 14 kN·m when the shear wall failed.However, the energy consumption of the SCRW specimens RW-1 and RW-2 at the same drifts were only 2 kN·m-3 kN·m, which was much smaller than that of the specimen SW-1.The maximum energy consumption of the SCRW specimens RW-1 and RW-2 as finishing the test was also smaller than that of the specimen SW-1, indicating that the energy dissipation capacity of the SCRWs was smaller than that of the monolithic shear wall.This is mainly because the shear wall specimen can dissipate energy through its plastic deformation, concrete cracking, and steel yielding, and various energy dissipation sources enhance the energy dissipation capacity.However, the energy consumption of the SCRW will be reduced due to the reduction of energy dissipation reinforcements caused by the opening joint between the rocking wall and foundation.The major energy consumption of the SCRW is generated by the yield deformation of energy dissipation reinforcements during the rocking process.
From Fig.21, the energy consumption of the SCRW was effectively enhanced with the increasing yield strength of energy-consuming rebars.The energy consumption curves of the two specimens RW-1 and RW-2 were overlapped before the energy dissipation rebar yielded, which denoted the energy consumption in each hysteresis loop were almost the same, indicating that the seismic energy was mainly dissipated by the rocking and deformation of the SCRWs.The energy dissipation of the specimen with higher yield strength of energy dissipation rebar was significantly greater than that of the specimen with lower yield strength after the energy dissipation rebar yielded, indicating that the seismic energy was mainly dissipated by the energy dissipation rebars.
The equivalent viscous damping coefficientξe, is used to quantify the energy dissipation, which can be calculated using the following equation and is illustrated in Fig.23.
in which,SABCandSADCare the shaded areas enclosed by theF-Δloop in Fig.23, andSOBEandSODFare the areas of the triangles OBE and ODF, respectively.Theξeresults thus calculated for each test wall are shown in Fig.24.It can be clearly seen from the figure that the monolithic shear wall SW-1 had more energy dissipation capacity than the other two SCRWs.
3.5 Changes in prestressing forces
The SC ability and experimental process of the SCRW were directly affected by the loading states of prestressed tendons.The entire test will fail once the prestressing tendons were yielded.During the test,the changes of prestressing forces were monitored in real time by load sensors on the prestressed tendons to ensure that the prestressed tendons were always in elastic states.Moreover, the curves of prestress changing with the drifts were plotted according to the monitored test data, as shown in Figs.25 and 26.The prestressing forces increased or decreased periodically with changes in drifts due to the joints between the rocking wall and foundation alternately opening and closing; therefore,the unbonded prestressed tendons located inside the wall were alternately stretched and released, which caused the prestresses to change alternately.
Combined with Figs.25(a) and 25(c), the prestressing force in the left prestressed tendon began to decay until the seventh hysteresis loop, and after that, the loss of prestress gradually increased.The loss of prestress reached about 39% of initial prestress at the twentieth loop.The reason why there was little prestress loss at the beginning of the test, and much loss in the later stage of the test, was due to the elongation and “compression”of prestressed tendons.At the beginning of the test, the elongation and “compression” of prestressed tendons was small, and the anchors were not loosened, so that the stretching value of prestressed tendons returned to the initial point when the SCRW was returned to its original position, where the prestress was equal to its initial value without loss.However, in the later stage of the test, the anchors loosened and slipped due to the repeated stretching and compression of the prestressed tendons.Therefore, the prestressed tendons could no longer return to their original stretching length when the SCRW returned to its original point.Thus, the prestresses were lost, and the amount of loss became larger as the displacements increased.

Fig.23 Schematic for calculation of equivalent viscous damping ratio
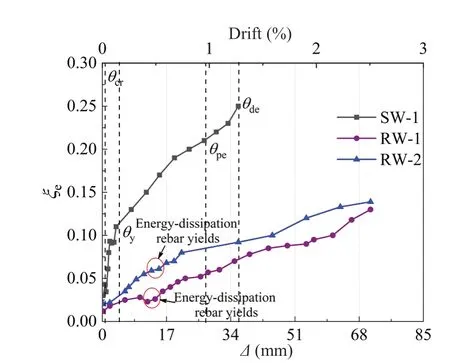
Fig.24 Equivalent damping ratios of all specimens
The left prestressed tendon with lower initial prestress was decayed in the seventh loop, while the right prestressed tendon with higher initial prestress was decayed around the twelfth loop when comparing the left and right prestressed tendons of RW-1, as shown in Figs.25(b) and 25(d).In addition, the prestress loss of the left prestressed tendon was significantly larger than that of the right prestressed tendon.After the test,the prestress loss of the left tendon reached 39% of the initial prestress, while the right prestress loss was only 19.8% of the initial prestress.Comparing the left and right prestressed tendons of RW-2, as shown in Fig.26,the left prestressed tendon decayed in the twelfth circle,while the right prestressed tendon began to decay around the fourth circle.After the test, the prestress loss of the left prestressed tendon reached 29.3% of the initial prestress, and the right prestress loss was 49% of the initial prestress.It can be concluded that the larger initial prestress can not only reduce the prestress loss, but also delay the time of prestress loss.
The drift limit corresponding to the seismic fortification target was added in Figs.25(c) and 25(d),Figs.26(c) and 26(d).The prestress loss of specimen RW-1 within the drift limit corresponding to minor and moderate earthquakes were both 0 without prestress loss.But the prestress loss of the left tendon within the drift limit corresponding to major earthquakes was within 20%, and the right one with larger initial prestress was only 7%.Comparing specimen RW-2, the prestress loss of the left and right prestressed tendons within the corresponding drift limit under minor earthquakes is 0 without prestress loss.The prestress loss of the left prestressed tendon within the drift limit corresponding to moderate earthquakes was 1.88%, but the loss of the right one was 23%.The prestress loss within the corresponding drift limit under major earthquakes was within 20% on the left side and 41% on the right side.The reason for the sharp increase in the loss of the prestress on the right side may be that the anchor was very loose at the beginning of the test and could not anchor the prestress, resulting in a large loss of the prestress, which was a test error.As a result, designing a resilient anchorage to anchor the prestress is one of the major difficulties in seismic engineering.
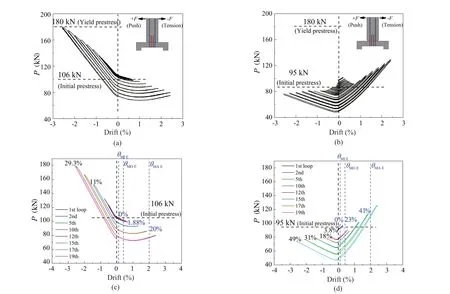
Fig.26 Changes of prestressing force in prestressed tendons of RW-2: (a) Hysteresis curve for the left prestressed tendon;(b) Hysteresis curve for the right prestressed tendon; (c) Typical hysteresis loop for the left prestressed tendon; (d) Typical hysteresis loop for the right prestressed tendon
From Figs.25 and 26, the prestressed tendons had different degrees of prestress loss.Through analysis, it is inferred that the main reasons for the loss of prestress are as follows.(1) There were contact gaps between the surfaces of concrete and prestressed tendons, the surfaces of the rocking wall and the foundation.The gaps were closed due to the repeated squeezing of the rocking walls during the loading process, and a small amount of compression deformation may also have occurred in the fiber mortar cushion, which may have caused the initial stretching value of the prestressed tendon to retract and led to prestress loss.(2) The deformation of the anchorage during the rocking process of the wall may have caused the anchorage to loosen and slip, causing the stretching of prestressed tendons to shorten, resulting in the loss of prestressing forces.
3.6 Analysis of curved interface
The bottom surface of the SCRW was designed as a curved interface to improve the rocking capacity and reduce the damage of concrete at two corners of the rocking wall due to the concentrated local excessive compressive stress.It is investigated whether the rocking center of the SCRW can be changed due to the existence of the curved interface during the rocking process, to obtain the effect of the curved interface on the SCRW.The bottom of the rocking wall would be separated from the foundation with opening and closing deformation during the rocking process.In the experiment, five displacement gauges at the joint between the rocking wall bottom and foundation were arranged to measure the opening and closing amount of the joint during the rocking process.The overlapping point of the five displacement gauges in different hysteresis loops was regarded as the rocking center.The readings of the displacement gauges under different hysteresis loops in the push and tension directions are shown in Figs.27 and 28; that is, the changes of the rocking center in the pushing and tensioning states.It is observed that the rocking center of the rocking wall moved alternately from the middle position to both sides during the rocking process.The rocking center in pushing state was changed from -0.04 m, which is the initial center of rocking, to-0.25 m, the final center of rocking.Meanwhile, the rocking center in the tension state was changed from 0.25 m, the initial center of rocking, to 0.34 m, the final center of rocking.The result shows that the existence of the curved interface could make the rocking center of the SCRW move outward, successfully preventing the phenomenon of the rocking center remaining unchanged during the rocking process and leading to the crush of concrete at the corners.
The following assumptions are made for the SCRW to obtain the theoretical value of rocking center.(1) The SCRW is simplified into a rigid body model, that is,the effect of energy dissipation and SC of the rocking wall due to concrete crushing and spalling is ignored.The schematic of the forces of the rigid model is shown in Fig.29.Meanwhile, the contact surface between the rocking wall bottom and the foundation is divided into two situations after simplifying to the rigid body model:fully contacted situation and rocking-point contacted one, which simplifies the nonlinear problem of the contact between the rocking wall and the foundation.(2)The prestressed tendons do not yield in the entire rocking process of the SCRW, that is, they are always maintained in an elastic state.The prestressed tendons only provide elastic restoring forces without any energy dissipation in the SCRW, and the constitutive relationship of the prestressed tendon is shown in Fig.30.(3) The energy dissipation rebars are considered as ideal elastoplastic materials, and the constitutive relationship is shown in Fig.31.(4) There is no sliding in the surface of the rocking wall and the foundation under the action of lateral interfacial shear force.
The center of the SCRW is taken as the origin.The direction to the right of the origin is regarded as positive,and the left is negative.The force equilibrium equations along two directions are shown in Eqs.(8) and (9).
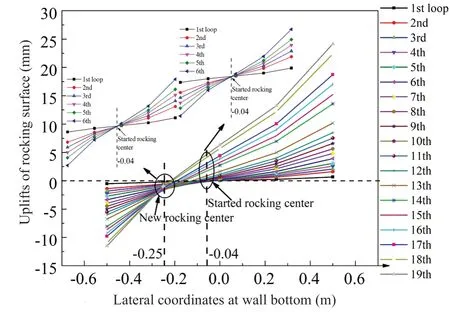
Fig.27 Rocking center position changes during pushing

Fig.28 Rocking center position changes during tensioning
whereNdenotes the axial force,Gdenotes gravity,Fp1andFp2denote the prestressing forces generated by the prestressed tendons,Fe1andFe2denote the tensile forces generated by the energy-dissipating reinforcements, andFNrepresents the reaction force of the ground to the wall.Meanwhile,Mdenotes the moment generated by each force in the system.
The moment equilibrium equations are formulated by taking the moment at point A, and the clockwise moment is regarded as negative and the counterclockwise is positive.As a result, the approximations of rocking center in push and tension are obtained, shown in Eqs.(10)and (11), respectively.
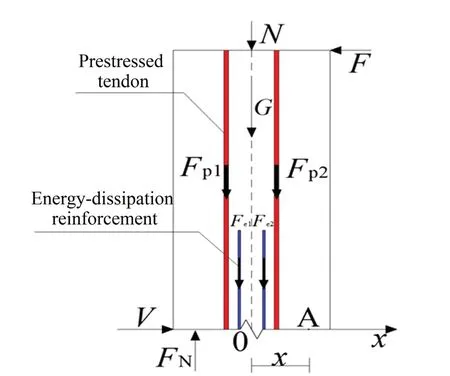
Fig.29 Schematic of forces of rocking wall
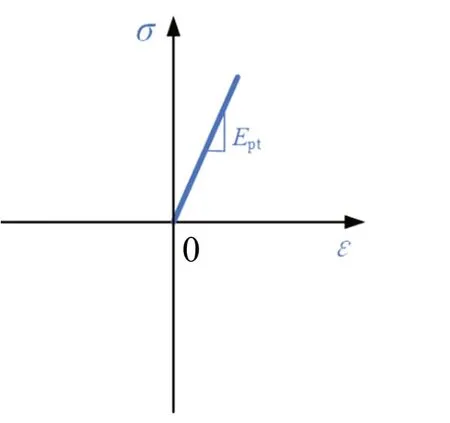
Fig.30 Constitutive relation of prestressed tendon
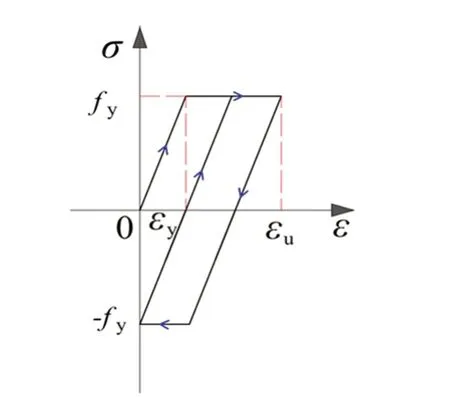
Fig.31 Constitutive relation of energy dissipation rebar
wherehdenotes the height of the RW,xedenotes the distance between the energy-consuming rebar and the center of the RW, andxpdenotes the distance between the prestressed tendon and the center of the RW.
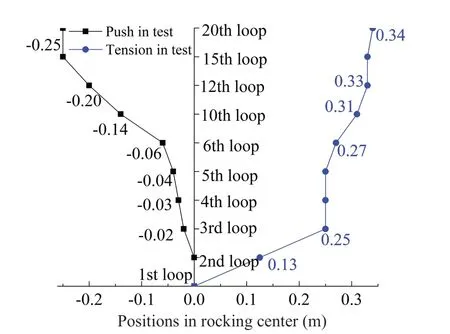
Fig.32 Rocking center position range
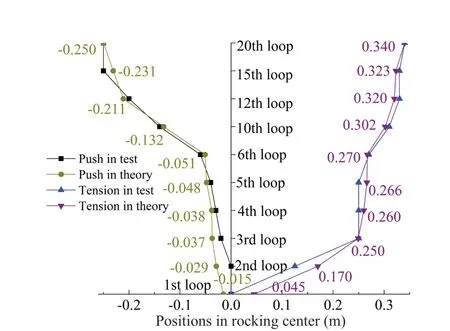
Fig.33 Rocking center position range of test and theoretical results
The coordinate positions of rocking center in different hysteresis loops for the test and the theoretical solutions are shown in Figs.32 and 33, respectively.The theoretical values of the rocking center are calculated from Eqs.(10) and (11).The theoretical solutions of the rocking center are in good agreement with the experimental values, but in the first few loops, when the rocking center is at the center of the wall, the theoretically obtained rocking center is closer to the two sides of the wall.This is because the actual friction in the early stage of the test is larger than the friction obtained from the theorical center of rocking; therefore, the rocking center obtained from the theoretical analysis does not match the test value well.
From the above curved interface analysis, the following conclusions can be made: (1) During the rocking process, the curves drawn by the five displacement gauges arranged at the bottom of the wall tend to be a straight line, indicating that the upper structure is equivalent to a rigid body during the rocking process, which is consistent with the assumption of plane cross-section.(2) The rocking process is linear, and the rocking center is constantly changing with the rocking process due to the existence of the curved interface.The estimated rocking center is listed in Eqs.(10) and (11),respectively.The rocking range is shown in Table 5, and the maximum rocking range is 41.4% of the wall width corresponding to the major earthquakes.
4 Finite element analysis
4.1 Finite element model verification
A numerical simulation analysis according to the interface of the proposed SCRWs is carried out based on ABAQUS software, aiming at further comparing the ERP of SCRWs with the right-angle interface and curved one and the change of stress concentration phenomenon at the wall corners.

Fig.34 FEM of SCRW

Table 5 Rocking center ranges in earthquakes
In the finite element model (FEM), shown in Fig.34,the damage constitutive relationship for concrete and the bilinear kinematic hardening constitutive relationship for rebar are used, which are suggested by the code in China.The C3D8R elements are adopted in the solid part of the model, and the truss elements are applied for the reinforcements and the prestressed tendons.The contact relationship between the conventional rebar and concrete was set as the embedded region, and the contact relationship between the prestressed tendon and concrete is handled as follows: two small sections of prestressed tendons are cut out at both ends of the wall with cutting tools, and these two small sections are also embedded in the anchorages at the upper and lower ends using the embedded region, while the middle prestressed tendons are not set in contact with the concrete, i.e.the middle unbonded prestressing tendons can slip freely with the concrete at will.The“cooling method” is used to apply prestressing forces in the prestressed tendons according to the principle of thermal expansion and contraction.The energyconsuming reinforcement is bound in a similar way to the prestressed tendons, while the anchorages at both ends of the energy-consuming reinforcement are like that of the prestressing tendons, and two small sections are cut out at both ends of the energy-consuming reinforcement and embedded in the wall and the anchorage at the top and bottom, respectively, by the embedded region.To maintain the reliability of the anchorage and to prevent the concrete from being too severely damaged by the concentrated force, the length of the anchorage section can be increased as necessary.For the section of energyconsuming reinforcement located in the foundation, no contact relationship with the concrete is set, i.e., the energy-consuming reinforcement in the foundation can slip freely with the concrete at will.Concrete is set as the concrete damaged plasticity.The contact surfaces of other components are set as hard contact in the normal direction, and the friction coefficient in the tangential direction.The specific friction coefficient is set according to the material properties of the contact surface.The settings such as loading and boundary conditions are the same as the test.
To verify the accuracy of the established FEM, a typical test result of the SCRW for case 2 (RW-2) was selected for comparison with the numerical simulation.The comparison for hysteresis curves of FEA simulation and experiment is shown in Fig.35.
From Fig.35, the general trends for both the hysteresis curves match very well.There is a “pinching phenomenon”, which comes from the relative slip between the contact surface and the lateral deformation of prestressed tendons during the loading.Moreover, the initial stiffness of the SCRW in the FEA result is little higher than the experimental one due to the ideal contact surfaces in the FEA on one hand, and the experimental contact surface with initial tiny defects on the other hand, causing the slip during the experimental loading process.In addition, the curves of the experimental result are relatively plumper, while the simulation curves have a better pinch effect.This is because the boundary conditions and the bolt pre-tightening force are ideal in the FEA.Since the numerical simulation and experimental results are in good agreement, and the general trends are basically the same, it can correctly reflect the resilience of the proposed SCRWs such as the horizontal bearing capacity, SC performance and energy dissipation capacity corresponding to the experimental conditions.
4.2 ERPs of SCRWs with the right-angle and curved interfaces
Steel plates are added at the bottom of the wall to keep the same condition for the FEA and experiment to obtain a reasonable comparison.After the comparison,the next parametric analysis is performed without steel plates at the bottom of the wall to investigate more clearly the effects of curved interfaces and right-angle interfaces on the stress and damage distribution at the bottom of the wall.
The comparison for hysteresis curves and SC coefficients of SCRWs with the right-angle interface and curved one are shown in Figs.36 and 37, respectively.The SC effect of the SCRW with curved interface is significantly improved, the residual displacement is almost zero, and the wall damage is greatly improved.It greatly improves both the SC performance and the seismic performance of the SCRWs.
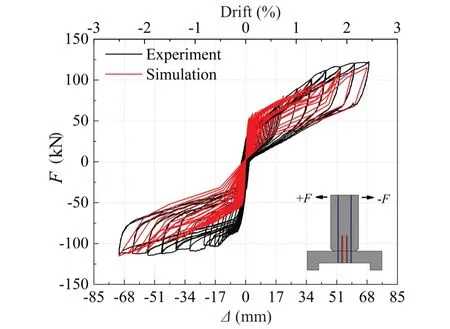
Fig.35 Comparison for hysteresis curves of FEA simulation and experiment
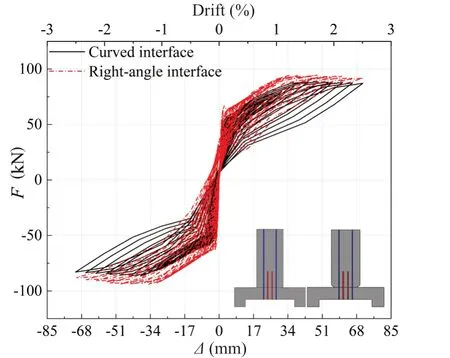
Fig.36 Comparison for hysteresis curves of SCRWs with the right-angle interface and curved one
The existence of the curved interface can effectively prevent the wall from being damaged.Therefore, the dissipation energy capacity can be slightly reduced due to the corresponding small damage-induced deformation;meanwhile, the stiffness degradation of the SCRW is slowed down to some extent, shown in Fig.38.
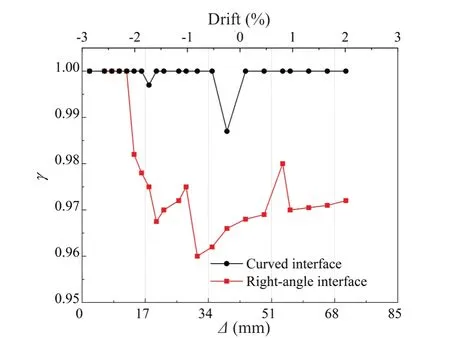
Fig.37 Comparison for SC coefficients of SCRWs with the right-angle interface and curved one

Fig.38 Comparison of the equivalent viscous damping coefficient of SCRWs with the right-angle interface and curved one
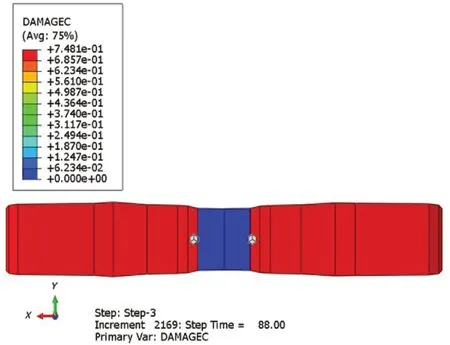
Fig.39 Cumulative compressive damage at the bottom of SCRWwith right-angle interface
The concrete cumulative compression damage at the bottoms of SCRWs with right-angle and curved surfaces as returning to the origin are shown in Figs.39 and 40,respectively.The existence of the curved interface reduces the concrete cumulative compression damage at the wall bottom, while the damage with the right-angle interface is relatively serious.
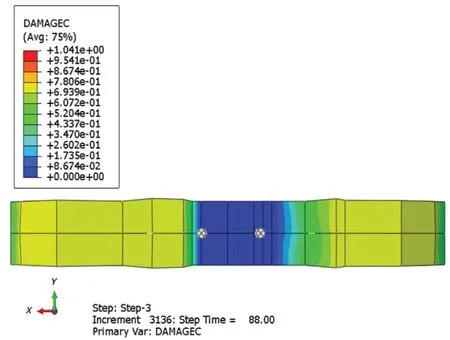
Fig.40 Cumulative compressive damage at the bottom of SCRW with curved interface
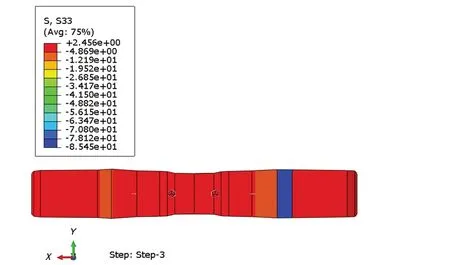
Fig.41 Stress in z-direction at the bottom of SCRW with rightangle interface
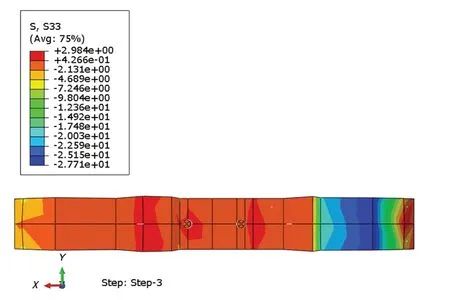
Fig.42 Stress distribution in z-direction at the bottom of SCRW with curved interface
The comparisons of the stress in theZ-direction at the bottom of the SCRWs with the right-angle interface and curved one are shown in Figs.41 and 42, respectively.The existence of the curved interface effectively releases the stress concentration phenomenon at the bottom of the wall, therefore, the stress distribution with a maximum compressive stress of 27.71 MPa on the curved interface is more uniform than that of 85.45 MPa on the rightangle interface.
5 Conclusions
(1) The deformation mode of the SCRWs under lateral pseudo-static loading can be described as the rigid body confining rotation caused by the joint opening and closing of the rocking wall and the foundation.The deformation mode makes the SCRW concentrate the nonlinear deformation at the joint between the rocking wall and the foundation, causing little damage to the rocking body.
(2) The hysteresis curves of the SCRW display the typical characteristic of “flag-shape” response.The residual drifts of the SCRW under the pseudostatic loading meet the limit of the four-level seismic fortification target, achieving the purpose of selfcentering.The SC ability of the SCRWs is mainly determined by prestressed tendons.The larger initial prestress can both reduce the prestress loss and delay the time of prestress loss.
(3) The hysteresis curves of the SCRW are not as plump as those of the monolithic shear wall.The energy dissipation of the SCRW is reduced due to the reduction of the energy dissipation rebars caused by the breathing effect of the rocking joint between the wall and foundation.As a result, the energy dissipation capacity of the SCRW is slightly smaller than that of the monolithic shear wall.However, the energy dissipation capacity has been greatly improved compared with the prestressed-only rocking wall.
(4) The deformation of the SCRW meets the assumption of the plane section.In the experiment, the existence of the curved interface can change the rocking center and prevent the concrete at the corners from damage since the rocking center remained changed under the rocking process and reduced the local compressive stress.
(5) The curved interface can reduce the damage at the bottom corners and in the wall body of the SCRW,enhancing the SC ability and seismic resistance.More importantly, the existence of the curved interface can reduce the accumulated compressive damage and stress concentration at the bottom of the wall, achieving the goal of damage-limiting design.
(6) The ERP of the SCRW is better than that of the monolithic shear wall, which has a potential application prospect in earthquake resilient structures.
Acknowledgement
Funding for this project, provided by the National Key Research and Development Program of China under Grant No.2018YFC0705602, is gratefully acknowledged.The assistance of the technical staffof the Department of Civil Engineering at Shenyang Jianzhu University, where the tests were performed, are duly acknowledged.The writers also want to acknowledge an anonymous reviewer for reading the study with interest and providing comments to enhance its quality.
 Earthquake Engineering and Engineering Vibration2024年1期
- Earthquake Engineering and Engineering Vibration的其它文章
- A novel mitigation measure for normal fault-induced deformations on pile-raft systems
- Time-domain dynamic constitutive model suitable for mucky soil site seismic response
- Finite element model updating for structural damage detection using transmissibility data
- Experimental study on seismic reinforcement of bridge foundation on silty clay landslide with inclined interlayer
- Liquefaction susceptibility and deformation characteristics of saturated coral sandy soils subjected to cyclic loadings - a critical review
- Longitudinal vibration characteristics of a tapered pipe pile considering the vertical support of surrounding soil and construction disturbance
