Pulses in ground motions identified through surface partial matching and their impact on seismic rocking consequence
Tang Yuchuan, Wang Jiankang and Wu Gang
1.School of Civil Engineering, Southeast University, Key Laboratory of Concrete and Prestressed Concrete Structures of the Ministry of Education, Nanjing 211102, China
2.National and Local Joint Engineering Research Center for Intelligent Construction and Maintenance, Nanjing 211102, China
Abstract: In seismology and earthquake engineering, it is fundamental to identify and characterize the pulse-like features in pulse-type ground motions.To capture the pulses that dominate structural responses, this study establishes congruence and shift relationships between response spectrum surfaces.A similarity search between spectrum surfaces, supplemented with a similarity search in time series, has been applied to characterize the pulse-like features in pulse-type ground motions.The identified pulses are tested in predicting the rocking consequences of slender rectangular blocks under the original ground motions.Generally, the prediction is promising for the majority of the ground motions where the dominant pulse is correctly identified.
Keywords: velocity pulse; ground motion; surface similarity; rocking; overturning
1 Introduction
Pulse-like features have been observed in certain recorded ground motions and attributed to seismological mechanisms such as forward directivity (Somervilleet al., 1997; Somerville, 2003).Many previous studies have revealed that pulse-type ground motions can impose substantial demands and thus have a destructive potential on engineering structures (Anderson and Bertero, 1987; Hallet al., 1995; Malhotra, 1999; Alavi and Krawinkler, 2004; Kalkan and Kunnath, 2006 among others).In both seismology and earthquake engineering,it is fundamental to identify the pulse-like features in ground motions, as seismologists relate the features to source parameters and source-to-site geometry while engineers relate them to the structural responses to the pulse-type ground motions.
Researchers have proposed different methods to identify the pulse-like feature in ground motions, mostly in the velocity time series.The methods can be mainly classified as time-frequency domain methods and response spectrum-based methods according to Zengin and Abrahamson (2020).One set of time-frequency domain methods are based on continuous wavelet transform or windowed Fourier transform of the ground velocity signal (Baker, 2007; Yaghmaei-Sabegh, 2010;Mena and Mai, 2011; Shahi and Baker, 2014; Ertuncay and Costa, 2019 among others).Another set of timefrequency domain methods utilize empirical/variational mode decomposition (Xu and Agrawal, 2010; Quaranta and Mollaioli, 2019; Zhanget al., 2003).More recently,Sharbatiet al.(2020) used an advanced signal processing method, the chirplet transform, to detect velocity pulses.One response spectrum-based method was developed by Tang and Zhang (2011) leveraging the congruence of bi-logarithmic response spectrum curves rooted in self-similarity.This method has been improved and automated in Tanget al.(2021).Mimoglouet al.(2014)proposed a method based on the features of the velocity and the displacement response spectra.In addition,Mukhopadhyay and Gupta (2013) and Zhaiet al.(2013)suggested a distinct type of methods that are based on the fractional energy contributions in the velocity time series.
Most of the existing methods for pulse identification extract the pulse as a distinctive signal from the ground motion through common signal processing techniques.The pure signal processing does not ensure the extraordinary impact of the pulse-type ground motion on structures is maintained by the identified signal.From the perspective of earthquake engineering, the pulselike feature in a ground motion is of significance only if it dominates certain structural response to the ground motion.To identify such pulse-like features, the current study enhances the pulse identification approach in Tanget al.(2021), which is anchored to a single value of the structural damping ratio, by simultaneously considering a range of damping ratio values.As such, the twodimensional (2-D) ΠPVresponse spectrum curve in Tanget al.(2021) is extended to a three-dimensional(3-D) ΠPVresponse spectrum surface.The congruence and shift relationships between the ΠPVand the pseudovelocity response spectrum curves shown in Tanget al.(2021) remain valid for the 3-D spectrum surfaces,which essentially consist of a collection of 2-D spectrum curves.A subregion-to-subregion similarity search between 3-D spectrum surfaces supplemented with a similarity search in the velocity time series achieves effective identification of the dominant pulse in a pulsetype ground motion.The developed program is applied to capture the velocity pulses of various waveforms in a large set of ground motion records.The identified pulses are compared with those reported in the literature for the same set of ground motions.
Seismic responses of structures free to rock at their foundations have attracted extensive research because of their unique self-centering, damage-free resilience under earthquakes as well as the challenges arising from the non-smooth nonlinear nature of rocking dynamics.Pulse-type excitation has been widely adopted in the studies on rocking since the pioneering work by Housner(1963).Pulse-type earthquake records which typically have high peak ground velocity and low-frequency content caused large rocking amplitudes, whereas non-pulse type records caused random rocking motion confined to small amplitudes (Acikgoz and DeJong,2014).Coherent velocity pulses were therefore identified as the primary cause of significant rocking motion(Acikgoz and DeJong, 2014; Dimitrakopoulos and Fung, 2016).As such, the pulses identified in the current study are tested to predict the rocking consequences under the original pulse-type ground motions.In order to cover a wide range of significant parameters and their variations, the prediction on overturning is formulated in a dimensionless framework given the self-similarity of dimensionless rocking response as demonstrated by Dimitrakopoulos and DeJong (2012).Finally, the feasibility of the prediction is evaluated by comparing the prediction outcomes with the rocking consequences under the original ground motions.
2 The ΠPV spectrum surface and the associated congruence and shift relationships
When considering a velocity pulse as base excitation to a structure, the velocity time series can be generally expressed asvp·w(t Tp), whereTp(> 0) andvpdenote the pulse period and the pulse amplitude, respectively,and the unit-amplitude functionw(·) defines the pulse waveform.Subjected to the velocity pulse, a singledegree-of-freedom linear structure has the equation of motion (Tanget al., 2021)
Given a specific continuous pulse waveformw(·),Eq.(1) is completely determined by the four independent parameters,sω,sξ,pT, andpv.According to the theory of ordinary differential equations, a unique solution ofA(t) with initial conditions,A( 0) = 0 andA˙( 0) =0,exists when the values ofsω,sξ,pT, andpvare given.Consequently, the maximum relative displacement of the structure
solely depends on the four parameters and conceptually can be expressed as a function of them as
The absolute value ofvpis used because the sign reversal of the pulse amplitude does not changeumax.Furthermore, the peak pseudo-velocity response,of the structure is another function of those four parameters:

Knowing the structural periodTs= 2πωs, the term ΠTis equal toTsTpand thus represents the ratio of the structural periodsTto the pulse periodpT.
Equation (5) indicates that the dimensionless peak pseudo-velocity of the structure, ΠPV, varies along with the structure-to-pulse period ratio ΠT, for a given structural damping ratio Πξ.This kind of relationship is analogous to the response spectrum of a specific ground motion record and has been called Π-response spectrum(Tang and Zhang, 2011; Tanget al., 2021).At every value of the damping ratio, the Π-response spectrum is unique for a specific input velocity pulse waveformw(·).It has been demonstrated in Tanget al.(2021) that the ΠPVresponse spectrum (Eq.(5)) associated with a velocity pulse waveformw(·) has identical shape, in bilogarithmic plot, as the pseudo-velocity (PV) response spectrum of a ground motion whose impulsive velocity trace is scaled from the waveformIn addition, the pulse parameterspTandvpcorrespond to the horizontal and the vertical shifts, respectively,between the two congruent spectrum curves in bilogarithmic plot as indicated by
This equation is derived by converting Eq.(5) into bilogarithmic scale and then substituting in the expressions of the Π-terms.Adopting identical units, cm/s, forPVandvp, as well as sec forTsandTp, the logarithmic values in Eq.(6) are treated as dimensionless.The common logarithm to the base 10 is adopted throughout this study.
The congruence and the shift relationships discussed above hold for any damping ratio between 0 and 1.Moreover, the horizontal shift amount logTpand the vertical shift amountboth remain constant disregarding the variation in the damping ratio.An example is shown in Fig.1 with the Mavroeidis and Papageorgiou (2003) (M&P) pulse waveform withγ= 3,v= 0.In Fig.1(b), each ΠPVspectrum and the correspondingPVspectrum exhibit congruence for various damping ratio values.The horizontal and vertical shifts between each congruent pair reflect the pulse parameters and keep constant across various damping ratios.Treating the damping ratio as a continuous variable as it actually is, the mapping in Eq.(5) can be presented as a 3-D ΠPVspectrum surface in Fig.1(c)that covers a range of damping ratio values.The same is done for thePVspectrum.Given the congruence at every individual damping ratio value, the continuous ΠPVspectrum surface should be congruent to thePVspectrum surface as illustrated in Fig.1(c).The shift relationship shown in Fig.1(b) retains the same between the two congruent surfaces in Fig.1(c).
3 Pulse identification based on similarity matching between spectrum surfaces
The previous studies in Tang and Zhang (2011) and Tanget al.(2021) took advantage of the congruence and the shift relationships between Π spectrum andPVspectrum curves to identify pulse-like features in ground motions.These studies relied on the spectrum curves at a particular value of the damping ratio.Given the congruence and the shift relationships between the spectrum surfaces as demonstrated in the previous section,a new method based on spectrum surfaces is proposed herein for pulse identification in ground motions.The new method and the previous method based on spectrum curves would be equivalent if the ground motion velocity time series had identical waveform as a candidate pulse type.Figure 1 shows such an ideal case.In reality, the pulse-like features in near-fault ground motions can only be approximated by the idealized pulse waveforms(see Fig.2 for examples).As such, only a portion of thePVresponse spectrum of the impulsive ground motion exhibits similarity, not congruence, to a segment of the ΠPVspectrum of an idealized pulse waveform (Tanget al., 2021).Accordingly, the new method for pulse identification has several advantages over the previous method: (1) 3-D spectrum surfaces radically enrich the geometric characteristics for similarity search in comparison with 2-D spectrum curves; (2) efficient algorithms exist to detect subregion-to-subregion (subto-sub) similarity between surfaces at certain distance;and (3) a similarity match between spectrum surfaces leads to more accurate identification of the pulse feature that dominates the structural responses not only over a range of structural period but also through a range of structural damping.The new pulse identification method based on similarity matching between spectrum surfaces is introduced in the following subsections.

Fig.1 (a) M&P pulse waveform with γ = 3, ν = 0; (b) ΠPV spectra (black curves) of the waveform in (a) and PV spectra(blue dotted curves) of a velocity time seriesscaled from the waveform with Tp = 4 s, vp = 2.5 cm/sfor damping ratios 1%, 5%, 10%, 15%, and 20%; (c) ΠPV spectrum surface (lower left) of the waveform in (a) and PV spectrum surface (upper right) of a velocity time series scaled from the waveform with Tp = 4 s, vp = 2.5 cm/s
3.1TheΠPVspectrum surfaces of candidate pulse waveforms
The current study selects six distinct pulse waveforms(see Fig.2) as candidates for pulse identification in ground motions.These waveforms are widely used in literature (Mavroeidis and Papageorgiou, 2003; Shahi and Baker, 2014; Yaghmaei-Sabegh, 2010) to mimic the pulse-like features in near-fault ground motions.The ΠPVspectrum surface of each candidate pulse waveform is generated numerically according to Eq.(5).The damping ratio range considered in the current study is 5% to 20% at intervals of 1%, which covers most civil engineering structures including the base-isolated ones and those equipped with energy dissipation devices.The velocity-amplified region of the ΠPVspectrum surface, where ΠPV> 1, is sufficient for velocity pulse identification as revealed in Tanget al.(2021).The generated ΠPVspectrum surfaces of the candidate waveforms are presented in Fig.3.
3.2 Subregion-to-subregion similarity matching between spectrum surfaces
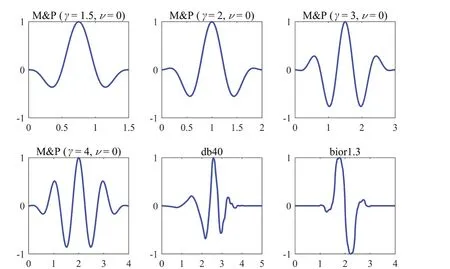
Fig.2 Idealized pulse waveforms adopted in the current study: M&P pulses with ν = 0 and γ = 1.5 (upper left), 2 (upper middle),3 (upper right), 4 (lower left); Daubechies wavelet db40 (lower middle); BiorSpline wavelet bior1.3 (lower right)

Fig.3 The ΠPV spectrum surfaces associated with the pulse waveforms in Fig.2
A fault-normal velocity pulse in the ground motion at Station TCU103, rotated to the azimuth 75°, from the 1999 Chi-Chi earthquake (i.e., RSN 1530 in the Next Generation Attenuation (NGA)-West2 ground motion database (PEER, 2013)) has been reported in Shahi and Baker (2013).ThePVspectrum surface of this ground motion record is computed numerically at a grid with uniform intervals of 0.01 in both logTsand sξcoordinates.When velocity pulses with amplitudeare of interest, only the broadened velocity-amplified region of thePVsurface above 0.6PGVis needed for investigation (Tanget al., 2021).ThePVsurface above 0.6PGVis plotted in a yellow-red color scheme in Fig.4 with the logPVdata stored in a 16×133 matrixD.
The ΠPVspectrum surface of the M&P waveform withγ= 3 andv= 0 is added into Fig.4 as the blue surface.The surface is also computed numerically at uniform grid with 0.01 intervals, and the logΠPVdata are stored in a 16×50 matrixS.
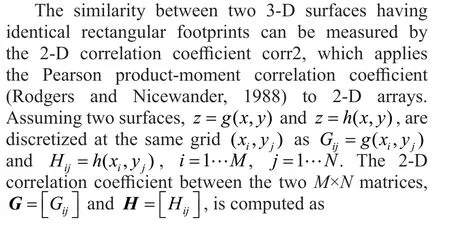

Fig.4 Shifting, clipping, and similarity matching of ΠPV spectrum surface of M&P pulse waveform (γ = 3,ν = 0) with respect to PV spectrum surface of RSN 1530 record in azimuth 75°
The built-in functionfindsignalin MATLAB®software is an easy tool for similarity search.It sweeps a “signal”, stored in vector or matrix, across a longer“data”, stored in the same form as the “signal”, to locate the best match of the “signal” onto the “data” by minimizing the specified distance metric between them.MATLAB®provides four options for the distance metric in the built-infindsignalfunction, namely the L1 metric,the L2 metric, the square of the L2 metric, and the symmetric Kullback-Leibler metric.All four metrics,however, depend on the actual distance from the “signal”to the “data” and consequently are not applicable in a similarity search between subregions of two surfaces at an indeterminate distance.To work around it, the originalfindsignalfunction is modified to compute corr2 as a nominal distance metric and to locate the best similarity match by maximizing corr2 when sweeping the “signal”across the “data”.The new MATLAB function is namedfindsignal_SEU.
A preliminary sub-to-sub similarity match between thePVand the ΠPVsurfaces in Fig.4 is located by runningfindsignal_SEUwith the matricesDandSas“data” and “signal”, respectively.Accordingly, the ΠPVsurface is translated to right below the subregion of thePVsurface to which the ΠPVsurface is similar.The translated ΠPVsurface is depicted in green in Fig.4.This preliminary match has corr2 value of 0.9545.The translation of the ΠPVsurface can also be observed in Fig.5, which shows the cross sections of Fig.4 at the damping ratios 5%, 10%, 15%, and 20%.
Starting from the preliminary match, the ΠPVsurface is successively clipped and re-matched to thePVsurface.At each step, clip either the edge at lower ΠT(i.e., the left edge) of the remaining ΠPVsurface or its edge at larger ΠT(i.e., the right edge) depending on which better enhances the similarity match (i.e., larger increase in corr2).Following each clipping, the similarity match between the remaining ΠPVsurface and thePVsurface is re-located viafindsignal_SEU.For the sake of efficiency,the re-matching searches for similarity only within a“window” around the preliminary match as indicated by the grey band in each subplot in Fig.5.The clipping is limited so that at least one quarter of the original ΠPVsurface around its ridge should remain, which bears the most distinguishable features of the individual surfaces in Fig.3.The clipping and re-matching process is carried on until either the similarity measured by corr2 ceases to improve or the clipping reaches the limit.For the case shown in Figs.4 and 5, the sub-to-sub similarity match keeps improving along the twenty-seven runs of clipping and re-matching as demonstrated in Fig.6.The corr2 value reaches 0.9957, very close to 1.The final clipped ΠPVsurface is shown in magenta in Figs.4 and 5 right below its matched subregion of thePVsurface.Accordingly, the final horizontal shift log7.94 from the original ΠPVsurface indicates a pulse periodTp= 7.94 s referring to Eq.(6).
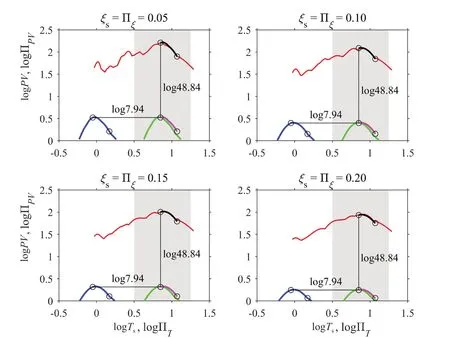
Fig.5 Cross sections of spectrum surfaces (red-PV surface of RSN 1530, blue-original ΠPV surface, green-shifted ΠPV surface according to preliminary match, magenta-clipped and re-matched ΠPV surface reaching the highest corr2, black-shifted subregion of ΠPV surface according to final match) at damping ratios 5%, 10%, 15%, and 20%
The final clipped ΠPVsurface can be overlaid onto its matched subregion of thePVsurface through a vertical shift of log48.84 as shown in Figs.4 and 5.The shift amount is determined such that the two overlaid subregions have identical mean values in the vertical coordinate.It can be shown that this position minimizes the Euclidean distance between the two overlaid subregions.This vertical shift indicates a pulse amplitude |vp| = 48.84 cm/s according to Eq.(6), which is about 0.73PGV.
3.3 Similarity matching in velocity time series
The sub-to-sub similarity matching in Section 3.2 indicates that the rotated RSN 1530 record potentially contains a pulse-like feature that can be well depicted with a velocity pulse having a period ofTp= 7.94 s and amplitude |vp| = 48.84 cm/s in the M&P waveform withγ= 3 andv= 0.This can be easily verified with the built-in functionfindsignalin MATLAB®with the velocity time series of the RSN 1530 record input as“data” and the time series of the idealized velocity pulse as “signal”.It is necessary to consider two alternatives,vp=±48.84 cm/s, since both result in an identicalPVspectrum surface.Finally, the similarity search in the time series yields the match of the M&P pulse withvp= -48.84 cm/s onto the RSN 1530 record as shown in Fig.7.The pulse identified in the current study resembles the impulsive feature of the ground motion and is comparable to the pulse identified in Shahi and Baker (2014).

Fig.6 Increment of corr2 value along clipping and re-matching process
The pulse identification approach proposed in the current study accepts various idealized waveforms, such as those shown in Fig.2, as candidates to be tested for resembling the pulse-like feature in a ground velocity trace.Given the irregularity of realistic ground motion records, it is possible that more than one waveform can delineate the pulse-like feature in a ground velocity trace.The candidate that leads to the smallest error to match the pulse-like feature is usually preferred.Exact match in time series is not the essential objective of pulse identification since the original pulse-like feature itself appears in the time frame of the reasonably identified pulse.Identifying the scaling factors,Tpandvp, is of greater significance for investigating the effects of pulse-type ground motions on engineering structures as demonstrated in Section 4.
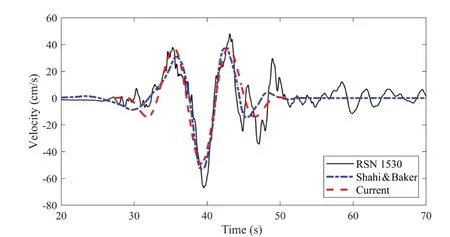
Fig.7 Velocity time series of RSN 1530 record in azimuth 75°and the identified velocity pulses
3.4 Multiple similarity matches between spectrum surfaces
It is possible to find multiple matches when screening the similarity between the ΠPVspectrum surface of one pulse waveform and thePVspectrum surface of a ground motion.An example is the ground motion recorded at Station HORC, rotated to the azimuth 16°, from the 2010 Darfield, New Zealand earthquake (i.e., RSN 6911 in the NGA-West2 ground motion database).When seeking the M&P pulse withγ= 1.5 andv= 0 in this ground motion, a sub-to-sub similarity search between spectrum surfaces results in two possible matches as shown in Fig.8.
Each of the two matches shown in Fig.8 leads to a pulse candidate in the M&P waveform (γ= 1.5,v= 0)being identified in the velocity time series of the RSN 6911 record.The match in Fig.8(a) leads to the velocity pulse denoted as “Current-1” in Fig.9, and the match in Fig.8(b) leads to the pulse “Current-2” in Fig.9.The former captures a sharp and evident velocity pulse between 19.5 s and 23.4 s, while the latter resembles the overall trend of the velocity trace between 19.1 s and 31.3 s.Note that in Fig.9, the pulse “Current-2” is close to the pulse identified by Shahi and Baker (2013) for RSN 6911.Between the two candidates, the one having amplitude closer toPGVis adopted in the current study,although it is realized that they dominate the responses of structures in different ranges as indicated by Fig.8.
3.5 Comparison with the velocity pulses reported in literature
The pulse identification approach proposed above is summarized in a flowchart shown in Fig.10.The highlighted blocks in the flowchart indicate the improvements to the previous approach in Tanget al.(2021).The three blocks highlighted with green background incorporate the 3-DPVresponse spectrum surface of the ground motion and the 3-D ΠPVspectrum surface associated with each candidate waveform, both of which cover a range of damping ratios in contrast to the 2-D spectrum curves at a single damping ratio in Tanget al.(2021).The five blocks highlighted with a yellow background leverage the subregion-to-subregion similarity matching between 3-D surfaces, which radically simplify the subsequence-to-subsequence similarity search scheme for 2-D curves in Tanget al.(2021).
The current approach is applied to identify velocity pulses in recorded strong ground motions.The electronic supplement to Shahi and Baker (2014) provides a list of 243 pulse-type ground motion records in the NGA-West2 database along with the pulse parameters identified through wavelet analysis.Except for seven out of the 243 records being inaccessible, the other 236 records were downloaded from the NGA-West2 database for pulse identification in the current study.For each record,the horizontal ground motion is rotated to the orientation of the strongest observed pulse as identified by Shahi and Baker (2014).

Fig.8 Sub-to-sub similarity matches between PV surface of RSN 6911 and ΠPV surface of M&P waveform with γ = 1.5, ν = 0:(a) the first match corresponding to Tp1 = 2.57 s and |vp1| = 94.83 cm/s, (b) the second match corresponding to Tp2 = 8.13 s and |vp2| = 56.73 cm/s
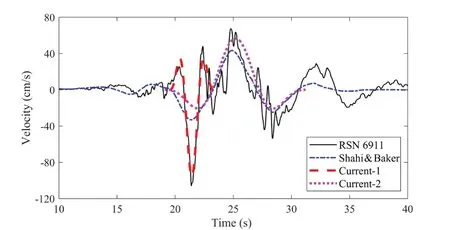
Fig.9 Velocity time series of RSN 6911 record in azimuth 16°and the identified velocity pulses
Our identification results are compared in Fig.11(a)with those identified through wavelet analysis by Shahi and Baker (2014) for the 236 ground motion records.Each marker corresponds to one of the records.The marker symbol indicates the pulse waveform identified in the current study, namely asterisk for db40 waveform,crossing for bior1.3 waveform, circle, square, triangle,and diamond for the M&P waveforms withv= 0 andγ=1.5, 2, 3, 4, respectively.In total, there are 36 asterisks,57 crossings, 54 circles, 38 squares, 38 triangles, and 13 diamonds.The color of each marker represents the difference in pulse amplitude relative to Shahi and Baker’s result, which is obtained by the authors from running the open-source scripts by Shahi and Baker(2013).The background dash lines in descending order of slope, respectively, indicate +20%, -20%, -40%,-60%, and -80% differences relative to the pulse period identified by Shahi and Baker.The relative differences in the pulse parameters are bounded within ±30% for majority (83%) of the records.There are only 13 records for which the relative differences in pulse period and amplitude both exceed ±30%.Three out of the 13 records are shown in Fig.11(c) as examples.
The pulses identified in the current study are also compared in Fig.11(b) with those from Tanget al.(2021) for the same set of 236 ground motion records and using the same suite of candidate waveforms.It is observed that the identified pulse period and amplitude have minimal changes (i.e., within ±30%) for 217 out of the 236 records, although the pulse waveform changes for 137 out of the 236 records.Only three records, as shown in Fig.11(c), have the changes in pulse period and amplitude both beyond ±30%.
Given the complexity and sometimes ambiguity in the pulse features of ground motions, different pulse identification algorithms can result in inconsistent velocity pulses for the same record (Zhaiet al., 2013).However, the records for which the relative differences in pulse period and amplitude both exceed ±30% are carefully examined.It is found out that our new method in the current study tends to capture the sharp pulselike feature with amplitude close toPGVrather than the lower-amplitude wave-like trend of the velocity trace if both exist, as the cases shown in Fig.11(c).
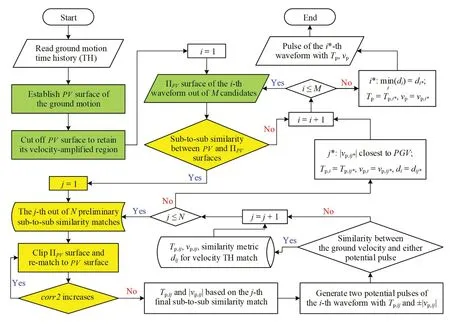
Fig.10 Procedure of the pulse identification approach proposed in the current study

Fig.11 Comparison of the velocity pulses identified in the current study with those in literature: (a) overview of the comparison with Shahi and Baker (2014); (b) overview of the comparison with Tang et al.(2021); (c) representative examples of significant difference
4 Predicting overturning of rocking blocks with pulses
Our approach to identify pulses in earthquake records, especially in near-fault ground motions, aims to capture the pulses that dominate certain structural responses to the ground motions.One challenging test on the pulses identified in the current study is to examine their capability to predict the overturning or safety of rocking blocks subjected to the original ground motions, given the well-known non-smooth nonlinear nature of the rocking response (Liuet al., 2021).Only the M&P pulses identified in Section 3 and their associated earthquake records are taken into account in the subsequent rocking analyses.The velocity pulses in the waveform of db40 or bior1.3 do not have analytical expressions for their acceleration time series, which is required in rocking analysis.Numerical differentiation of velocity for acceleration is not adopted, considering its error may disturb the already sensitive rocking analysis.
4.1 Self-similarity of rocking response to pulse-type base excitation
Seismic behaviors of free-standing rigid objects,such as a variety of industrial equipment and building contents, can be modeled as rocking of rigid blocks under the earthquake shaking.A widely investigated case is the rocking motion, without sliding or bouncing,of a planar rectangular rigid block on rigid base (see Fig.12).A complete statement of this problem along with the fundamental theoretical derivations are provided in Housner (1963) and Yimet al.(1980).
The equation of motion for the rocking block shown in Fig.12 subjected to horizontal ground accelerationu˙˙g(t) is given in a compact form in Makris and Roussos(2000) as
whereθ=θ(t) is the rocking angle of the block with respect to its static equilibrium position (positive for clockwise rotation and vice versa),αis the angle of slenderness which is the acute angle between either vertical side and either diagonal of the block,pis the frequency parameter of the block and equal tofor a rectangular block with a diagonal length of 2R, and sgn(·) is the signum function.In addition, the angular velocityθ˙ is reduced by the coefficient of restitutionηupon every impact during rocking (Yimet al., 1980).

Fig.12 Schematic of free-standing planar rectangular rigid block and its rocking on rigid base
For tall, slender blocks, the angleαis relatively small, and Eq.(8) can be linearized to be (Hogan, 1989;Zhang and Makris, 2001):
Normalizing the rotation angle byαleads to

To be consistent with existing work in the literature where the circular frequency of the pulse,is often used, Eq.(11) is reformulated as
This equation indicates that the normalized rocking responseϑ(τ) depends on the factors,ωppandωpvp(αg), given a fixed value forηand a specific waveformw(τ).
Based on the dimensional analysis supplemented with orientational analysis by Dimitrakopoulos and DeJong (2012), it is inferred that the dimensionless rocking response governed by Eq.(12), under fixedηandw(τ), exhibits self-similarity and is completely determined by the frequency ratioωppand the dimensionless-orientationless slendernessAs such, the self-similar rocking response can be expressed as a dimensionless functionφ(·) in the form of
Dimitrakopoulos and DeJong (2012) also showed that the rocking response is practically self-similar even for non-slender blocks (i.e., largerα).In addition,the overturning criteria such asin the free rocking stage following the excitation can also be converted to be in terms ofϑand sgn( )ϑ′.Therefore,self-similar overturning spectrum can be established in the control space withωppandas coordinates, given a specific pulse waveform and anη-value.The overturning spectrum shows the rocking consequence (i.e., whether overturning or not) at any point in the control space.Self-similarity guarantees that the spectrum is unchanging when the scaling factors of the pulse,pωandpv, vary.
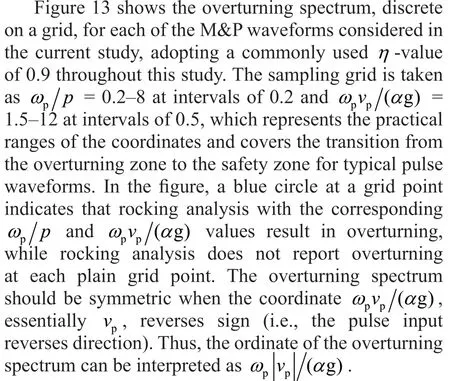
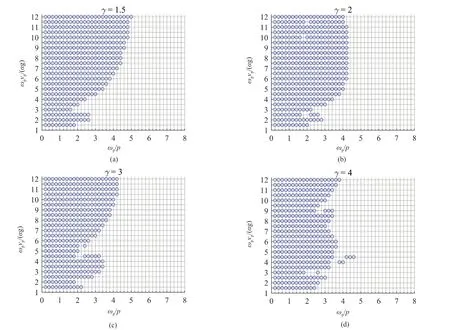
Fig.13 Overturning spectra for M&P pulse waveforms with ν = 0 and different γ-values: (a) γ = 1.5; (b) γ = 2; (c) γ = 3; (d) γ = 4
4.2 Prediction of overturning or safety with pulses identified in ground motions
As shown in Fig.7, a velocity pulse withTp= 7.94 s(i.e.,ωp= 0.79 rad/s) andvp= -48.84 cm/s in the M&P waveform (γ= 3,v= 0) has been identified in RSN 1530 in azimuth 75°.Rocking response to the RSN 1530 ground motion can be solved from Eq.(8) (nonlinear, NL) or from Eq.(9) (linearized, L) numerically for given values ofωppandωpvp(αg).Two cases corresponding toωpp= 3,4 andωpvp(αg)= -3 are displayed in Figs.14(a) and 14(b), respectively.It is observed that the solutions from Eqs.(8) and (9) are close to each other given the small slenderness angle encountered.For comparison, the rocking responses to the identified pulse in RSN 1530 are solved from Eq.(9) and also plotted in Fig.14, where the gray band in each plot indicates the time window of the pulse.The response to the identified pulse well matches that to the original ground motion and thus correctly predicts the overturning in Fig.14(a)and the safety in Fig.14(b).
The agreement in Fig.14 suggests the potential to predict the threat of a pulse-type ground motion on rocking blocks with the energetic pulse identified in that ground motion, which is in line with Acikgoz and DeJong(2014).This potential is of great significance since the rocking behaviors under a variety of idealized pulses have been extensively investigated and the associated overturning spectra are established (Zhang and Makris,2001; Makris and Vassiliou, 2012; Dimitrakopoulos and Fung, 2016).If the potential is confirmed, then the existing self-similar overturning spectra can be applied to estimate the rocking consequences under pulse-type ground motions, provided the pulse waveform and parameters are correctly identified.To this end, it is necessary to compare the rocking consequences between RSN 1530 and its identified pulse in a wide range ofωppandωpvp(αg).
The rocking consequence is evaluated for RSN 1530 on the same sampling grid as Fig.13, with theωpand |vp|values identified in Section 3.3.The consequence under RSN 1530 at each grid point is obtained from numerical analysis with Eq.(8) and marked as red crossing in Fig.15 for overturning.This figure is overlaid by the overturning spectrum associated with the waveform of the pulse identified in RSN 1530, which is identical to Fig.13(c).Overturning is not reported at the grid points without crossing marker under the excitation of RSN 1530.

Fig.14 Rockingtimehistory under RSN1530 versus that under the identified pulse: (a) ωp/p = 3 and ωpvp/(αg) = -3; (b) ωp/p = 4 and ωpvp/(αg)= -3

Fig.15 Overturning cases under RSN1530 overlain by the overturning spectrum associated with the M&P waveform with γ = 3 and ν = 0
Figure 15 shows that using the overturning spectrum of the pulse can reasonably predict the overturning caused by RSN 1530 (true positive,TP) atωpp≤ 2.2 as well as predict the safety under RSN 1530 (true negative,TN) atωpp≥ 4.4.In the middle range ofωpp, there exist mis-prediction of overturning (false positive,FP)and mis-prediction of safety (false negative,FN).The counts ofTP,FP, andFNare obtained over the entire sampling grid and used to compute the so-calledF1score in statistics as:
TheF1score is widely used to measure the accuracy of a binary classification test such as certain machine learning models.F1score varies between 0 and 1.The higher the score the more trustworthy the prediction model is.Based on the results shown in Fig.15, the numbers of counts forTP,TN,FP, andFNare 289,492, 71, and 28, respectively.Thus, theF1score for predicting the rocking consequence of RSN 1530 with the overturning spectrum of the M&P pulse is calculated as 0.854.
The above assessment procedure is also applied to each of the other 142 ground motion records, from which M&P pulses have been identified in Section 3.5.The rocking consequences under each ground motion are solved from Eq.(8) and compared with the corresponding overturning spectrum in Fig.13.Accordingly, theF1score is computed to measure the accuracy of using the overturning spectrum to predict the rocking consequences under the original ground motion.The direct use of the overturning spectrum obtained from linearized rocking analyses is backed by the fact that the slenderness angles encountered in this study do not exceed 30°.The normalized histograms of the computedF1scores by pulse waveform are presented in Fig.16.It is noticed from Fig.16(c) that theF1score of 0.854 for the RSN 1530 obtained above is approximately at the 40-th percentile level among the 38 cases of M&P pulses withγ= 3 andv= 0.Generally speaking, the prediction is promising for the ground motions in which M&P pulses withγ= 1.5, 2, or 3 are identified in Section 3.Among the 13 ground motion records in which M&P pulses withγ= 4 are identified in Section 3, the prediction reaches aF1score greater than 0.85 for eight records.
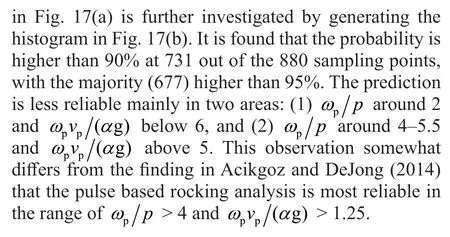
Based on the assessment for all 143 ground motion records, Fig.17(a) presents a map showing the success probability of predicting the rocking consequence (i.e.,overturning or not) under a pulse-type ground motion using the overturning spectrum of the M&P pulse identified in that ground motion.The probability is computed at each sampling grid point in theωppandcoordinates through dividing the number of ground motion records for which the prediction is correct by the total number of the records, 143.The success probability values at the 880 sampling points shown

Fig.16 Histogram of F1 scores for: (a) 54 records containing M&P pulse with γ = 1.5 and ν = 0; (b) 38 records containing M&P pulse with γ = 2 and ν = 0; (c) 38 records containing M&P pulse with γ = 3 and ν = 0; (d) 13 records containing M&P pulse with γ = 4 and ν = 0
4.3 Impact of pulse identification on prediction of seismic overturning
It is observed that the seismic rocking consequence,in the scope of the current study, is usually dominated by the coherent velocity pulse in the ground motion disregarding the high-frequency acceleration spikes.One example is the ground motion record RSN 1550 in the NGA-West2 database (i.e., the record at Station TCU136 in the 1999 Chi-Chi earthquake) rotated to azimuth 49°.For this record, the pulse identification in Section 3 captured a coherent velocity pulse withTp=7.59 s, |vp| = 59.84 cm/s in the M&P waveform (γ= 2,v= 0).Figure 18(a) shows the time series of the original ground motion and the identified pulse.Obviously,the coherent pulse dominates the velocity time series,while there are high-frequency fluctuations overriding the pulse in the acceleration time series.The pulse does not concur with the peak ground acceleration around 50 s, although it well captures thePGVaround 40 s.The identified pulse does predict the rocking consequences under RSN 1550 reasonably well with a highF1score of 0.948 as demonstrated in Fig.18(b).
Further attention is given to RSN 6911, for which two pulse candidates in the M&P waveform (γ= 1.5,v= 0) were identified in Fig.9.Using the parameters of the shorter pulse,Tp1= 2.57 s and |vp1| = 94.83 cm/s,for the dimensionless coordinates, the overturning cases under the original ground motion are marked as red crossings in Fig.19(a).There are a number of seismic overturning cases not predicted by the overturning spectrum associated with the corresponding M&P pulse waveform.If truncating the ground motion at the end of the shorter pulse at 23.4 s (see Fig.9) for rocking analysis, then the prediction of seismic overturning becomes more accurate and theF1score increases from 0.889 to 0.973.In other words, the seismic overturning cases previously not predicted with the pulse in Fig.19(a)are mainly caused by the ground motion content after 23.4 s.In contrast, the prediction in Fig.19(b) using the longer M&P pulse in Fig.9 withTp2= 8.13 s and|vp2| = 56.73 cm/s has a lowerF1score, either 0.789 when inputting the complete ground motion in rocking analysis or 0.875 when truncating the ground motion at the end of the longer pulse at 31.3 s.The comparison indicates the dominance of the shorter pulse over a wide range of structures.
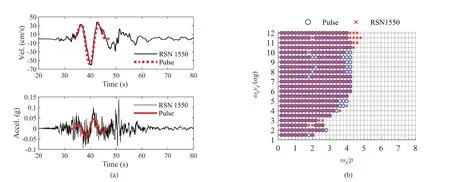
Fig.18 (a) Acceleration and velocity time series of RSN 1550 and its associated M&P pulse; (b) overturning cases under RSN 1550 overlain by the overturning spectrum associated with the M&P waveform (γ = 2, ν = 0)
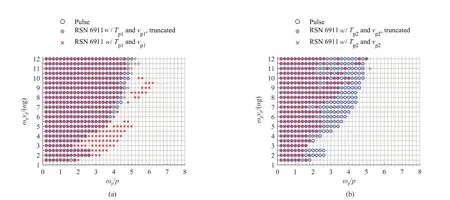
Fig.19 (a) Overturning cases under RSN 6911 using Tp1 and vp1 overlain by the overturning spectrum associated with the M&P waveform (γ = 1.5, ν = 0); (b) overturning cases under RSN 6911 using Tp2 and vp2 overlain by the overturning spectrum associated with the M&P waveform (γ = 1.5, ν = 0)
5 Conclusions
The current study developed an effective method to characterize the pulse-like features in pulse-type ground motions that aims to maintain the structural response to the original ground motion.This method is based on the congruence between the ΠPVand the pseudo-velocity response spectra associated with identical velocity waveform, where the horizontal and the vertical shifts between the two spectra reflect the time scaling and the amplitude scaling, respectively, of the velocity time series.Moreover, the congruence and the shift relationships have been extended from between the 2-D spectrum curves associated with a single value of structural damping ratio to between the 3-D spectrum surfaces that cover a range of damping ratios.This extension switches the key to the pulse identification from a subsequence-to-subsequence similarity search between 2-D curves to a subregion-to-subregion similarity search between 3-D surfaces.Switching from 2-D curves to 3-D surfaces brings two main advantages: first, it eases the similarity search since an efficient measurement of surface similarity exists;second, it improves the accuracy of the similarity search by enriching the features to compare.The new method eliminates the chance of obtaining discrepant pulses from utilizing spectrum curves of different damping values.
The similarity search between 3-D spectrum surfaces, supplemented with a similarity search in the velocity time series, has been implemented in a computer program and applied to characterize the pulselike features in 236 pulse-type ground motion records.Allowing various idealized waveforms to be considered,the current study has identified the best-fit velocity pulse to represent the pulse-like features of each ground motion as well as to retain the impulsive effect of the original ground motion on structures.The identified pulse parameters are compared with those from other researchers, and the relative differences are bounded within ±30% for the majority of the records.The relative differences, however, exceed ±30% for 13 out of the 236 records, which is attributed to the observation that this method tends to capture sharp pulse-like features with amplitudes close toPGVrather than the long duration wave-like trend of the ground velocity.
The identified pulses in the M&P waveforms are tested in predicting the rocking consequences of rigid rectangular blocks under the original pulse-type ground motions.Leveraging the self-similar dimensionless overturning spectrum associated with the specific M&P waveform, the prediction can be easily obtained with the pulse parameters already identified in the current study for each ground motion record.The accuracy of the prediction for each record is measured by anF1score,which is the harmonic mean of the precision and recall of the prediction results.The prediction is generally promising for the ground motions that contain M&P pulses withγ< 4, while relatively large uncertainty is observed for the 13 records in which M&P pulses withγ= 4 are identified.Further investigation reveals the importance of identifying the dominant pulse in the ground motion for the prediction accuracy.
Acknowledgement
This study was supported by the National Key Research and Development Program, Ministry of Science and Technology of China under Grant No.2022YFC3803004 and the National Natural Science Foundation of China under Grant No.51838004.
 Earthquake Engineering and Engineering Vibration2024年1期
- Earthquake Engineering and Engineering Vibration的其它文章
- Reliability-based life-cycle cost seismic design optimization of coastal bridge piers with nonuniform corrosion using different materials
- Finite element model updating for structural damage detection using transmissibility data
- Experimental study on seismic reinforcement of bridge foundation on silty clay landslide with inclined interlayer
- A novel mitigation measure for normal fault-induced deformations on pile-raft systems
- Longitudinal vibration characteristics of a tapered pipe pile considering the vertical support of surrounding soil and construction disturbance
- Resilient performance of self-centering hybrid rocking walls with curved interface under pseudo-static loading
