
Influence of adjacent shield tunneling construction on existing tunnel settlement: field monitoring and intelligent prediction
2024-01-11 08:07LongRANYangDINGQizhiCHENBaopingZOUXiaoweiYE
Long RAN ,Yang DING ,Qizhi CHEN ,Baoping ZOU ,Xiaowei YE
1School of Civil Engineering and Architecture,Zhejiang University of Science & Technology,Hangzhou 310023,China
2Zhejiang Engineering Research Center of Intelligent Urban Infrastructure,Hangzhou City University,Hangzhou 310015,China
3Department of Civil Engineering,Zhejiang University,Hangzhou 310058,China
Abstract: Urban subway tunnel construction inevitably disturbs the surrounding rock and causes the deformation of existing subway structures.Dynamic predictions of the tunnel horizontal displacement,tunnel ballast settlement,and tunnel differential settlement are important for ensuring the safety of buildings and tunnels.First,based on the Hangzhou Metro project,we analyzed the influence of construction on the deformation of existing subway structures and the difficulties and key points in monitoring.Then,a deformation prediction model,based on a back propagation (BP) neural network,was established with massive monitoring data.In particular,we analyzed the influence of four structures of the BP neural network on prediction performance,i.e.,single input-single hidden layer-single output,multiple inputs-single hidden layer-single output,single input-double hidden layers-single output,and multiple inputs-double hidden layers-single output,and verified them using measured data.
Key words: Subway;Horizontal displacement of tunnel;Settlement of tunnel ballast;Differential settlement of tunnel;Deformation prediction;Back propagation (BP) neural network
1 Introduction
With the rapid development of urban underground space in China,shield tunneling has gradually become the mainstay of urban subway construction because of its strong geological adaptability,high speed,safety,and reliability (Zhu and Li,2017;Jin et al.,2018;Qu et al.,2023).Shield tunneling causes some disturbance to the surrounding rock which leads to stratum deformation and foundation uplift or settlement and affects the adjacent buildings (Pourtaghi and Lotfollahi-Yaghin,2012;Fang et al.,2014;Li et al.,2021;Deng et al.,2022;Liang et al.,2022;Lu et al.,2023).However,study of surface subsidence is still at an immature stage owing to the complexity of the soil medium (Phien-Wej et al.,2006;Chen et al.,2022;Yu et al.,2023).Therefore,structural health monitoring (SHM) is needed during subway construction.Predicting the deformation of the surrounding structures during subway construction and summarizing the deformation law can give technical support and theoretical guidance for early safety warnings in subway construction,and are of great significance in improving the safety of subway construction (Li et al.,2019;Ding Y et al.,2023a,2023g).
Current deformation prediction methods are mainly theoretical numerical and machine learning ones (Fang et al.,2022;Ye et al.,2022;Ding Y et al.,2023b,2023c).In the theoretical numerical method,Wang et al.(2022) proposed a new empirical equation for the surface settlement curve to improve the prediction accuracy of the ground settlement induced by a tunnel.Ding Z et al.(2023) analyzed the law of soil displacement caused by shield tunnel construction of adjacent buildings.Nevertheless,a theoretical method involves many uncertain factors,such as soil parameters,construction parameters,and manual operation technology(Lu et al.,2020;Wang et al.,2021;Zheng et al.,2023),which lead to poor accuracy of deformation prediction.The machine learning method is a data-driven model(Chen et al.,2019a;Ye et al.,2019,2021;Liu et al.,2022;Ding Y et al.,2023e,2023f,2023h) that can predict future deformation based on historical deformation data (Suwansawat and Einstein,2006;Tashayo et al.,2019).Kim et al.(2022) presented a machine learning framework using data-driven feature selection methods to predict surface subsidence levels.Zhang DM et al.(2020) developed a non-parametric integrated artificial intelligence (AI) method to calculate for soft clay,which is different from the traditional regression model proposed in previous studies.These machine learning methods have very good prospects for prediction purposes.Generally,the prediction performance of machine learning is related to its input layers and structure layers (Liu et al.,2021).The input data can be not only settlement data,but also some construction parameters.In addition,the prediction performance of the model related to the number of iterations.
Many researchers have developed parameter estimation algorithms,such as genetic algorithms,particle swarm optimization,and cross-validation methods,to optimize machine learning models and solve this problem (Hasanipanah et al.,2016;Zhang K et al.,2020;Ding Y et al.,2023d).Feng and Zhang (2022) developed the hybrid genetic algorithm-neural network to obtain the upper and lower bounds of a settlement.Zhang P et al.(2020) demonstrated the application of machine learning algorithms in predicting tunnelinginduced settlement.Guo et al.(2009) used an immune algorithm (IA) to get accurate settlement prediction value.Although the parameter estimation algorithm can find the optimal machine learning model,it may be unable to find the global optimal solution.
This paper reports a deformation prediction model based on the back propagation (BP) neural network established for a subway construction in Hangzhou,China.In addition,an efficient method was developed to find the best structure of the BP prediction model,i.e.,one that does not require a parameter estimation algorithm to optimize it and to avoid falling into a local optimum.Specifically,the influence of the number of inputs,the number of hidden layers,and the number of hidden layer nodes on the prediction performance is discussed,and the optimal model is proposed.
2 Engineering background
2.1 Project description
The Hangzhou airport rail express project and the West Lake Cultural Square Station node project are located at the Wenhui Road and the Zhongshan North Road.The subway facilities to be built in the node project of West Lake Cultural Square Station include:(1) an express station,(2) an auxiliary structure of the express station,(3) a transfer hall,(4) Metro Line 3 interval tunnel,and (5) airport express interval tunnel,as shown in Fig.1.The auxiliary structure of the station is located on the north side of the main body of the station.
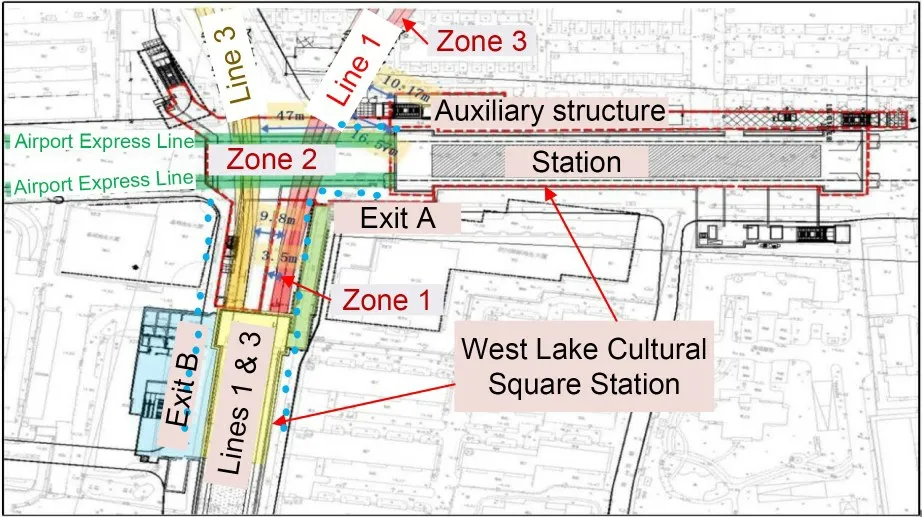
Fig.1 Top view of the site
The tunnel of Metro Line 3 is arranged along the north-south direction of Zhongshan North Road and enters the station in parallel with Metro Line 1.The tunnel of the Airport Express Line is arranged along the east-west direction of Wenhui Road and crosses Metro Line 1 and Line 3,as shown in Fig.2.The station is a five-story underground box frame structure with two columns and three spans.The station adopted the opencut method (the first to third underground floors) and the top-down method (the fourth and fifth underground floors),with a total length of 168.7 m.The station envelope adopted 1500 mm diaphragm walls (cross-shaped steel joints),with 99 pieces and a depth of 36.03-53.65 m.The trench wall was reinforced using a triaxial mixing pile;the depth of the trench wall was 20 m,and the cement content was 15%.In addition,the project used metro jet system (MJS) reinforcement to strengthen the tunnel.The MJS method uses forced mud drainage,and the excess mud is discharged through the mud drainage hole.The MJS method can maintain the stability of mud pressure,and thus it reduces the impact on the surrounding environment.
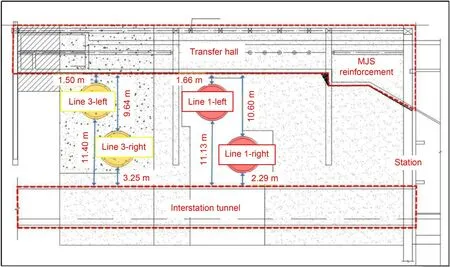
Fig.2 Cross-sectional view of the site under study
2.2 Monitoring points
Seepage has a significant influence on water and soil pressure and soil parameters.The adjacent road is affected by the dynamic load of vehicles.The measured deformation often exceeds the deformation specified by the standard GB50911-2013 (MOHURD,2013)because of the influence of the rheological effect of soft soil and other factors.According to the achievements and experiences of subway protection monitoring during the construction period and operation period of the Hangzhou Metro,combined with the relevant national subway protection monitoring specifications,the main points of this project monitoring work are as follows:
1.The construction of the West Lake Cultural Square Station and transfer hall on the Airport Express Line of this project involved the construction of a foundation pit directly above and beside the subway and the excavation depth of the transfer hall of Airport Express Line and Line 3 was approximately 8.2 m.
2.The distance between this project and the subway tunnel was small.The foundation pit of the transfer hall between the Airport Express Line and Line 3 on the north side was located above the tunnel of Metro Line 1,and the bottom of the foundation pit was approximately 1.66 m away from the left tunnel of Metro Line 1 and 10.6 m away from the right tunnel.The transfer hall between the Airport Express Line and Line 3 on the south side was located on the side of the tunnel of Metro Line 1,and the distance between the foundation pit and the tunnel of Metro Line 1 was approximately 3.5 m.
3.There were subway stations,auxiliary structures,shield tunnels,and other subway facilities with different structural forms within the influence of the foundation pit of this project,which was affected by the foundation pit construction to various degrees.Therefore,in the monitoring process of protected areas,in addition to considering the deformation of their structures,the differential settlement monitoring between stations and ancillary structures,stations,and shield tunnel structures had to be increased.
2.3 Monitoring data
As of Mar.26,2021,the monitoring results showed that the right line created a maximum horizontal displacement of -4.9 mm in Zone 1 (monitoring points SCZWY6-SWY858),-1.6 mm in Zone 2 (monitoring points SWY855-SWY820),and -3.3 mm in Zone 3(monitoring points SWY818-SWY765).The left line created a maximum horizontal displacement of -7.0 mm in Zone 1,-6.2 mm in Zone 2,and -2.1 mm in Zone 3,as shown in Fig.3.
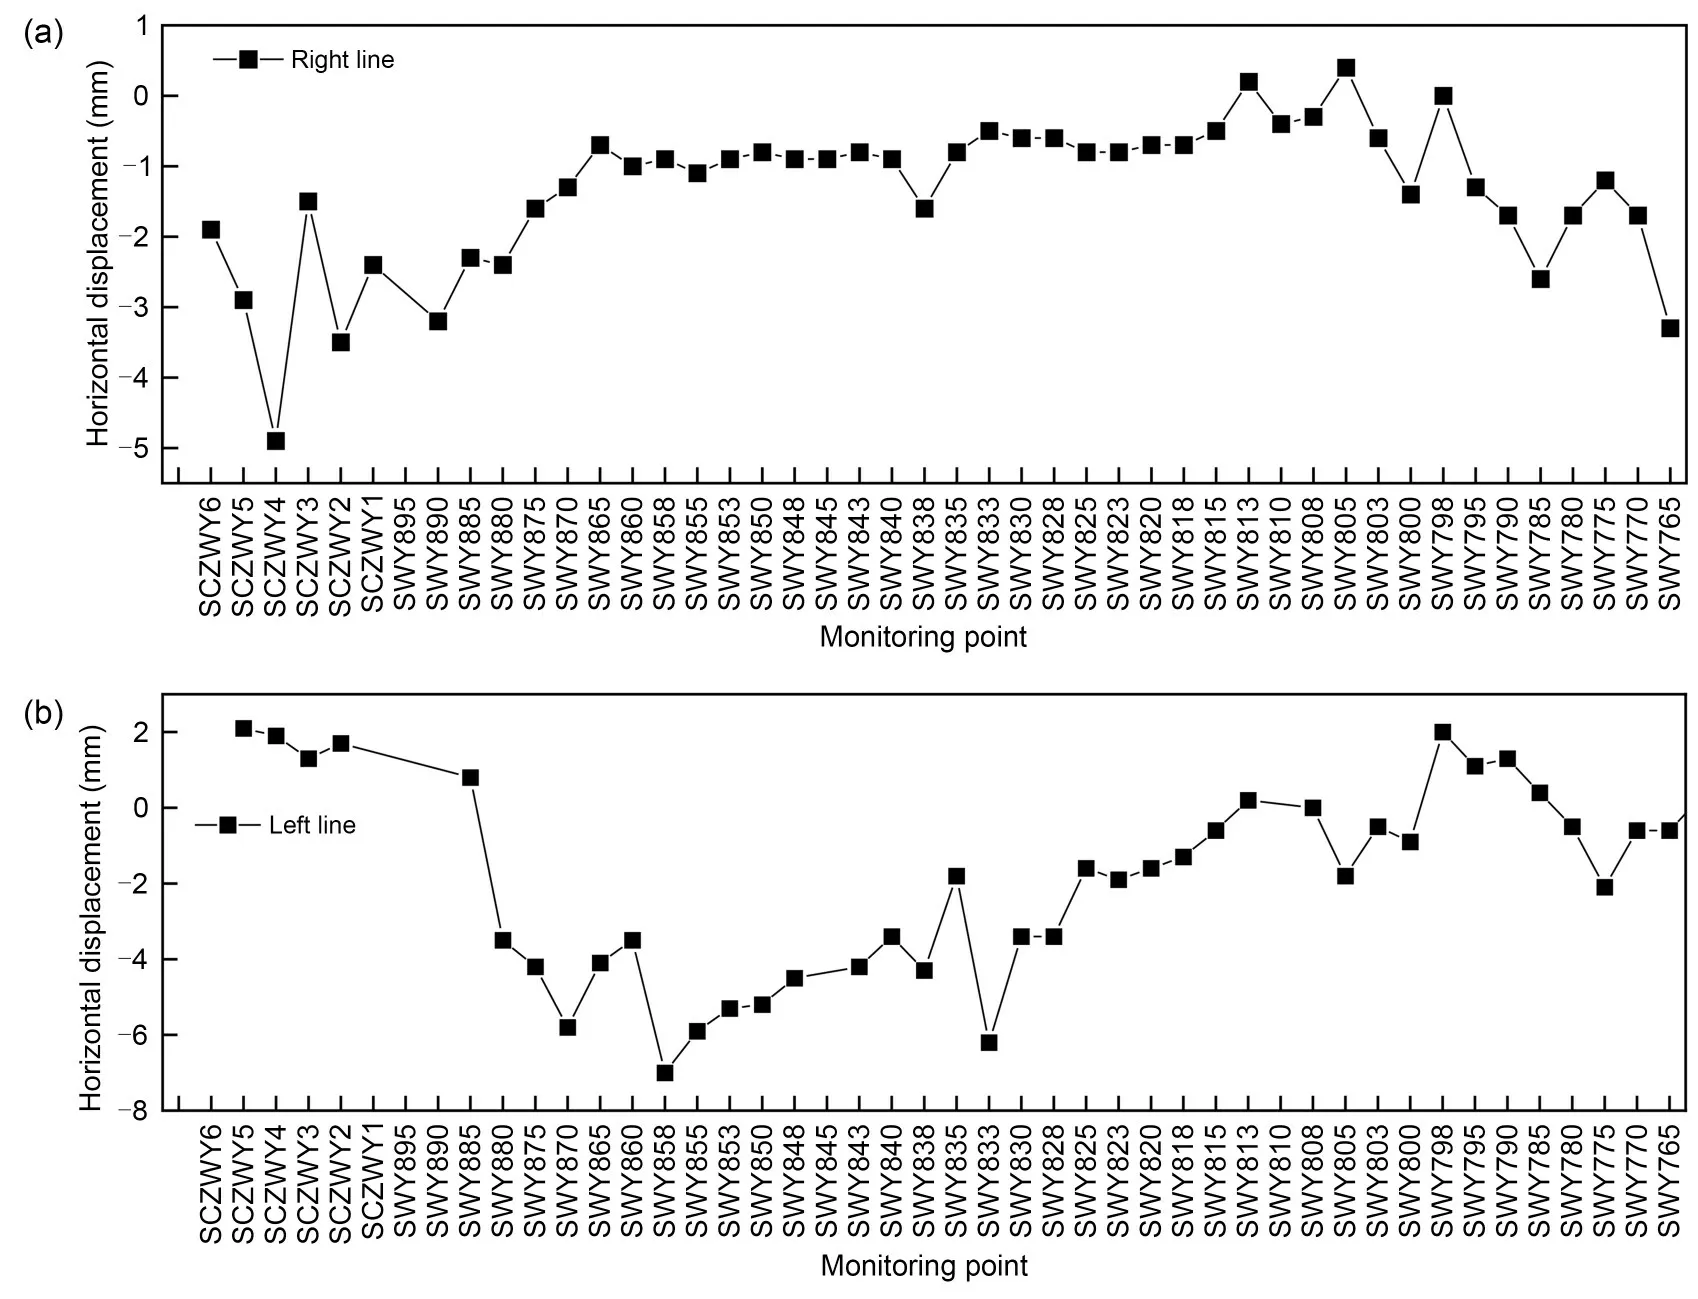
Fig.3 Horizontal displacement of tunnel: (a) right line-A1;(b) left line-A2
The left line caused a maximum avenue ballast settlement of -7.8 mm in Zone 1,-10.2 mm in Zone 2,and -5.9 mm in Zone 3.The right line caused a settlement of the maximum avenue ballast of 4.1 mm in Zone 1,-3.3 mm in Zone 2,and 3.9 mm in Zone 3,as shown in Fig.4.
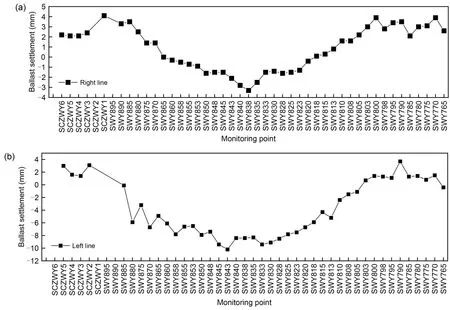
Fig.4 Settlement of tunnel ballast: (a) right line-A3;(b) left line-A4
The left line caused a maximum differential settlement of 1.9 mm in Zone 1,1.9 mm in Zone 2,and-1.5 mm in Zone 3.The right line caused a maximum differential settlement of -1.9 mm in Zone 1,-1.7 mm in Zone 2,and -1.9 mm in Zone 3,as shown in Fig.5.
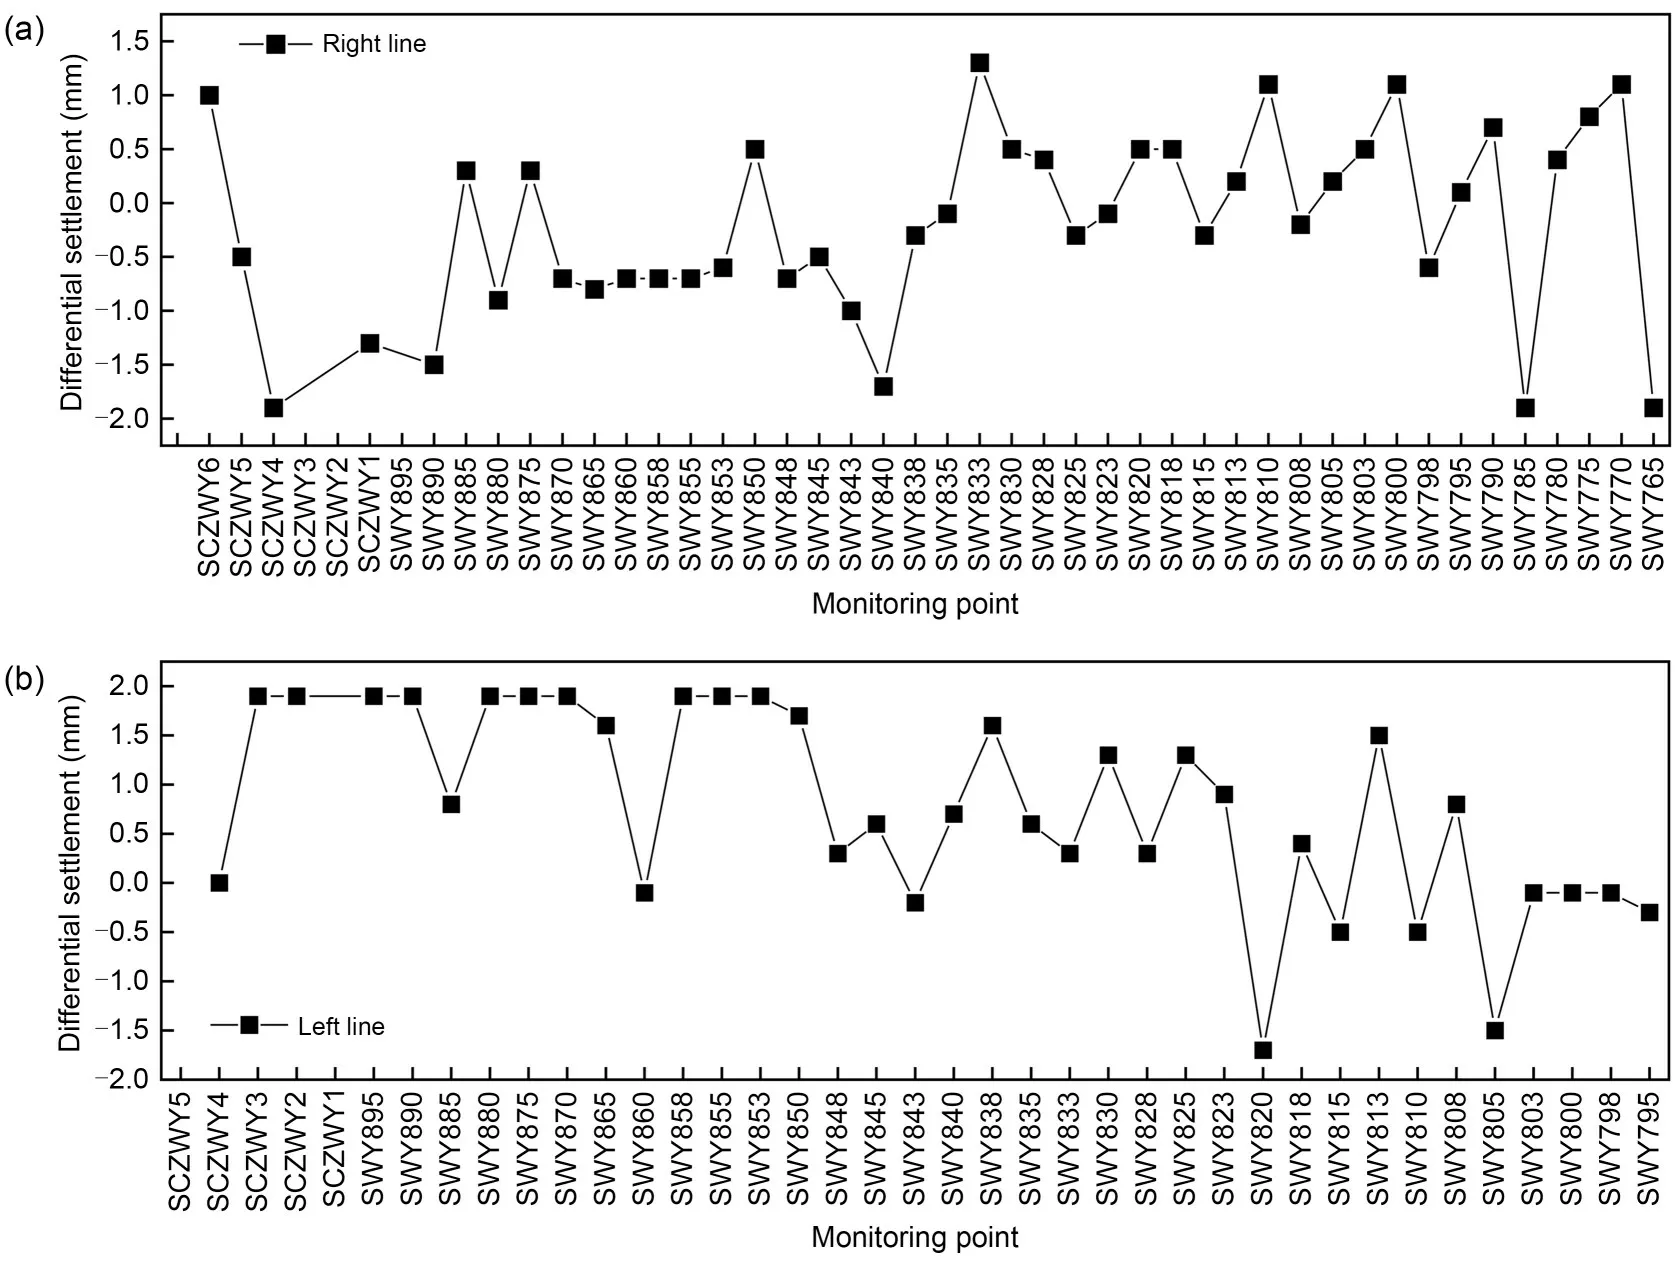
Fig.5 Differential settlement of tunnel: (a) right line-A5;(b) left line-A6
3 BP neural network
The BP neural network is a radial basis function neural network based mainly on the theory of error back propagation (Chen et al.,2019b).In addition,the number of input datanexpresses the correlation between the subsequent prediction data and the firstndata so that the correlation between the data can be reflected by the number of input data (Zhang et al.,2022).Generally,BP prediction models can be divided into four types: single input-single hidden layer-single output,multiple inputs-single hidden layer-single output,single input-double hidden layers-single output,and multiple inputs-double hidden layers-single output,as shown in Fig.6.
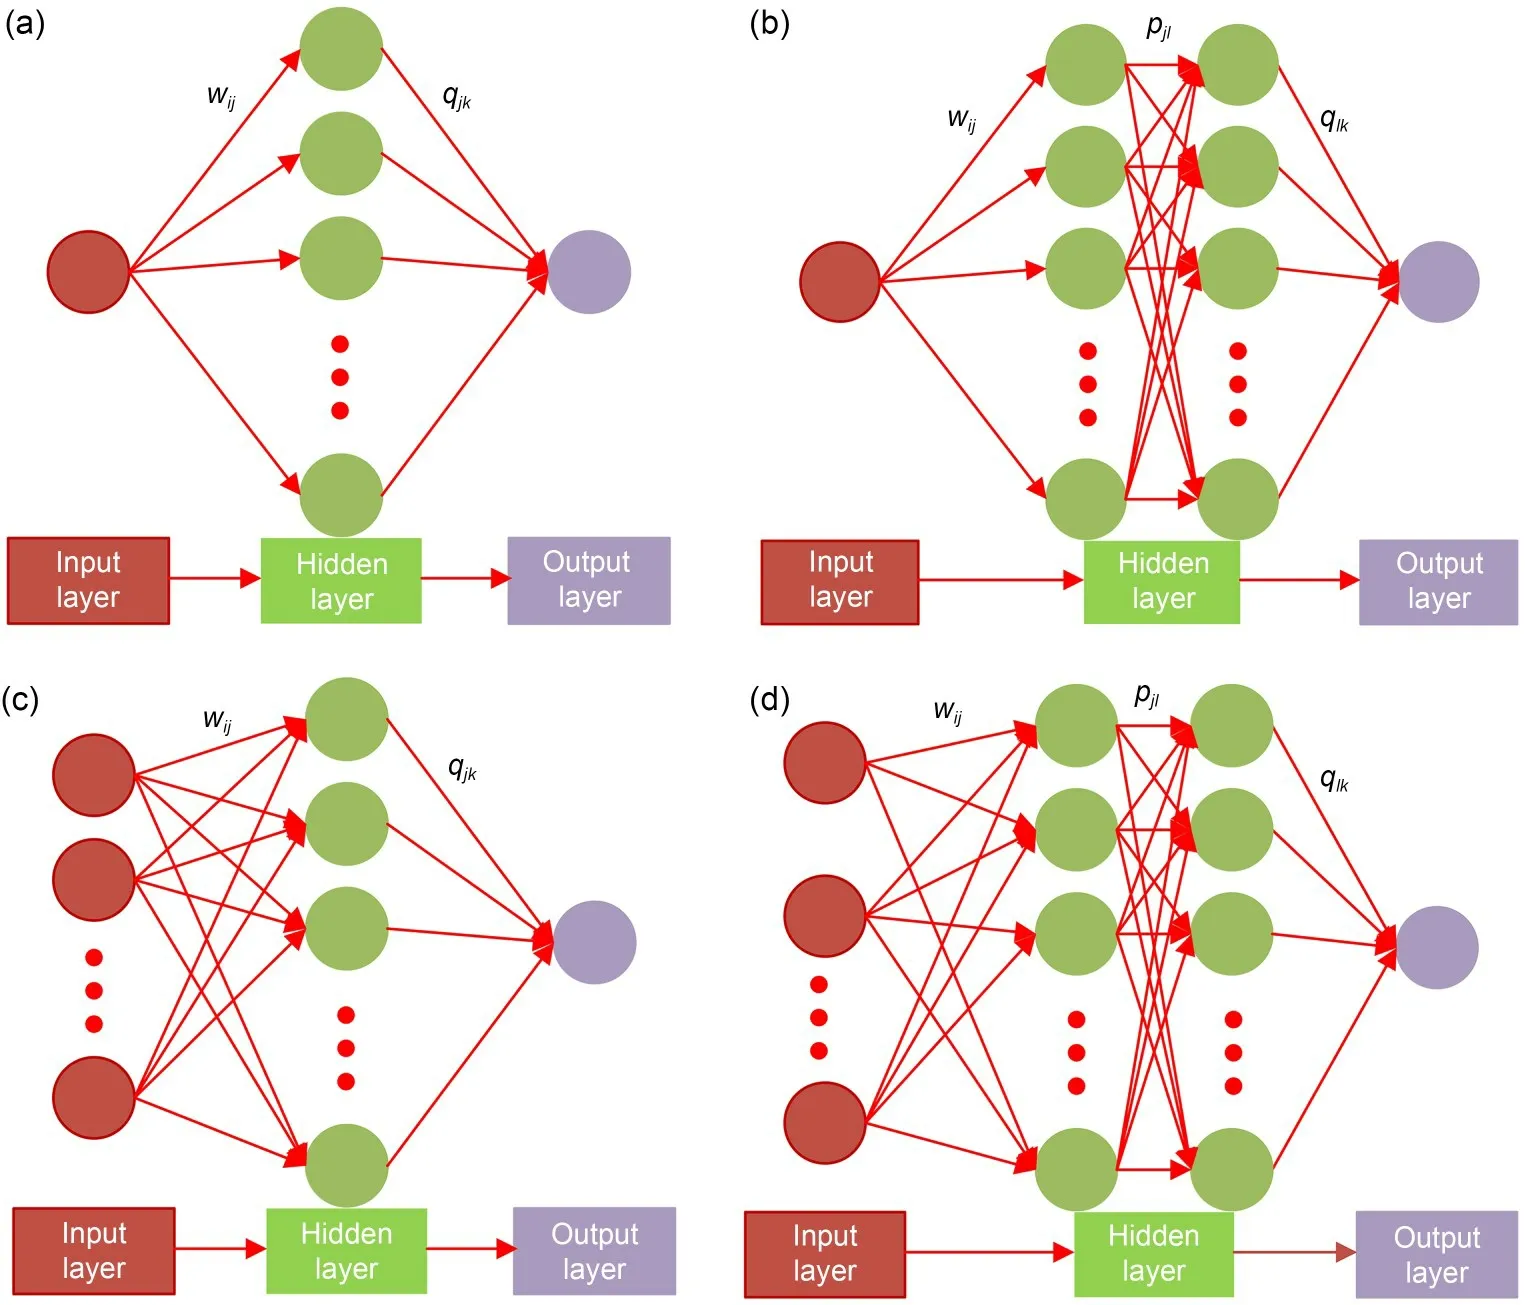
Fig.6 BP neural network prediction models: (a) single input-single hidden layer-single output;(b) single input-double hidden layers-single output;(c) multiple inputs-single hidden layer-single output;(d) multiple inputs-double hidden layers-single output.wij represents the weight between the input layer and the first hidden layer;qjk or qlk represents the weight between the last hidden layer and output layer;pjl represents the weight between the first and second hidden layers
The hidden layer neurons can be expressed as:
whereh=1,2,…,p,pis the number of nodes in the hidden layer,xj(k) represents the input of thejth node in the input layer,zhi(k) represents the input of thehth node in the hidden layer,ωjhrepresents the connection weight between thejth node in the input layer and thehth node in the hidden layer,andbhrepresents the threshold value of thehth node in the hidden layer.
The output of the hidden layer node can be expressed as:
wherezho(k) represents the output of thehth node in the hidden layer,andf(·) is the activation function.
Similarly,the output layer neurons are represented as follows:
whereu=1,2,…,q,qis the number of nodes in the output layer,yui(k) represents the input of theuth node in the output layer,ωhurepresents the connection weight between the hidden layer and the node,andburepresents the threshold value of theuth node in the output layer.
The output of the output layer node can be expressed as:
Therefore,the error function of a single sample can be expressed as:
wheredu(k) is the true value.
The above process is forward propagation,and the BP neural network also has a key step: BP.The main purpose of BP is to correct the connection weights between layers.First,the partial derivative of the error function can be expressed as (Wu et al.,2022):
Similarly,the error function between the hidden and input layers can be expressed as:
The weights in the BP neural network can be modified to:
whereηrepresents the learning rate of the BP neural network.
Finally,the minimum global error or iteration times are set artificially.The BP neural network stops training when one of these criteria is met.The weight correction ends and the predicted value is output.
4 Numerical study
In the BP prediction model,the training set was 80% of the total number of samples,the test set was 10% of the total number of samples,and the prediction set was 10% of the total number of samples.The BP model was used to predict the following: the right line of tunnel horizontal displacement (A1),the left line of the tunnel horizontal displacement (A2),the right line of tunnel ballast settlement (A3),the left line of tunnel ballast settlement (A4),the right line of tunnel differential settlement (A5),and the left line of tunnel differential settlement (A6).
4.1 Case study 1: single input-single hidden layersingle output
When the input number was 1,the influence of the number of nodes (1-20) in a single hidden layer on the prediction performance was analyzed,as shown in Fig.7.The root mean square error (RMSE) value increased gradually as the number of nodes in the hidden layer increased (Fig.7).This is mainly because the training effect will show an over-fitting phenomenon as the number of nodes is increased,which degrades the prediction performance.The number of nodes in a single hidden layer was 1 when the input number was 1.In particular,in the horizontal displacement prediction,the RMSE value of the right line (A1) was 0.051,and the RMSE value of the left line (A2) was 0.369.In the prediction of tunnel ballast settlement,the RMSE value of the right line (A3) was 0.359,and that of the left line (A4) was 0.489.In the prediction of tunnel differential settlement,the RMSE value of the right line (A5) was 0.959,and that of the left line (A6) was 0.849.In addition,when the number of nodes is too small,there will be under-fitting.When the number of nodes is too large,there will be over-fitting.For the point A2,the prediction performance with 18 nodes in the hidden layer shows an abrupt change.
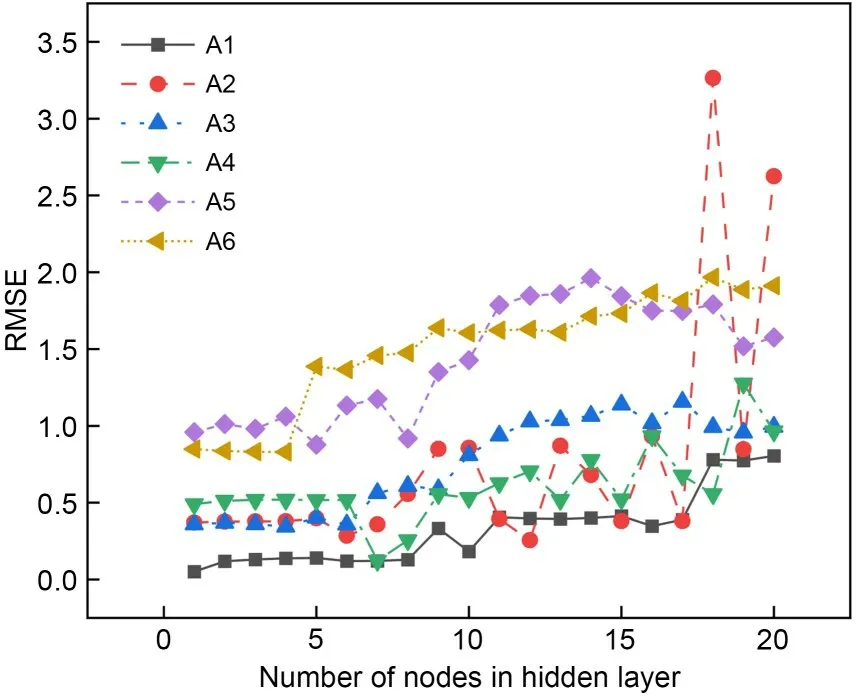
Fig.7 RMSE with single input-single hidden layer
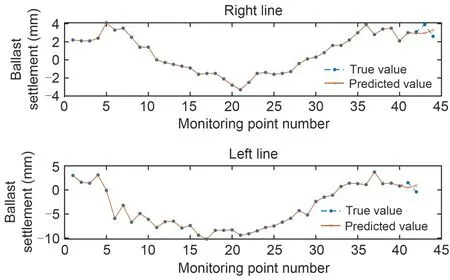
Fig.9 Prediction of tunnel ballast settlement
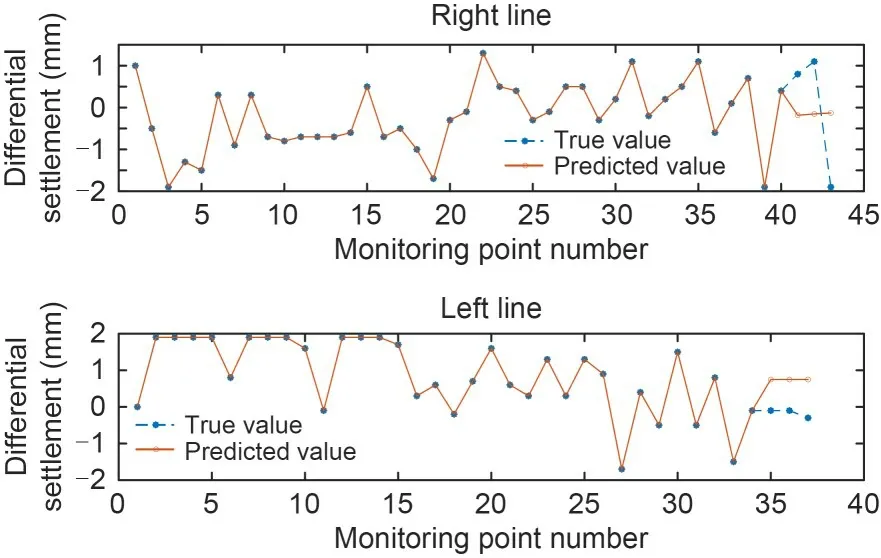
Fig.10 Prediction of tunnel differential settlement
Figs.8-10 show the prediction results based on the BP model with one input and one node in a single hidden layer.The established BP neural network can predict the trend of tunnel deformation and accurately predict the tunnel deformation value (Figs.8-10).
4.2 Case study 2: multiple inputs-single hidden layer-single output
The influence of the number of nodes (1-20) in a single hidden layer on the prediction performance was analyzed when the input number was 2,as shown in Fig.11.For the A1 point,the RMSE value decreased gradually as the number of nodes in the hidden layer increased.Considering computational efficiency and prediction performance,the optimal number of nodes is 2.In particular,when the input number was 2 and the number of nodes was 2,the RMSE value was 0.216.For A2,A3,and A6,the RMSE value changed slowly with increase in the number of nodes.
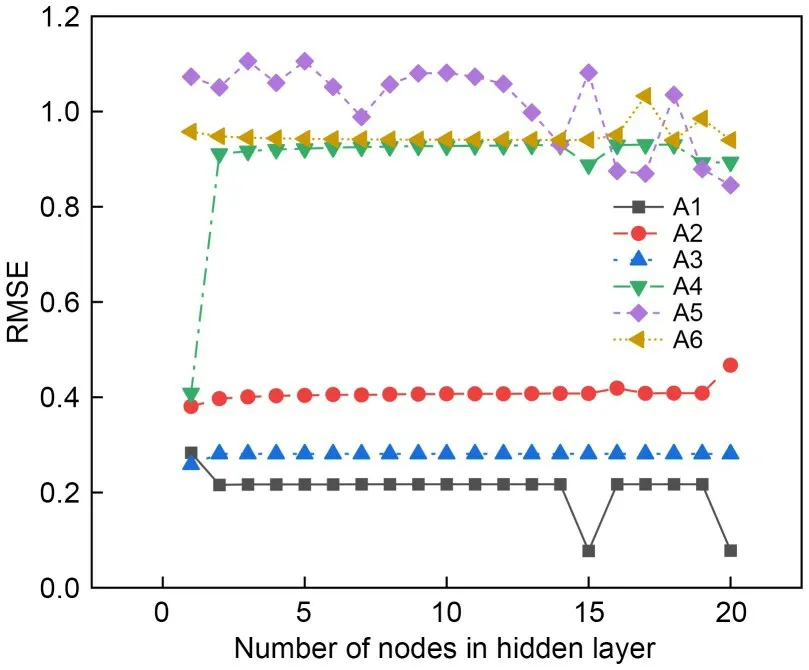
Fig.11 RMSE with multiple inputs-single hidden layer(input number is 2)
Specifically,when the input number was 2 and the number of nodes in the single hidden layer was 1,the RMSE values for A2,A3,and A6 were 0.381,0.258,and 0.968,respectively.For the A4 point,the RMSE value increased gradually as the number of nodes increased.The RMSE value was 0.408 when the input number was 2 and the number of nodes in the single hidden layer was 1.Considering the computational efficiency and prediction performance,the optimal number of nodes in a single hidden layer is 7.In particular,the RMSE value was 0.988 when the input number was 2 and the number of nodes in the single hidden layer was 7 for the A5 point.
The influence of the number of nodes (1-20) in a single hidden layer on the prediction performance was analyzed when the input number was 3,as shown in Fig.12.For points A1,A2,A3,A5,and A6,the RMSE values changed smoothly as the number of nodes increased.Specifically,their RMSE values were 0.556,0.403,0.237,0.999,and 0.906,respectively,when the input number was 3 and the number of nodes in the single hidden layer was 1.For the A4 point,the RMSE value increased gradually as the number of nodes increased.In particular,the RMSE value was 0.429 when the input number was 3 and the number of nodes in the single hidden layer was 1.
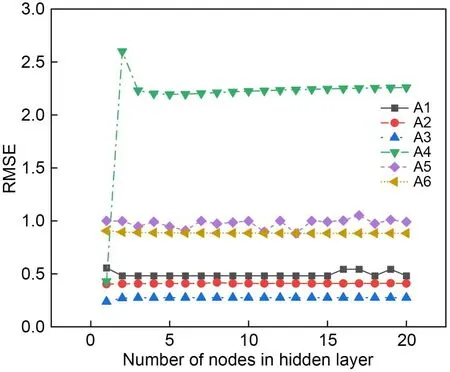
Fig.12 RMSE with multiple inputs-single hidden layer(input number is 3)
The influence of the number of nodes (1-20) in a single hidden layer on the prediction performance was analyzed when the input number was 4,as shown in Fig.13.For points A1,A2,A3,A5,and A6,the RMSE value changed smoothly as the number of nodes increased.In particular,their RMSE values were 0.328,0.396,0.237,0.889,and 0.857,respectively,when the input number was 4 and the number of nodes in the single hidden layer was 1.For the A4 point,the RMSE value increased gradually as the number of nodes in the hidden layer increased.Specifically,the RMSE value was 0.614 when the input number was 4 and the number of nodes in the single hidden layer was 1.
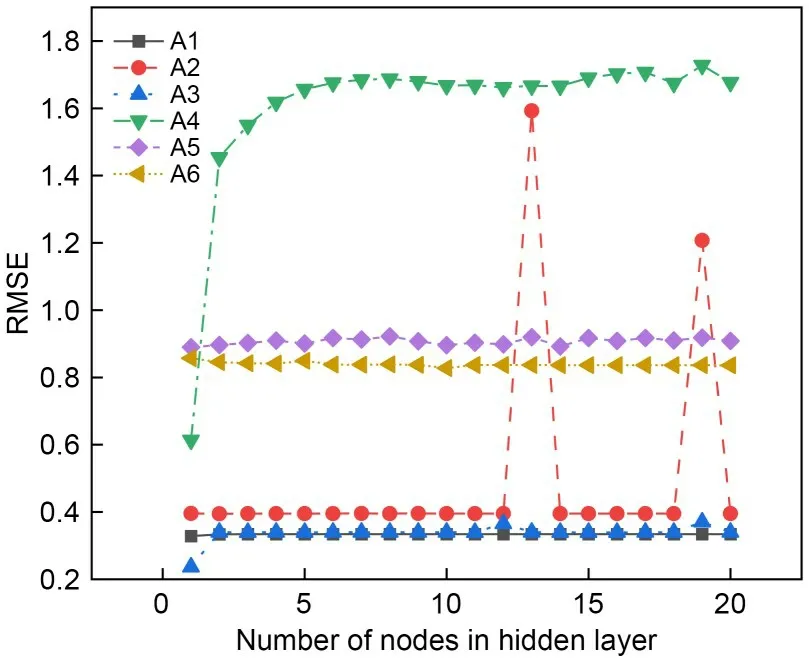
Fig.13 RMSE with multiple inputs-single hidden layer(input number is 4)
The influence of the number of nodes (1-20) in a single hidden layer on the prediction performance was analyzed when the input number was 5,as shown in Fig.14.For points A1,A3,A5,and A6,the RMSE value changed smoothly as the number of nodes increased.Specifically,the RMSE values of A1,A3,A5,and A6 were 0.314,0.295,0.851,and 0.672,respectively,when the input number was 5 and the number of nodes in the single hidden layer was 1.For A2 and A4,the RMSE value increased gradually as the number of nodes increased,and their RMSE values were 0.443 and 0.661,respectively,when the input number was 5 and the number of nodes in the single hidden layer was 1.
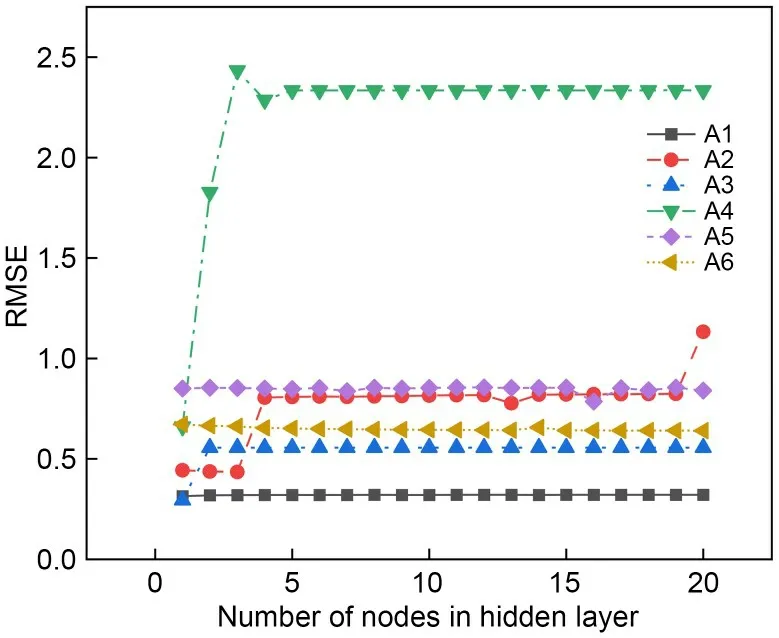
Fig.14 RMSE with multiple inputs-single hidden layer(input number is 5)
4.3 Case study 3: single input-double hidden layers-single output
When the input number was 1 and the number of hidden layers was 2,the influence of the numbers of nodes (1-20) in the double hidden layers on the prediction performance was examined,as shown in Fig.15.For the A1 point,the RMSE value increased gradually as the number of nodes increased (Fig.15a).Specifically,the RMSE value is 0.091 when the numbers of nodes in the 1st and 2nd hidden layers were 1 and 1,respectively.For the A2 point,considering the computational efficiency and prediction performance,the optimal numbers of nodes in the 1st and 2nd hidden layers were 2 and 3,respectively.The RMSE value was 0.297 when the input number was 1 and the numbers of nodes in the 1st and 2nd hidden layers were 2 and 3,respectively,for the A2 point (Fig.15b).For the A3 point,the optimal numbers of nodes in the 1st and 2nd hidden layers were 1 and 1,respectively,and the corresponding RMSE value was 0.303 when the input number was 1 (Fig.15c).For the A4 point,the optimal numbers of nodes in the 1st and 2nd hidden layers were 8 and 1,respectively,and the corresponding RMSE value was 0.151 when the input number was 1(Fig.15d).For the A5 point,the optimal numbers of nodes in the 1st and 2nd hidden layers were 1 and 1,respectively,and the corresponding RMSE value was 1.104 when the input number was 1 (Fig.15e).For the A6 point,the optimal numbers of nodes in the 1st and 2nd hidden layers were 3 and 1,respectively,and the corresponding RMSE value was 0.939 when the input number was 1 (Fig.15f).

Fig.15 RMSE with single input-double hidden layers: (a) A1;(b) A2;(c) A3;(d) A4;(e) A5;(f) A6
4.4 Case study 4: multiple inputs-double hidden layers-single output
When the number of hidden layers was 2 and the input number was 3,the influence of the numbers of nodes (1-20) in the double hidden layers on the prediction performance was examined,as shown in Fig.16.The RMSE value for point A1 changed as the number of nodes increased (Fig.16a).Specifically,the RMSE value was 0.475 when the input number was 3 and the numbers of nodes in the 1st and 2nd hidden layers were 2 and 3,respectively.For the A2 point,considering the computational efficiency and prediction performance,the optimal numbers of nodes in the 1st and 2nd hidden layers were 2 and 3,respectively.Specifically,the RMSE value was 0.442 when the input number was 3 and the numbers of nodes in the 1st and 2nd hidden layers were 2 and 3,respectively,for the A2 point (Fig.16b).For the A3 point,the optimal numbers of nodes in the 1st and 2nd hidden layers were 2 and 3,respectively,and the corresponding RMSE value was 0.302 when the input number was 3 (Fig.16c).For the A4 point,the optimal numbers of nodes in the 1st and 2nd hidden layers were 1 and 1,respectively,and the corresponding RMSE value was 0.522 when the input number was 3 (Fig.16d).For the A5 point,the optimal numbers of nodes in the 1st and 2nd hidden layers were 3 and 3,respectively,and the corresponding RMSE value was 0.967 when the input number was 3 (Fig.16 e).For the A6 point,the optimal numbers of nodes in the 1st and 2nd hidden layers were 1 and 3,respectively,and the corresponding RMSE value was 0.985 when the input number was 3 (Fig.16f).
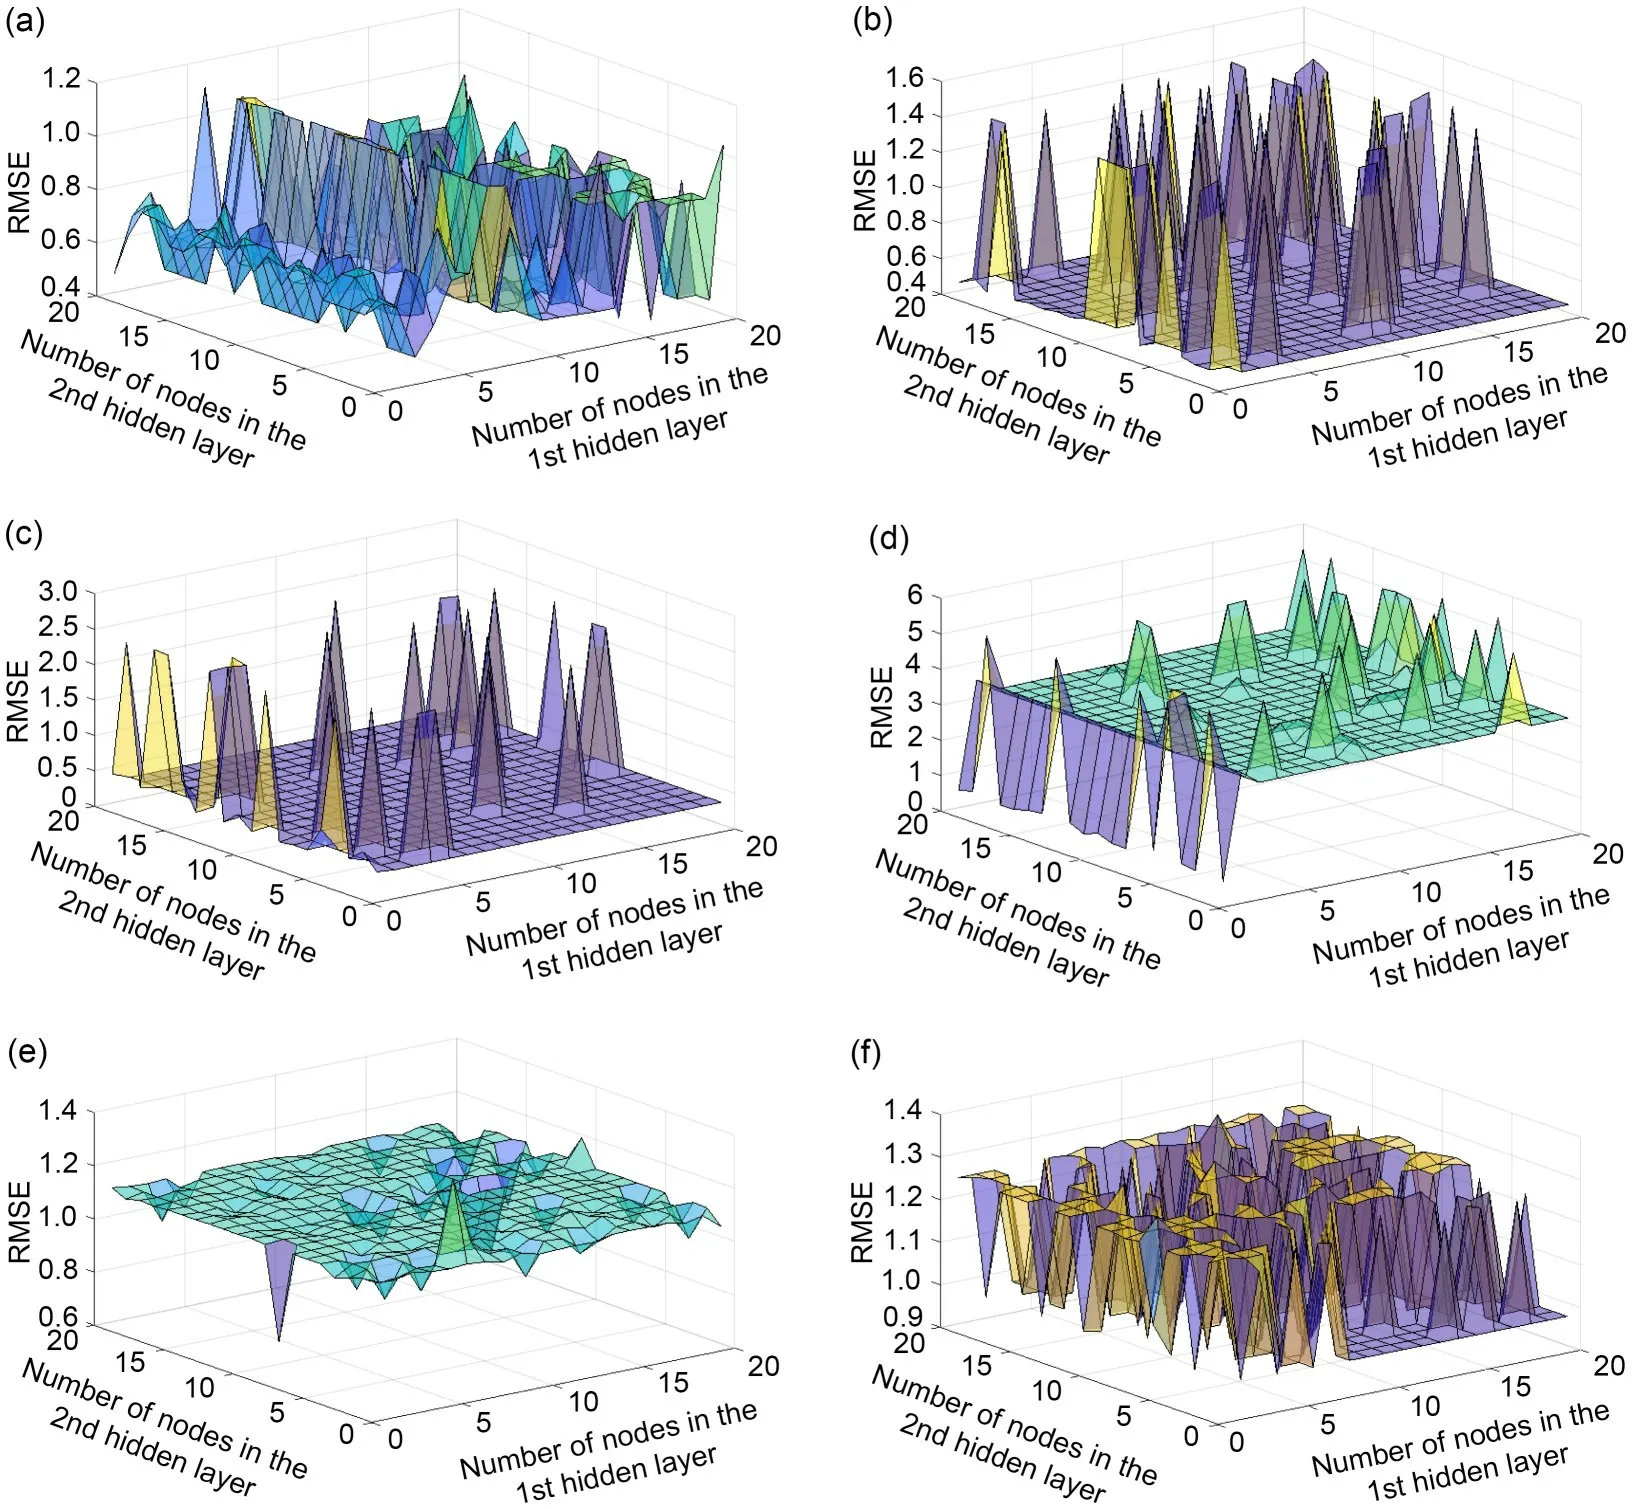
Fig.16 RMSE with multiple inputs-double hidden layers (input number is 3): (a) A1;(b) A2;(c) A3;(d) A4;(e) A5;(f) A6
When the input number was 5 and the number of hidden layers was 2,the influence of the numbers of nodes (1-20) in the double hidden layers on the prediction performance was evaluated,as shown in Fig.17.The RMSE value for the A1 point changed as the number of nodes increased (Fig.17a).Specifically,the RMSE value was 0.377 when the input number was 5 and the numbers of nodes in the 1st and 2nd hidden layers were 1 and 1,respectively.For the A2 point,considering computational efficiency and prediction performance,the optimal numbers of nodes in the 1st and 2nd hidden layers were 1 and 5,respectively.Specifically,the RMSE value was 0.558 when the input number was 5 and the numbers of nodes in the 1st and 2nd hidden layers were 1 and 5,respectively,for the A2 point (Fig.17b).For the A3 point,the optimal numbers of nodes in the 1st and 2nd hidden layers were 1 and 5,respectively,and the corresponding RMSE value was 0.367 when the input number was 5 (Fig.17c).For the A4 point,the optimal numbers of nodes in the 1st and 2nd hidden layers were 2 and 5,respectively,and the corresponding RMSE value was 2.445 when the input number was 5 (Fig.17d).For the A5 point,the optimal numbers of nodes in the 1st and 2nd hidden layers were 1 and 1,respectively,and the corresponding RMSE value was 1.081 when the input number was 5(Fig.17e).For the A6 point,the optimal numbers of nodes in the 1st and 2nd hidden layers were 1 and 2,respectively,and the corresponding RMSE value was 0.751 when the input number was 5 (Fig.17f).
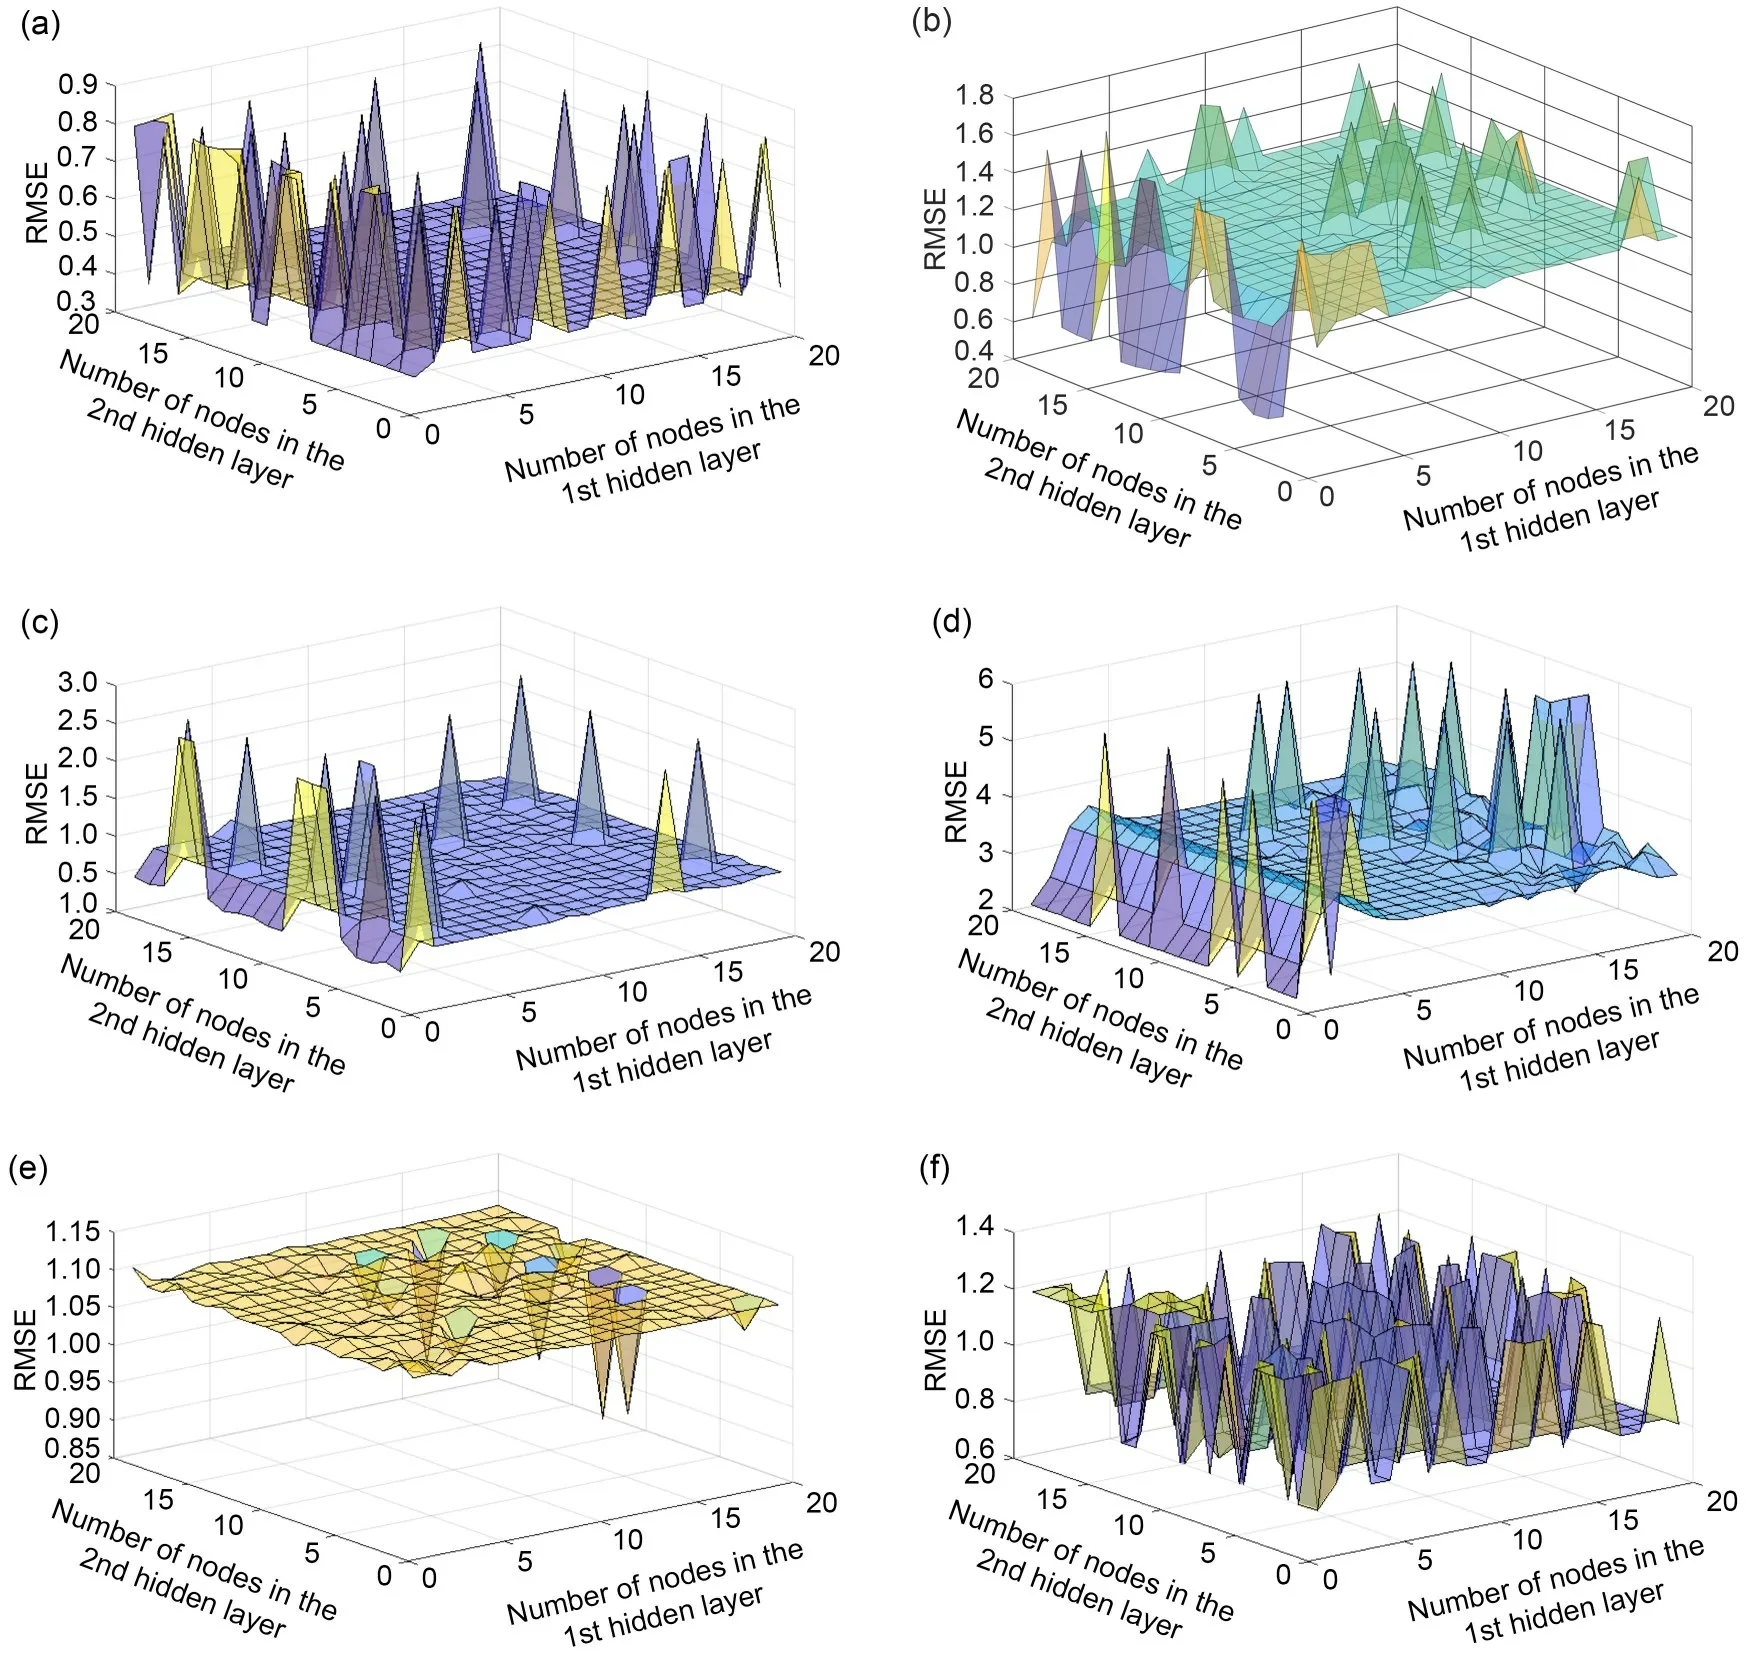
Fig.17 RMSE with multiple inputs-double hidden layers (input number is 5): (a) A1;(b) A2;(c) A3;(d) A4;(e) A5;(f) A6
5 Conclusions
Based on the engineering background of Hangzhou Metro,this study analyzed the influence of excavations of the metro on the existing structures and the difficulties and key points for monitoring.The influence of different BP neural network input numbers,hidden layer numbers,and node numbers on the prediction performance was analyzed based on six monitoring data of tunnel,which include horizontal displacement,ballast settlement,and differential settlement.The following conclusions were obtained:
(1) There were subway stations,auxiliary structures,shield tunnels,and other subway facilities with different structural forms within the influence scope of the foundation pit of this project,which are affected by the foundation pit construction to various degrees.In monitoring protected areas,in addition to paying attention to the deformation of their structures,the differential settlement monitoring between stations and ancillary structures,stations,and shield tunnel structures should be strengthened.
(2) For the single input-single hidden layer-single output BP neural network,the optimal number of nodes in the hidden layer was 1.For the BP neural network with multiple inputs-single hidden layer-single output,the optimal number of inputs was 2,and the number of nodes in the hidden layer was 1.For the single input-double hidden layers-single output BP neural network,the optimal numbers of nodes in the 1st and 2nd hidden layers were 1 and 1,respectively.For the BP neural network with multiple inputs-double hidden layers-single output,the optimal number of inputs was 5 and the numbers of nodes in the 1st and 2nd hidden layers were 1 and 5,respectively.
(3) When determining the input number,the number of hidden layers should not exceed the input number to avoid over-fitting.In addition,when the input number is 1-3,the more hidden layers,the more the over-fitting phenomenon will appear in the training process.Therefore,the optimal number of hidden layers should be 1.
(4) Although the proposed method achieves settlement prediction,it still has limitations that need to be improved: (i) more data should be monitored so we can get better settlement prediction value,and (ii) it is better to establish a BP model that can realize longterm settlement prediction.
Acknowledgments
This work is supported by the Humanities and Social Sciences Research Project of Ministry of Education of China(No.23YJCZH037),the Educational Science Planning Project of Zhejiang Province (No.2023SCG222),the Foundation of the State Key Laboratory of Mountain Bridge and Tunnel Engineering (No.SKLBT-2210),the Scientific Research Project of Zhejiang Provincial Department of Education (No.Y202248682),the National Key R&D Program of China (No.2022YFC3802301),and the National Natural Science Foundation of China (Nos.52178306 and 52008373).
Author contributions
Yang DING designed the research.Yang DING and Long RAN processed the corresponding data.Yang DING wrote the first draft of the manuscript.Qizhi CHEN,Baoping ZOU,and Xiaowei YE helped to organize the manuscript.Yang DING revised and edited the final version.
Conflict of interest
Long RAN,Yang DING,Qizhi CHEN,Baoping ZOU,and Xiaowei YE declare that they have no conflict of interest.
 Journal of Zhejiang University-Science A(Applied Physics & Engineering)2023年12期
- Journal of Zhejiang University-Science A(Applied Physics & Engineering)的其它文章
- Key technologies and development trends of the soft abrasive flow finishing method
- Enhanced mixing efficiency for a novel 3D Tesla micromixer for Newtonian and non-Newtonian fluids
- Numerical modeling and experimental study of microstamping process for fabricating microchannels using thin sheets of titanium
- Solid-liquid flow characteristics and sticking-force analysis of valve-core fitting clearance
- GPU-accelerated vector-form particle-element method for 3D elastoplastic contact of structures
- Dynamics of buoyancy-driven microflow in a narrow annular space