Moment tensor and stress inversion solutions of acoustic emissions during compression and tensile fracturing in crystalline rocks
Zihua Niu, Bing Qiuyi Li, Omid Moradian
a Department of Earth Sciences, Swiss Federal Institute of Technology (ETH), Zurich, 8006, Switzerland
b Department of Civil and Environmental Engineering, Western University, London, ON, N6A 3K7, Canada
c Department of Civil and Environmental Engineering, Colorado School of Mines, Golden, CO, 80401, USA
Keywords:
ABSTRACT We investigate the accuracy and robustness of moment tensor (MT) and stress inversion solutions derived from acoustic emissions (AEs) during the laboratory fracturing of prismatic Barre granite specimens.Pre-cut flaws in the specimens introduce a complex stress field,resulting in a spatial and temporal variation of focal mechanisms.Specifically, we consider two experimental setups: (1) where the rock is loaded in compression to generate primarily shear-type fractures and(2)where the material is loaded in indirect tension to generate predominantly tensile-type fractures.In each test, we first decompose AE moment tensors into double-couple (DC) and non-DC terms and then derive unambiguous normal and slip vectors using k-means clustering and an unstructured damped stress inversion algorithm.We explore temporal and spatial distributions of DC and non-DC events at different loading levels.The majority of the DC and the tensile non-DC events cluster around the pre-cut flaws, where macro-cracks later develop.Results of stress inversion are verified against the stress field from finite element (FE)modeling.A good agreement is found between the experimentally derived and numerically simulated stress orientations.To the best of the authors’ knowledge, this work presents the first case where stress inversion methodologies are validated by numerical simulations at laboratory scale and under highly heterogeneous stress distributions.
1.Introduction
Induced seismicity is a prevalent phenomenon in enhanced geothermal systems (EGSs), which has a negative effect on public opinion and has already led to the shutdown of geothermal projects.During the Deep Heat Mining Project in Basel,2006,and the Geothermal Project in St.Gallen, 2013, events with a local magnitude of ML=3.4 and 3.5 respectively were induced and felt by the public(Gaucher et al.,2015).Since heat transport is inefficient over large distances, viable geothermal systems are located near the point of end-use, which is generally the urban area (Moeck et al.,2016).Therefore, to enable a safe, sustainable, and worldwide accessible exploitation of this renewable energy,a detailed study of the induced seismicity, i.e.spatial and temporal distributions of events and how they relate to the local stress field, is of utmost importance(Gaucher et al., 2015; Kwiatek et al., 2015).
Due to the limited number of induced earthquakes for any given site,it is important to extract the maximum amount of information from the detected earthquakes.Specifically, microseismicity is often the only source of information on the spatial and temporal distributions of permeability enhancement in the subsurface, as well as indications of previously unknown fault structures.The former allows practitioners to better optimize their production scheduling, and the latter poses a grave concern for large induced seismic events.Earthquake source locations can provide information about the temporal and spatial distributions of pore pressure and stress variation, and moment tensors (MT) inversion can then be conducted to study the type-dependency of seismic events(Petruccelli et al., 2018).From the inverted MTs, slip and normal vectors of the earthquake focal mechanism can be computed to reveal the orientation and slip mechanisms near the production and injection sites.However, due to their interchangeability(Vavryˇcuk, 2014a), the two vectors are only separable when local stress information is provided.
Stress inversion is widely applied to the calculation of the local stress field using MTs (Michael, 1984; Hardebeck and Michael,2006; Li and Du, 2020) of regional-scale seismicity.However, one major limitation of these inversions is the assumption of stress homogeneity, which is generally unreasonable around boreholes,and natural and induced fractures which dramatically change the surrounding stress field.The damped and unstructured damped stress inversion methodologies (Hardebeck and Michael, 2006; Li and Du, 2020) attempt to circumnavigate this assumption by allowing the stress field to vary in space, but are homogeneous within an inversion node.In these studies, validity of stress inversion is tested against synthetic data since the true stress fields and normal-slip vectors are not available for comparison.One could construct a numerical simulation of the subsurface surrounding the field site.Nevertheless,these models do not account for the natural heterogeneity of geological features and thus only produce an average representation of the local stress field.However,in the case of laboratory rock fracturing experiments,the geometry and stress conditions are better constrained and the rock properties are more homogeneous, compared with the cases in field.It makes it easier to study the accuracy and robustness of stress inversion.Here, we use the recent work on unstructured damped stress inversion methods proposed by Li and Du (2020).
In this paper,the results of MT and stress inversion are verified against the stress field from finite element (FE) modeling.The verification is conducted on two sets of experiments: (1) An unconfined compression test by Moradian et al.(2016);and(2)A fourpoint bending test for indirect tensile fracturing by Li and Einstein(2017)on Barre granite.Section 2 describes the experimental setup from which the data are derived, the FE scheme used to verify the experimental solutions, as well as the MT and stress inversion algorithms.Section 3 compares the experimentally calculated and numerically simulated solutions, in the cases of tensile and shear fracturing in granite.To the best of the authors’knowledge,it is the first case where stress inversion methodologies are validated by numerical simulations at laboratory scale and under highly heterogeneous stress distributions.
2.Methodology
In this work, we consider the MT and subsequent stress inversion solutions of acoustic emission(AE)data acquired from two sets of experiments on Barre granite:(1)a uniaxial compression test on a specimen with pre-cut notches where micro-cracks are formed predominantly in shear(Moradian et al.,2016),and(2)a four-point beam-bending test where micro-cracks are formed more predominantly in tensile background stress(Li and Einstein,2017).The data used for analysis in this work come from Moradian et al.(2016)and Li and Einstein (2017).
In the compression test,a prismatic granite specimen with preexisting flaws was subjected to a gradually increased uniaxial compressive load.The specimen has a height of 152 mm,a width of 76 mm, and a thickness of 25 mm.As shown in Fig.1a, eight AE sensors were attached to the two sides of the sample.It is concluded by Moradian et al.(2016) that the test comprises eight levels, from cracks closure, linear elastic deformation to macrocrack coalescence and, eventually, failure.The seismic events analyzed here are restricted to the time range between Level 2 and Level 4 (i.e.linear elastic deformation, micro-crack initiation, and micro-crack growth), which is between 100 s and 900 s.Events at Level 1 partially come from changes in loading rate and are therefore excluded (Moradian et al., 2016).After Level 4, the assumptions that the rock sample is homogeneous, isotropic and linear-elastic for MT inversion and decomposition in this report are strongly violated.
The four-point bending test was conducted on a prismatic specimen prepared according to ASTM C1161-18 (2013).The specimen has a height of 51 mm,a length of 241.3 mm and a thickness of 25.4 mm.Distribution of AE sensors are shown in Fig.1b.An extensometer was additionally attached to the notch opening at the bottom of the specimen, and the experiment was operated under crack mouth opening displacement (CMOD) control at a constant rate of 0.0127 mm/min (Li and Einstein, 2017).For similar reasons as in the compression test, only seismic events that occur at the process zone development stage(from 209 s to 309 s)are analyzed(Li and Einstein, 2017).
In each of these tests,we monitored and analyzed AEs,known as emitted elastic waves caused by cracking or other dislocations.To determine AEs events from the continuous waveform data,we first picked arrivals on 3 ms duration recorded waveforms using a modified Akaike information criterion (AIC) (Akaike,1973; Maeda,1985; Li and Einstein, 2017), where the AIC is calculated in small(~0.1 ms) moving time windows to facilitate multiple detections per 3 ms waveform.Locations are determined from the minimization of residuals as outlined in Shearer (2009) using a constant velocity model and optimized by the fminsearch function in MATLAB.For both tests, the maximum location errors are 2 mm.This maximum error is enforced by considering the time residual between the modeled and measured travel times.For each event used in the later analysis, it is constrained that the time residual at less than four AE sensors has a misfit greater than 2 mm/3991 m/s ≈0.5 μs.The accuracy of this localization method has also been tested with the ball-drops on fixed locations(Moradian et al.,2016;Li and Einstein,2017).For each event,we can then invert for its MT which describes the kinematics of the AE.The derived information includes both the direction where the slip occurs(slip vector)and the normal vector of the plane that accommodates the slip.A plane strain condition is assumed and the MT inversion and decomposition are performed according to the two-dimensional (2D)implementation of the SIGMA algorithm(Grosse and Ohtsu,2008)by solving
where Csis the magnitude of the sensor response, A is the first motion amplitude recorded at the AE sensors, Reis reflection coefficient which describes the ratio of the amplitude in a half space to that of the infinite space,R is the distance from the source to the AE sensor,(r1r2)Tis the direction cosine vector pointing from the source to the AE sensor, and mijis the MT that describe the focal mechanism of the source.Also,the out-of-plane components of mijare determined by Grosse and Ohtsu (2008) as m33= ν(m11+m22), where ν is the Poisson’s ratio of the rock sample.The rest of the out-of-plane components of mijare assumed to be zero.
Following the decomposition method by Vavryˇcuk (2014b),events with a double-couple(DC)component greater than 50%are considered shear, while those with a DC component less than 50%are considered tensile or compressive non-DC (Li and Einstein,2017).Then, a non-DC event is determined to be tensile or compressive by whether it contains a positive (explosive) or negative (implosive) isotropic component, respectively.In the MT inversion, only relatively-accurate inverted events with the variance reduction larger than 0.8 are left for further study(Roumelioti et al., 2008).
Given the MT solutions,we then invert for the best-fitting stress field that explains the observed slip and normal vectors using the method outlined by Li and Du (2020).Specifically, the AE event locations are first clustered using a k-means algorithm (Hartigan and Wong, 1979), where the entire population of events is iteratively sub-divided until each final cluster has a population between Nmin= 10 and 2Nmin= 20.The optimal k for each subdivision iteration is automatically selected to minimize the number of events that fall into a subgroup containing fewer than Nminof events (Li and Du, 2020).Then, focal plane orientations are extracted from the eigenvectors of the MT, and we invert for the stress tensor which renders the extracted focal plane orientations most unstable while allowing the resolved stress tensor to vary between clusters.This is formulated by Li and Du (2020) as
where GALLis the data kernel that collects the individual kernels of all the clusters,D is the damping matrix containing information on the relative position of clusters, e is the user-selected damping parameter that describes the imposed degree of continuity between nodes, mALLis the vector of unknown stress tensor components of all clusters,and dALLis the data vector containing the slip directions of each focal mechanism inside all clusters.It can be referred to Li and Du(2020)for the detailed definition of each term and how e can be selected.
Note that the slip and normal vectors of the micro-crack are distinct from the eigenvectors of the MT,which are again distinct from the eigenvectors(principal directions)of the inverted stress tensor (Gephart and Forsyth,1984).In typical MT decomposition,there is ambiguity between the normal and slip vectors, which here is resolved by considering the fault slip potential of each normal-slip vector pair constrained by the inverted stress field,i.e.we consider the focal plane at a stress state closer to the Mohr-Coulomb failure envelope as the more likely failure plane (Vavryˇcuk, 2014a).The instability factorintroduced by Vavryˇcuk (2014a)is used to assess the likelihood of the failure, where μ is the internal friction coefficient of the rock, and τ and σ are functions of the local stress tensor and the orientation of the focal plane.If we then conduct a grid search for possible friction angles, we additionally obtain a best-fitting friction angle for the given dataset.The friction angles φ = tan-1μ for the compression and bending tests are determined as 36°and 38°, respectively, corresponding to a friction coefficient μ of 0.72 and 0.79.
With the employed stress inversion techniques, the eigenvectors and stress ratio R = (σ1-σ2)/(σ1-σ3)are obtained,where σ1,σ2,σ3are the eigenvalues of the stress tensor.σ1is the largest while σ3is the smallest.With the 2D setup in the experiments and the plane strain assumptions in stress inversion,R is poorly constrained(Vavryˇcuk et al.,2015).Nevertheless,eigenvectors can be compared with the results of FE modeling.An open source FE package deal.ii is used for such computation (Arndt et al., 2020) assuming homogeneity, isotropy and linear elasticity, which is consistent with the loading levels in the two experiments(Moradian et al.,2016;Li and Einstein, 2017).The constitutive equation of the materials can be written as
where λ (= 28.6 GPa) and G (= 6.84 GPa) are the two Lamé parameters,ijis the strain tensor, and δijis the Kronecker delta.Tensile stress is set positive.To accommodate stress concentration around the flaws,at the four corners in Fig.1a and the loading point in Fig.1b, the locally refined meshes have been created.
For boundary conditions in the compression test, left and right boundaries are set to be free,while the vertical displacement of the bottom face is set to zero.The load is applied by setting a uniform displacement in the vertical direction(y)at the top.Furthermore,in the test, the top and the bottom faces of the rock are confined by frictional force.Therefore, to model this effect, the horizontal (x)displacements on both faces are also set to zero.In the four-point bending test, two distributed forces are applied at the top of the specimen (denoted by the green arrows and the blue rectangles)and the two hinges at the bottom are set by fixing the displacement of the local nodes(denoted by the yellow triangles).
3.Results and discussion
In both tests,most events are distributed near the pre-cut flaws and the stress field is also most heterogeneous.This makes events in these regions most interesting for MT and stress analysis.In this section,therefore, the study is focused on regions around the precut flaws.
3.1.Events distribution over time and space
With the selection criteria mentioned in Section 2,340 and 326 events are left for stress inversion in the compression and bending tests, respectively.The focal mechanisms of these events are illustrated in Fig.2.Compared to the wider extension of the density plot to the DC region in Fig.2a, events in the bending test are more strongly focused in the tensile quarter of the plot.
The spatial distribution of different types of events is shown in Fig.3.As mentioned earlier, events are particularly focused on the regions around the notch tips of the pre-cut flaws.This corresponds well to the macro-cracks observed at the beginning of“macro-crack initiation”stage in the compression test and at the end of“process zone development” stage in the bending test.Also, event distribution in both experiments is consistent in the sense that no compressive non-DC is present around the flaws and is therefore not shown in Fig.3.This is closely related to the stress field that will be further discussed.
The accumulated numbers of different types of events are shown in Fig.4.In the compression test(Fig.4a),the rock sample is subjected to linear elastic deformation before around 450 s (the vertical black dashed line), while micro-cracks grow stably afterward (Moradian et al., 2016).It is found here that numbers of DC events and tensile non-DC events increase faster at the “microcrack stable growth” stage than at the “linear elastic deformation”stage,which is consistent with the overall event-accumulation rate change between the two stages (Eberhardt et al., 1998, 1999;Moradian et al., 2016).
In the bending test(Fig.4b),the time interval between 209 s and 309 s corresponds to the “process zone development” stage.According to the digital image correlation (DIC) results (Li and Einstein, 2017), a zone of significant opening strain around 2 mm from the crack tip is observed since 259 s.Meanwhile,an increase in the accumulation rate of AE events is also found.It is also noted that DC events still dominate in the bending test.This can be the evidence that tensile cracks at the macro-scale nevertheless initiate as shear micro-cracks at the grain-scale, i.e.grains must slide between each other even when overall creating tensile cracks(Wong and Einstein, 2009; da Silva and Einstein, 2018; Einstein,2021).
3.2.Method verification using FE modeling
FE modeling is employed as the benchmark for verifying the inverted stress field.The computed stress fields are shown in Fig.5.The stress in both experiments is heterogeneous around the notches.In the compression test, regions of strong shear stress radiate from notch tips.Large positive principal stress and low shear stress are distributed around two notches parallel to their longer edges.In the bending test,large tensile and shear stress are majorly focused around the notch.The stress field also features a clear “Y" shaped low shear stress zone above the notch tip.While both experiments feature large shear and tensile stress around the flaws, their relative amplitudes are different.In the compression test,shear stress is generally larger than the principal tensile stress whereas the latter is more than two times larger than the shear stress in the bending test.This corresponds to the extension of the density Hudson plots in the DC region in Fig.2a.
A good correlation is observed between the computed stress field and the type of events in Fig.3 for both experiments.It is consistent with the FE stress field in Fig.5 that no compressive non-DC event is detected around the notches in Fig.3a and b for the compression test.The DC events around two notches correspond to the shear lobes in Fig.3a.There is also a tendency that more DC events in Fig.3a occur in the tensile region(shaded in red)than in the compressive region(shaded in blue)in Fig.5b.The explanation is that,at the same level of shear stress,higher compressive stress will pull the Mohr’s circle farther away from the Mohr-Coulomb failure envelope.Similarly, as indicated by the high tensile and shear stress radiating from the notch, numerous events are detected in the bending test’.
In the process of stress inversion, the internal friction angle is optimized as described in Section 2.However, the friction properties can be locally heterogeneous across the sample.To check how this may influence the inversion, the sensitivity of the instability factor to the friction coefficient is studied as shown in Fig.6.As the friction coefficient vary between 0.6 and 0.8, the changes to the instability factor of both planes are rather small.In more than 95%of the clusters, the relative amplitudes of the instability factors between Plane 1 and Plane 2 do not change with the choice of different friction coefficients.
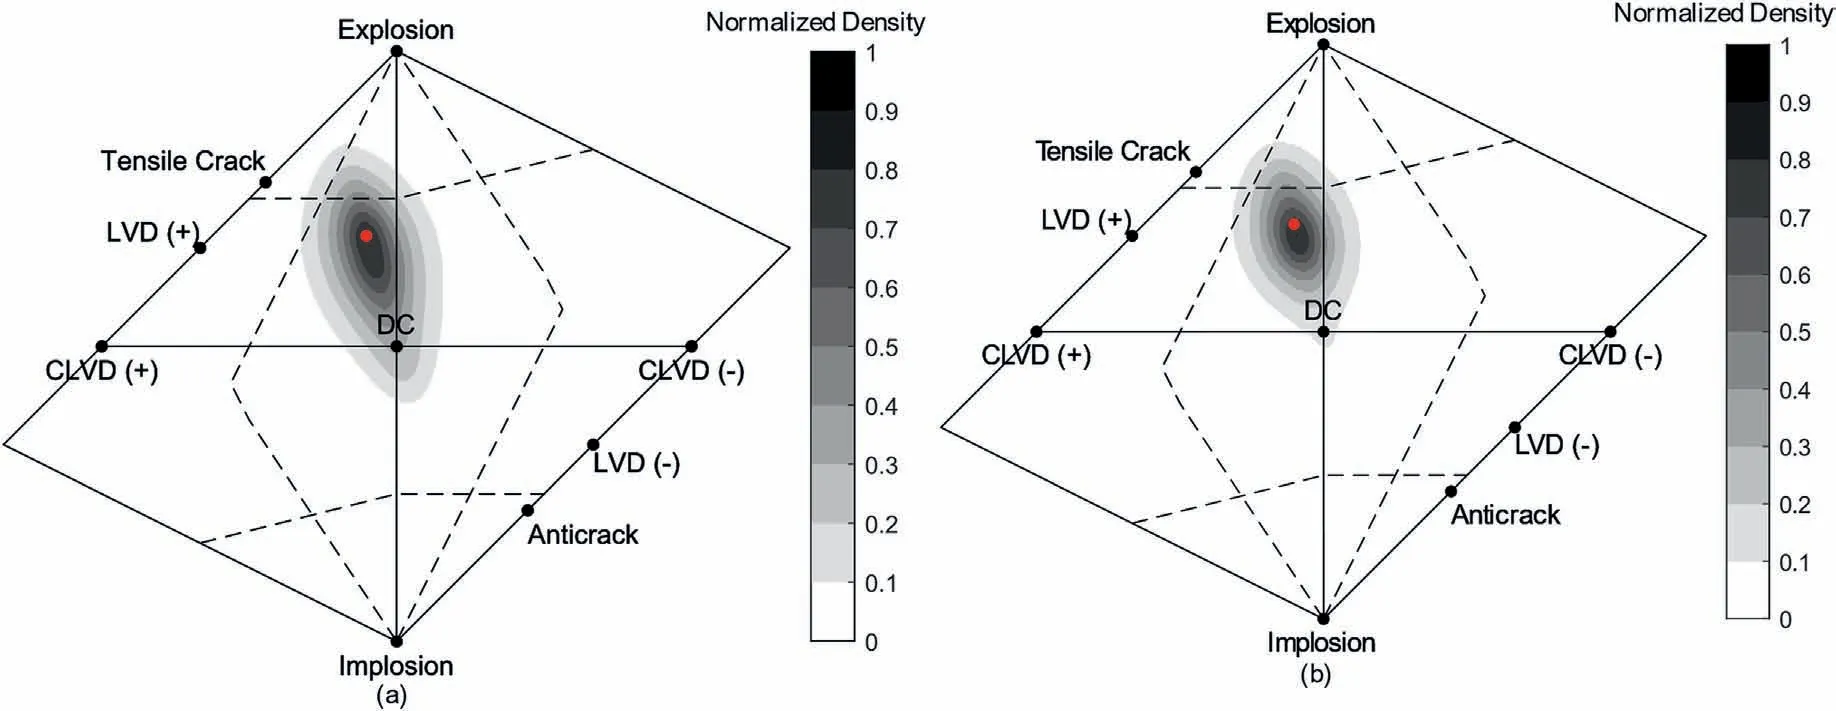
Fig.2.Hudson plots that show the focal mechanisms of events in (a) compression and (b) bending tests.The color from white to black shows the normalized number density of event types on the Hudson plots.The red dots in each subplot mark the location of an event with DC component equal to 50%.CLVD is short for compensated linear vector dipole.
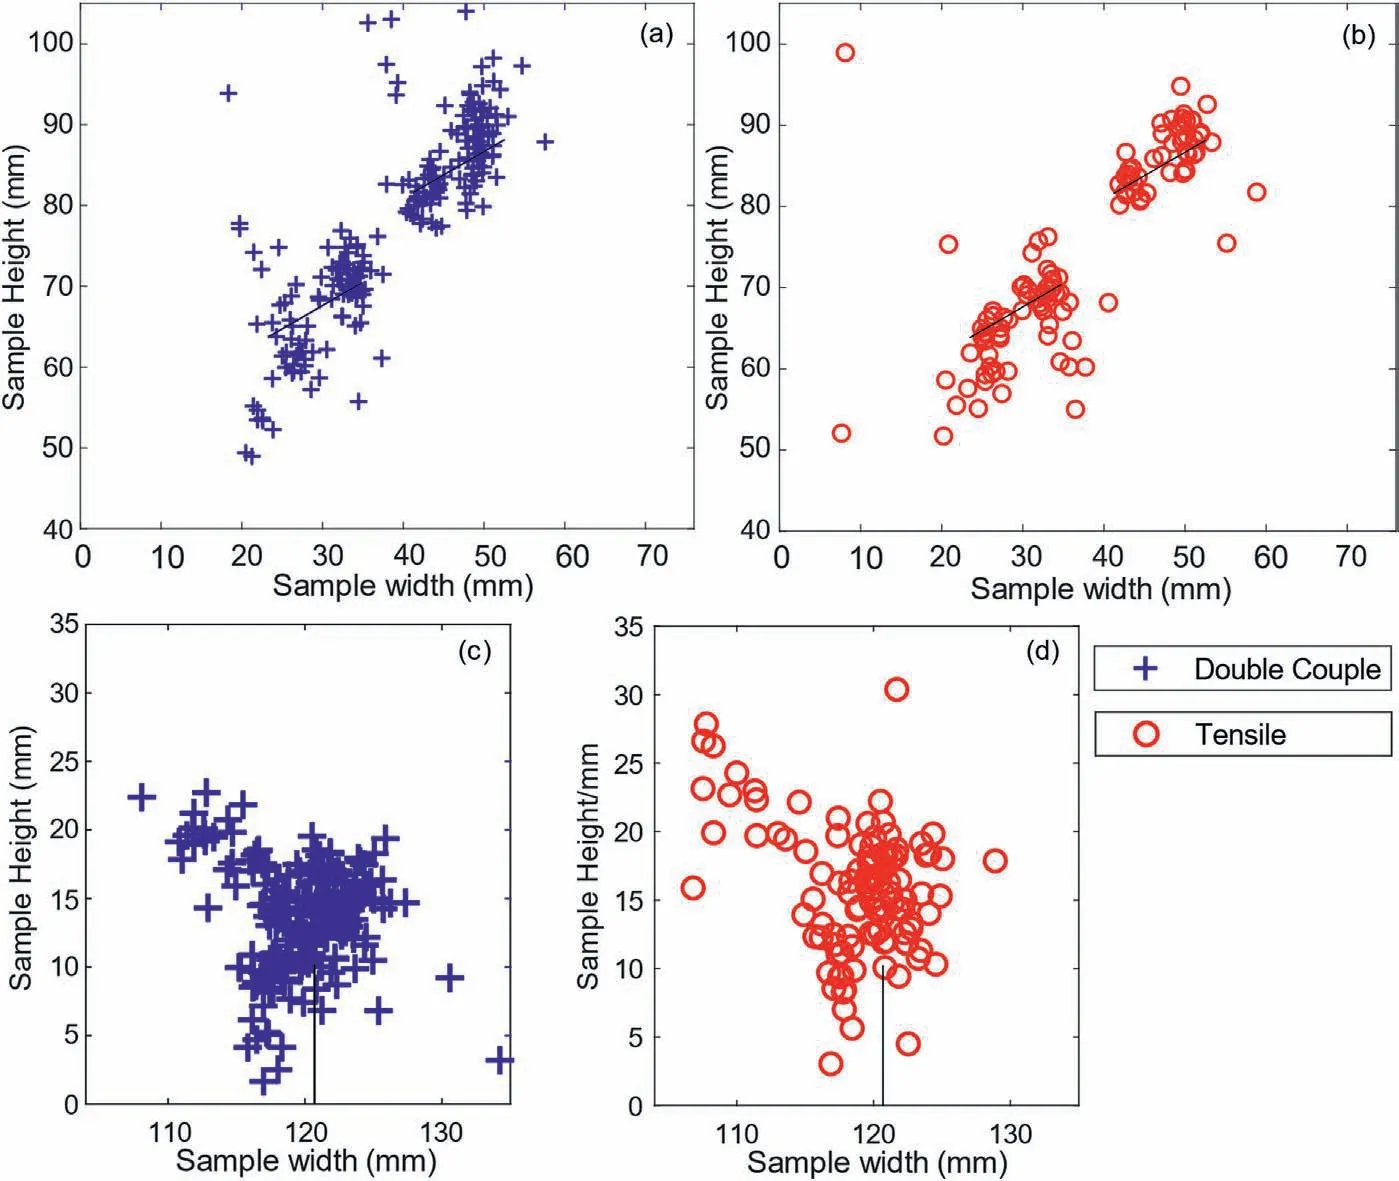
Fig.3.Distribution of different types of events(a and b) at the end of the “micro-crack stable growth” stage in the compression test and (c and d) that at the end of the “process zone development” stage in the bending test.
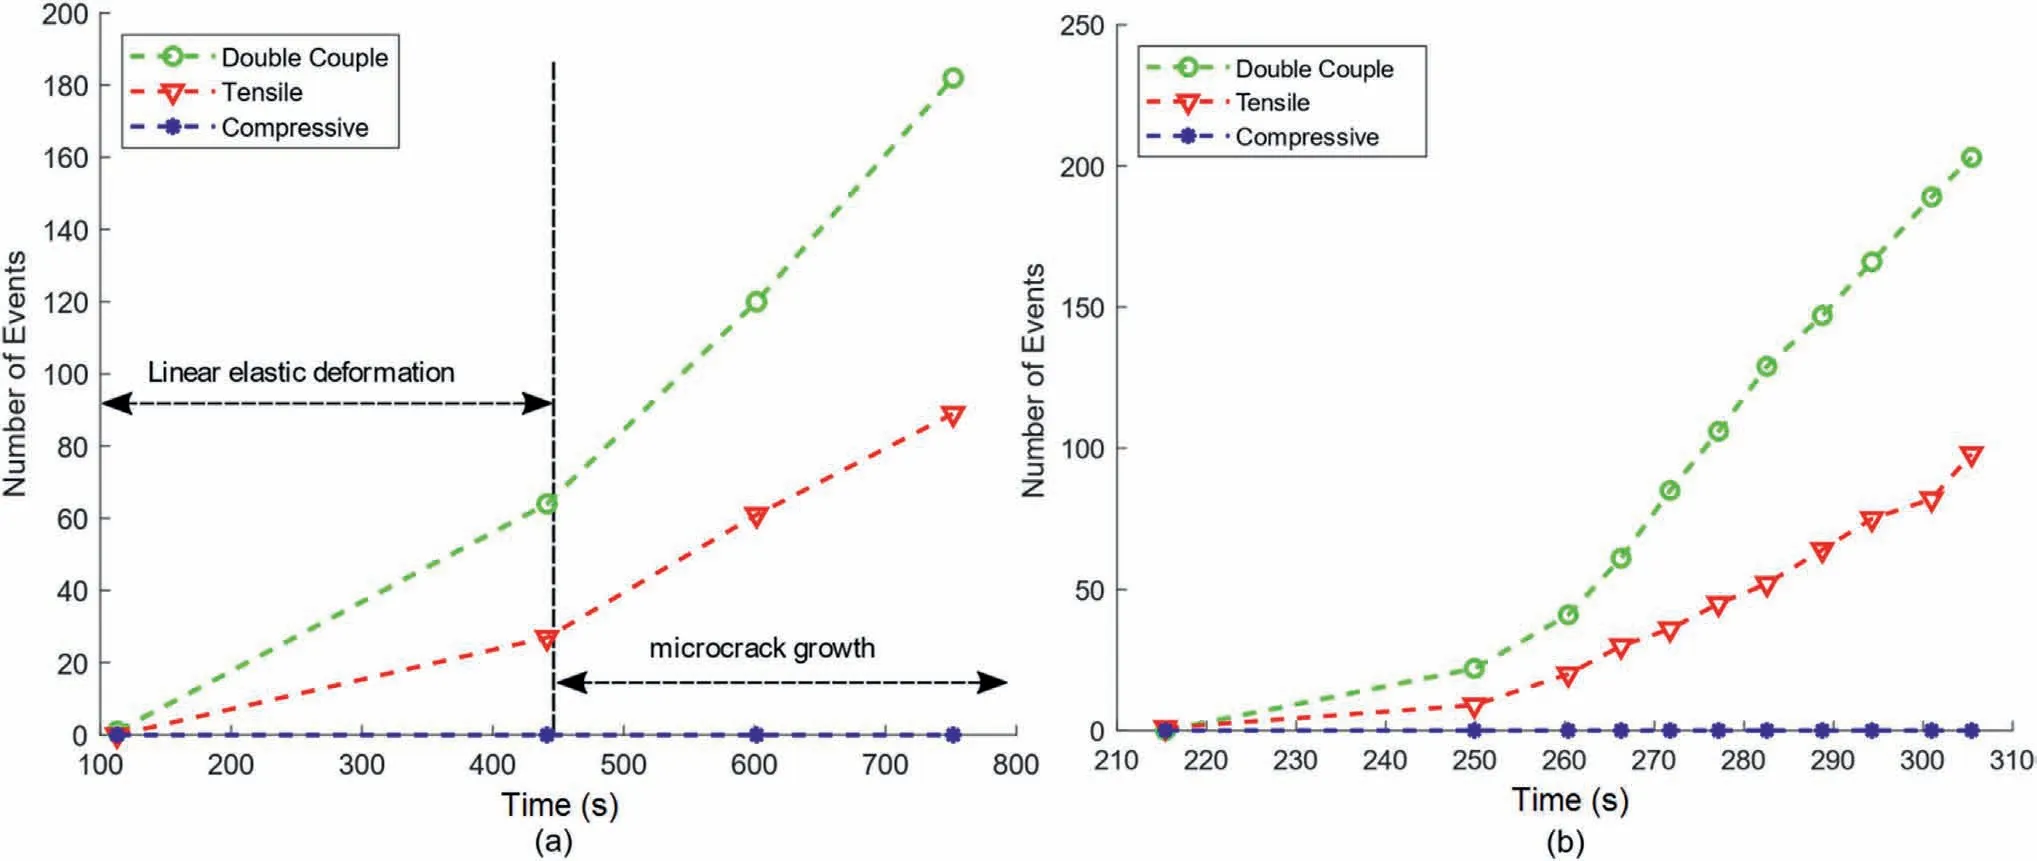
Fig.4.Temporal evolution of accumulated number of different types of events for (a) compression and (b) bending tests.DC events still dominate in the bending test.
The stress inversion results are shown in Fig.7.In the compression test,most black arrows are oriented almost vertically,corresponding to the compressive load at the top and the bottom boundaries.As to the bending test,the orientations of the inverted stress field also match the loading scheme, with the principal vectors of the larger(more tensile)principal stress in the x-y plane(grey arrows)oriented almost horizontally.
The inverted stress orientation of each cluster is compared with the results from FE modeling.The events in one cluster are distributed in an area of around 1-3 mm in radius, roughly representing the level of heterogeneity that can be resolved.With this in mind,the FE stress field is also averaged in a circular region with a radius of 3 mm for comparison.Normal vectors of weak planes, defined according to the Mohr-Coulomb criterion and predicted by the FE stress field (black arrows) and the inverted stress field(grey arrows),are compared only around the two flaws.In Fig.8, orientations of the two stress fields are generally consistent for both experiments.Statistically, orientation differences between the two stress fields in 80%(Fig.8a and b)and 90%(Fig.8c)of the clusters are smaller than 15°.
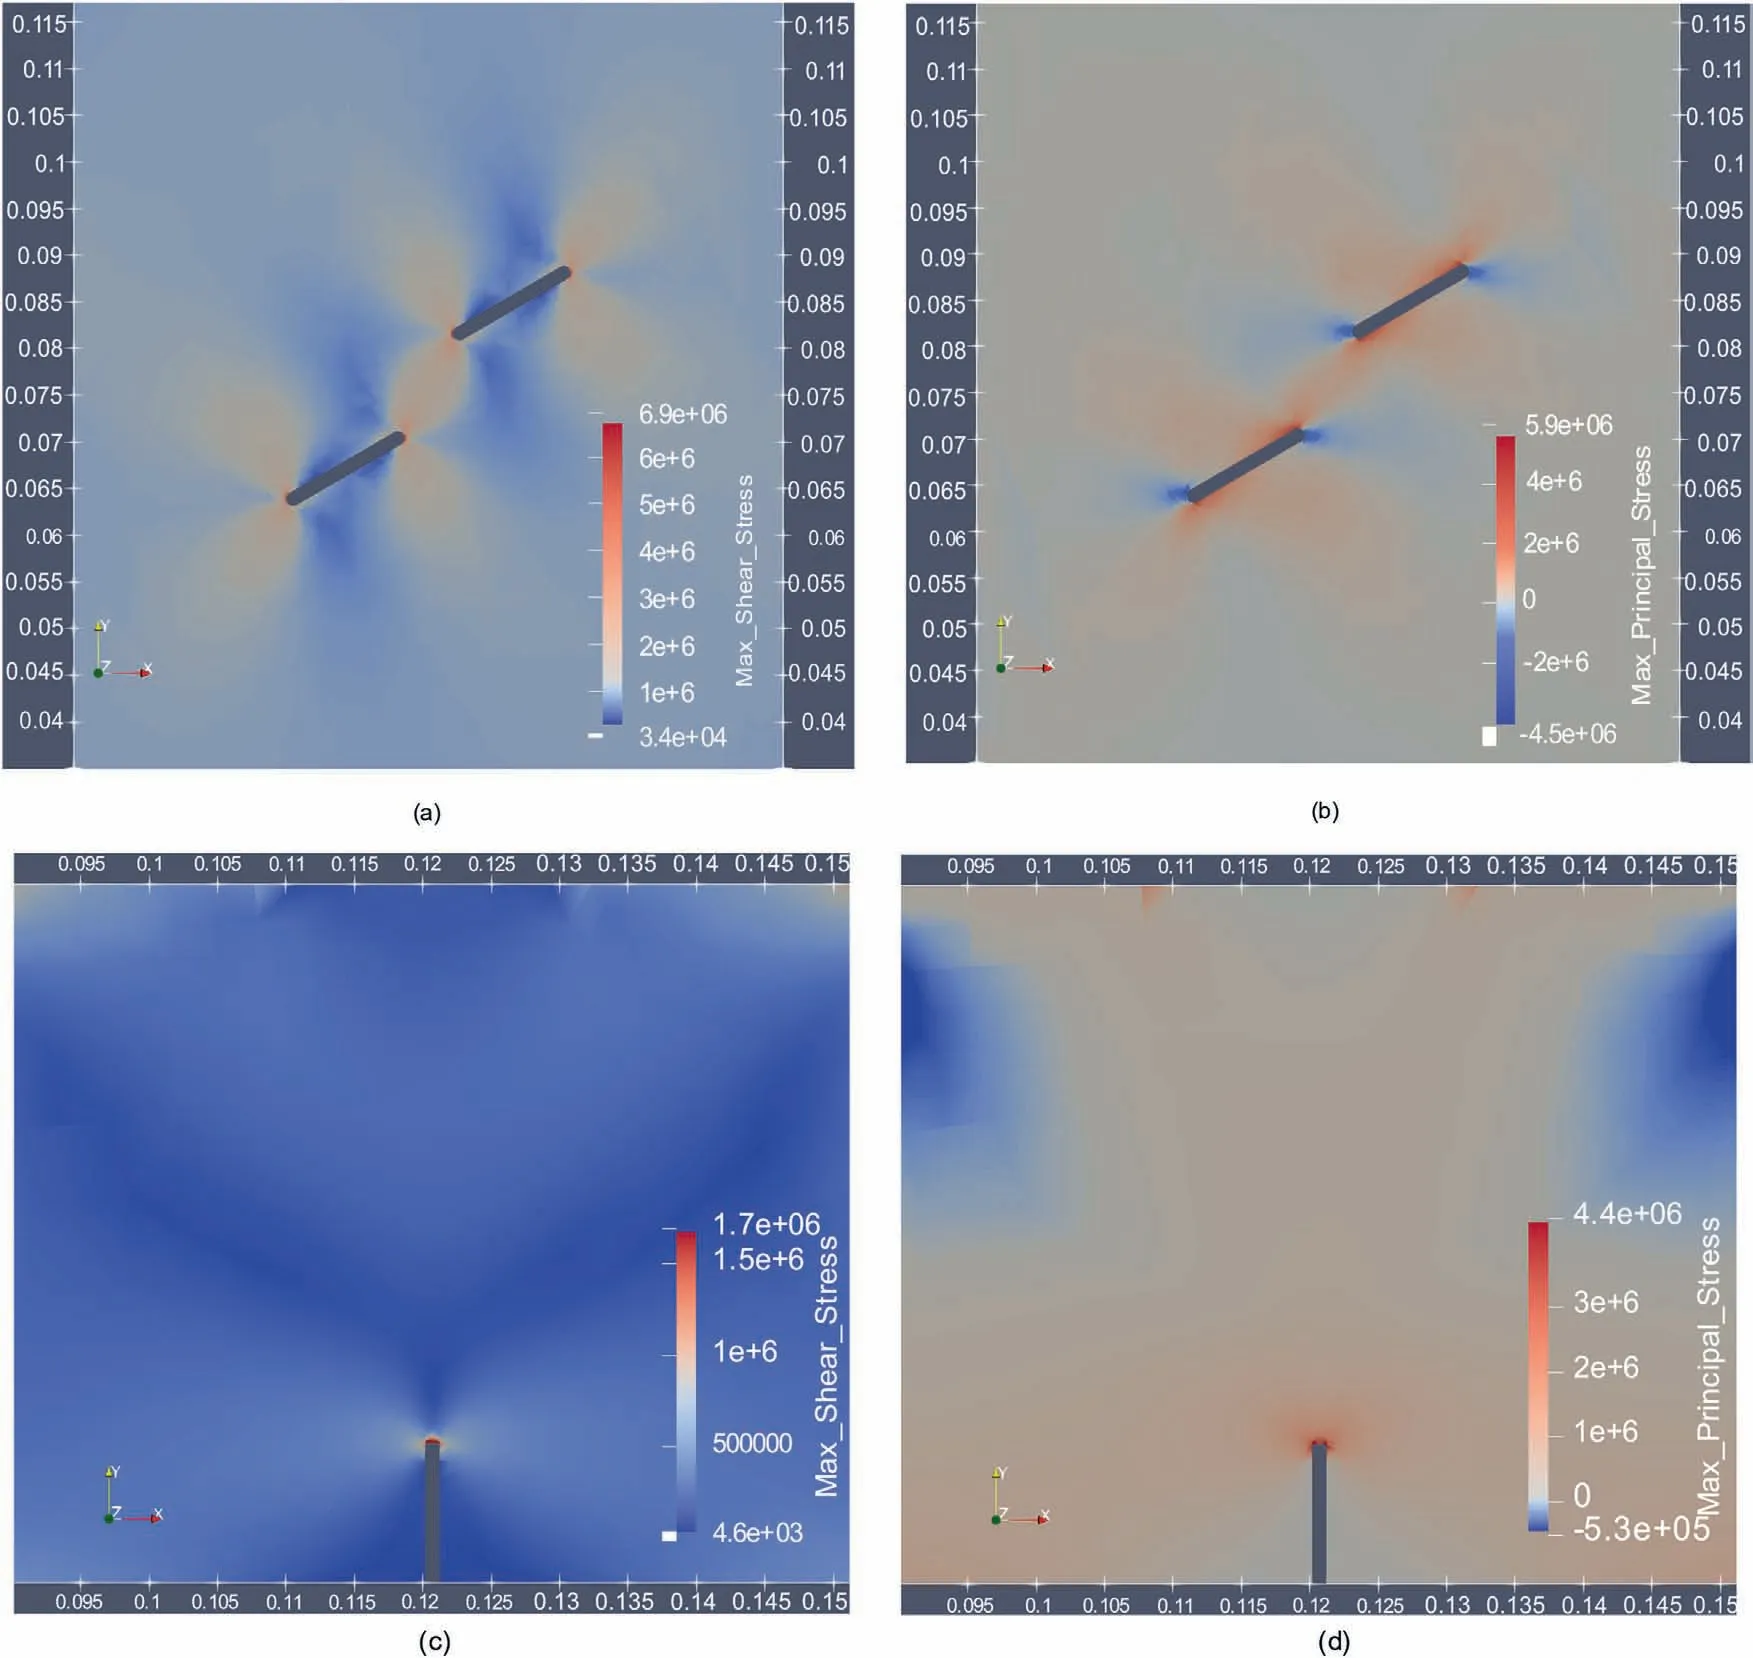
Fig.5.Stress field obtained from FE modeling for both experiments.For compression test,the distributions of(a)the maximum shear stress and(b)the maximum principal stress are shown.And for bending test, the distributions of (c) the maximum shear stress and (d) the maximum principal stress are shown.Unit of stress: Pa.
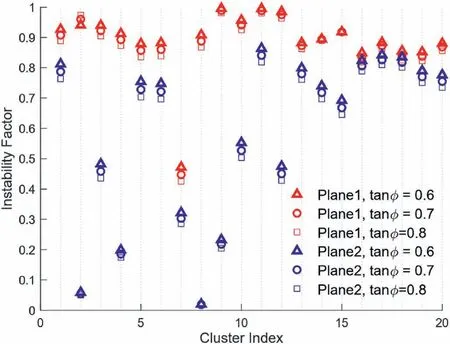
Fig.6.Influence of the friction coefficient tan φ on the instability factors for the two possible weak planes in the compression test.
In conclusion, the results of FE modeling confirm the effectiveness of MT inversion and stress inversion results in a highly heterogeneous stress field in regions with complex geometries in the present study.
3.3.Normal-slip vector decomposition
With the inverted stress field, the normal vector of each event from MT inversion can be determined with the instability factor defined by Vavryˇcuk (2014a).In Fig.9, all the normal vectors are shown in grey arrows.The angles of normal-vector-orientations are transformed in the range between 0°and 180°.Results in the compression test are again shown only around the two flaws(Fig.9a and b).It can be observed that while normal vectors are predominantly oriented about 135°around the left flaw, most normal vectors around the right flaw are distributed about 30°.A similar distribution of the orientations is also observed in the bending test.In this case, the predominant orientations are about 30°and 150°.The normal vectors of AE events can indicate the orientations of local micro-cracks.The existence of the major directions means that numerous sub-parallel micro-cracks occur around the two flaws.
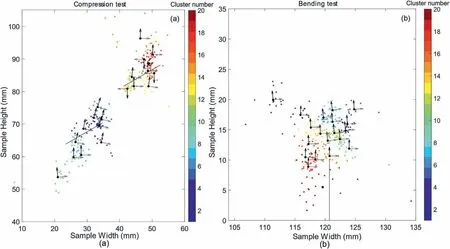
Fig.7.Stress field obtained from stress inversion for (a) compression and (b) bending tests.The black and grey arrows illustrate the orientations of the principal vectors of the smaller(more compressive)and the larger(more tensile)principal stress in the x-y plane.Clusters of events in stress inversion are shown at the same time with colored dots.Events in the same cluster are also plotted in the same color.
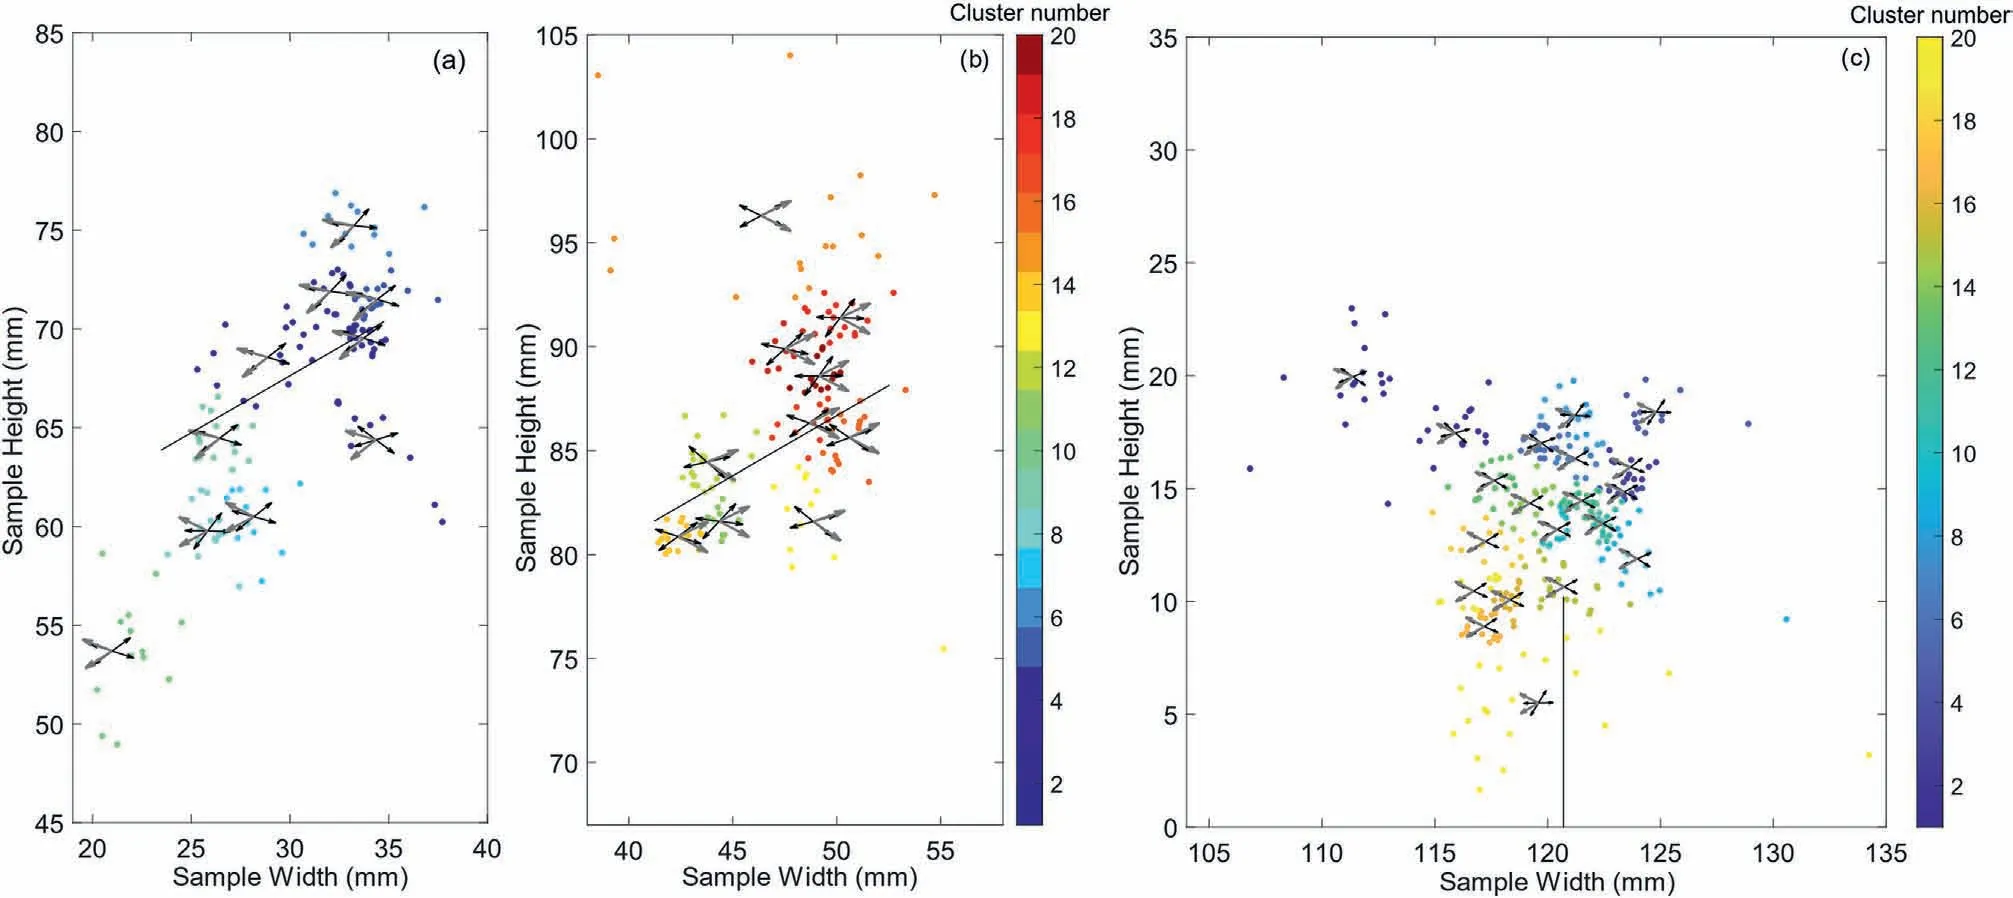
Fig.8.Normal vectors of weak planes,according to Mohr-Coulomb criterion with an internal friction angle of 36°,predicted by FE stress field(black arrows)and inverted stress field(grey arrows).(a)and(b)are the left and the right pre-cut flaws of the compression test,respectively;whereas(c)shows the normal vectors of weak planes around the pre-cut flaw in the bending test with a friction angle of 38°.
For the compression test, photographs of the specimen at the end of the micro-crack growth stage(Moradian et al.,2016),which is around 900 s, are overlaid with inversion results; While for the bending test,the DIC image around the crack tip is overlaid with the inversion result.The macro-cracks observed in photographs or DIC image propagate almost vertically at large-scale and are not perpendicular to the major orientations of the normal vectors.However, the propagation of the macro-cracks is accompanied by the development of conjugate en-echelon micro-cracks, which is related to the micro-structures of the rock grains.Some parts of the cracks are perpendicular to the major directions of normal vectors.This may indicate that the inverted normal vectors can reflect some micro-structures of the rock sample.Additionally, both inner flaw tips in the compression test have a concentration of micro-cracks that are parallel to the flaw.This may be indicative of spalling at these locations.It is also noted that the comparison also shows a process zone that is 2-3 mm away from the observed macro-cracks at the right tip of the pre-cut flaw in Fig.9b.This is related to the localization errors of around 2 mm with a slight increase due to the generation of micro-cracks.
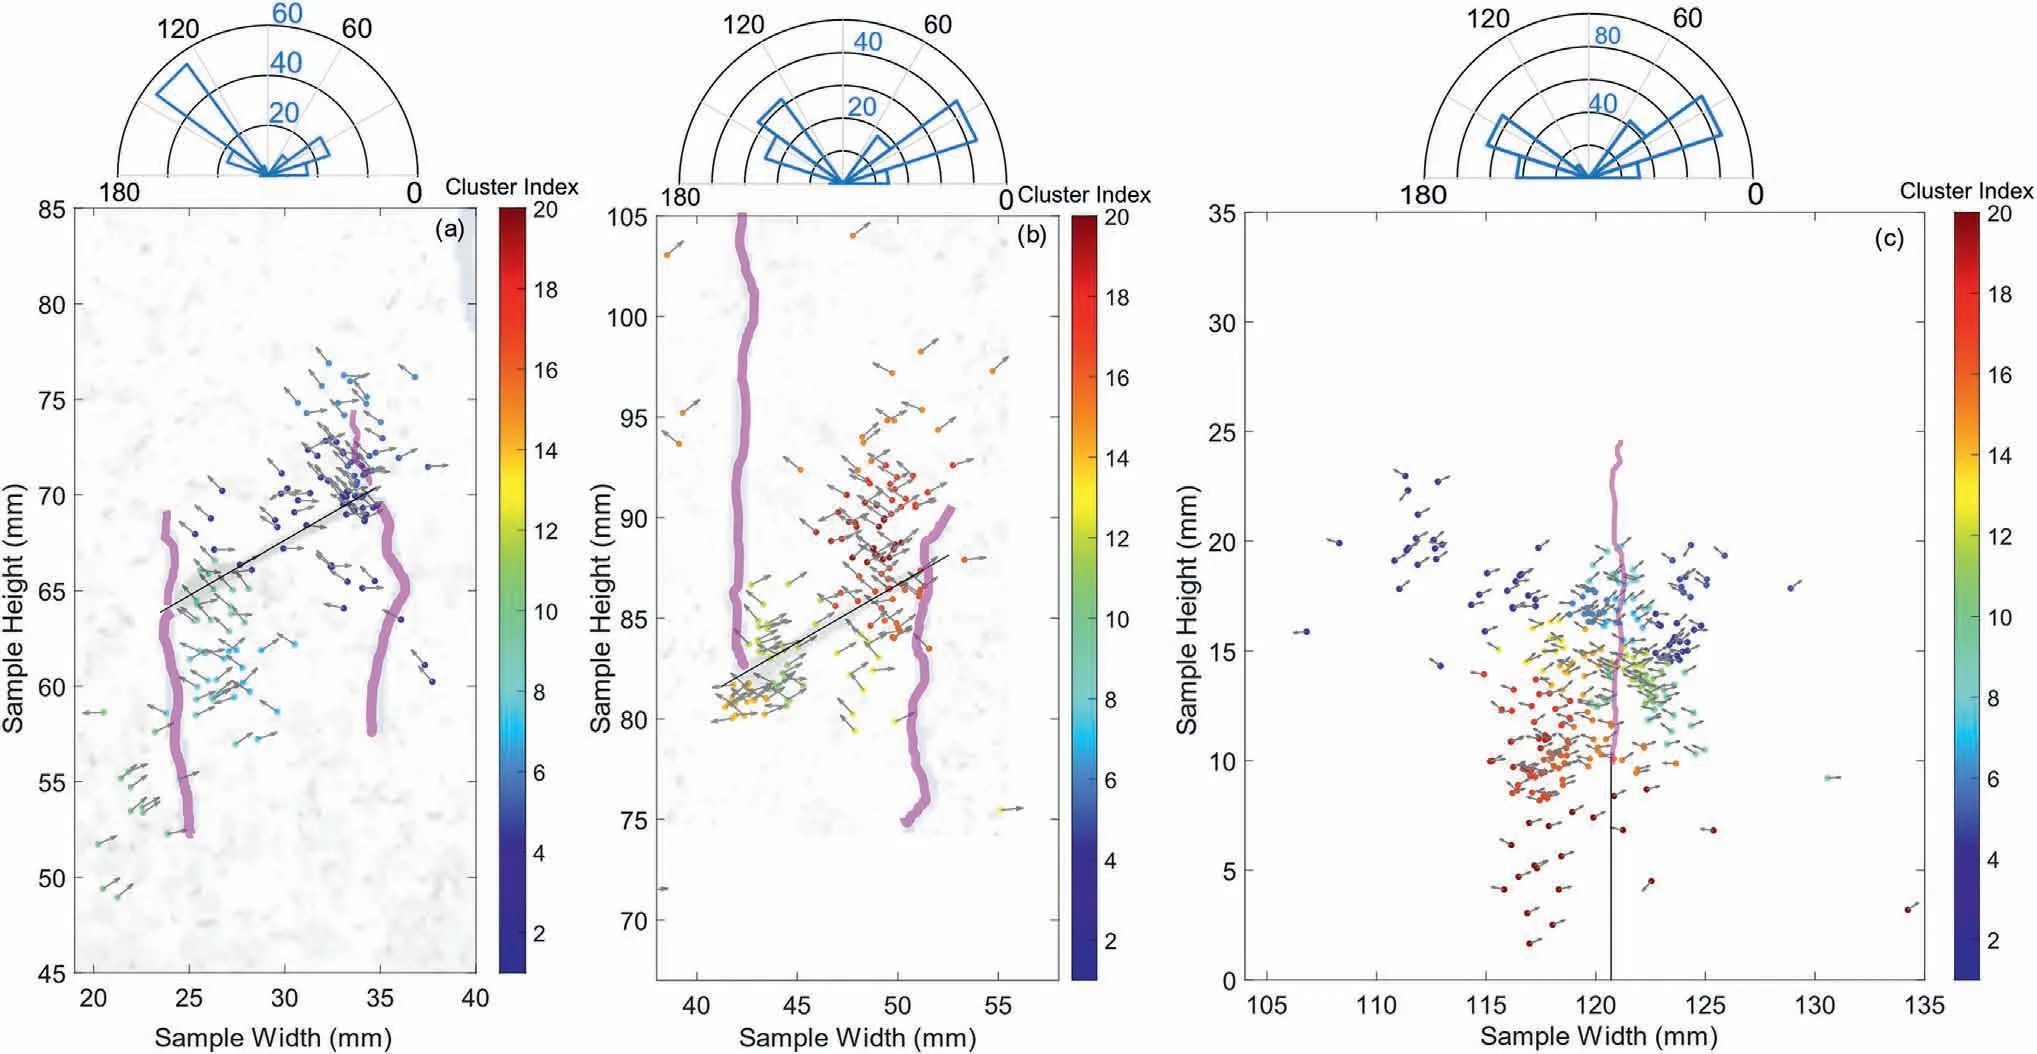
Fig.9.Normal vectors (grey arrows) of each event determined with stress inversion and Mohr-Coulomb criterion, with (a) and (b) an internal friction angle of 36° for the compression test and(c)a friction angle of 38° for the bending test.Colored dots are the location of each event.Events in the same cluster are plotted in the same color.The pink curves at the tips of initial flaws in (a), (b) and (c) are macro-cracks observed in the experiment (Moradian et al., 2016; Li and Einstein, 2017).The rose diagram shows the distribution of the normal-vector-orientations in each subfigure.The angle between 0° and 180° are divided into ten equally-spaced bins and the blue numbers are the scales for the counts inside each bin.
4.Conclusions
With analysis in the above sections, the following conclusions on the seismicity and stress field in granite rock sample in the uniaxial compression and bending tests can be drawn:
(1) By comparing with FE modeling results, methods used for MT inversion and stress inversion can give creditable locations and orientations of seismic events even in highly complex stress fields.In the two experimental setups, it is estimated that the stress heterogeneity within an area of 3 mm in radius can be resolved.
(2) Focal mechanisms of seismic events in the uniaxial compression and bending tests show different features.In the “linear elastic deformation” and the “micro-crack stable growth”stages of the uniaxial compression test,only DC and tensile non-DC events occur around the two flaws.There is also a tendency that more DC events occur in the tensile region around the two pre-cut flaws.In the bending test,almost all events occur around the tip of the notch opening and are of DC or tensile non-DC types.The types of events agree with the stress field computed from FE modeling.
(3) In the compression test,from the“linear elastic deformation”stage to the “micro-crack stable growth” stage, the increase of events’ occurrence rate comes from the faster increase of DC and tensile non-DC events.In the bending test,the crack propagation at the tip of the notch opening is accompanied by the acceleration of occurrence rate of both DC and tensile non-DC events.
(4) The existence of the major normal-vector-orientations means that numerous sub-parallel micro-cracks occur around the two flaws.These orientations of the events may be related to the micro-structures of the rock sample.
The work presented here sheds lights on a metric to estimate the heterogeneous stress field inside a rock sample, which is hard to access.
Declaration of competing interest
The authors declare that they have no known competing financial interests or personal relationships that could have appeared to influence the work reported in this paper.
Acknowledgments
The results of this paper are from the tests conducted at Massachusetts Institute of Technology (MIT) by Bing Li and Omid Moradian.We would like to thank Prof.Herbert H.Einstein from MIT for his helpful discussions and comments.We are also grateful to the chair of the Engineering Geology group,Department of Earth Sciences,Swiss Federal Institute of Technology(ETH)Zurich.Zihua Niu would like to additionally acknowledge the ETH Zurich Excellence Scholarship and Opportunity Programme Office for supporting his study with the Master Scholarship Programme (MSP).
 Journal of Rock Mechanics and Geotechnical Engineering2023年10期
- Journal of Rock Mechanics and Geotechnical Engineering的其它文章
- Analytical solutions for the restraint effect of isolation piles against tunneling-induced vertical ground displacements
- Characterizing large-scale weak interlayer shear zones using conditional random field theory
- Displacement-based back analysis of mitigating the effects of displacement loss in underground engineering
- Investigation of long-wavelength elastic wave propagation through wet bentonite-filled rock joints
- Mechanical properties of a clay soil reinforced with rice husk under drained and undrained conditions
- Evaluation of soil fabric using elastic waves during load-unload
