Characterizing large-scale weak interlayer shear zones using conditional random field theory
Gng Hn, Chunqing Zhng, Hemnt Kumr Singh, Rongfei Liu, Gun Chen,Shuling Hung,*, Hui Zhou, Yuting Zhng
a Key Laboratory of Geotechnical Mechanics and Engineering of the Ministry of Water Resources, Changjiang River Scientific Research Institute, Wuhan, China
b State Key Laboratory of Geomechanics and Geotechnical Engineering, Institute of Rock and Soil Mechanics, Chinese Academy of Sciences, Wuhan, China
c University of Chinese Academy of Sciences, Beijing, China
d Department of Petroleum Engineering and Geoengineering, Rajiv Gandhi Institute of Petroleum Technology, Jais, Amethi, 229304, India
e State Key Laboratory of Water Resources and Hydropower Engineering Science,Institute of Engineering Risk and Disaster Prevention,Wuhan University,Wuhan,430072, China
f Institute for Risk and Reliability, Leibniz Universität Hannover, Hannover, 30167, Germany
Keywords:
ABSTRACT The shear behavior of large-scale weak intercalation shear zones (WISZs) often governs the stability of foundations, rock slopes, and underground structures.However, due to their wide distribution, undulating morphology, complex fabrics, and varying degrees of contact states, characterizing the shear behavior of natural and complex large-scale WISZs precisely is challenging.This study proposes an analytical method to address this issue,based on geological fieldwork and relevant experimental results.The analytical method utilizes the random field theory and Kriging interpolation technique to simplify the spatial uncertainties of the structural and fabric features for WISZs into the spatial correlation and variability of their mechanical parameters.The Kriging conditional random field of the friction angle of WISZs is embedded in the discrete element software 3DEC,enabling activation analysis of WISZ C2 in the underground caverns of the Baihetan hydropower station.The results indicate that the activation scope of WISZ C2 induced by the excavation of underground caverns is approximately 0.5-1 times the main powerhouse span, showing local activation.Furthermore, the overall safety factor of WISZ C2 follows a normal distribution with an average value of 3.697.
1.Introduction
Large-scale weak interlayer shear zones (WISZs) are widely distributed in rock masses.Many engineering projects related to dam foundations, underground structures, tunnels, and slopes are located on or within rock masses with WISZs.WISZs are regarded as the most dangerous potential slip surfaces or damage zones in an engineering rock mass (Indraratna et al., 2014; Duan et al., 2021;Han et al., 2021a).Existing literature states that WISZ is a type of infilled weak discontinuity.It can be expressed in different ways,such as weak interlayer,interlayer shear zone,argillized interlayer,and fault fracture zone (Han et al., 2021b).In the past few years,many researchers (Xu et al., 2012; Indraratna et al., 2014; Zhao et al., 2017; Duan et al., 2021; Han et al., 2021b, 2021c) studied the physical and mechanical characteristics of WISZs by considering various influencing parameters such as the thickness of the interlayers, underground water conditions, and roughness.Additionally, by combining field data and experimental findings, some researchers have significantly improved our understanding of complex WISZ occurrences.WISZs were classified through grain size distribution by Wang et al.(1983)and Xiao and Argelov(1991),and other researchers such as Xu and Zhou(2010)characterized the complicated occurrences of WISZs based on the development degree,nature fracture,and genesis.However, the quantitative characterization of the complex occurrences does not appear to have received sufficient attention over time.In the present study, complex and large-scale WISZs in the Baihetan dam areas are investigated,and an analytical method of quantitative characterization of the complicated structures and fabrics of WISZs is proposed.
Over the years, the understanding of particular engineering problems has gradually increased from practical knowledge to rational knowledge due to the enrichment and development of engineering experience, geological exploration information, application of geophysical logs in geotechnical investigation, and theories.The description of engineering problems has evolved over time from rough to fine.At the macroscopic level, WISZs have good connectivity and a broad and distinct distribution location.Therefore,many researchers have assumed WISZs to be homogeneous materials that can be simplified as an infilled structural plane(without fluctuation)with uniform thickness(Pellet et al.,2013;Ma et al.,2019;Han et al.,2021b).However, with more and more research on WISZs over the years, the effect of complicated spatial occurrence characteristics(such as large distribution, undulating morphology, complicated fabric, and various contact state) on their mechanical properties is attracting attention(Xu et al.,2012;Singh and Basu,2018;Han et al.,2021a).Therefore, if the homogeneous assumption of WISZs is still under consideration during the characterization of complex and large-scale WISZs, it would probably induce inaccuracy in the mechanical properties assessment by engineers or researchers for new or existing projects.The complete integration of geological field data with experimental test results to accurately characterize the complex occurrence of WISZs has a vital significance in rock engineering.However, it is hard to find any relevant research considering the stated issue.Geomaterials are a class of complex natural building materials, and their physical and mechanical properties are highly heterogeneous.According to existing literature,statistical analyses of physical and mechanical parameters for rock and soil masses do not exhibit completely random distributions.Instead, they often follow specific statistical laws,such as spatial variability and correlation of mechanical parameters (Vanmarcke, 1977; Phoon and Kulhawy,1999; Lloret-Cabot et al., 2012).Based on these studies, this article characterizes the complex occurrence characteristics of WISZs in structure and fabric as non-uniformity in mechanical parameters,specifically the spatial variability and correlation of mechanical parameters.The stochastic mathematical theory can be used to express the spatial variability and correlation of the mechanical parameters.Using stochastic mathematical theory,an analytical method needs to be developed to describe the complex occurrence characteristics of WISZs in terms of fabric and structure.
At present, the most commonly used random mathematical models are the random variable model and the random field model(Vanmarcke,1977).In the random variable model,rock parameters are considered as random variables that obey a specific probability distribution.The characteristic quantities of the corresponding probability distribution model are determined using the probability statistical method based on discrete data points.Vanmarcke(1977) proposed a random field model by combining probability and statistical methods to describe the randomness of geotechnical parameters.The randomness of geotechnical parameters is reflected in two aspects: spatial variability and spatial correlation.Geotechnical parameters can differ in nature depending on their spatial location, and this phenomenon is known as spatial variability.It is defined by specific quantities, such as mean value,variance, correlation distance, and correlation function.The term“spatial correlation” describes the type of spatial correlation that exists between various geotechnical factors.The correlation function links the uncertainty of “point” and “space” together.
The random field model can describe the spatial variability and correlation of geotechnical parameters.However, it fails to make complete use of the spatial location information of geotechnical parameters,which generally overestimates the spatial variability of geotechnical parameters(Phoon and Kulhawy,1999).The randomly generated geotechnical parameters in the random field model often differ significantly from values at the actual spatial location.To solve this issue, a random field model that correctly characterizes the geotechnical parameters based on site information has been developed in the past few years using interpolation techniques and the Bayesian method (van den Eijnden and Hicks, 2011;Firouzianbandpey et al.,2015;Li et al.,2016;Liu et al.,2017;Lo and Leung,2017; Cai et al.,2019; Qi et al., 2021).
In the present study, complex and large-scale WISZs at the Baihetan hydropower station are being investigated.To characterize the complex occurrences of these large-scale WISZs, an attempt has been made to develop an analytical method using Kriging interpolation techniques and random field theory.The developed analytical techniques can potentially solve the problem of reasonably and accurately describing the three-dimensional(3D)complex occurrence characteristics of WISZs to a certain extent.
2.Background and features of the Baihetan WISZs
The Baihetan hydropower station,currently being constructed on the left and right banks of the Jinsha River, is the second-largest hydropower station in China.The main and auxiliary underground powerhouses have lengths,heights and spans of 438 m,88.7 m and 34 m, respectively.The total length of the underground tunnels is around 210 km,and the total excavation volume reaches 15 million m3.The geological conditions of the Baihetan underground caverns are complex.The measured maximum principal stress is approximately 33 MPa,which is nearly vertical to the longitudinal axis of the underground powerhouse on the left bank.Several gently inclined WISZs cut through the underground caverns on both banks(Fig.1).The stability of WISZs,which can be greatly affected by excavationinduced unloading effects during the construction stage, mostly governs the stability of many rock engineering practices.Therefore,to ensure the safety of the structures on or within the rock masses,a precise characterization of WISZs embedded within those rock masses is required.The Baihetan WISZs are a series of gently inclined and large-scale infilled discontinuities, which are weak and broken tuffaceous interlayers that formed due to shear dislocation and longterm weathering of tuff rock layers.The Baihetan WISZs(e.g.C2,C3,C3-1, C4,and C5) with loose structures and poor mechanical properties cut the underground caverns on a large scale,which control the overall and local stability of the project(Fig.1).
2.1.Distribution of WISZs at the Baihetan hydropower station
Based on field investigations and existing studies, it has been observed that the WISZs located in the Baihetan dam areas have the following distribution features (Fig.2):
(1) Macroscopically, WISZs are distributed within tuff layers with clear spatial locations,good connectivity,and wide and continuous distribution area.
(2) Locally,WISZs exhibit obvious undulating characteristics and spatial variability in thickness, structure and fabric.
(3) The weak interlayers of WISZs are made up of a random combination of mud type, mud with rock debris type, rock debris with mud type,and breccia with rock debris type(Han et al.,2021a).
2.2.Structural features
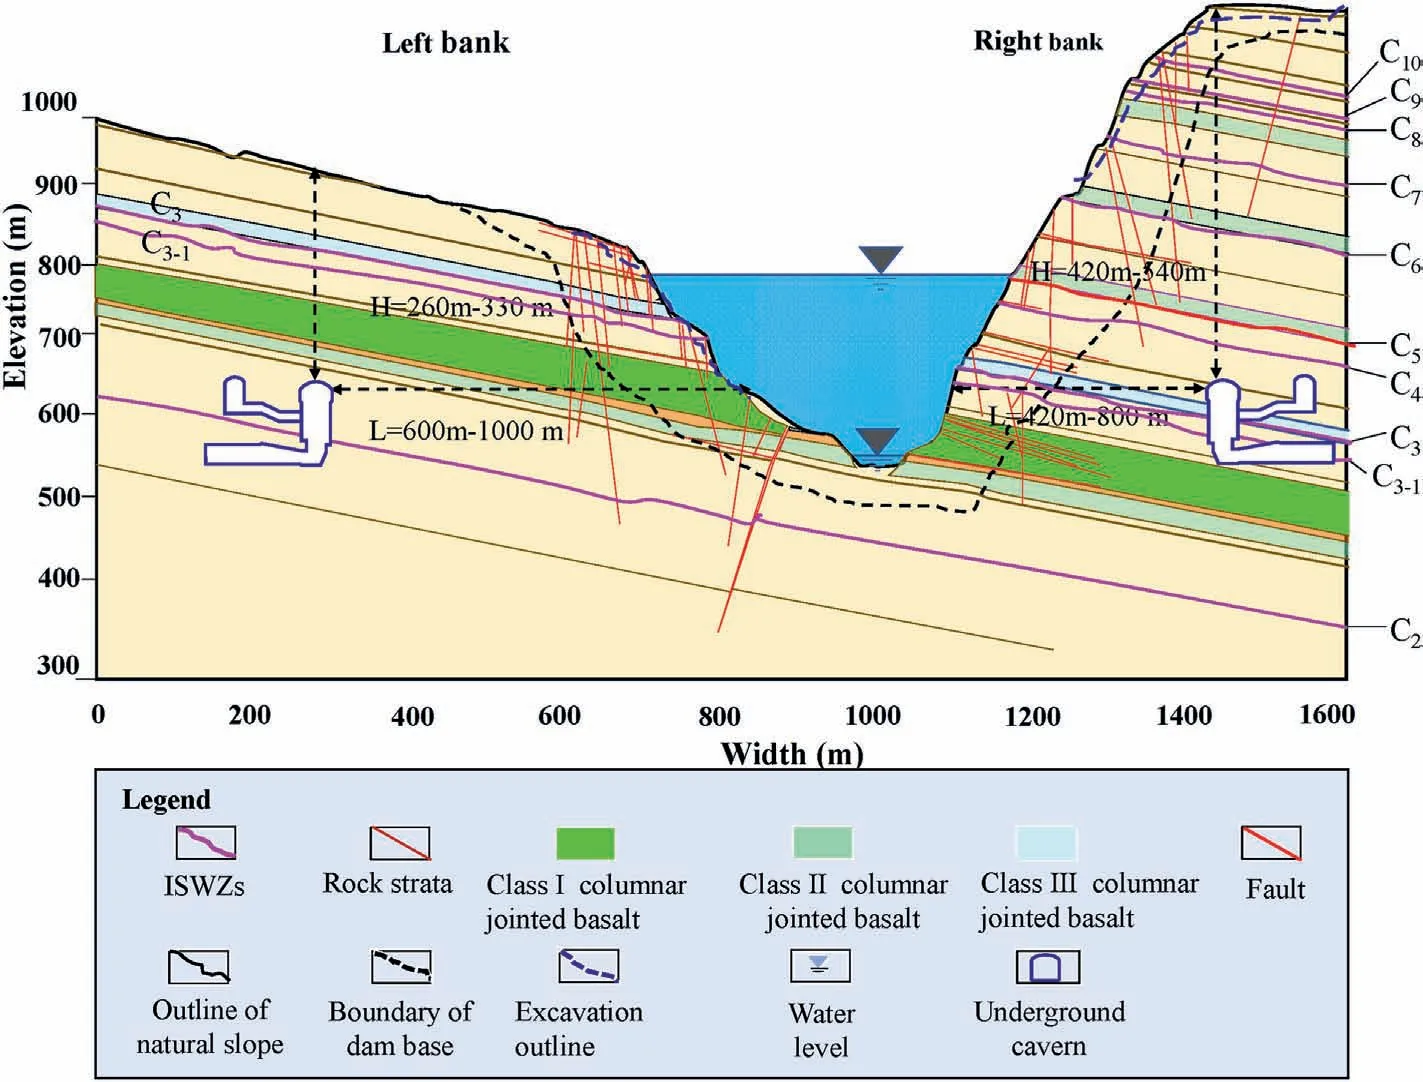
Fig.1.The Baihetan hydropower station and WISZs.
In general, WISZs in the Baihetan dam area can be classified structurally into two categories: type A structure (single-layer structure)and type B structure(multi-layer structure).The singlelayer structure can be further divided into subtypes A1,A2 and A3 based on the thickness, degree of argillization of the weak interlayer, integrity, and contact state of the hanging wall and footwall (Fig.3a).In comparison to type A structures, the WISZs with the multi-layer structure are formed by additional tectonic movement and weathering evolution resulting in evident phenomena of layering and zoning(Fig.3b).The multi-layer structure is often composed of the joint zone, scaly cleavage zone, and argillization zone (Han et al., 2023).
2.3.Fabric and microstructural features
The Baihetan WISZs are classified into four classes based on the Code for Engineering Geological Investigation of Hydropower Engineering GB50287-2016 (2016): mud, mud with rock debris,rock debris with mud, and breccia with rock debris.Fig.4a illustrates the classification standards and examples of WISZs observed near the Baihetan dam.
X-ray diffraction(XRD)analysis was conducted to determine the mineral composition of the argillization zone, cleavage zone, joint zone, and tuff parent in WISZ C2.The primary mineral groups and illite mineral contents in each zone are illustrated in Fig.4b.Illite(content >50%), calcium almandine garnet, and orthoclase are the three dominant minerals present in the samples,as revealed by the XRD results.Fig.4b also shows the dominant mineral types and content of the clay minerals in each zone.The XRD results indicate that the contents of the dominant minerals in the samples are illite(content >50%) >calcium almandine garnet >orthoclase.Additionally, the clay mineral content in the different zones can be characterized as follows:argillization zone >cleavage zone >joint zone ≈tuff parent rock.
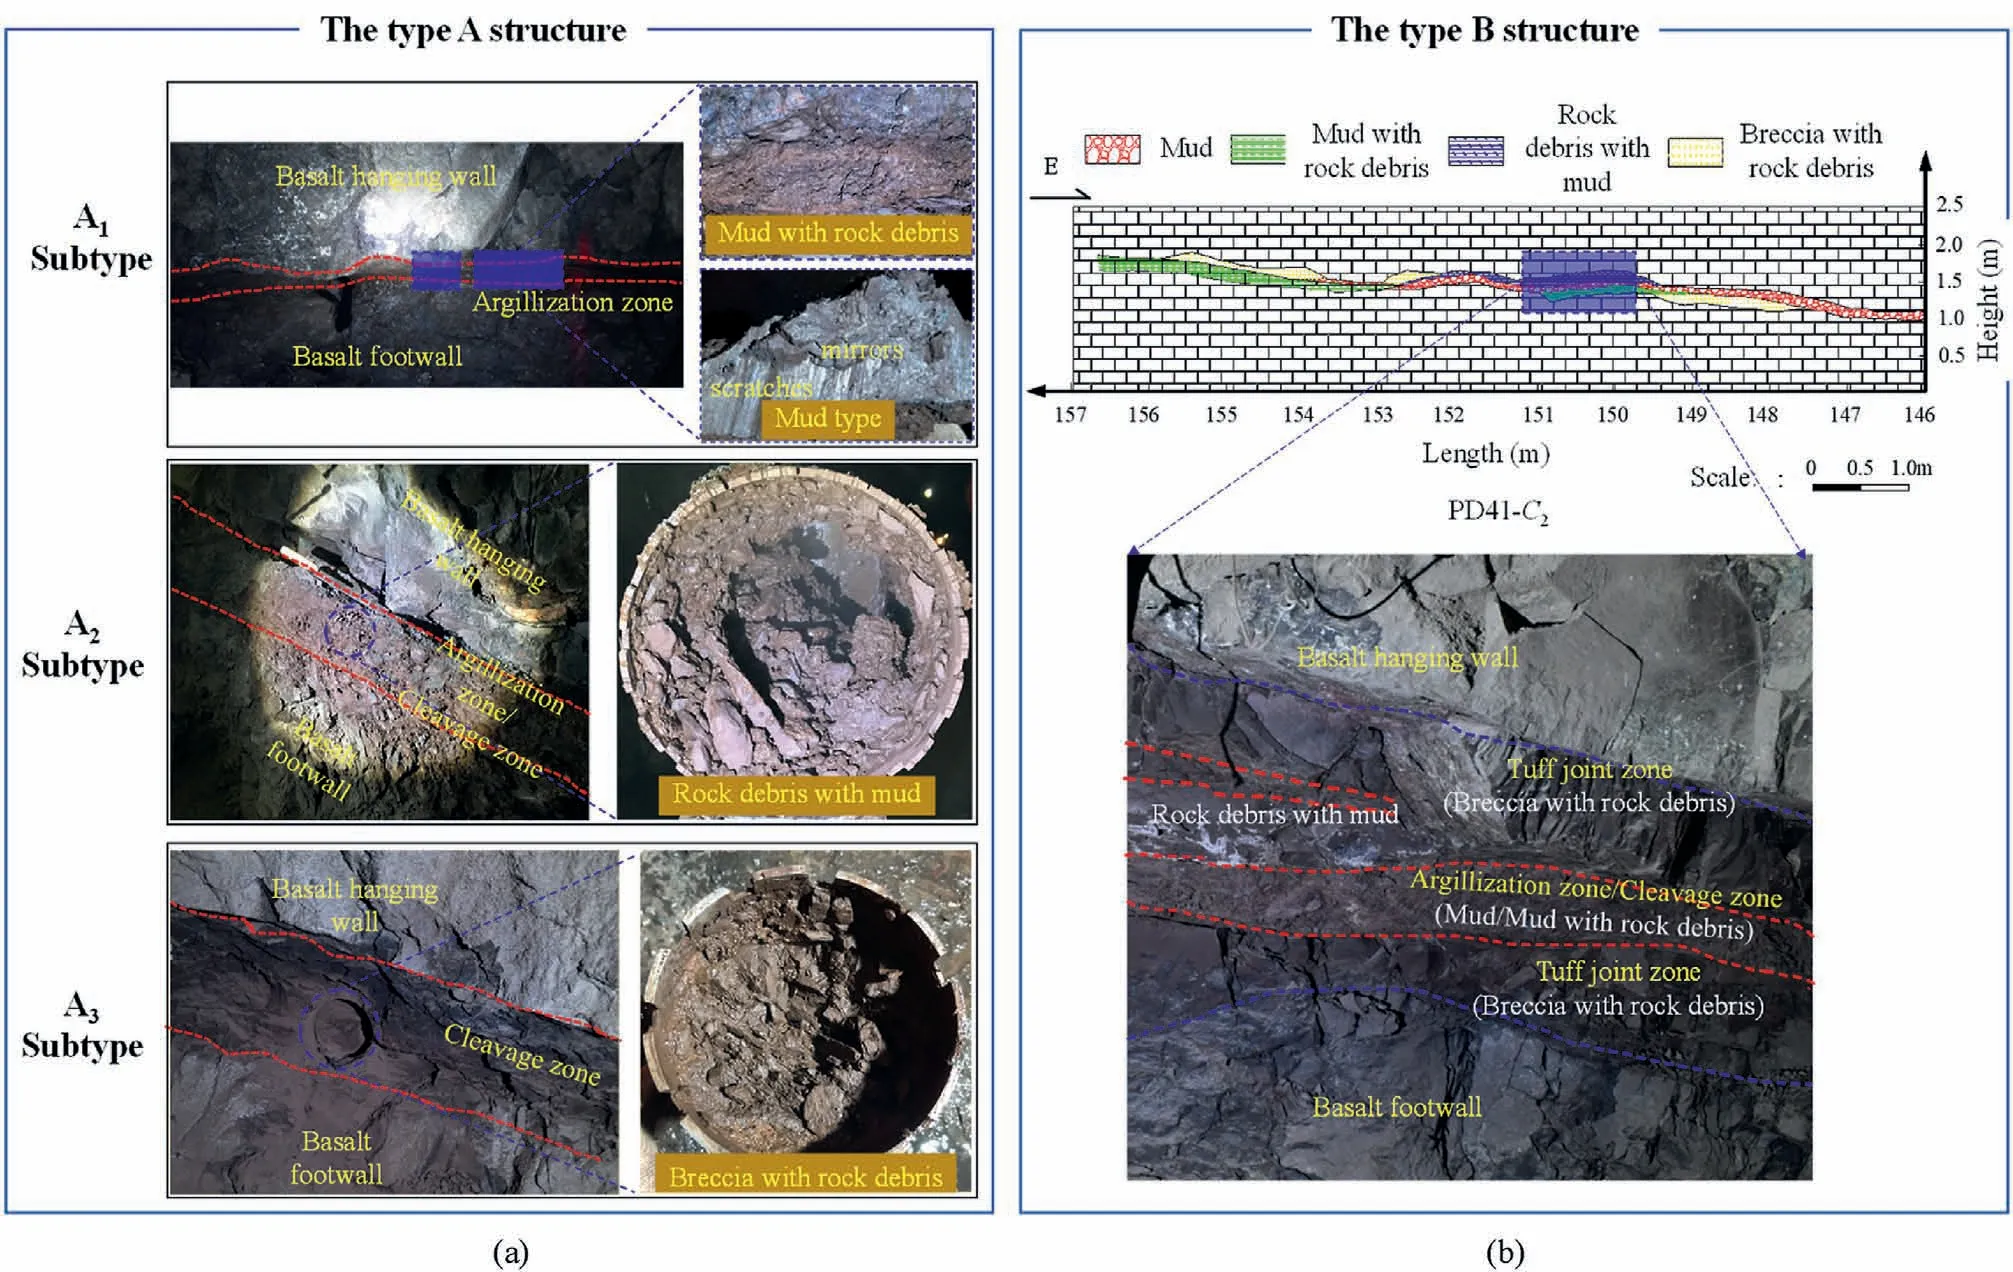
Fig.3.Structural features of WISZs: (a) Type A structure and (b) Type B structure.
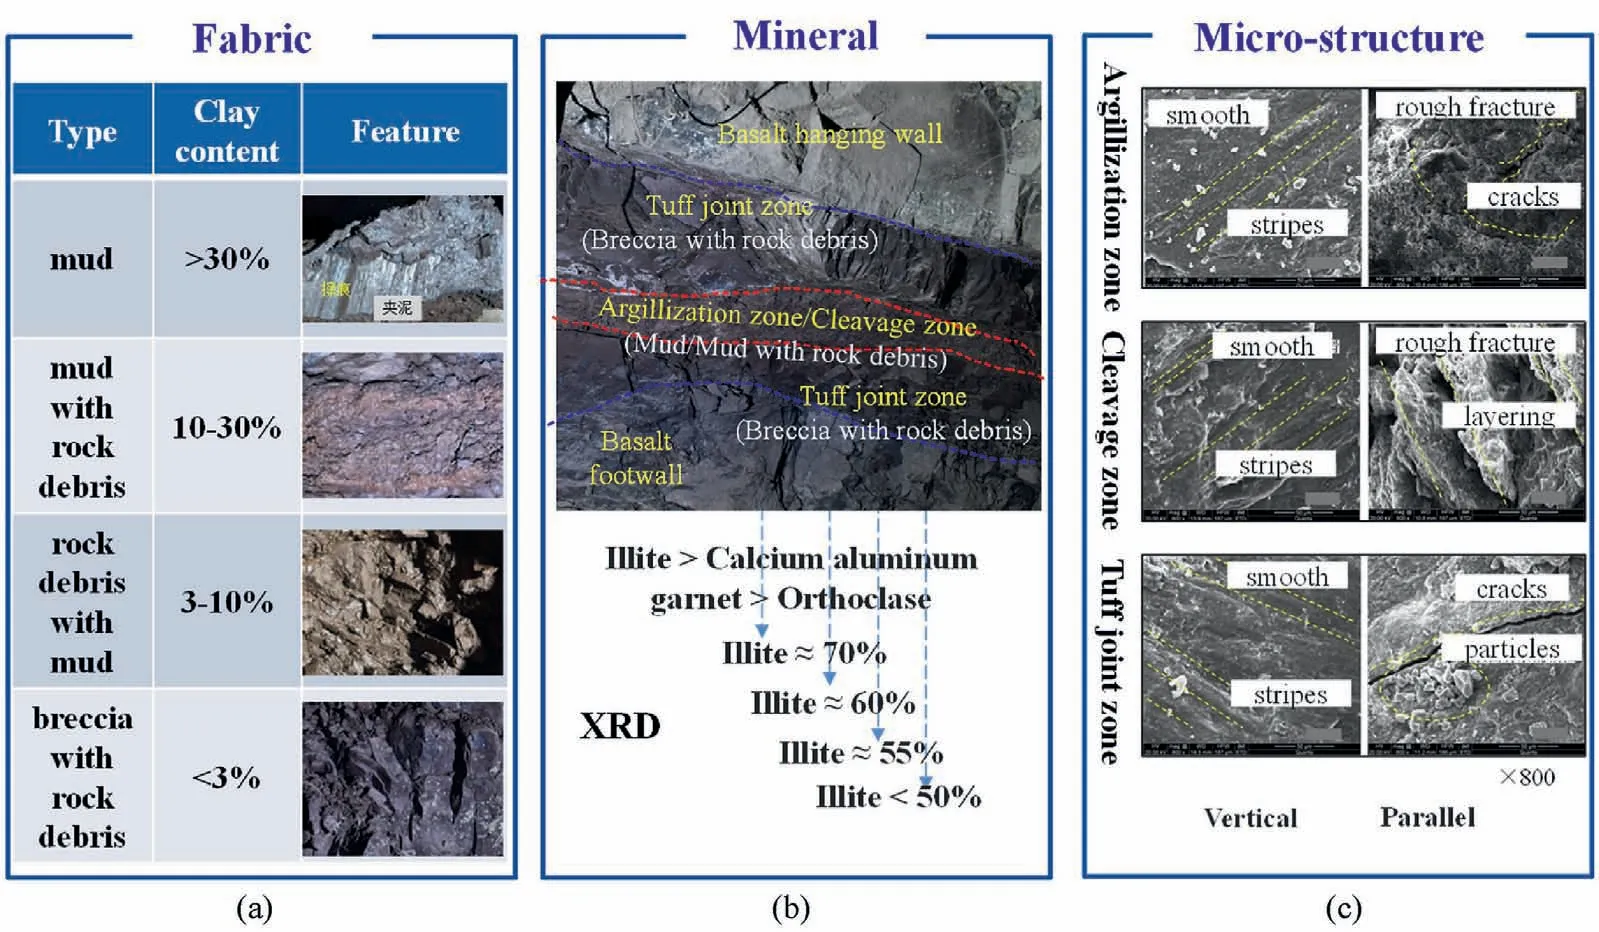
Fig.4.Fabric and microstructures of WISZs: (a) Fabric features, (b) Mineral features, and (c) Microstructures (Han et al., 2023).
The microstructure and mineral composition of the original rock undergo significant alteration as a result of the transformation of tuff parent rock layers into WISZs.The scanning electron microscope (SEM) method was employed to scan and examine rock samples from the extensional and vertical directions of each zone,including the joint zone,cleavage zone,and argillization zone.The SEM image analysis is presented in Fig.4c.It is evident that the microstructures of specimens in different zones are consistent in the direction perpendicular to the extensional direction of each zone, and the surface of rock samples is relatively smooth with directional stripes.However,significant differences were observed in the extensional orientation of the microstructures of the samples from different zones.The fissure surface in the joint zone is smooth,with a few clay particles but no obvious layering.The fracture surface of the cleavage zone is rough with noticeable layering.In the case of the argillization zone,the fracture surface is rough and chaotic, with non-directional clay particles, microcracks, and visible layering.
2.4.Shear strength parameters
Existing studies (Xu et al., 2012; Duan et al., 2021; Han et al.,2021b) on the Baihetan WISZs have revealed their complex occurrence characteristics, which exhibit significant variability and discreteness in their strength parameters.Table 1 shows the results of in situ direct shear tests conducted on the Baihetan WISZs at different positions.The cohesion ranges from 0.02 MPa to 0.42 MPa,and the friction angle ranges from 14°to 38°, which further validates the spatial variability and discreteness of their shear strengths.Therefore, it is essential to accurately characterize the spatial variability and discreteness of strength parameters for WISZs with due diligence.
In the present study,we employ random field theory to describe and express the spatial variability and correlation of strength parameters for WISZs with complex occurrences.The theoretical framework of the spatial variability analytical method for WISZs is discussed in the following sections.
3.Theoretical framework of conditional random field theory
3.1.Random field theory
To simplify the description of the spatial variability and correlation of variables between the midpoints of the site,the following three assumptions are considered.
3.1.1.Gaussian process hypothesis
The Gaussian process is also called a normal random process.It refers to a set of random variables in which any finite random variable xiobeys the joint Gaussian distribution (Eq.(1)).The Gaussian processes have many statistical characteristics like normal variables, which are determined by their mean function m and covariance function C.
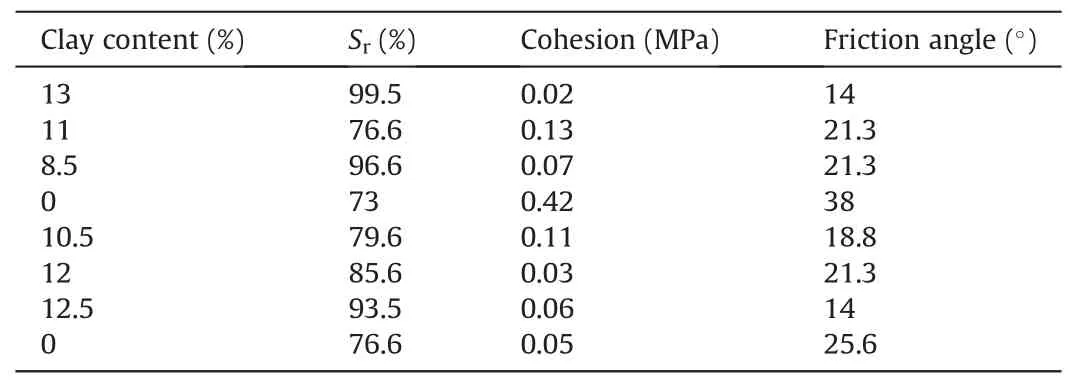
Table 1 Shear strength parameters of Baihetan WISZs.
where m is the mean vector of variable X,C is the covariance matrix of any two points in the site, and |C| is its determinant.The mean vector and variance matrix can be calculated from the following formula:
where the covariance matrix C is a k-order symmetric, positive definite square matrix.
For any continuous random field, there are infinite random variables X (each point is regarded as a random variable).That is why the dimensions of m and C are infinite.For simplicity,m and C are usually expressed as a continuous spatial function containing several constants.For example,in a one-dimensional random field,the mean can be simplified to
The covariance matrix can be written in the form of multiplying the standard deviation and the correlation coefficient:
where σ(t1)and σ(t2) are the standard deviations of variable X at points t1and t2,respectively;and ρ(t1,t2)is the covariance function of X between points t1and t2.
Since the mean and variance change with the spatial locations,it is still difficult to determine the joint probability density function.Therefore,the following two hypotheses need to be used further.
3.1.2.Stationary or statistical homogeneity hypothesis
The relative location between spatial points affects the joint probability density function in the random field rather than the actual position in space.In the case of a Gaussian random field,the mean and variance of each random variable are independent of the spatial location and constant throughout the entire field.
3.1.3.Isotropic hypothesis
In a two-dimensional(2D)or higher-dimensional random field,the isotropic random field(i.e.the joint probability density of each variable has rotation invariance) has the spatial correlation between two points, which depends on their relative distance but is independent of their relative directions.By removing the low-order spatial variation pattern of the random variables,the nonstationary random fields may typically be converted into stationary random fields (Li et al., 2016).
The mean function,variance function,correlation function,and autocorrelation distance are required to characterize nonconditional random field properties.Among all the characteristics, the correlation function is efficient in describing the correlation size of each point in the field.This study selects a simple Gaussian function as the correlation function.The corresponding 2D autocorrelation function model is expressed as
where ρ(τx,τy) is the autocorrelation coefficient between any two points in the random field; τxand τyare the relative distances between any two points in the x and y directions,respectively;and θxand θyare the autocorrelation distances in the x and y directions in the random field, respectively.It is noted that the larger autocorrelation θ indicates a smaller variation in the site parameters with distance,and it shows a stronger correlation between the two points.When θx= θy, it is an isotropic random field, and on the contrary, it is an anisotropic random field.
3.2.Simulation method of stationary random field
The commonly used random field simulation techniques are the midpoint method, local average method, spectral representation method, Cholesky decomposition method, and Karhunen Loeve(K.L.)expansion method(Fenton and Griffiths,2008).Among them,the K.L.expansion method is a common method of random field simulation, which uses deterministic characteristic functions and random coefficients to generate sampling functions of random fields(Zhang and Bruce,1994).This technique is widely used due to its high simulation accuracy at the small number of variables.The 2D K.L.expansion method is expressed by
where m and σ are the mean and standard deviation of random variables, respectively; ξ is the independent standard normal random variable;M is the number of truncated items;λiand fI(x,y)are the eigenvalues and eigenvectors of the random field autocorrelation function ρ(τx,τy), respectively, which satisfy the following equation:
where D is the area of a random field; and (x1,y1) and (x2,y2) are the coordinates of two points in space.
A simple case is presented to verify the applicability of nonconditional random fields.Suppose that the area of a 2D site is 100 m×100 m,and it is discretized into regular quadrilateral grid units with the same unit size of 2 m × 2 m.The 2D random field parameters of the friction angle specified in this case are as follows:the mean value and variance are 20°and 2°, respectively, which follow the normal distribution and the Gaussian correlation function (Eq.(1)).An isotropic random field with an autocorrelation distance of 10 m in both x and y directions is used.A 2D random field model describing the friction angle of geotechnical materials is created using the above-mentioned information in Fig.5.It can be observed from Fig.5 that the friction angle follows the normal distribution N (20°, 2) in the two random fields.However, the friction angle is not constrained to the locations, and the friction angle is randomly distributed in the two cases.Therefore,it shows randomness in any location in the fields.It is noted that the strength parameters obtained by the field tests generally include position information in rock engineering.The randomness of neighboring points of strength parameters could be significantly lowered if the position information is added to the random field model.Therefore, the conditional random field is further established in the following section.
3.3.Kriging conditional random field theory
The conditional random field can fully utilize the position information of the measuring or experimental points, and the randomly produced field can closely match the data at those points.It considerably reduces the uncertainty of the parameters close to the measuring and experimental positions.Based on the Kriging interpolation technique, a conditional random field model constrained by the information of measuring points is established in the following sub-sections.
3.3.1.The Kriging interpolation method
The Kriging method was proposed by D.G.Krige in the early 1950s to the late 1960s to find the best linear unbiased estimator(BLUE).The Kriging method has been continuously developed and improved since its inception.Different Kriging methods can be used for different situations and purposes.At present, the commonly used Kriging methods are listed as follows:
(1) The ordinary Kriging method is generally used when the second-order stability assumption is satisfied.
(2) The universal Kriging method can be used in nonstationary phenomena.
(3) When the regionalized variables obey lognormal distribution, the logarithmic Kriging method can be used.
(4) When the data are small and with an irregular distribution,the random Kriging method can be used if the expected estimation accuracy is not high.
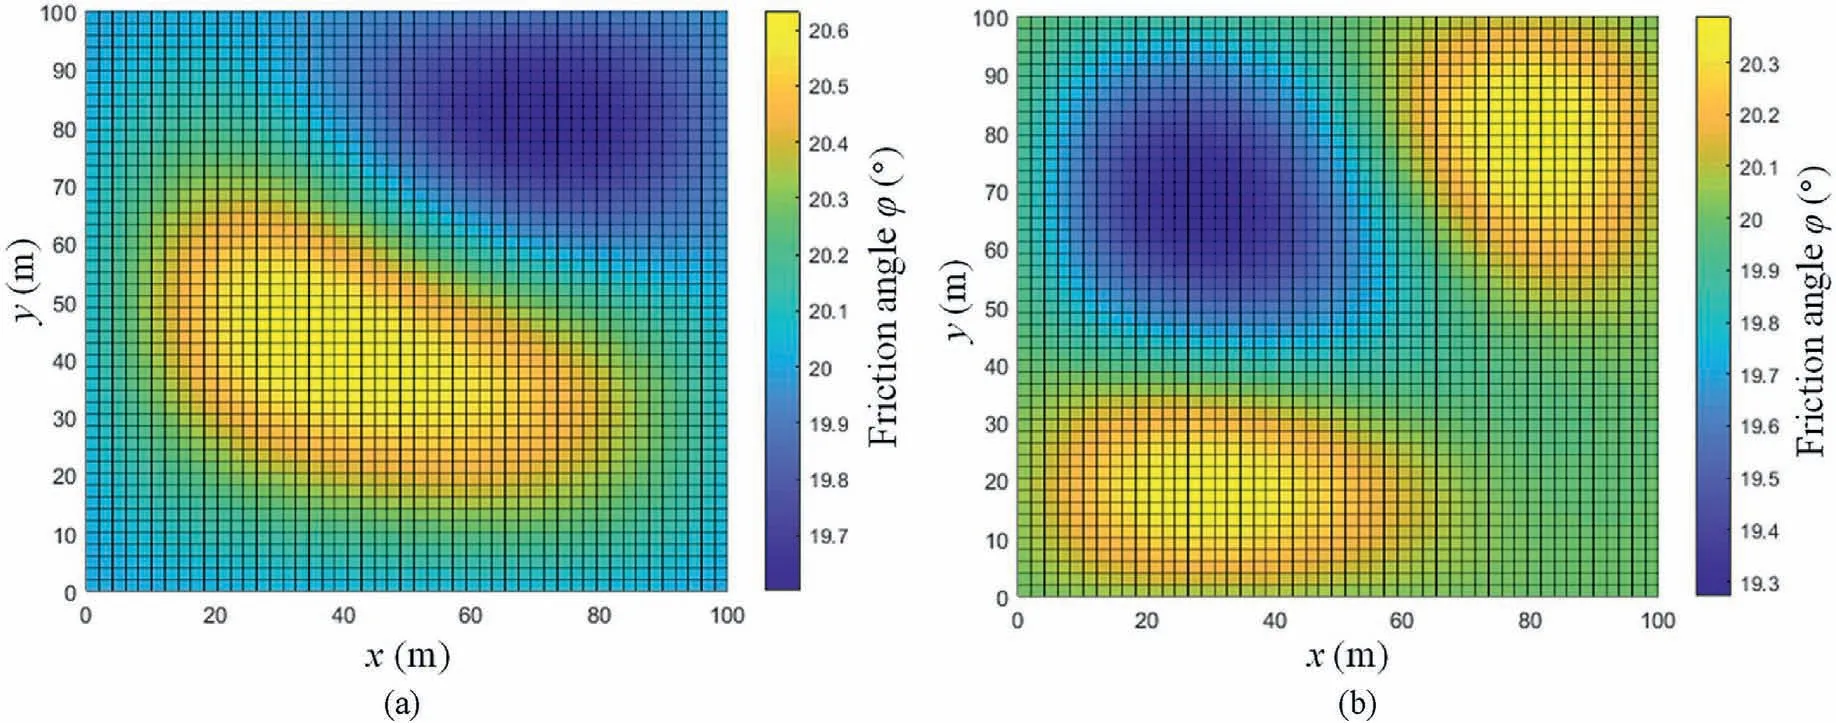
Fig.5.2D unconditional random field model of friction angle: (a) Case 1, and (b) Case 2.
In addition, there are the factorial Kriging method, indicator Kriging method, reduction Kriging method, etc.The ordinary Kriging method meeting the second-order stationary assumption is used in this study.The so-called second-order stationary assumption refers to the regionalized variables Z(x,y) meeting the following two conditions:
(1) The mathematical expectation exists and is constant in the whole field, i.e.
where Z(x,y)represents the variable value at any point in the field,(x,y) are the coordinates in the 2D site, and dx and dy refer to the distances between any two points in the x and y directions in the site.
(2) In the whole field, the covariance function exists and is stable:
Based on the information of known measuring points, the Kriging interpolation of unknown points in the field can be expressed by the following equation (Cressie,1990):
where (x0,y0) are the coordinates of the point to be estimated;Z*(x0,y0)is the value to be estimated;(xα,yα)are the coordinates of a series of known measured values in the field; z(xα,yα) is the corresponding measured value; and λαis the weight of the linear combination of known measuring points, in which the unbiasedness(E)and the minimum estimated variance(σ2K)in the ordinary Kriging method are taken as the two criteria for selecting λα:
The Lagrange multiplier method is further applied to calculating the conditional extreme value:
where-2μ is the Lagrange multiplier.Finally,the ordinary Kriging equations of n + 1 orders are obtained:
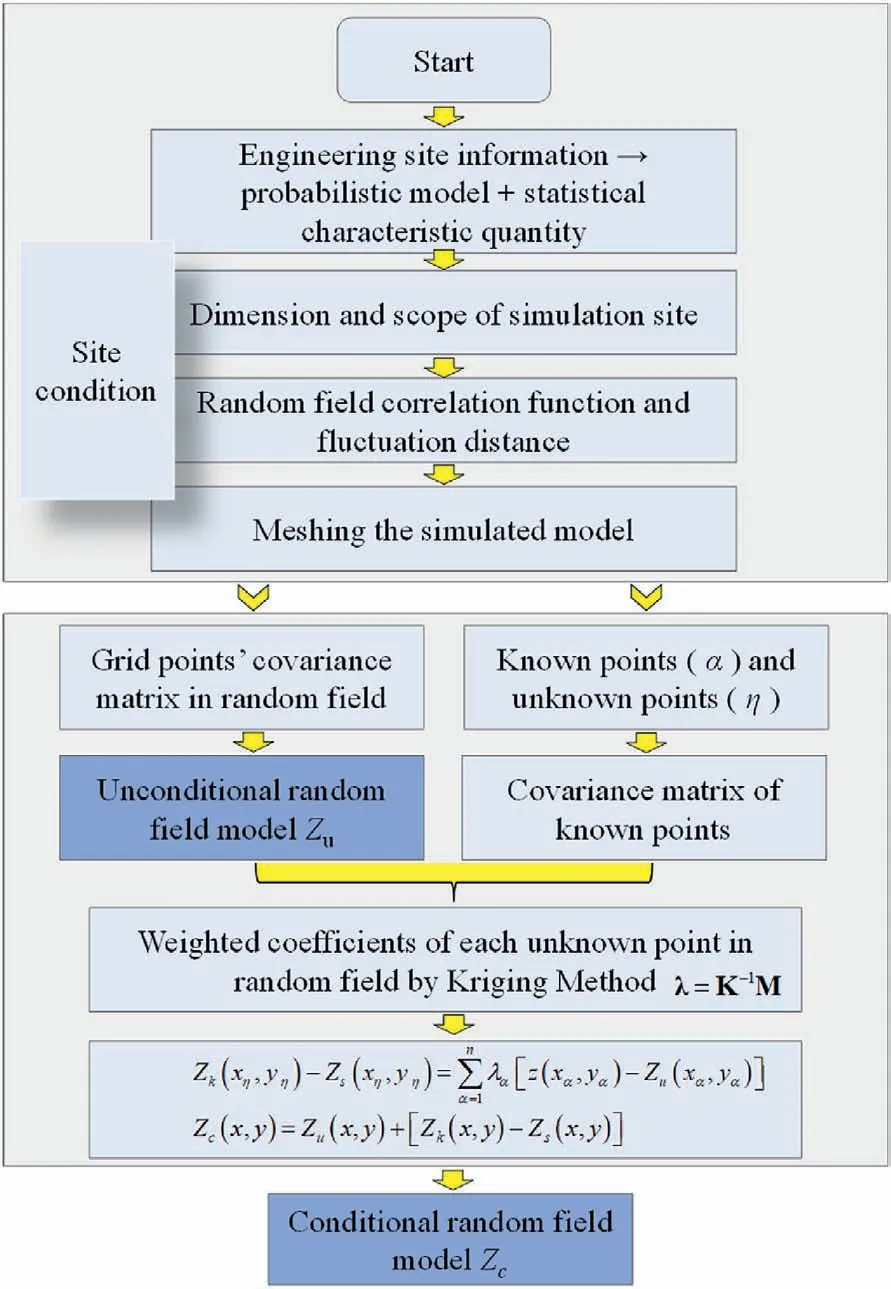
Fig.6.Flowchart of the Kriging conditional random field.
where C[(xα,yα),(xi,yi)] is the covariance function.To facilitate programming,Eqs.(14a)and(14b)are further expressed in matrix form of Kλ = M.Further, we have
where K is the Kriging matrix which is symmetric.
Based on Eq.(15),the weight vector λ at a certain point(x0,y0)to be estimated can be obtained:
It can be obtained Z*(x0,y0) by substituting it into Eq.(10).

Table 2 Information on test points.
3.3.2.Kriging conditional field simulation method
The conditional random field can be expressed mathematically as (Degroot and Baecher,1994):
where Zc(x,y)is the target conditional random field.To realize the conditional simulation process,the random field is divided into two parts: (1) (xα,yα)(α = 1,2,…,n) that the measuring points that have been sampled or monitored, the variable values at these points are determined, which are z(xα, yα); (2)(xη,yη)(η = 1,2,…,N-n) that the variable values at these points are still unknown and need to be solved, where subscript α represents the measuring point of known information, subscript η represents the point to be estimated, N represents all discrete points in the random field, and n represents the total number of measuring points with known information.
The conditional random field consists of the following three parts:
where Zu(x,y) is a nonconditional random field, Zk(x,y) is the ordinary Kriging random field obtained at the point(xα,yα) (α = 1,2,…,n)based on the known information point,and Zs(x,y) is the simulated value obtained at the point(xα,yα) (α = 1,2,…,n) based on the unconditioned random field.
At each measuring point with known information,the following equation is satisfied:
At the measuring point with known information,Eq.(14)can be simplified as follows:
The unconditioned random field Zu(x,y) is generated by using the K.L.method in Section 3.2,and the value at the point Zk(x,y)to be estimated is determined by the Kriging interpolation equation(Eq.(10)):
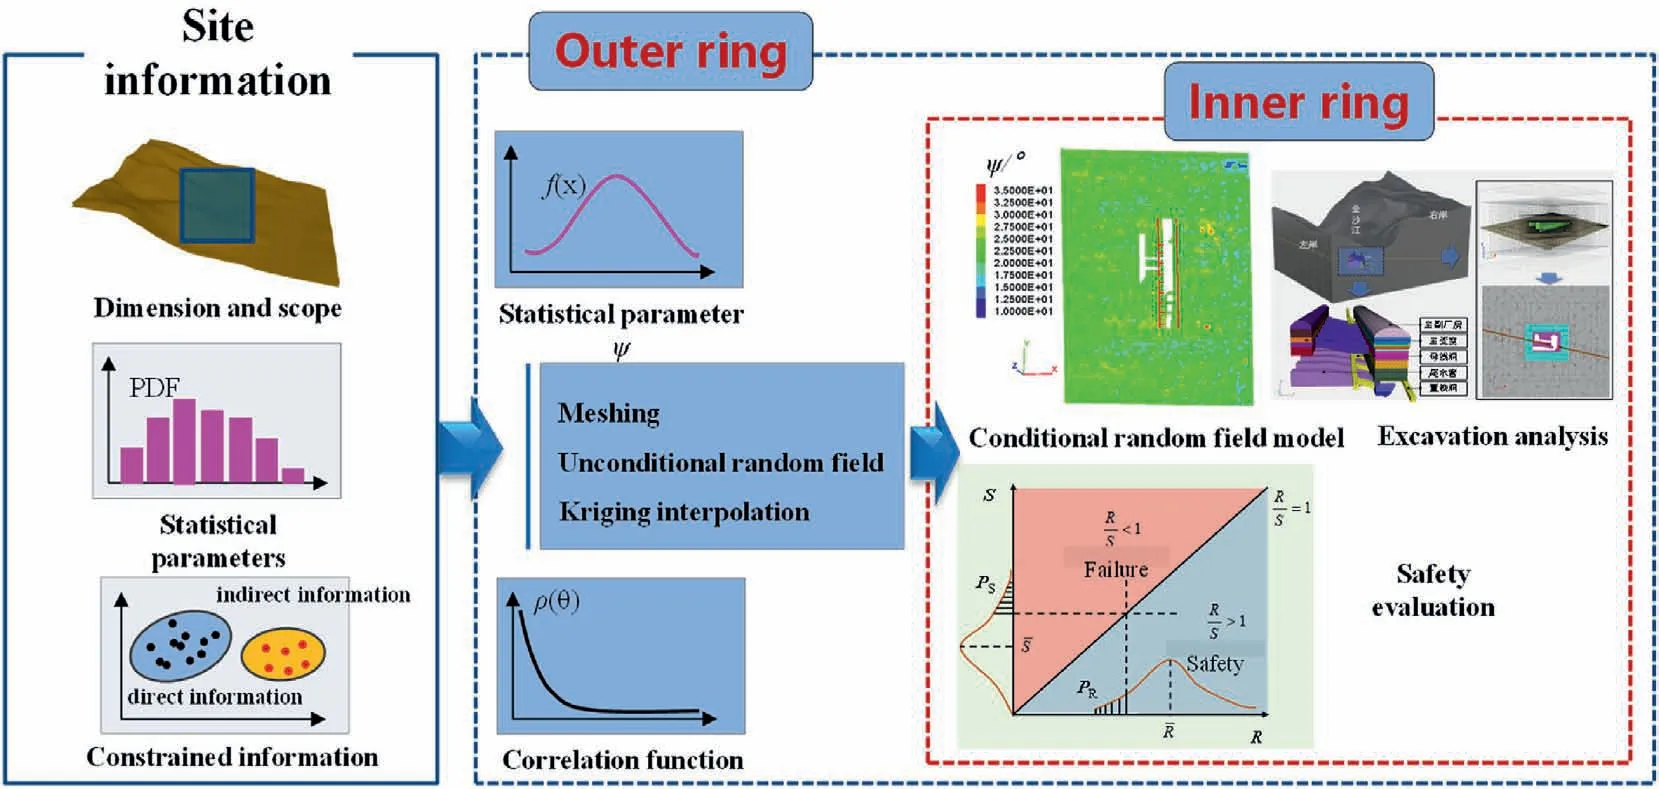
Fig.8.Analytical method of spatial variability for WISZs.
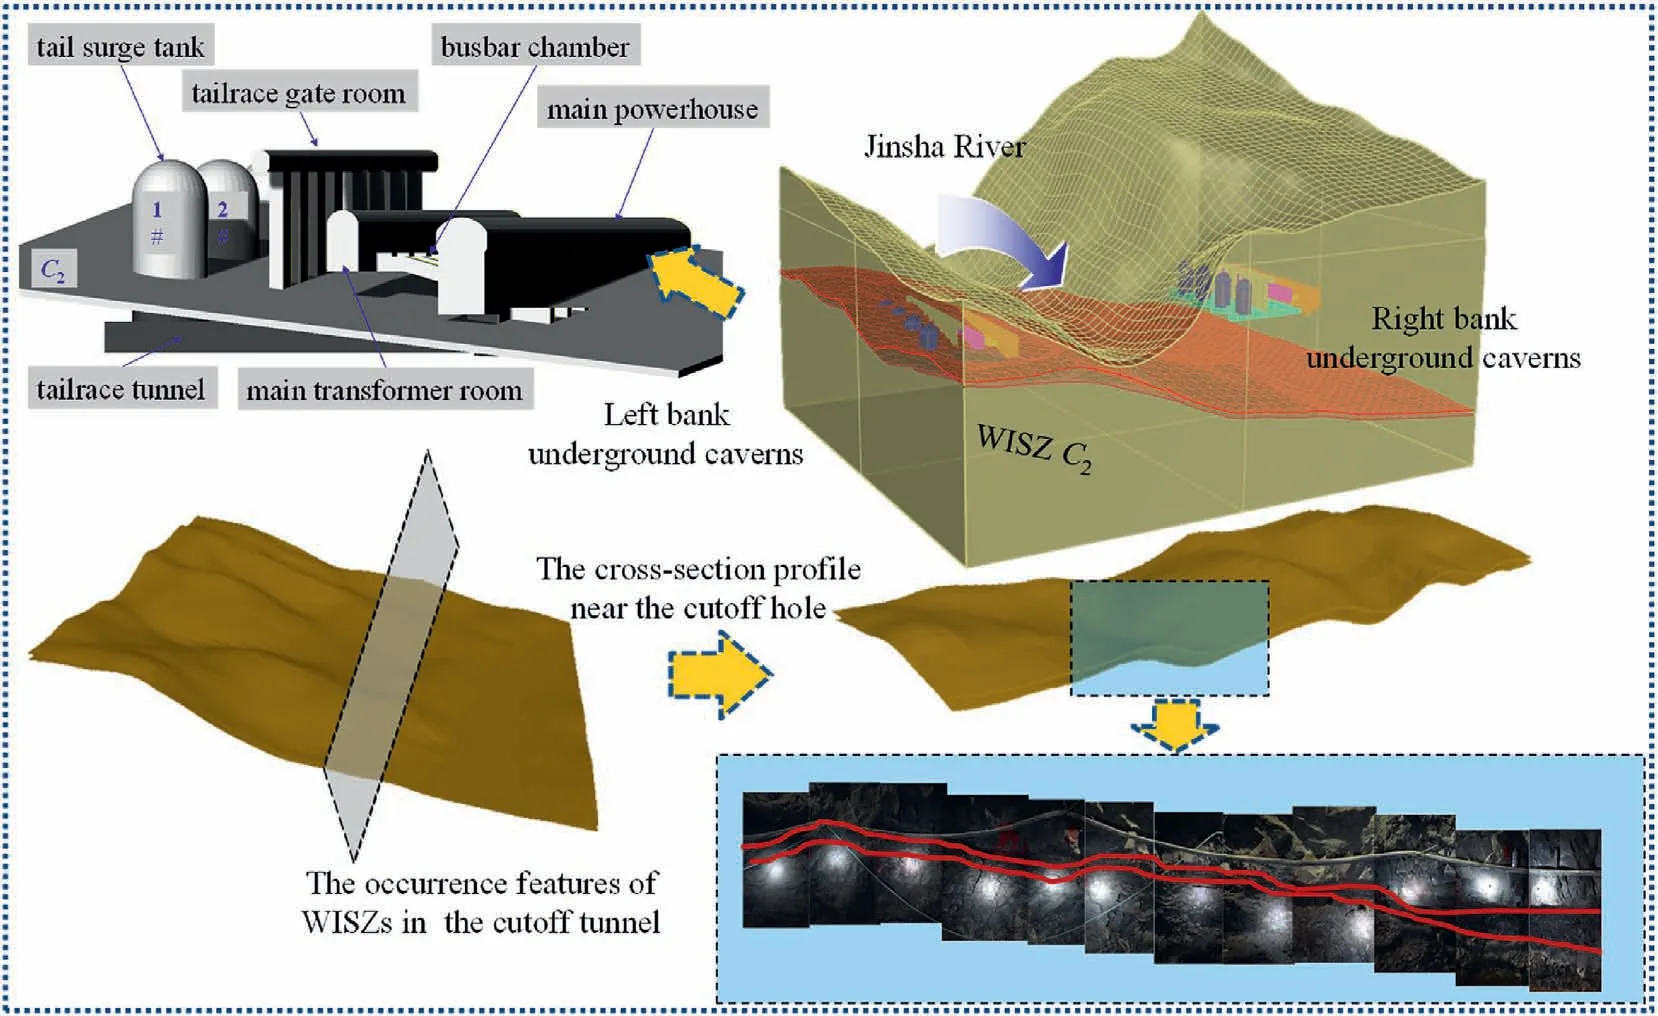
Fig.9.A 3D conceptual model of the Baihetan hydropower station.
Similarly,it can also be determined by the Kriging interpolation equation (Eq.(6)):
where the only difference between Zk(xη,yη) and Zs(xη,yη) is that the former is obtained by interpolation based on measured points z(xα,yα) with known information, and Zs(xη,yη) is obtained by numerical interpolation in the unconditional random field simulation at the same location.Therefore, Eq.(18) can be simplified as follows:
where the weight coefficient λαcan be obtained from Eq.(16).
The generation process of the Kriging conditional random fields is summarized in the flowchart shown in Fig.6.The flowchart of the analytical method’s solution procedure can generally be divided into two parts: site information processing and the Kriging conditional random field model generation.For the processing of site information, the probabilistic model and statistical characteristics(e.g.mean and variance) of spatial variability of geotechnical parameters are first determined from the site information.Then,the dimensions and simulation scopes of the site to be simulated are determined.Next, the appropriate correlation function and reasonable fluctuation distance are selected.Finally, based on the above results,the simulation model is meshed.For the generation of the conditional random field model,the covariance matrix of grid points in the whole simulation model is first generated.Then, the covariance matrix of the known points is generated.Next, the weighted coefficients of each unknown point in the random field are determined by the Kriging method.Finally, the conditional random field model is established.
To verify the feasibility and rationality of the Kriging condition random field simulation method,the case in Section 3.2 is used for verification, in which the site area, discrete element size, and characteristic quantities are all the same.The coordinates of the additional test points are added to the field, as shown in Table 2.Based on the above theoretical derivation, the Kriging conditional random field of the friction angle is generated by programming.To further verify the influence of autocorrelation distances on the results, the autocorrelation distances in the x and y directions are both set to 10 m (θx= θy= 10 m) in Cases 1 and 2; the autocorrelation distance in the x and y directions are both set to 2 m(θx= θy= 2 m)in Case 3;and in Case 4,the θxis set to 2 m,and θyis set to 10 m.The corresponding conditional random field models are presented in Fig.7.It can be seen from Fig.7a and b that the friction angles at the test point strictly conform to the data in Table 2,and the friction angles around the test points are limited by the measured values and the spatial correlation.Fig.7c shows the autocorrelation distances θx= θy= 2 m, thus the spatial correlation is worse than the random field in Cases 1 and 2.In Fig.7d,the autocorrelation distances are θx= 2 m and θy= 10 m, hence the spatial correlation in the x direction is worse than that in the y direction.
Based on the above simulation results,it can be concluded that the Kriging conditional random field model established in this study can reasonably and effectively represent the main site information features.
The Kriging conditional random field model is established based on the Kriging interpolation method that obeys the criteria of unbiasedness and minimum estimated variance.Furthermore, this model considers not only the variable values, but also the spatial positions of variables.On the premise of enough field experimental and measured data,the Kriging conditional random field model can significantly reduce the spatial variability of the random field.However,if the available measured data are limited or the specific position of the measured points cannot be determined,this method is not applicable.
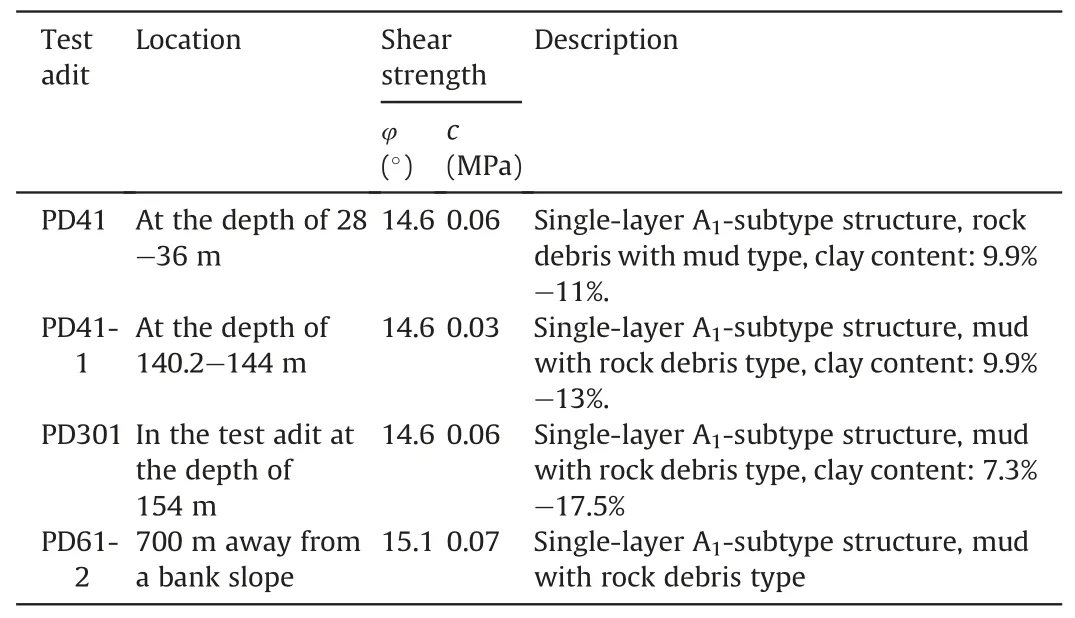
Table 3 Information on in situ direct shear tests of WISZs.
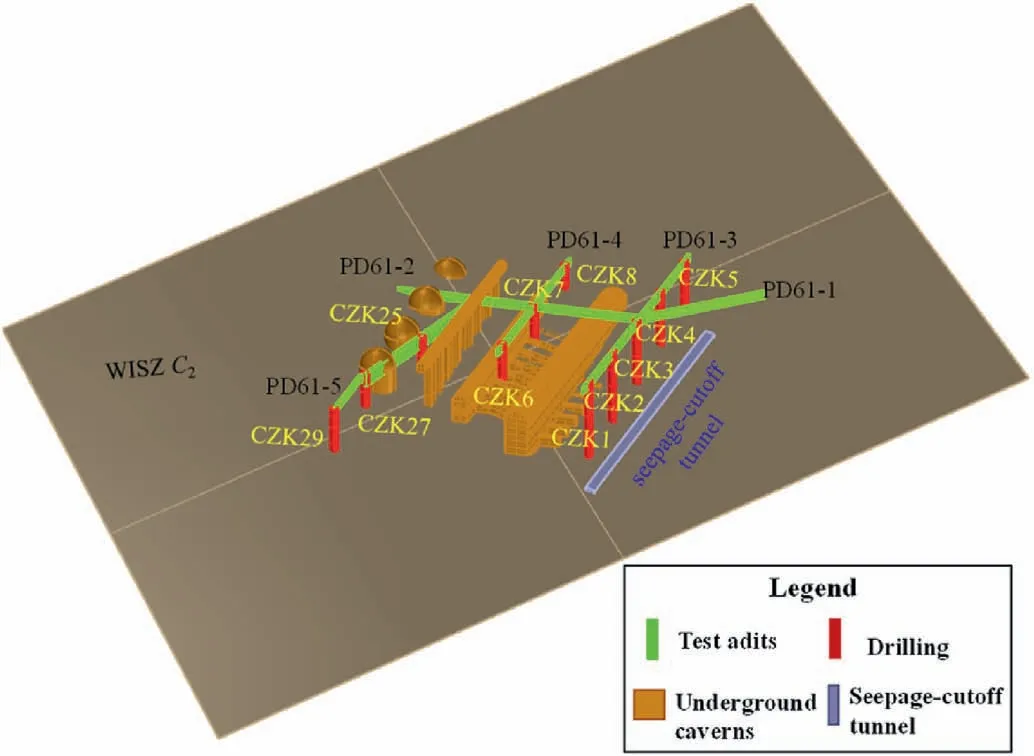
Fig.10.Borehole and sampling locations of WISZ C2 in the left bank.
4.Analytical method of spatial variability for Baihetan WISZs
To accurately represent the structure and spatial variability of WISZs,an analytical technique is employed,which can express the spatial variability and correlation of mechanical parameters,based on the theoretical framework of the conditional random field mentioned above.The analytical method comprises site information, an outer ring, and an inner ring (see Fig.8).The site information encompasses the dimension, statistical histograms, and constraint conditions (direct and indirect information) of the strength parameters of WISZs.The outer ring consists of the statistical processing of site information and the inner ring.The statistical processing of site information involves fitting the probability distribution function and correlation function based on the distribution laws of the strength parameters,meshing the site,establishing the unconditional random field,Kriging interpolation,and obtaining the Kriging conditional random field of the strength parameters of WISZs.To analyze the excavation disturbance of the surrounding rock of the underground powerhouse, the inner ring essentially involves integrating the strength parameters derived from the conditional random field model into the 3DEC simulation software.
4.1.Simplification of the Baihetan WISZs
Section 2 presents in detail some of the key engineering geological characteristics of WISZs.WISZs in the Baihetan dam area exhibit apparent spatial variability and correlation in their structure and fabric,as observed in the literature.However,the detailed demonstration of the structural and fabric features of large-scale WISZs is challenging due to insufficient geological information at each location in the dam region(Fig.4).These concerns necessitate the creation of an engineering model that preserves the mechanical consistency and precision of the computation results.To simplify the Baihetan WISZ C2,the following procedure has been followed:
(1) The thicknesses of WISZs are far smaller than their plane size; therefore, they have been simplified into structural planes without geometrical thickness.
(2) The large-scale complex structures and fabrics of WISZs can be represented by the spatial variability and correlation of strength parameters.
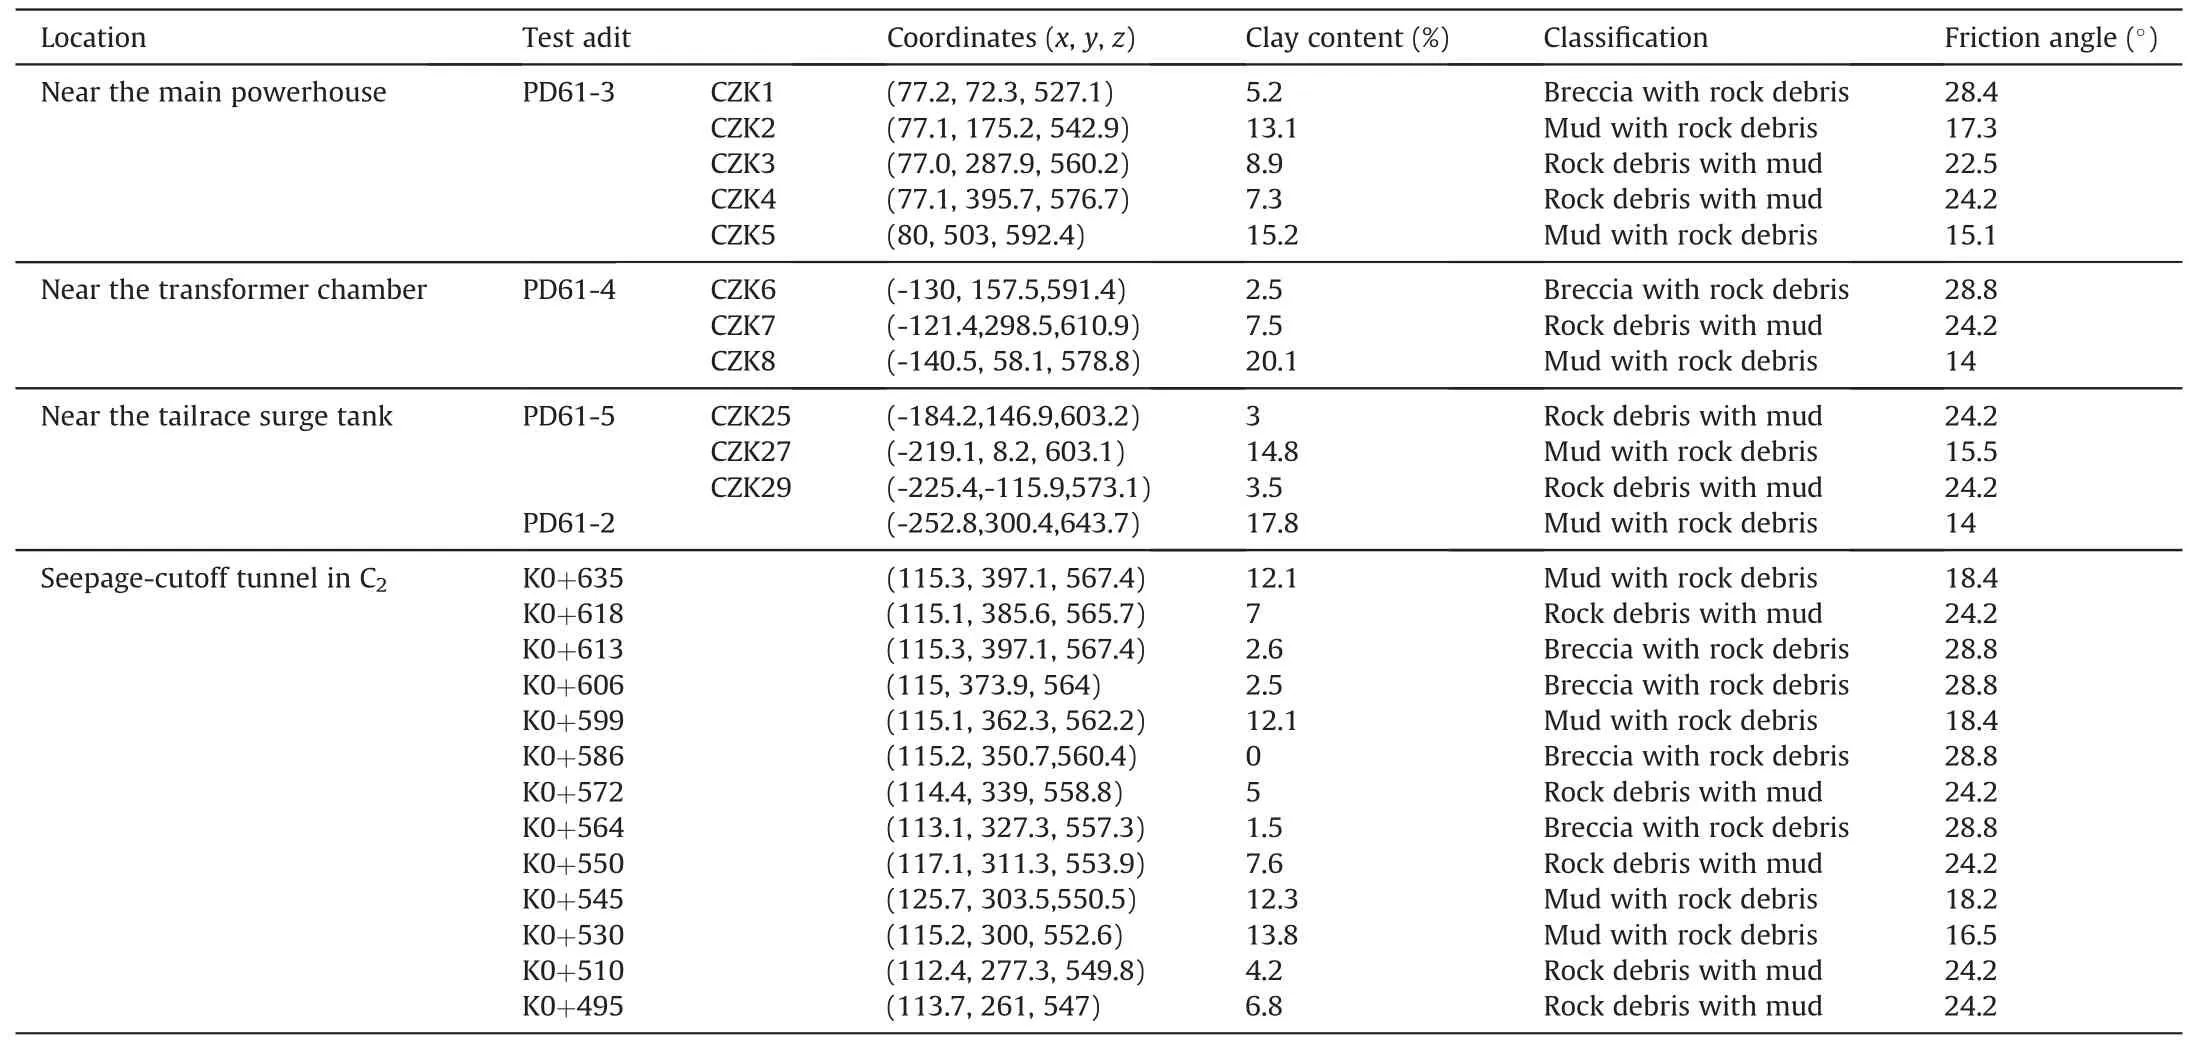
Table 4 Borehole and sampling information of WISZ C2
(3) The current conditional random field model only considers the friction angles of WISZs, while the cohesion and deformation modulus are treated as deterministic parameters.
Therefore, the spatial variability and correlation resulting from the structural and fabric characteristics of WISZs have been translated into the spatial variability and uncertainty of the mechanical parameters, i.e.the friction angle.The aim of precisely characterizing the spatial variability of WISZs has been accomplished by constructing the appropriate conditional random field model.
4.2.Site information processing
WISZ C2in the left bank of the Baihetan hydropower station is investigated.It can be seen from Fig.9 that the WISZ C2with a dip direction of N40°E and a dip angle of S.E.∠15°-20°cuts obliquely to the center and lower portions of the main underground powerhouse, and the lower part of the main transformer chamber and the middle part of the #1, #2,and #3 surge chambers.
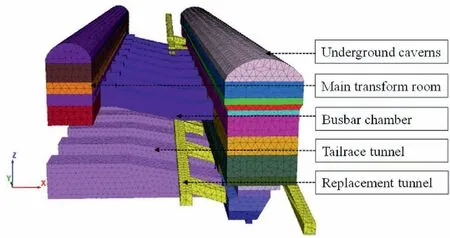
Fig.11.3D numerical model of main underground caverns.
The determination method of shear strength parameters of WISZs can be classified as direct and indirect information.The direct information refers to the shear strength parameters of WISZs directly obtained from in situ tests (i.e.Zα(x) = zα).The indirect information refers to independent variables related to shear strength parameters of WISZs, which can be calculated by mathematical relationships, e.g.f[Zα(x)] = ξα.In conditional random fields,both types of information can be employed as constraints to make random fields more suitable for describing spatial variability and correlation of shear strength (Ching and Phoon, 2019).
(1) Direct information
A total of 16 groups of in situ direct shear tests were carried out on the Baihetan WISZs (C2-C5), and four groups of them were conducted on WISZ C2exposed in the test adits of PD41, PD41-1,PD301, and PD61-2.The in situ direct shear tests performed on WISZ C2are summarized in Table 3.
(2) Indirect information
Due to the high costs and operational complexities involved in testing, it is not feasible to conduct a significant number of field tests on WISZs in the dam area.Consequently, only a limited number of shear strength parameters for WISZs can be obtained using direct information.Furthermore, it is difficult to precisely determine the location of measuring sites for conducting in situ tests.Existing literature reveals that many researchers have conducted in situ and laboratory direct shear tests on WISZs, mainly focusing on predicting the strength parameters of WISZs and identifying factors responsible for significant variations in strength parameters(Xu et al.,2012;Han et al.,2021a).This study adopts the method for predicting strength parameters proposed by Han et al.(2021a).Fig.10 illustrates the sampling locations of WISZ C2, both for the seepage cutoff tunnel and the boreholes near the underground caverns.Table 4 provides detailed information on sampling locations, coordinates, clay contents, classification, and friction angle.
4.3.Conditional random field of friction angle of WISZ C2
The Coulomb slip model is adopted for WISZ C2using the discrete element numerical software 3DEC.The conditional random field model considers only the spatial variability and correlation of the friction angle of WISZs.The random field parameters of the friction angle of WISZs primarily include the mean m, standard deviation σ, correlation function ρ, and autocorrelation distance θ.The maximum likelihood function estimation method(DeGroot and Baecher,1994;Fenton,1999;Ching and Phoon,2019;Qi et al.,2021) was adopted to calculate the friction angle of WISZ C2in the Baihetan dam area using the data in Table 4.The following equation is the random field’s Gauss correlation function:
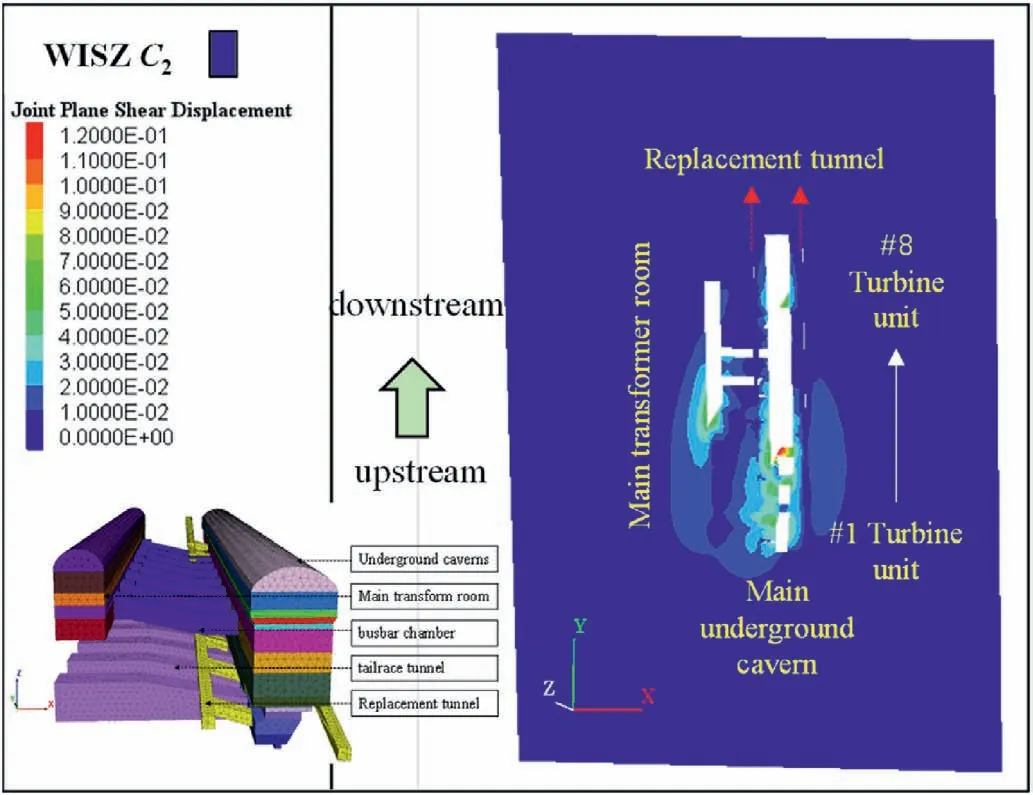
Fig.14.Distribution features of shear displacement (m) in WISZ C2 caused by excavation disturbance.
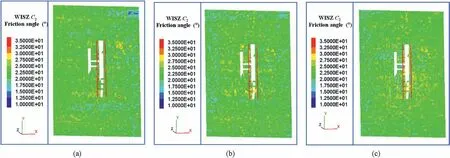
Fig.13.Models of the underground caverns at Baihetan hydropower station and the conditional random field of the friction angle of WISZ C2:(a)Case 1,(b)Case 2,and(c)Case 3.
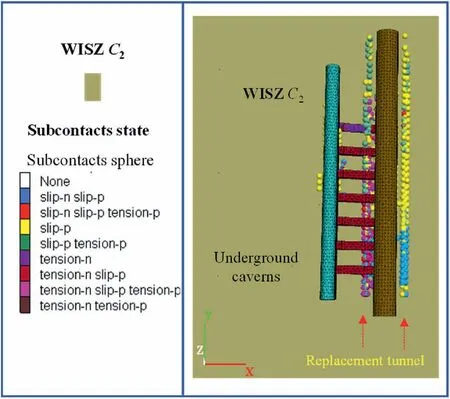
Fig.16.Distribution features of plastic zones in WISZ C2 caused by excavation disturbance.
where ρ(τs,τd) is the autocorrelation coefficient between any two points in the friction angle random field of WISZ C2; τsand τdare the relative distances between any two points in the strike and dip directions in the random field of WISZ C2,respectively;and θsand θdare the autocorrelation distances in the strike and dip directions in the random field, respectively.Finally, based on the maximum likelihood function estimation method,critical parameters such as the mean value of the friction angle, autocorrelation distance in strike and dip directions,and standard deviation are determined as 22.7°,118.6 m, 9 m, and 4.99 m, respectively.
4.4.Model of conditional random field of WISZs based on discrete element method
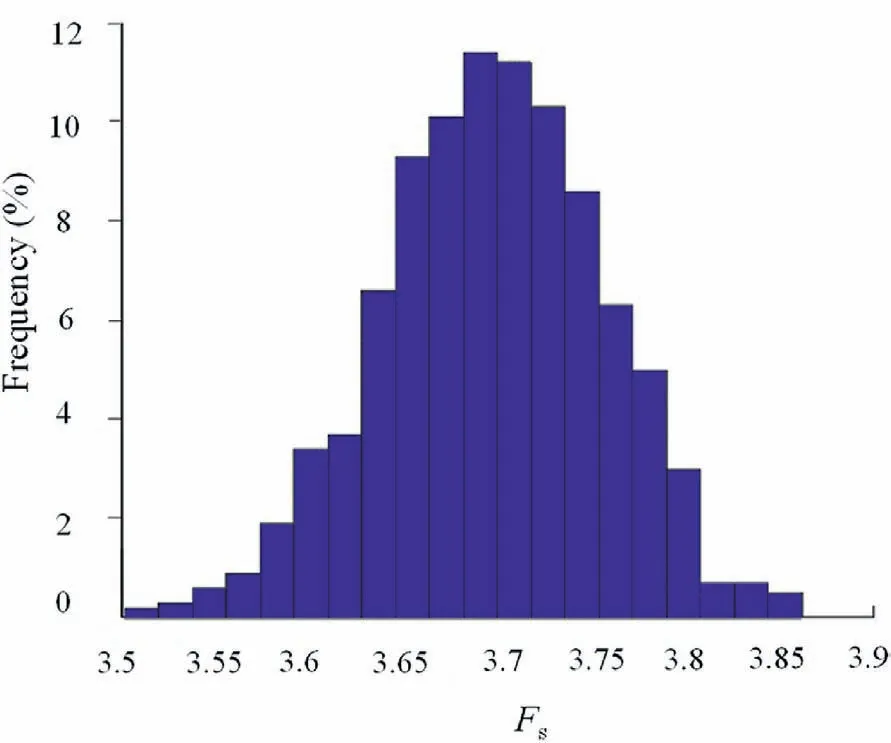
Fig.17.Histogram of safety factor Fs.
The flowchart depicted in Fig.6 is used to develop the Kriging conditional random field of the friction angle of WISZ C2.Subsequently, the developed conditional random field of WISZ C2is integrated with the numerical software 3DEC (Itasca Consulting GroupInc, 2017) for stability and safety analysis in the underground caverns model of the Baihetan hydropower station.3DEC is a continuous-discrete element method that is superior to the conventional finite element method in simulating the mechanical behavior of discontinuities in rock masses.Additionally,it has high calculation efficiency and can perform calculations for large-scale engineering simulations.Therefore, 3DEC is used to investigate large-scale WISZs embedded in underground caverns.
Based on the assumptions mentioned in Section 4.1,the WISZ C2is directly processed into a 2D (strike and dip) structural plane without thickness in the 3DEC.The following is the detailed procedure for obtaining the conditional random field of the friction angle for WISZ C2of the Baihetan underground caverns:
(1) The Baihetan underground caverns,which include the main and auxiliary powerhouses, main transformer chamber,busbar tunnels, tailrace tunnel, and concrete replacement tunnel, are being constructed (Fig.11).
(2) WISZ C2is modeled by a gently inclined joint surface in 3DEC software,whose grids are as even as possible.The triangular grid size in the joint surface of WISZ C2is set to 4-5 m(Fig.12).
(3) The 3DEC defines the contact point in the joint surface of WISZ C2as the sub-contact nodes, and it outputs and stores the coordinates of each sub-contact point on WISZ C2as text files.
(4) The coordinates of drilling points and measuring points are mapped to the discrete element numerical model one by one and their coordinates are acquired in the numerical model.
(5) The coordinates of sub-contact points in WISZ C2are read and then the random field of the friction angle corresponding to the sub-contact nodes in WISZ C2is established using the Kriging conditional random field model.After that, the random field information that includes the ID, coordinates,and friction angle of the sub-contact nodes is output.
(6) The friction angles corresponding to each sub-contact node on the joint surface of WISZ C2in the 3DEC model are retrieved from the text file containing conditional random field data.
A model of underground caverns is developed using the conditional random field model of the friction angles of WISZ C2in 3DEC, based on the methods described above.Additionally, three cases of the conditional random field for the contact angle are shown in Fig.13.
5.Engineering application: activation analysis of WISZ C2 disturbed by excavation
5.1.Activation scope of WISZ C2 in underground caverns
5.1.1.Displacement distribution
Fig.14 displays the distribution characteristics of the shear displacement of WISZ C2.It is evident that WISZ C2has been impacted by excavation disturbance,resulting in an apparent local shear displacement of WISZ.The busbar chamber located near turbine unit #3 exhibits the highest shear displacement (approximately 0.12 m), while typical shear displacement values range between 0.01 and 0.05 m.Furthermore,evidence of successful control of shear slip of the rock mass along WISZ C2due to excavation disturbance can be observed from the shear displacement on both sides of the replacement tunnels, which exhibit discontinuous features.
5.1.2.Shear stress distribution
Fig.15 illustrates the distribution characteristics of the excavation-induced shear stress in WISZ C2.It is evident that due to excavation disturbance, shear stress concentration occurs in WISZ C2to some extent.The concentration of shear stress is primarily observed in the excavation zones, where it reaches a maximum value of approximately 20 MPa near the replacement tunnel.
5.1.3.Activation scope of WISZ C2
The characteristics of the plastic zone distribution in WISZ C2are shown in Fig.16.It can be observed that when the plastic zone distribution is combined with the shear stress and displacement distribution characteristics, the locally activated area of WISZ C2caused by the excavation of underground caverns varies from 0.5 to 1 times the span of the main powerhouse.Moreover, the replacement tunnel plays a crucial role in providing shear resistance and controlling the magnitude of the shear slip of WISZ C2.
5.2.Overall safety evaluation of WISZ C2 activation
The discrete element numerical model can be utilized to determine the safety factor of WISZ C2activation during excavation disturbance.The calculation equation of the safety factor Fsis as follows:
where S is the sliding force and R is the anti-sliding force.
The sliding force S on WISZ C2is obtained by accumulating the shear forces of all sub-contact dislocation zones.The sliding force can be calculated as
where Siis the sliding force on each sub-contact;sf_x,sf_y and sf_z are the shear stress components in the x,y and z directions on each sub-contact, respectively; and Aiis the area of each sub-contact.
The anti-sliding force R on WISZ C2is calculated by accumulating all the sub-contacts on C2:
where Riis the anti-sliding force on each sub-contact, σniis the normal stress in the sub-contacts element,φiis the friction angle of each sub-contacts unit, and ciis the cohesion of each sub-contact.
The Kriging interpolation technique is employed in the Kriging conditional random field to estimate the strength parameters at unconstrained locations within the site.The data from these interpolation points contain some unpredictability, which can be significantly reduced by increasing the number of samples.To develop the conditional random field samples of WISZ C2, the Monte Carlo sampling technique is used.Based on numerical simulations, the safety factor (FS) of the underground caverns equivalent to each random field sample is determined.A total of 1000 simulation calculations are performed, and the distribution histogram of the safety factor FSfor the activation sliding of the underground caverns along WISZ C2is plotted in Fig.17.The simulation results demonstrate that the safety factor roughly follows a normal distribution with a mean of 3.697 and a standard deviation of 0.0589 (Fig.17).
6.Conclusions
Large-scale WISZs are difficult to accurately characterize in their natural and complex occurrences due to their widespread distribution, undulating morphology, complex fabrics, and varying contact states.To address this issue, the complex occurrences of WISZs that induce spatial variability and correlation are simplified to the spatial variability and uncertainty of their mechanical parameters, such as the friction angle.Additionally, the theories of random field and Kriging interpolation are presented to create the Kriging conditional random field.The Kriging conditional random field of the friction angle is then included in the activation analysis of WISZ C2at the Baihetan hydropower plant’s underground caverns using 3DEC.The following conclusions can be drawn:
(1) An analytical technique for precisely characterizing the complex occurrences of WISZs is developed using the Kriging conditional random field model.
(2) The activation range of WISZ C2due to excavation disturbance is approximately 0.5-1 times the main powerhouse span, indicating local activation.
(3) The shear slip of WISZ C2is controlled by the replacement tunnel, which is also essential for the shear resistance.
(4) The Monte Carlo sampling method is used to simulate 1000 cases of underground cavern excavation.The results demonstrate that the overall safety factor of WISZ C2roughly follows the normal distribution with a mean of 3.697 and a standard deviation of 0.0589.
Declaration of competing interest
The authors declare that they have no known competing financial interests or personal relationships that could have appeared to influence the work reported in this paper.
Acknowledgments
The authors acknowledge the financial support from the Key Projects of the Yalong River Joint Fund of the National Natural Science Foundation of China (Grant No.U1865203) and the Innovation Team of Changjiang River Scientific Research Institute(Grant Nos.CKSF2021715/YT and CKSF2023305/YT).We are also grateful for the support and assistance of the engineers of Power China Huadong Engineering Corporation Limited.
 Journal of Rock Mechanics and Geotechnical Engineering2023年10期
- Journal of Rock Mechanics and Geotechnical Engineering的其它文章
- Analytical solutions for the restraint effect of isolation piles against tunneling-induced vertical ground displacements
- Displacement-based back analysis of mitigating the effects of displacement loss in underground engineering
- Investigation of long-wavelength elastic wave propagation through wet bentonite-filled rock joints
- Mechanical properties of a clay soil reinforced with rice husk under drained and undrained conditions
- Evaluation of soil fabric using elastic waves during load-unload
- Effects of non-liquefiable crust layer and superstructure mass on the response of 2 × 2 pile groups to liquefaction-induced lateral spreading
