Evaluation of soil fabric using elastic waves during load-unload
Yng Li, Mshide Otsubo, Reiko Kuwno
a Institute of Industrial Science, The University of Tokyo, 4-6-1 Komaba, Meguro-ku, Tokyo,153-8505, Japan
b Public Works Research Institute,1-6 Minamihara, Tsukuba, Ibaraki, 305-8516, Japan
Keywords:
ABSTRACT It is essential to assess the evolution of soil fabric as it has an important role in the mechanical responses of soils during complex loading conditions.This contribution carries out the physical experiments using three granular materials in the laboratory.The variations of compression and shear wave velocities (Vp and Vs) are investigated during load-unload cycles under dry and drained conditions.Supplementary discrete element method (DEM) simulations are performed to understand the evolution of soil fabric during the equivalent load-unload cycles using spherical particles.Vp and Vs are not always reversible even though the stress state regains its isotropic condition after unload, indicating that Vp and Vs are governed by not only the stress state but also the fabric change.The variations of Vp/Vs are density-and stress-dependent; a higher level of stress ratio (σ′1/ σ′3) threshold is observed for denser packings to trigger a significant change in wave velocity ratio (Vp/Vs) for experimental results using spherical glass beads and simulation data using spherical particles.Considering the particle shape, a higher σ′1/ σ′3 threshold is found for more angular particles than rounded particles.The DEM result reveals that Vp/Vs of spherical particles can be correlated linearly with the evolution of fabric ratio (Φver/ Φhor) during loadunload in a pre-peak range under dry and drained conditions.
1.Introduction
Soil fabric refers to the geometrical arrangement of particles and the geometrical distribution of pore spaces.Soils usually exhibit anisotropic characteristics,which can be categorised as(a)inherent anisotropy due to the non-homogeneous distribution of soil fabric and (b) stress-induced anisotropy due to the anisotropic stress states (Hoque and Tatsuoka, 1998).Soils are often subjected to complex loading conditions in practice.For instance,seismic loads and traffic loads are reciprocating in their loading directions,which could be considered as cyclic loading conditions in the laboratory.Due to this load-unload process, the soil fabric becomes highly unpredictable in comparison to that during monotonic loading tests.O’Sullivan and Cui (2009) conducted load-unload reversals using the discrete element method (DEM) and physical experiments.They found that the increase in stress does not always lead to a synchronised change in soil fabric during shearing.Sazzad(2014) identified that the fabric anisotropy gradually accumulates during cyclic loadings relevant to the stress state in twodimensional (2D) DEM simulations.Jiang et al.(2019) applied three-dimensional(3D)DEM simulations and found that the fabric anisotropy becomes more significant for dense samples during cyclic loadings.As cyclic loadings could cause soil liquefaction related to cyclic instability,many researchers also investigated the evolution of soil fabric during liquefaction phenomena (e.g.Wang et al., 2016; Wei et al., 2020; Morimoto et al., 2021).
Compression (P-) and shear (S-) waves are stress- and densitydependent.Roesler (1979) found that the major principal stress(σ′1) significantly affects the wave velocities measured in the direction of σ′1and there exists an exponential relationship between them in the isotropic state.Santamarina and Cascante(1996)found that minor principal stress(σ′3)also contributes to the variations of S-wave velocity under the triaxial compression when soils are subjected to stress anisotropy.Hardin and Richart (1963) introduced a linear void ratio correlation function to describe the relationship between elastic wave velocities and packing densities in the isotropic state.However, stress states do not only govern the evolution of elastic wave velocities.Dutta et al.(2020) found that the exponential relationship that applies between wave velocities and stress components in the isotropic stress state cannot be held during triaxial shearing.Li et al.(2021)applied DEM and found that P-and S-wave velocities(Vpand Vs)are not linearly related to void ratio(e)once the anisotropic stress state evolves.Moreover,Li et al.(2021)explored that the variations of Vpand Vsare attributed to the evolution of soil fabric during monotonic shearing.

Fig.1.SEM images of tested materials in the laboratory: (a) SGB, (b) CGB, and (c) SS.
In the laboratory, various techniques enable wave velocity measurements.Resonant column tests have been used for a long period (e.g.Hardin and Richart,1963; Youn et al., 2008).As one of the most widely used methods, numerous researchers used the bender element method (e.g.Joviˇciˊc et al., 1996; Gu et al., 2013).Some scholars recommended applying planar transducers to avoid the insertion of sensors into soil samples (e.g.Suwal and Kuwano,2013; Irfan et al., 2017).In DEM, equivalent wave measurement methods can be simulated.O’Donovan et al.(2015) and Gu et al.(2020) treated one particle as a source of generating and receiving elastic waves in the granular samples.In contrast,Otsubo et al.(2020) and Li et al.(2021) simulated the planar waves by triggering the whole rigid boundary.
Load-unload cycles and monotonic loadings can cause very different soil behaviours.For example, monotonic and cyclic loadings can cause different liquefaction phenomena under undrained conditions(i.e.static and cyclic liquefaction),respectively(Ishihara,1993).From a micromechanical viewpoint, O’Sullivan and Cui(2009) found that the mechanism of particle arrangement/movement during load and unload is obviously different, resulting in fabric anisotropy being different from that during monotonic loading.This leads to the first research question:How do Vpand Vsevolve during load-unload cycles?
It is challenging to quantify soil fabric in the laboratory without the aid of advanced imaging processing techniques (e.g.Fonseca et al., 2013; Cheng and Wang, 2018; Wiebicke et al., 2019).If elastic wave velocities are found to have a clear relationship with soil fabric, they can be thus used as an alternative index to reflect the evolution of soil fabric in turn.Li et al.(2021)empirically found a linear relationship between wave velocity ratio(Vp/Vs)and fabric anisotropy for monotonic loading conditions.The second research question to address in this contribution is thus proposed: Can Vpand Vsserve as an index to reveal the soil fabric change during loadunload cycles?
Building on the author’s previous preliminary work (Li et al.,2022), this contribution measures Vpand Vsunder dry and drained conditions on three types of granular materials with different shapes in the laboratory.The variations of Vpand Vsare examined throughout the load-unload cycles at a pre-peak stage.Supplementary DEM simulations are carried out using spherical particles to perform wave propagation in granular assemblies.The variations of wave velocities are qualitatively compared between experimental and simulation results.In addition, the evolution of soil fabric is investigated in DEM simulations and correlated with elastic wave velocities.
2.Laboratory tests
2.1.Material properties
Three types of granular materials were used for load-unload tests in the laboratory.Spherical glass beads (SGB) and clumped glass beads(CGB)have a material density(ρp)of 2500 kg/m3and a median particle size (D50) of 0.5 mm and 0.9 mm, respectively.In addition, silica sand (SS) having ρp= 2640 kg/m3and D50= 0.55 mm was also used.Their maximum and minimum void ratios (emaxand emin) were obtained following Japanese Geotechnical Society (JGS) standard (JGS, 2009).Fig.1 shows the scanning electron microscope (SEM) images of tested materials.SGB has an approximately rounded shape while CGB and SS have more angular shapes.Following Altuhafi et al.(2013), the shape parameters, i.e.sphericity (S), convexity (Cx) and aspect ratio (AR) of the tested materials were measured using a QICPIC apparatus.Material properties are given in Table 1, in which S, Cxand AR of the tested materials are taken from the median values of their shape parameter distributions.All these shape parameters range from 0 to 1; a greater value indicates that the particle is more rounded in shape.
2.2.Testing procedure
All samples were prepared on a triaxial apparatus with a height of L ≈150 mm and a diameter of D ≈75 mm.Dry deposition was applied with a funnel whose tip was lifted while touching the surface of deposited materials to ensure the initially loosestpacking.Materials were deposited layer by layer(totally five layers)while external vibration was applied using side tapping to achieve the desired initial packing density.After the material was all poured into the mould, a negative pressure of 50 kPa was given onto the latex membrane to evolve isotropic consolidation.It is noteworthy that isotropic consolidation and subsequent load-unload process were performed under dry and drained conditions without saturation process.Three densities were attained for each of the materials (i.e.dense, medium and loose) by adjusting the tapping energy, the initial void ratios (e0) and relative densities (Dr0) for samples are summarised in Table 2.
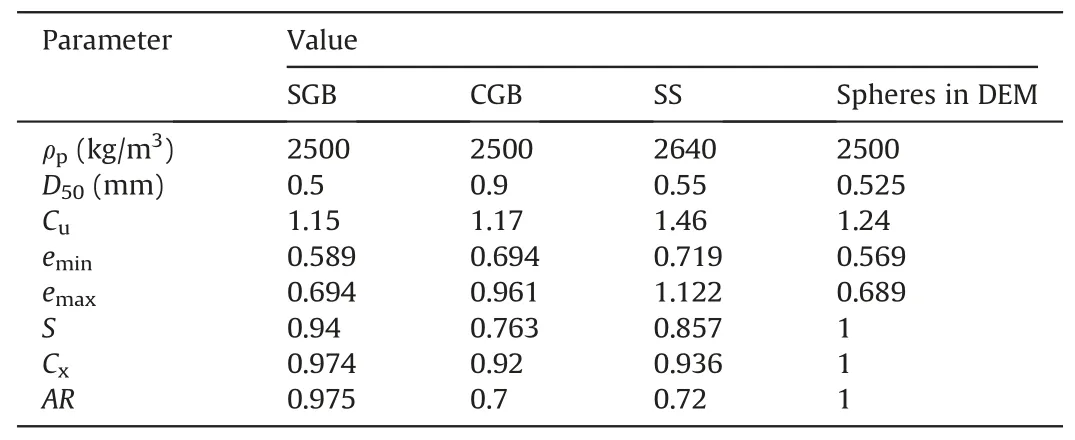
Table 1 Material properties of granular materials used in the laboratory tests and DEM simulations.
A stress-controlled scheme was adopted to perform load-unload cycles with a constant shearing rate of about 6×10⁻⁶s-1in which shearing was applied in the longitudinal direction while keeping minor principal stress stable (σ′3= 50 kPa).Three cycles were looped for SGB whereas four cycles were conducted for CGB and SS in a pre-peak range,respectively.The unload process was triggered by reversing the initial loading direction(i.e.triaxial compression)once the target stress ratios(q/qmax)were reached.To determine q/qmax, the maximum deviator stress (qmax) for each sample was obtained from a separate monotonic triaxial compression test for the given e0,allowing an error range of e0± 0.008.The monotonic loading tests were carried out using the same material for each following the identical sample preparation method and loading procedure.However, qmaxfor SS was estimated using curve fitting and extrapolation techniques from a series of experimental results of monotonic loading tests using SS.It is noted that for loose cases,there might not be a clear peak state regarding stress responses as the sample only experienced hardening behaviours throughout the loading.As an equivalence, the nominal qmaxwas selected at a similar axial strain(a)from their dense cases.As given in Table 2,q/qmaxgives an approximate reference to indicate the stress levels of load reversals, representing the target stress levels of the 1st,2nd,3rd or 4th cycles.
2.3.Wave measurement
Characteristics of wave propagation in granular media are highly complex and influenced by many parameters, such as particle size(e.g.Yang and Gu,2013),coefficient of uniformity(Cu)(e.g.Wichtmann and Triantafyllidis, 2013), and particle shape (e.g.Altuhafi et al., 2016).In Fig.2, particle size distributions (PSDs) of tested materials are compared while their Cuvalues are reported in Table 2.According to Yang and Gu (2013) and Wichtmann and Triantafyllidis (2013), the differences in D50and Cuof three materials give minor effects on the wave velocities so that the effect of particle shape can be compared at an equivalent packing or stress state.
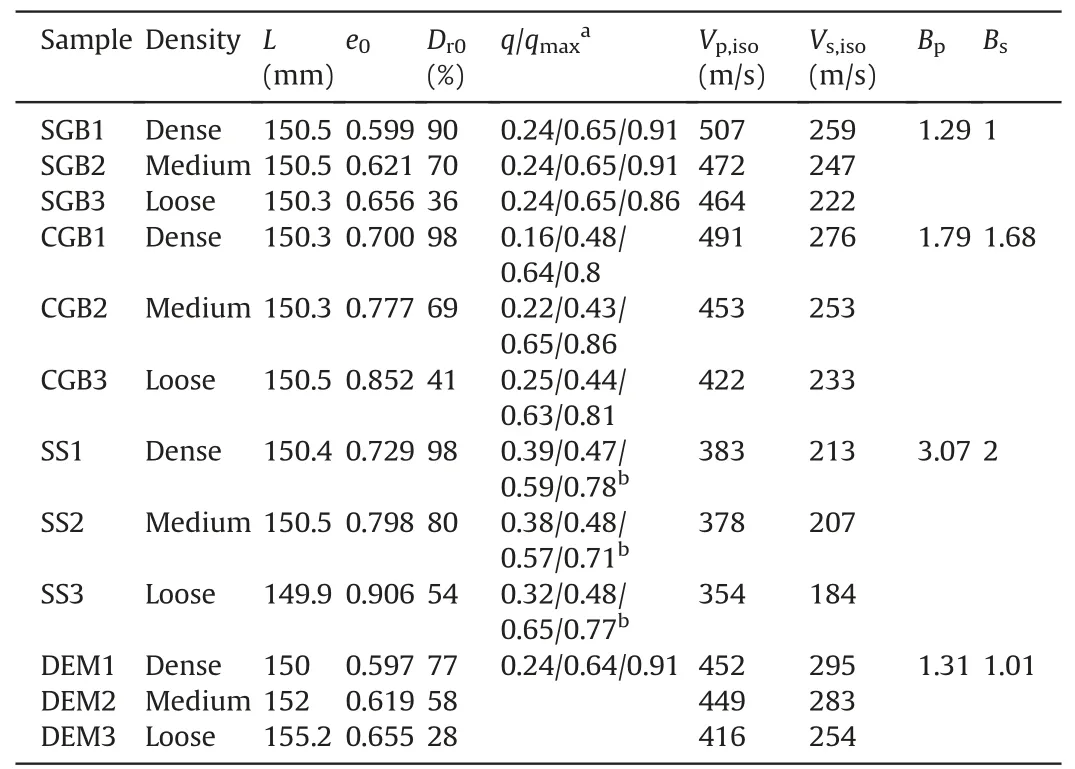
Table 2 Samples in the laboratory tests and DEM simulations.
This contribution applied disk transducers(DTs)installed in the top cap and bottom pedestal of the triaxial apparatus (Fig.3a) to generate and receive wave signals (Dutta et al., 2020).Wave velocity measurements were performed continuously during loadunload cycles without stopping the loading whose rate was slow enough to collect a sufficient number of wave data, as sketched in Fig.4.A single pulse of the sinusoidal waveform was generated as both P-and S-wave motions in the loading direction.The generated double amplitude was 140 V and the input frequency (fin) was 7 kHz.
3.DEM simulation
3.1.Sample preparation
A modified version of the open-source code LAMMPS(Plimpton,1995)was used to perform DEM simulations in this contribution.A simplified Hertz-Mindlin contact law (Itasca, 2007) was adopted with spherical particles as an analogy of SGB used in the laboratory.As listed in Table 1,ρp=2500 kg/m3and D50=0.525 were adjusted to be approximately similar to SGB and the PSD is linear ranging from 0.4 mm to 0.65 mm as given in Fig.2.The particle Young’s modulus Ep=64.5 GPa and Poisson’s ratio νp=0.23 were adopted in DEM model.The shape parameters are all 1 as particles are perfectly spherical in DEM simulations (Table 1).
A servo-control algorithm was applied to generating random packing samples (Hanley et al., 2015; Otsubo et al., 2017a;Morimoto et al., 2021).Firstly, a cloud of spheres was generated without touching each other in a cuboid cell without gravity.Then the cell was shrunk under a constant strain rate to reach half of the target stress.Subsequently,the velocity of boundaries was reduced as a function of σ′3to gradually reach the target stress.Finally,spheres gained their initial contacts to attain a stable equilibrium.In this contribution,three samples with different e0were prepared under σ′3= 50 kPa using interparticle friction coefficients (μiso) of 0.05, 0.1 and 0.2, leading to e0= 0.597, 0.619 and 0.655, respectively.Following Morimoto et al.(2021), emaxand eminare defined as the initial void ratios of samples in the isotropic state where μisovalues are 0.4 and 0.01, respectively.Li et al.(2021) utilised the identical algorithm and material properties to generate DEM samples and reported that e0values are 0.689 for μiso= 0.4 and 0.569 for μiso= 0.01, respectively.This range is comparable with those of SGB (Table 1) even though SGB is not perfectly spherical and has its inherent μiso.The properties of DEM samples are also summarised in Table 2.
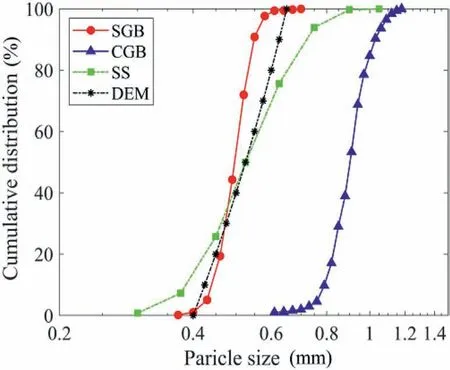
Fig.2.Particle size distributions of tested materials.
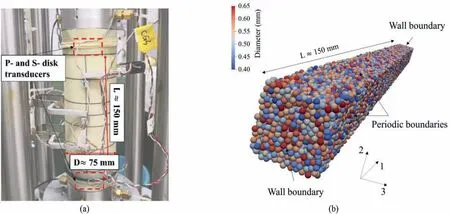
Fig.3.Representative samples composed of (a) SGB in the laboratory and (b) spherical particles in DEM simulations.
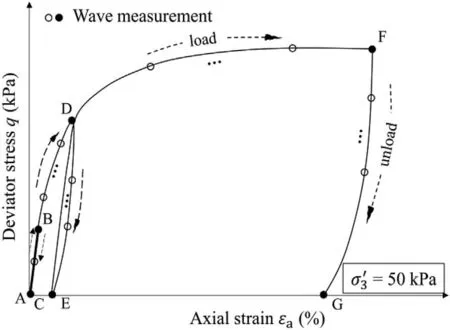
Fig.4.Schematic diagram of stress-strain relation and wave measurement points during load-unload cycles.
In comparison to granular samples prepared in the laboratory,the DEM samples are about 150 mm on the 1-axis, while about 6.8 mm(larger than 10 times the largest particle size)on the 2-and 3-axes to ensure the propagation of planar S-waves that oscillates in the horizontal direction.Wall boundaries were used in the longitudinal direction to simulate the rigid top cap and pedestal in the laboratory, as displayed in Fig.3b.To ensure the overall fabric isotropy of samples,periodic boundaries were applied in the lateral directions (Thornton, 2000).Considering the difference in lateral boundary conditions, i.e.membrane conditions in the laboratory versus periodic boundaries in DEM simulations, periodic boundaries may fail to observe the localised shear band or maintain a stable stress level when the shearing rate is high (Qu et al., 2019).However, this contribution aims for a microscopic investigation of how wave velocities are related to the change in soil fabric, these settings in DEM simulations are suitable for such a purpose,which has been adopted by past studies (e.g.Li et al., 2021; Liu et al.,2022).
3.2.Loading procedure
Following Li et al.(2021), the loading process was carried out using a constant strain rate of 2 × 10⁻³s-1with an interparticle friction coefficient of μshear= 0.4.This loading rate ensures the quasi-static flow of granular materials according to Lopera Perez et al.(2016).Three load-unload cycles were conducted with q/qmax= 0.24, 0.64 and 0.91 where qmaxwas obtained from the identical DEM samples as reported in Li et al.(2021).Especially,qmaxof the loose‘DEM3’sample was defined as the value at arounda= 3%).One side of the wall moved inward to perform the load process (increasing σ′1) while the positions of periodic boundaries were adjusted to maintain σ′3.The loading direction was reversed once the target q/qmaxwas reached and the unload process(decreasing σ′1) was continued until q reached 0.
3.3.Wave propagation
As an equivalence of the laboratory test, the wave propagation was performed continuously during load-unload cycles as described in Fig.4.Different from that in the laboratory, a creep stage was carried out to maintain the stress state with an increase in μcre=μshear+0.1 prior to the wave propagation.μwave=μcrewas sustained during wave propagation and an increase in μ does not change the wave velocities, as confirmed by Magnanimo et al.(2008) and Otsubo et al.(2017a).Following Otsubo et al.(2020), a sinusoidal displacement with a double amplitude of 5 nm and fin=7 kHz was excited on the‘transmitter’wall in either 1-or 2(3)-axis (as shown in Fig.3b) to generate planar P- or S-waves,respectively.Subsequently, elastic waves propagated through the granular sample along the 1-axis to the‘receiver’wall at the other end.The resultant changes in stresses on both walls were treated as wave signals to calculate Vpand Vs.The selection of local and viscous damping factors (i.e.ζlocaland ζvis) at each stage consistently followed Li et al.(2021).
4.Data interpretation of wave signals
Referring to Fig.4, stages at the start and end points as well as the turning points of stress of each cycle(i.e.A to G,black dots)are specially selected to plot wave signals.Fig.5 shows the wave signals of two representative samples from the laboratory test (SGB1,e0= 0.599) and DEM simulation (DEM1, e0= 0.597) where the horizontal axis denotes the time normalised by the sample length(L) while the vertical axis stands for the amplitude of voltage or stress of wave signals normalised by its maximum value.In the laboratory, the arrival time for Vpwas determined by the start-tostart method.Dutta et al.(2019) reported that Vsvalues calculated based on the start-to-start method and peak-to-peak method are comparable when fincoincides with the dominant received frequency in the frequency domain.A check was made before the test that fin= 7 kHz ensures the reliable determination of wave velocities,also concerning the relationship between sample length and wavelength (Joviˇciˊc et al., 1996).Consequently, the peak-topeak method was used to determine Vsto avoid the near-field effect when selecting the first rise of Vs(Arroyo et al.,2003).In DEM,Otsubo et al.(2017b)confirmed that the peak-to-peak method and frequency domain analysis give almost identical wave velocities when planar waves are generated using lateral periodic boundaries.It is trivial to pick up the first peak of received wave signals to determine both Vpand Vs.A check was also made to confirm that the start-to-start method and peak-to-peak method give almost identical Vpwithin an error range of ±1.6% for DEM results.
Fig.6 compares the P- and S-wave velocities in the isotropic state(i.e.Vp,isoand Vs,iso)with e0for three types of materials in the laboratory and spheres in DEM simulations.Hardin and Richart(1963) introduced the void ratio correction function for wave velocities in the isotropic state, which can be expressed as
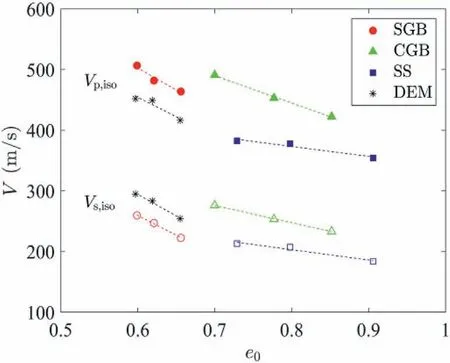
Fig.6.P-and S-wave velocities(Vp,iso and Vs,iso)with initial void ratio(e0)in the initial isotropic stress state (i.e.stage A, = 50 kPa) for tested materials in the laboratory and DEM simulation.
where Bp= -B1/B2and Bs= -B3/B4serve as the parameters to reveal the density-dependency of Vp,isoand Vs,iso, and their values are summarised in Table 2.Absolute values of Vpand Vsare not comparable between SGB and spheres in DEM.This might be because SGB is not perfectly spherical and rigid, leading to the difference in comparison to the contact model adopted in DEM which assumes that spherical particles are smoothly contacted without particle deformation.However, Bpand Bsfor SGB are 1.29 and 1, compared with those for DEM (i.e.1.31 and 1.01).These comparable Bpand Bsvalues successfully validate the densitydependency of spheres in DEM simulations.On the other hand,Bpand Bsvalues of CGB and SS are greater than those of SGB,in line with Cho et al.(2006) and Tang and Yang (2021).
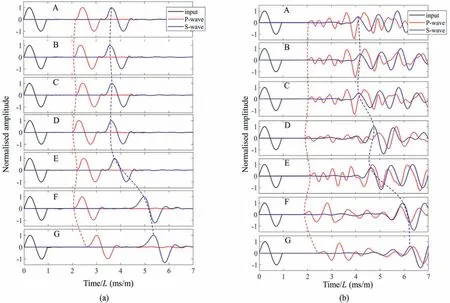
Fig.5.Representative examples of wave signals measured at different stages during load-unload at σ′3 = 50 kPa in (a) the laboratory (SGB1, e0 = 0.599) and (b) DEM simulations(DEM1, e0 = 0.597) (stages A to G refer to Fig.4).
5.Experimental results
Fig.7 provides the variations of q withaduring load-unload cycles at a pre-peak stage for three materials tested in the laboratory.Three cycles were applied to SGB, while four cycles were performed on CGB and SS whose dense cases experienced five cycles.As each cycle was governed by the stress-controlled scheme(i.e.q/qmax),theawhere the loading direction is reversed does not appear to be density-dependent.Once the loading direction is reversed, q decreases sharply whereas gently approaches 0.aexhibits accumulated hysteresis after every cycle even if the stress level is returned to isotropic state.
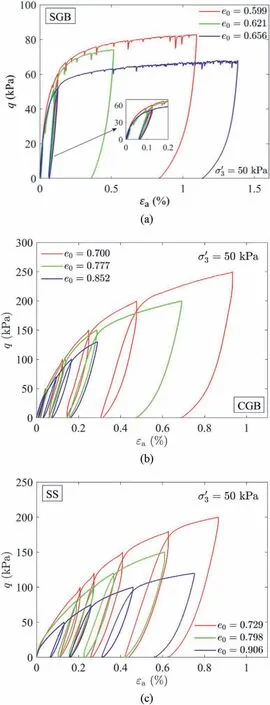
Fig.7.Variations of deviatoric stress (q) with axial strain ( a) during load-unload cycles for tested materials in the laboratory: (a) SGB, (b) CGB, and (c) SS.
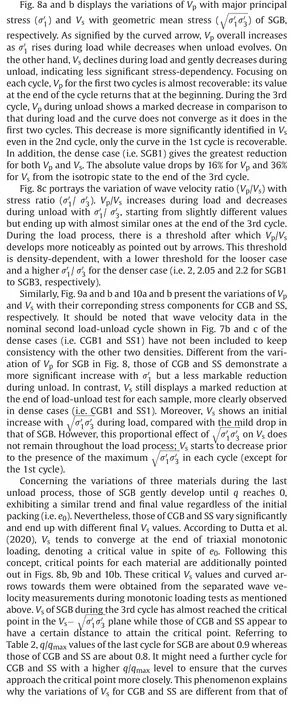
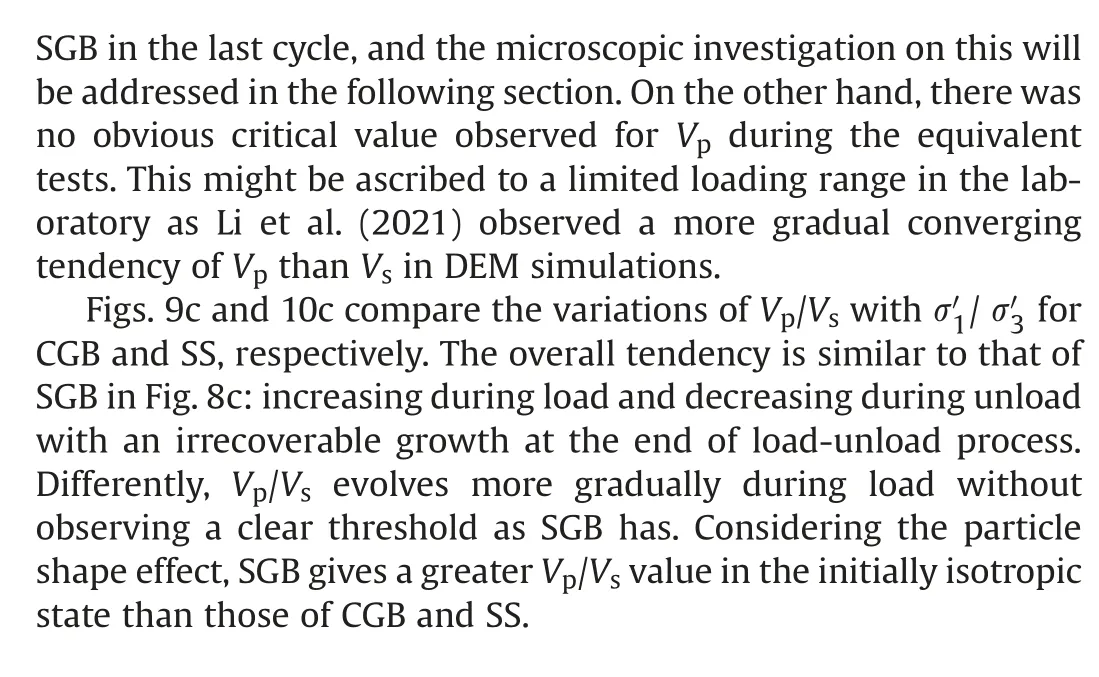
6.DEM simulation results
Fig.11 shows the variations of q withaduring load-unload cycles using spherical particles in DEM simulations.As listed in Table 2, e0and q/qmaxwere adjusted almost identical to those of SGB to have a better comparison between experimental and simulation results.The first two cycles are finished within a small strain range while the 3rd cycle evolves until abouta=1%,which is comparable with Fig.7.However,the absolute values in terms of q are not quantitatively comparable despite this careful adjustment;this is ascribed to the difference in boundary conditions and manual selection of μ during DEM simulations,referring to Li et al.(2021).
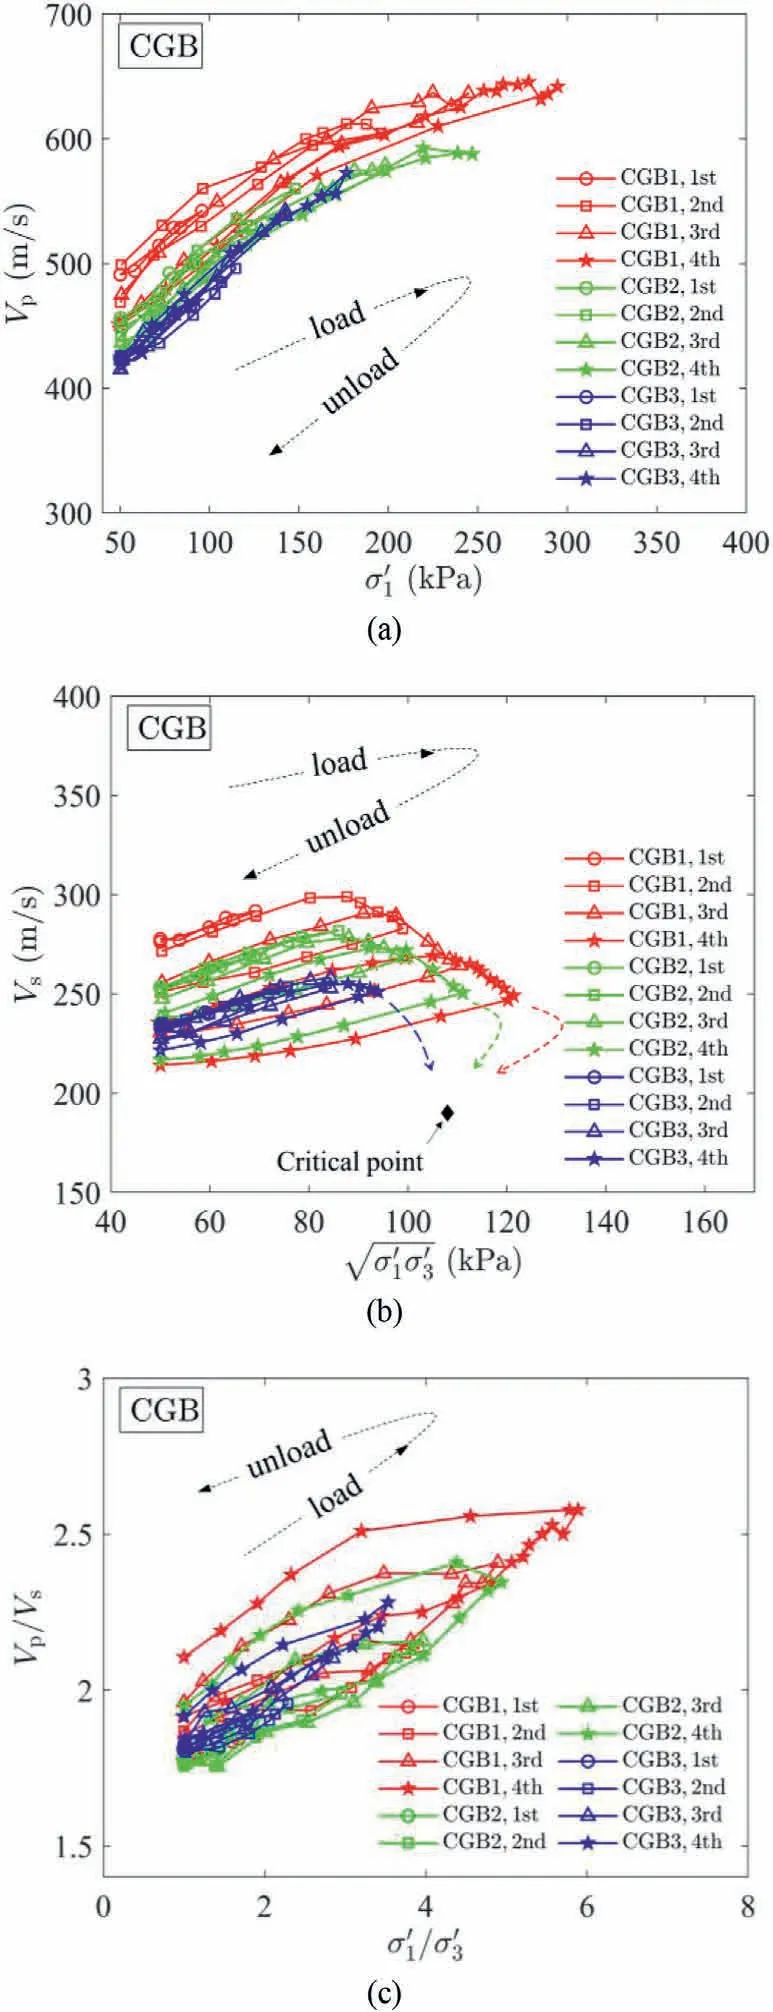
Fig.9.Variations of (a) P-wave velocities (Vp) with major principal stress (), (b) Swave velocities (Vs) with geometric mean stress and (c) wave velocity ratio(Vp/Vs)with stress ratio()during load-unload cycles for CGB(critical points were obtained from separate monotonic loading tests using CGB).
Fig.12 presents the variations ofand Vp/Vsσ′1/ σ′3relationships for DEM results in the same manner of Fig.8,respectively.The overall trends of Vpand Vsare similar to those in Fig.8; Vpis almost reversible in the 1st and 2nd cycles whereas Vsonly shows a recoverable tendency in the 1st cycle,as illustrated in the insets of Fig.12a and b.In the 3rd cycle,both Vpand Vsexhibit a noticeable decrease during unload.Concerning the DEM1 sample,the reduction ratios in Vpand Vsare 20% and 34%, respectively, in comparison to 16%and 36%for SGB in Fig.8.As indicated in Fig.12,the critical points of Vp,Vsand Vp/Vsduring monotonic loading are obtained from Li et al.(2021), and Vp, Vsand Vp/Vsof all samples approximately reach the critical point during load of the 3rd cycle.Furthermore,Vpand Vsapproach their similar values at the end of the 3rd cycle regardless of e0.An apparent difference from Fig.8 is that Vpshows a drop during load in the last cycle,while that of SGB continuously increases with σ′1.According to Li et al.(2021), Vpis influenced by σ′1and the evolution of particle contacts contributing to the loading direction.The development of σ′1and the particle rearrangement evolve gradually in the experiments; however, the change in stress is not accompanied by a synchronised change in soil fabric as q rises abruptly in the initial straining.Therefore,the decrease in Vpis attributed to a more governing role of soil fabric than the stress state,resulting in the distinct two phases during the 3rd load process.Fig.12c shows a qualitatively comparable variation with Fig.8c:the change in Vp/Vsis minor in the first two cycles while more significant in the last cycle.There are also obvious thresholds where Vp/Vsstarts dramatically increasing,with a higher threshold for denser samples.The exact threshold values of σ′1/σ′3are lower than those in Fig.8c due to the difference in q-aresponses as explained above.
7.Evolution of soil fabric related to wave velocities
The existence of unique critical states of micromechanical parameters during triaxial loading was investigated by Gu et al.(2014).They found that mean coordination number and fabric anisotropy also exhibit the critical values like macroscopic parameters such as q, demonstrating unique critical lines with varying confining pressures.To figure out the evolution of soil fabric during load-unload cycles, e and mean coordination number (CN) can be investigated as quantitative parameters to add more insights.Fig.13a presents the variation of e with σ′1/σ′3during load-unload cycles.For three DEM samples, e is completely reversible for the 1st and 2nd cycles,i.e.the variation of e during unload follows the trajectory of load.During the 3rd load, e becomes larger when q approaches qmax; nevertheless, e only shows a limited change during the 3rd unload and does not show any convergence tendency at the end of the load cycle.This observation is densitydependent and more remarkable in denser samples, revealing that the overall packing cannot be recovered even though the stress level is maintained isotropic again.
CN is calculated using the following equation:
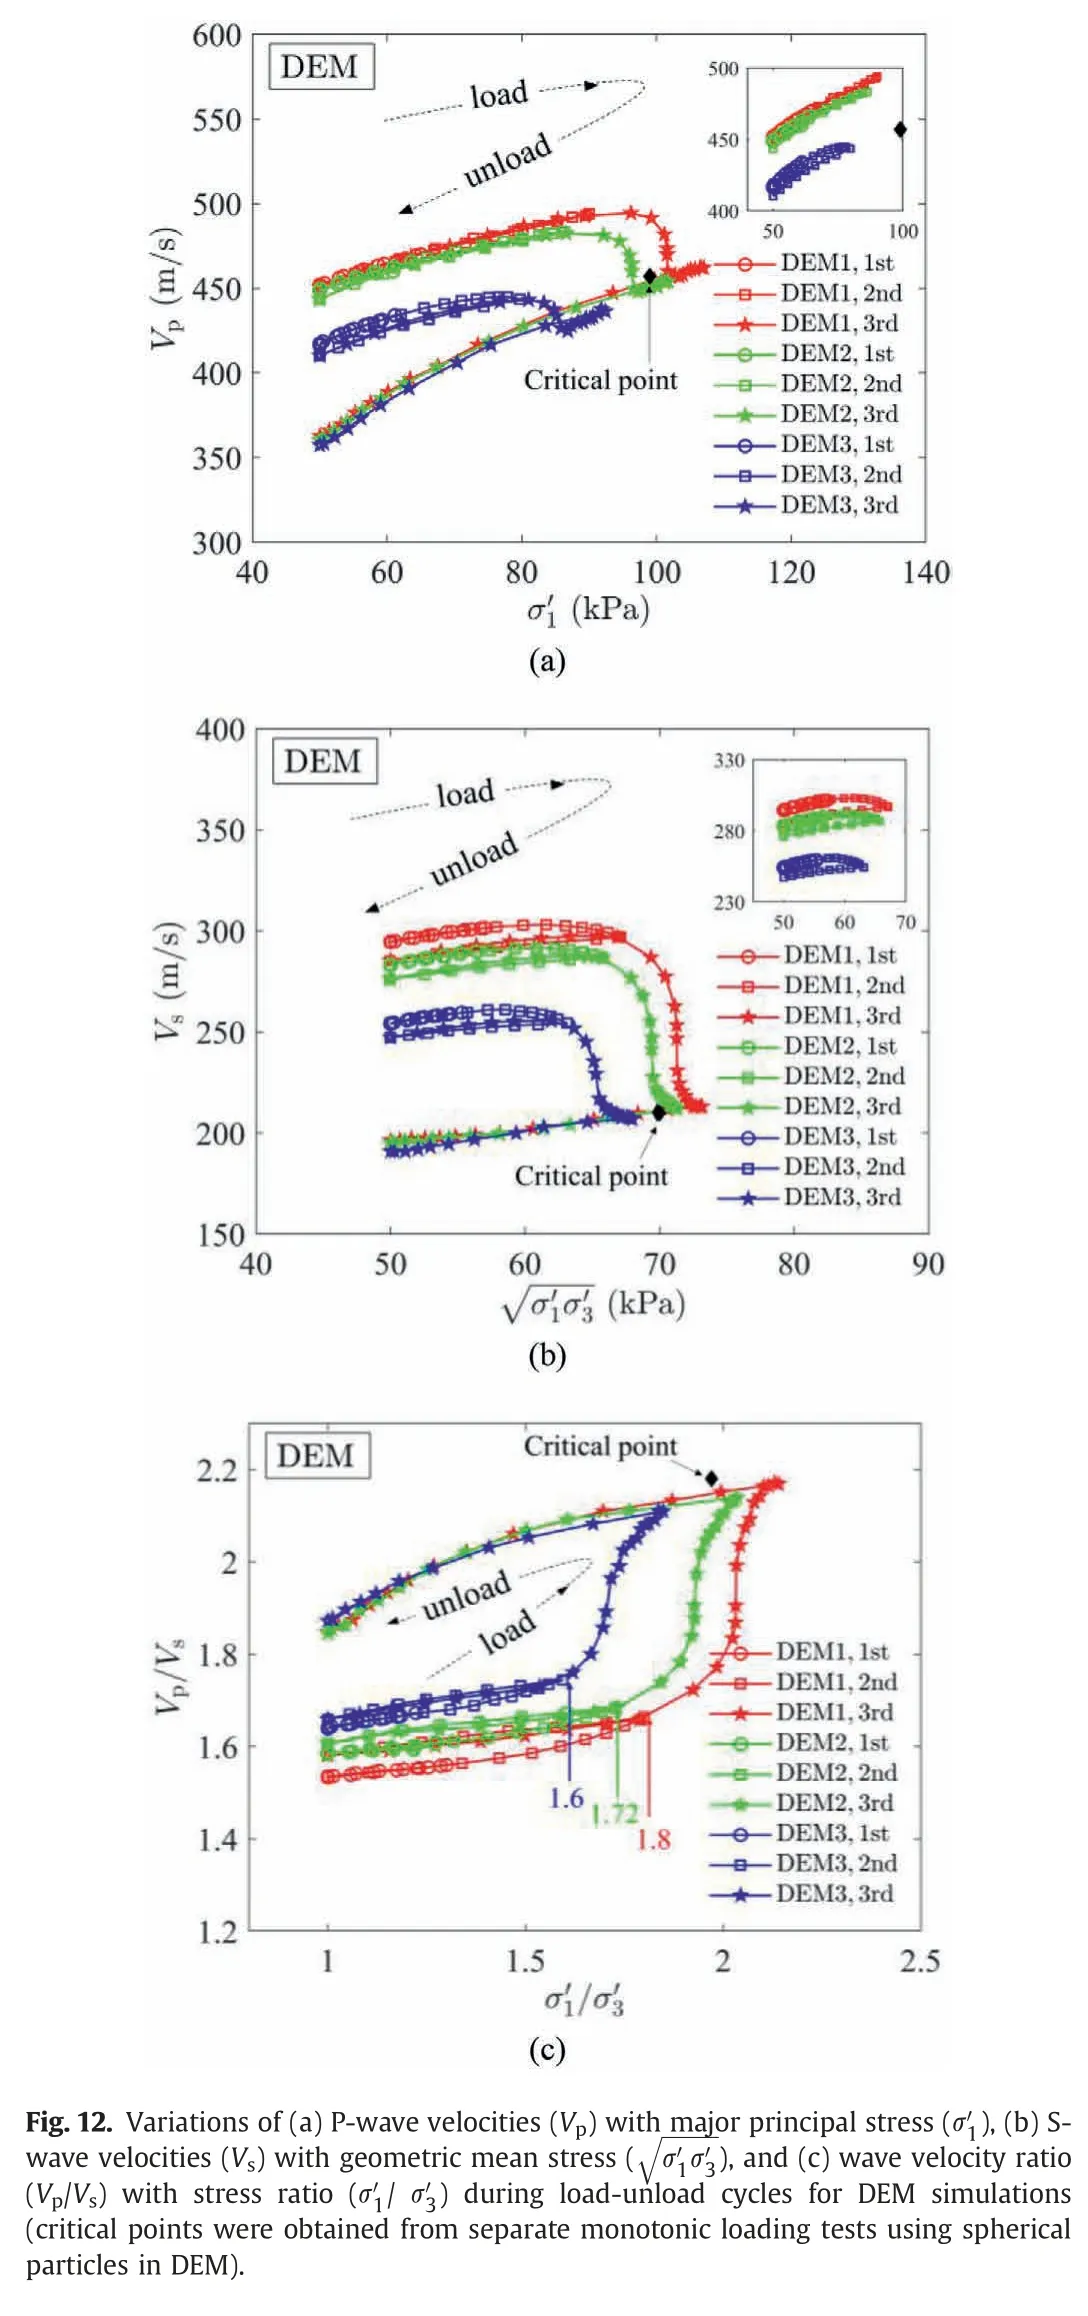

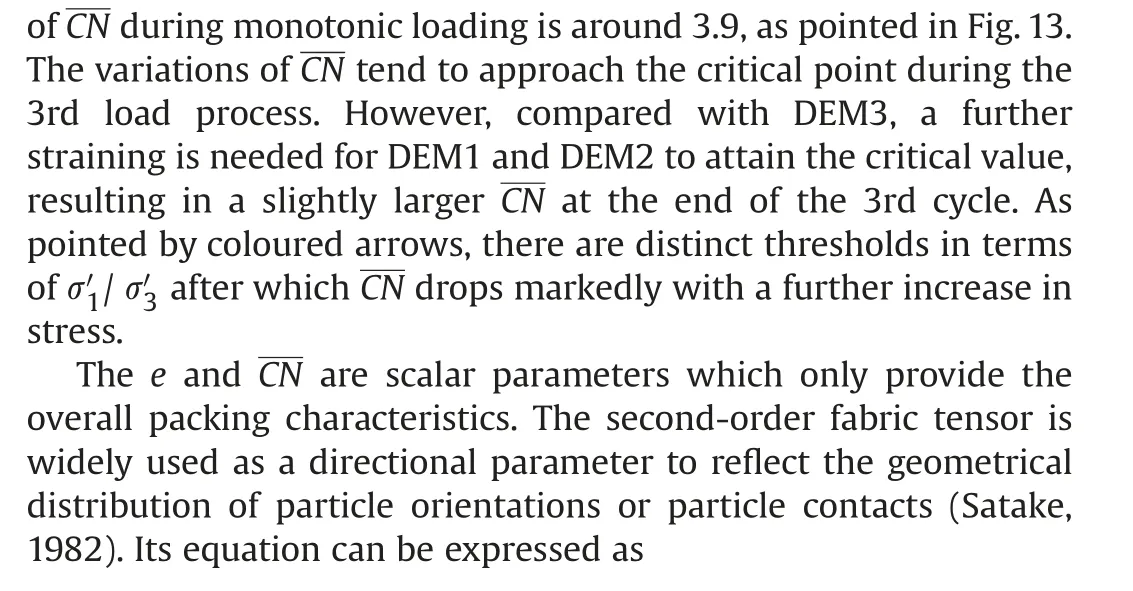
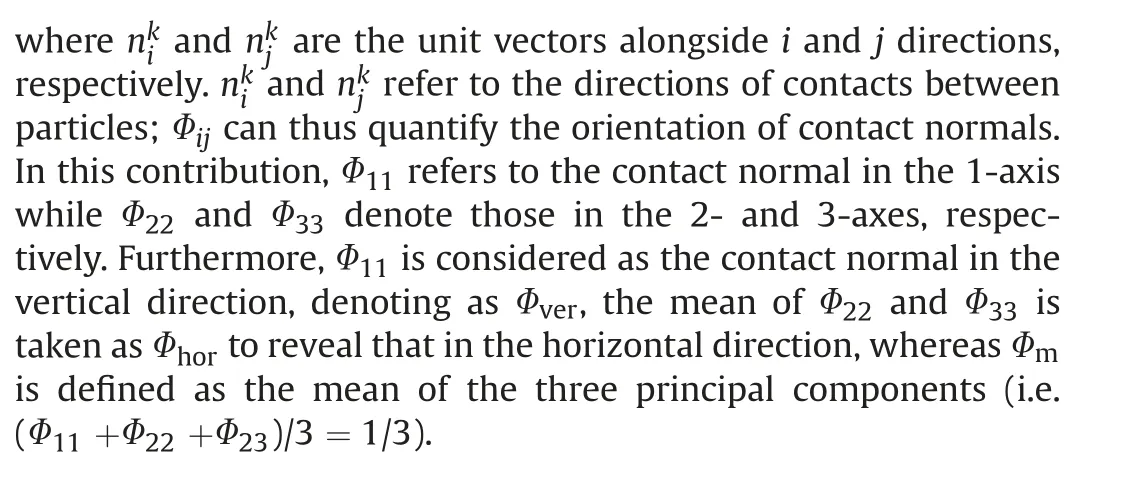
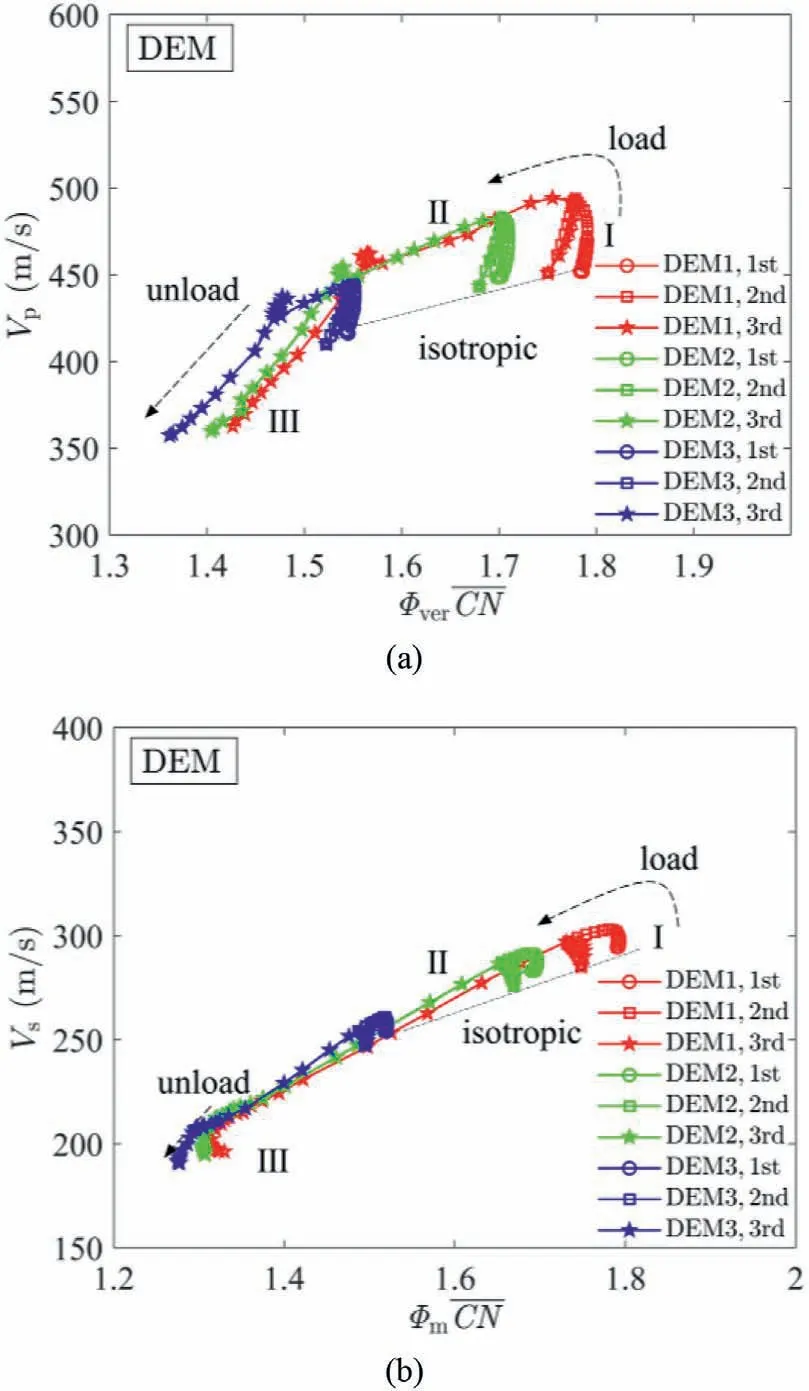
Fig.14.Variations of(a)P-wave velocities(Vp)with a combination of fabric anisotropy andmeancoordinationnumber,and (b) S-wave velocities (Vs) with an effectivemean coordinationnumberduring load-unload.
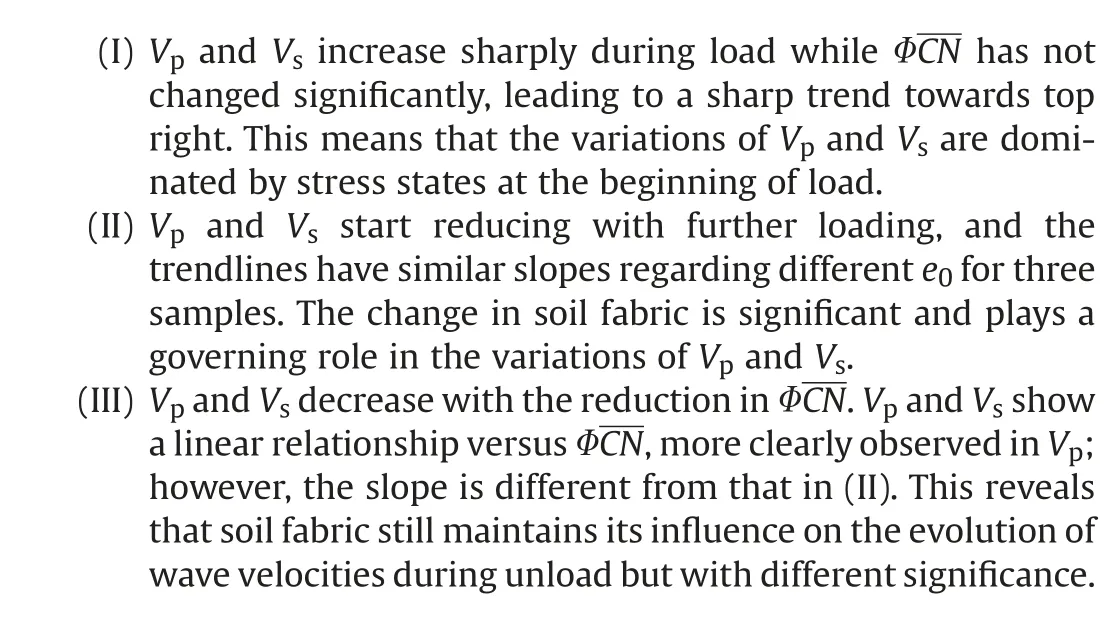
Consequently, the evolution of Vpand Vscannot be simply correlated by ΦCN during load-unload cycles as it works in monotonic loading conditions.O’Sullivan and Cui(2009)found that the particle rearrangement is less significant in the load-unload cycle with less hysteresis.This explains why the change in ΦCN(i.e.soil fabric) is more noticeable in the 3rd cycle, referring to Fig.11.
Fig.15 presents the evolution of soil fabric during load-unload cycles at selected stages (from A to G, referring to Fig.4).At the centre part of a representative sample(DEM1)with a height/width ratio of about 2 in the vertical plane (i.e.1-2 (3) plane).The distribution of normalised normal contact force(F*n,normalised by its maximum value)is revealed by coloured force chains whose radius is proportional to the intensity of normal contact force.The force chains in the isotropic state(A)are uniformly distributed,revealing fabric isotropy.Regarding the force chains at the maximum stress state in each cycle(i.e.B,D and F),more force chains tend to align in the vertical direction, showing fabric anisotropy.The degree of fabric anisotropy is more significant at F,which is attributed to the more significant stress anisotropy;more contacts are orientated in the vertical plane to transmit stress.Concerning the force chains at the end of each cycle(i.e.C,E and G),samples are under an isotropic stress state as that at A; however, fabric anisotropy is still clearly observed, especially at G.
Fig.16 shows the distributions of contact normal orientations for the same DEM1 at equivalent stages in Fig.4, in which the distribution in the isotropic state(A)is plotted using a filled shape with light grey colour to compare with those at other stages.At the maximum stress state in each cycle(i.e.B,D and F),more contacts are gradually lost in the horizontal direction than those in the vertical direction during each cycle,indicating fabric anisotropy in the vertical plane (1-3 plane).In contrast, the contacts are uniformly lost in all directions in the horizontal plane(2-3 plane).At the end of each cycle(i.e.C,E and G),overall fabric anisotropy and fabric isotropy can still be observed in the vertical and horizontal planes,respectively.The contacts in the vertical direction continue lost upon unload(e.g.from F to G);however,those contacts in the horizontal plane appear to be unchanged.
Fig.17 illustrates the evolution of Φver/Φhorwith σ′1/σ′3during load-unload cycles, in which Φver/ Φhorquantifies the fabric anisotropy of the microstructure of granular samples.Referring to the inset,Φver/Φhoris approximately recovered during the 1st and 2nd cycles.In the 3rd cycle, Φver/ Φhorgently increases initially,followed by a significant rise subsequently with the further development of σ′1/ σ′3.Again, the thresholds are pointed using coloured arrows and their σ′1/ σ′3values are 1.8, 1.72 and 1.6 for DEM1 to DEM3, respectively.Upon unload, Φver/ Φhordecreases with the decrease of stress anisotropy; nevertheless, as visualised in Fig.15,Φver/Φhoris consistently larger than that during load and the value at the end of the cycle is not recovered.According to Li et al.(2021), the variations of Vpand Vshave their critical states during monotonic shearing caused by an identical soil fabric.In Fig.17,Φver/Φhorvalues tend to converge at the end of the 3rd cycle,indicating a critical soil fabric regardless of the initial packing density.This microscopic observation confirms that Vpand Vscan also attain their critical points if the sample has reached a critical fabric condition during load-unload, as shown in Fig.12.Looking back at the experimental data from Figs.8-10, Vsof three SGB samples presents comparable variations during unload of the third cycle, while CGB and SS samples show considerable differences.This is because SGB samples have reached the stage closer to their critical fabrics in comparison to CGB and SS samples during load processes.
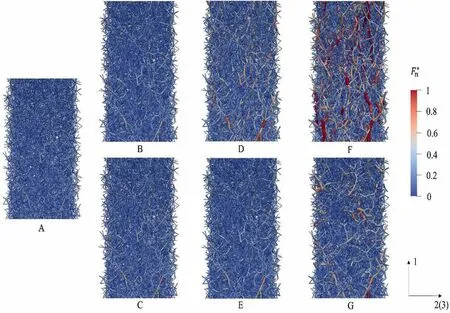
Fig.15.Visualisation of force chains of the centre part of the representative DEM sample (DEM1) at different stages during load-unload cycles.
Figs.12 and 17 show similar varying patterns for Vp/Vsand Φver/Φhorwith σ′1/ σ′3; moreover, Li et al.(2021) found a proportional relationship between Vp/Vsand Φver/ Φhorduring monotonic loading.Motivated by this evidence,Fig.18 presents the correlation between Vp/Vsand Φver/Φhorfor three DEM samples during loadunload cycles, in which ‘*’ mark denotes the values normalised by those in the isotropic state.A linear relationship is found irrespective of initial packing densities and stress states with an equation of (Φver/ Φhor)* = 0.72(Vp/Vs)* + 0.27 and a R2value of 0.993.This reveals that fabric anisotropy can be predicted by wave velocity ratio not only limited in the monotonic loading but also in the load-unload cycles.The irrecoverability of soil fabric is well correlated by a synchronised variation of wave velocity ratio.It should be mentioned that this linearity between Vp/Vsand Φver/Φhorin this contribution is limited to the pre-peak stage and a further check can be extended to the post-peak stage.In practice,Vpand Vsare convenient to measure at a given stress state of soils while microstructure requires more advanced techniques to explore.By knowing the relationship in Fig.18,Vp/Vscan thus serve as an index to refer to the soil fabric anisotropy with reliable applicability.
Gu et al.(2017)found that there exists a threshold using σ′1/σ′3after which stiffness anisotropy evolves more rapidly, indicating the significant rearrangement of soil particles.In their study, the threshold value is about 1.6 for compression while 0.8 for extension of a granular sample with e0=0.626.In comparison,σ′1/σ′3=1.6 is observed for e0= 0.655 in Fig.17.Note that the evolution of Vp/Vscan reflect the fabric change,and Figs.8c and 10c give insights into the fabric change in the laboratory.Thresholds for SGB are σ′1/σ′3=2.2,2.05 and 2(Fig.8c),respectively;in comparison to 1.8,1.72 and 1.6 in DEM simulations with equivalent e0(Figs.12c and 17).The lower threshold in DEM is ascribed to the lower strength during shearing,whose reasons have been illustrated in Fig.11 and Li et al.(2021).In Figs.9c and 10c, despite no distinct thresholds being identified for CGB and SS, Vp/Vs(thus fabric anisotropy)evolves more gradually with a larger σ′1/σ′3value and tends to increase more markedly after σ′1/ σ′3= 3 to 4.Referring to other experimental results, Hoque and Tatsuoka (1998) reported a value of 2.5 for e0= 0.653 using Toyoura sands.Ezoui and Benedetto(2009) found that the stiffness anisotropy becomes significant when σ′1/σ′3is greater than 2 using Hostun sands with e0= 0.819.To conclude, the threshold of σ′1/ σ′3is higher for non-spherical particles to trigger the development of soil fabric.
8.Scope and limitation of the present contribution
This contribution aims to investigate the variations of Vpand Vsduring load-unload cycles under dry and drained conditions.Supplementary DEM simulations using spherical particles were carried out to develop a better understanding of how soil fabric changes during load-unload cycles, and to figure out the relationship between the variations of Vp,Vsand the evolution of fabric anisotropy(Φver/ Φhor).Limitations should be admitted that this contribution does not apply identical PSDs for all tested materials.As revealed by Wichtmann and Triantafyllidis (2013) and Linero Molina et al.(2019), the effect of Cuhas significant impacts on small strain stiffness and steady state stress.Although Cuof the tested materials is not identical ranging from 1.15 to 1.46, which is not expected to cause a significant difference in the results according to Wichtmann and Triantafyllidis (2013).Yang and Gu (2013) and Dutta et al.(2019) also reported that Vpand Vsare not sensitive to D50in the time domain.Another limitation is that DEM simulations only used spherical particles without considering the effect of particle shape.According to prior experimental studies (e.g.Cho et al., 2006;Altuhafi et al., 2016) and simulation work (Boton et al., 2013;Binaree et al., 2020; Nie et al., 2021), particle shape has profound influences on packing densities, small strain stiffness, shear strength and critical state parameters of granular materials.This contribution puts more weight on exploring the link between the variations of wave velocities and the evolution of soil fabric, thus spheres were used in supplementary DEM simulations for high computational efficiency.The effect of particle shape on wave propagation should be checked in future work to extend the findings.
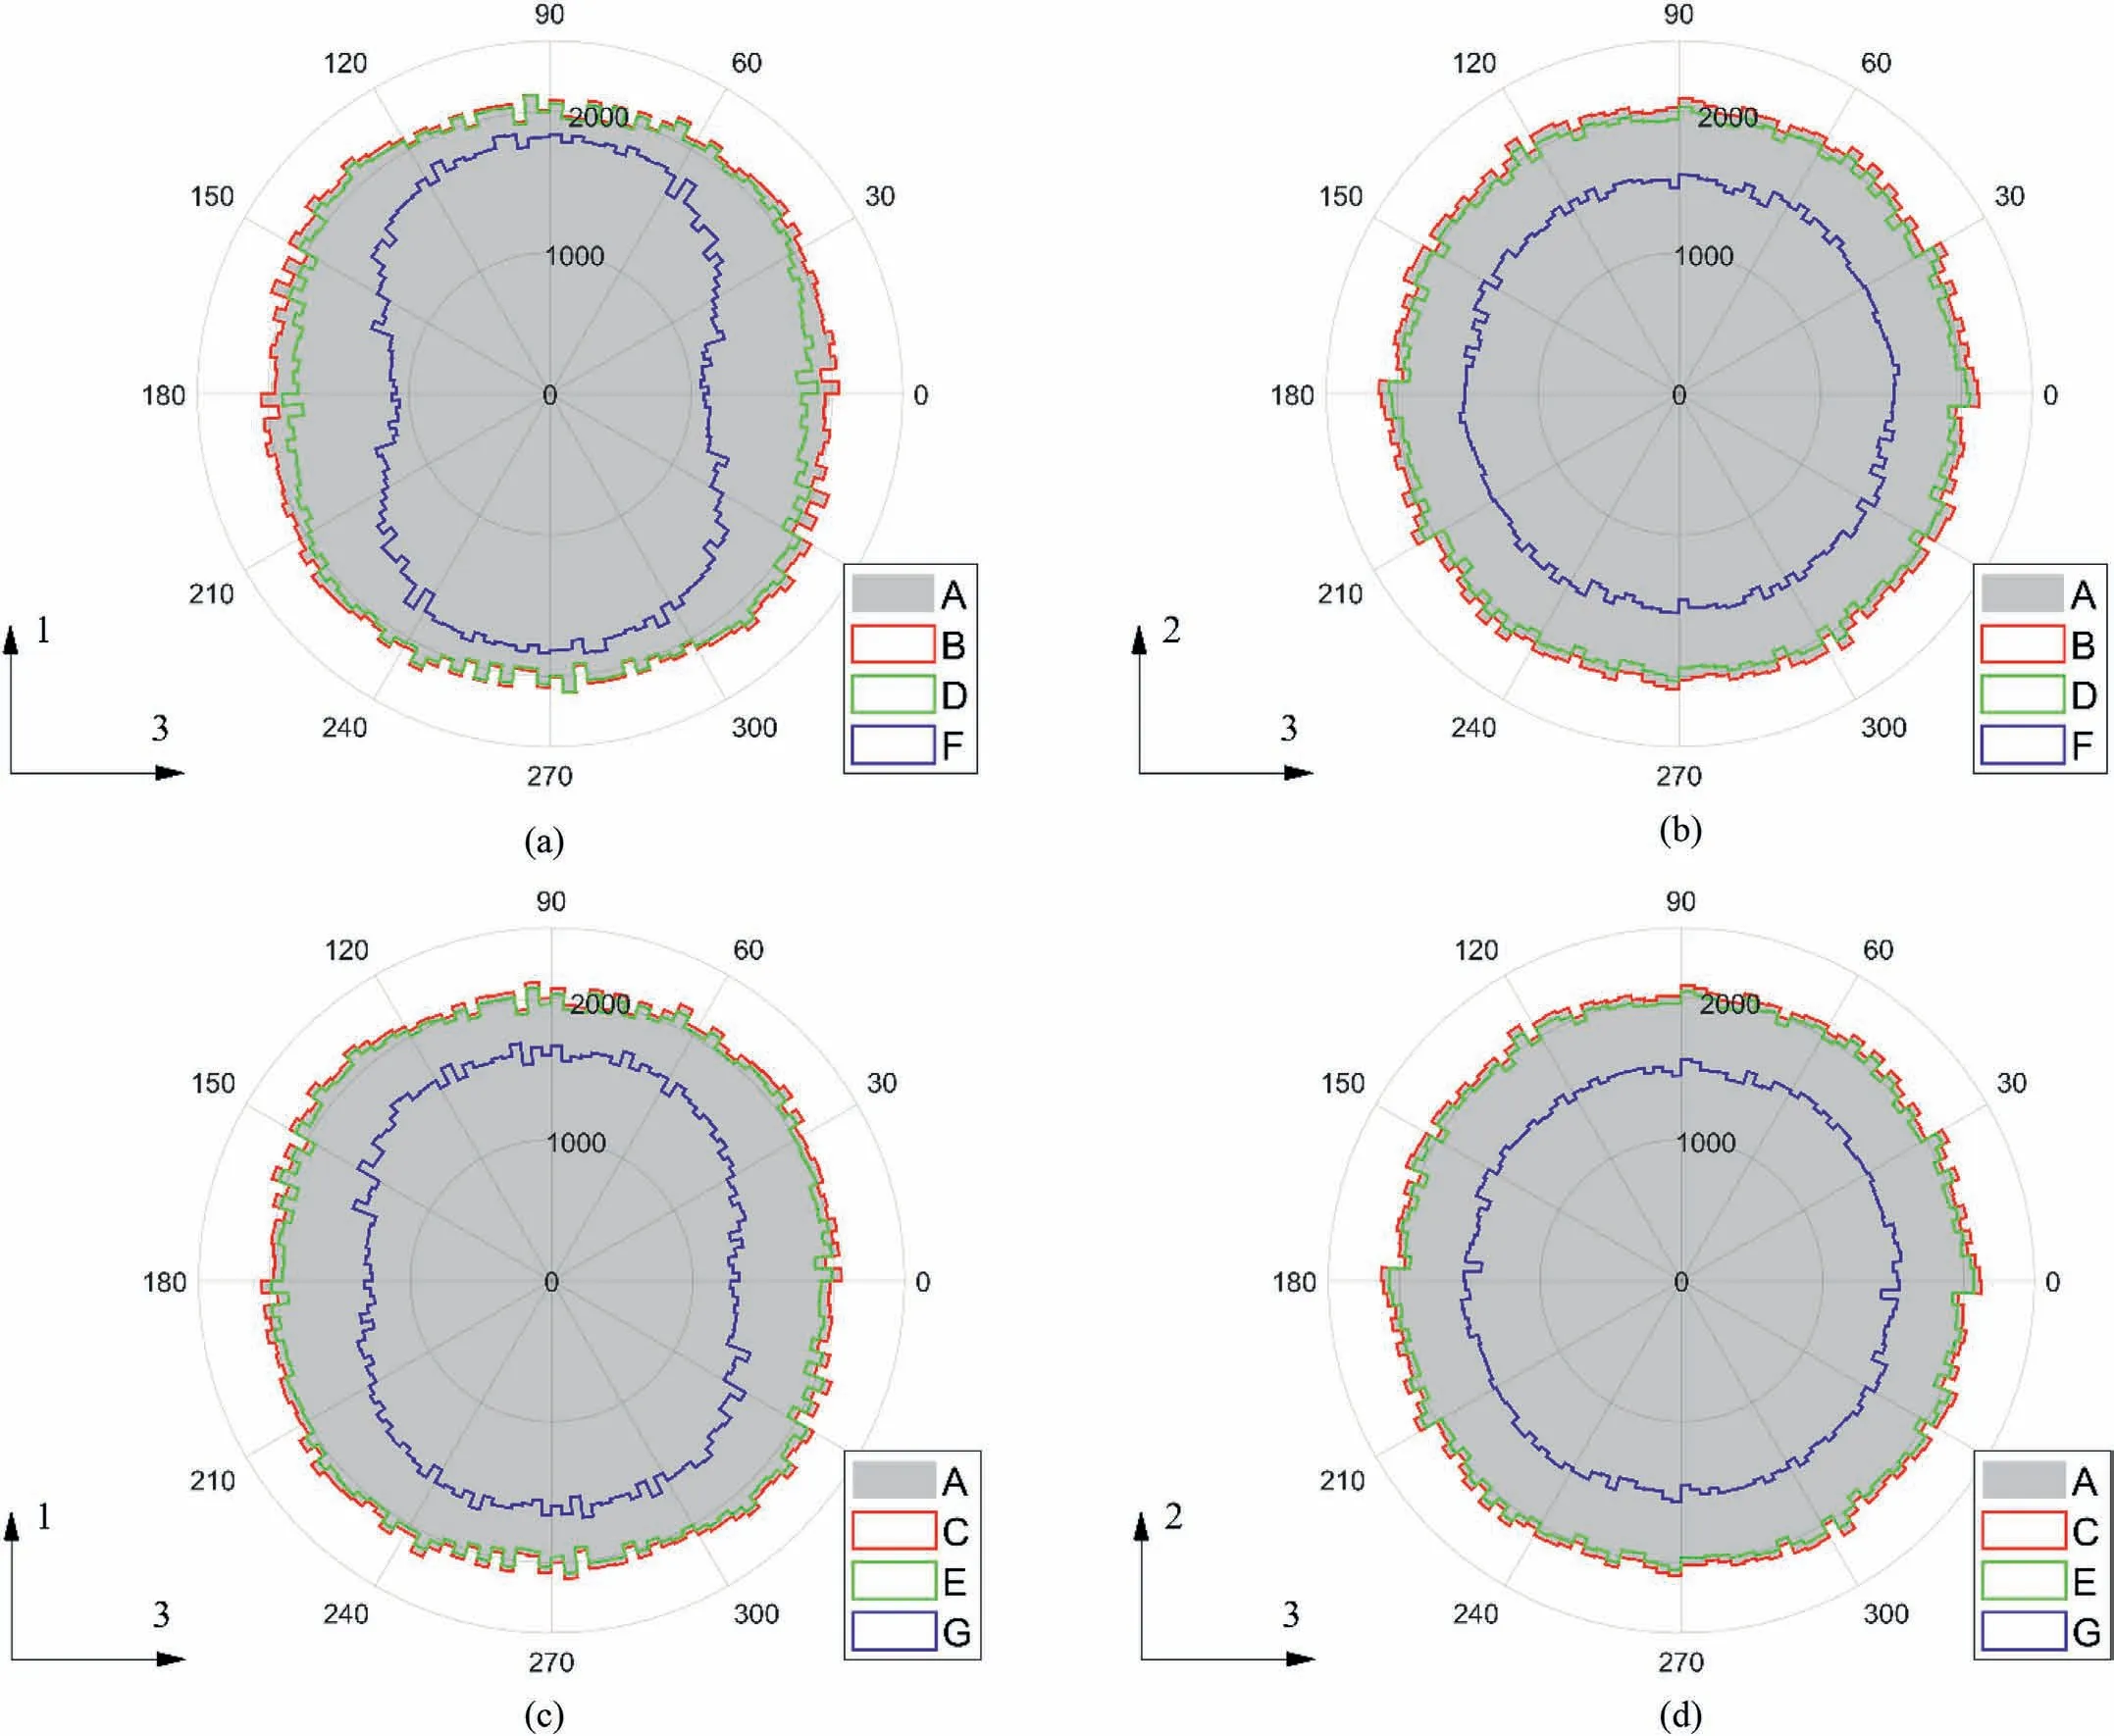
Fig.16.Distributions of contact normal orientations for a representative DEM sample(DEM1)at different stages during load-unload cycles:(a)Isotropic stress state and maximum stress states of each cycle in the vertical plane(1-3 plane),(b)Isotropic state and maximum stress states of each cycle in the horizontal plane(2-3 plane),(c)Isotropic state and the end of each cycle in the vertical plane(1-3 plane),and(d)Isotropic state and the end of each cycle in the horizontal plane(2-3 plane).The numbers around the circle are in degree.The absolute number in the radial axis refers to the intensity of contact normal.
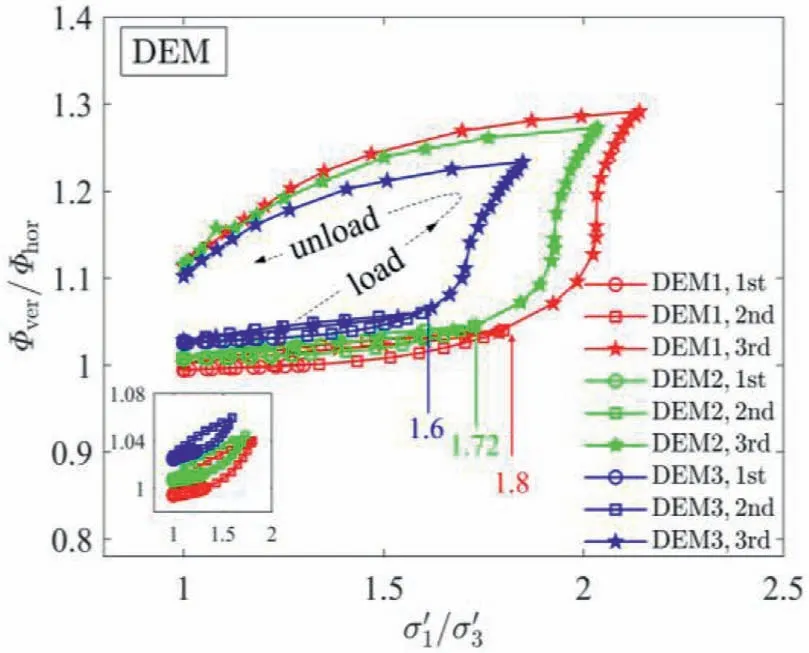
Fig.17.Variations of fabric ratio (Φver/ Φhor) with stress ratio (σ′1/ σ′3) during loadunload cycles.
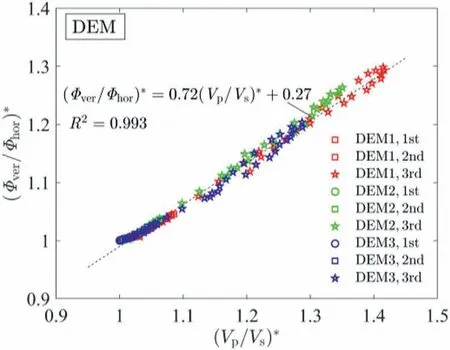
Fig.18.Correlation between normalised fabric ratio(Φver/Φhor)*and normalised wave velocity ratio (Vp/Vs)* during load-unload cycles.
9.Conclusions
This contribution has investigated the variations of wave velocities during load-unload cycles at a pre-peak stage under dry and drained conditions.Laboratory experiments were carried out using three types of granular materials with different particle shapes.Supplementary DEM simulations were performed using spherical particles to give additional insights into the evolution of soil fabric.Based on the experimental and simulation results, the following main conclusions can be drawn.
(1) P- and S-waves (Vpand Vs) display increases and decreases during load-unload cycles, but their variations are not accompanied by a synchronised change in stress.Vpand Vsduring unload do not follow the trajectory during load and show reductions despite the stress state being recovered to be isotropic, which is more clearly observed in those cycles with a higher target stress level(q/qmax).
(2) If samples having different initial packing densities(e0)for a given material have reached the critical points of Vpand Vsduring load,their variations of Vpand Vsare identical during unload regardless of e0.This proves the existence of the critical state for Vpand Vsduring load-unload cycles,resulting from a critical soil fabric.
(3) The fabric change is found to be stress- and densitydependent.For a given material, a greater stress ratio (σ′1/σ′3) is required to cause significant fabric change for denser cases.Considering the effect of particle shape,non-spherical materials exhibit a higher threshold of σ′1/σ′3to trigger fabric change in comparison to spherical materials.Once the samples have experienced the stress anisotropy after the threshold, wave velocities (Vpand Vs), mean coordination number (CN) and fabric ratio (Φver/ Φhor) start changing significantly, indicating the occurrence of stress-induced particle rearrangement.
(4) During load-unload cycles at a pre-peak stage, fabric ratio(Φver/Φhor) is found to be linearly correlated with wave velocity ratio (Vp/Vs).Despite the complicated internal change of granular assemblies, Vp/Vscan serve as a macroscopic reference to reflect the microscopic fabric anisotropy during load-unload cycles.
Declaration of competing interest
The authors declare that they have no known competing financial interests or personal relationships that could have appeared to influence the work reported in this paper.
Acknowledgments
This work was supported by JSPS KAKENHI (Grant No.22K14322).The DEM simulation in this contribution was performed using the super-computer system (Oakbridge-CX) at the Information Technology Centre, The University of Tokyo.The first author thanks the doctoral scholarship from Chinese Scholarship Council (CSC).
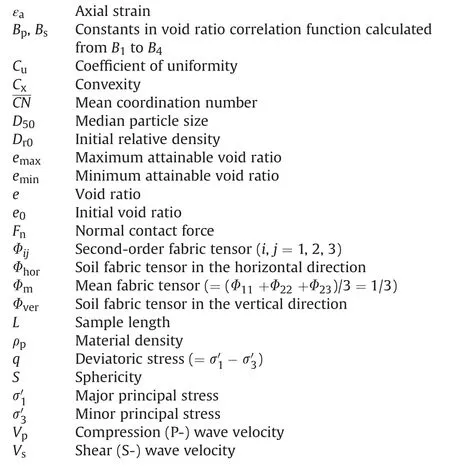
List of symbols
AR Aspect ratio
 Journal of Rock Mechanics and Geotechnical Engineering2023年10期
- Journal of Rock Mechanics and Geotechnical Engineering的其它文章
- Analytical solutions for the restraint effect of isolation piles against tunneling-induced vertical ground displacements
- Characterizing large-scale weak interlayer shear zones using conditional random field theory
- Displacement-based back analysis of mitigating the effects of displacement loss in underground engineering
- Investigation of long-wavelength elastic wave propagation through wet bentonite-filled rock joints
- Mechanical properties of a clay soil reinforced with rice husk under drained and undrained conditions
- Effects of non-liquefiable crust layer and superstructure mass on the response of 2 × 2 pile groups to liquefaction-induced lateral spreading
