Effects of non-liquefiable crust layer and superstructure mass on the response of 2 × 2 pile groups to liquefaction-induced lateral spreading
S.Mohsen Haeri, Morteza Rajabigol, Saman Salaripour, Hiwa Sayaf, Milad Zangeneh
Department of Civil Engineering, Sharif University of Technology, Tehran, Iran
Keywords:
ABSTRACT In this research, two shake table experiments were conducted to study the effects of non-liquefiable crust layer and superstructure mass on the responses of two sets of 2 × 2 pile groups to liquefactioninduced lateral spreading.In this regard, an inclined base layer overlain by a very loose liquefiable layer was constructed in both models;while only in one model,a non-liquefiable crust layer was built.A lumped mass,being representative of a superstructure,was attached to the cap of one pile group in both models.The models were fully instrumented with various sensors,including acceleration,displacement,and pore water pressure transducers.Also, the piles were instrumented with pair strain gauges to measure pure bending moments induced by cyclic and monotonic loadings associated with ground shaking and lateral spreading, respectively.The results showed that the existence of the non-liquefiable crust layer increases both the maximum and residual soil displacements at the free field and also the maximum bending moments in the piles.The results of the experiments indicated that the crust layer induces a high kinematic lateral soil pressure and force on the piles which are not present in the crustless case.The crust layer increases the pile cap displacement before liquefaction, albeit decreases it after liquefaction,due to the elastic rebound of the piles in the liquefiable layer.The crust layer postpones both liquefaction triggering and dissipation of excess pore water pressure.The existence of the superstructure mass on the pile caps decreases the acceleration amplitude of the pile caps, while increases their maximum displacement.
1.Introduction
Soil-pile interaction problems, especially in the case of a liquefaction-induced lateral spreading, are known as one of the most complicated problems in geotechnical earthquake engineering, as numerous factors affect the behavior of piles in liquefiable soil.Plenty of studies have been performed to enhance understanding of the dynamic response of pile groups to liquefactioninduced lateral spreading (e.g.Abdoun and Dobry, 2002; Abdoun et al., 2003; Imamura et al., 2004; Brandenberg et al., 2005, 2007;Ashford et al.,2006;Juirnarongrit and Ashford,2006;Pamuk et al.,2007; Uzuoka et al., 2008; Gonzalez et al., 2009; Motamed et al.,2009, 2010, 2013; Motamed and Towhata, 2010; Sato and Tabata,2011; Haeri et al., 2012, 2019, 2021; Knappett and Madabhushi,2012; Chang et al., 2013; Kavand et al., 2013, 2021; Li and Motamed, 2017; Liu et al., 2017; Ebeido et al., 2019; Li et al., 2019;Mao et al., 2019).Several researchers have studied the effects of superstructure mass or non-liquefiable crust layer on the response of piles to liquefaction-induced lateral spreading.For instance,Abdoun and Dobry(2002)conducted centrifuge tests to investigate the effects of the non-liquefied crust layer on the response of a single pile to lateral spreading and found that the crust layer increased the maximum bending moment of the pile.Brandenberg et al.(2005) conducted centrifuge tests to investigate the loads from the non-liquefied crust layer on a single pile and a 2×3 pile group due to lateral spreading.Motamed et al.(2010) carried out shake table tests to study the effects of the non-liquefiable layer on the behavior of a 3 × 3 pile group using a rigid box.The results of Motamed et al.(2010) showed that the non-liquefiable crust layer reduced the surface soil displacement, and as the thickness of the crust layer increased, lateral soil displacement decreased.Uzuoka et al.(2008) performed shake table and numerical modeling and investigated the effects of superstructure weight on a 3 × 3 pile group behind a quay wall and found that the crust layer significantly affected the maximum bending moments of the piles.
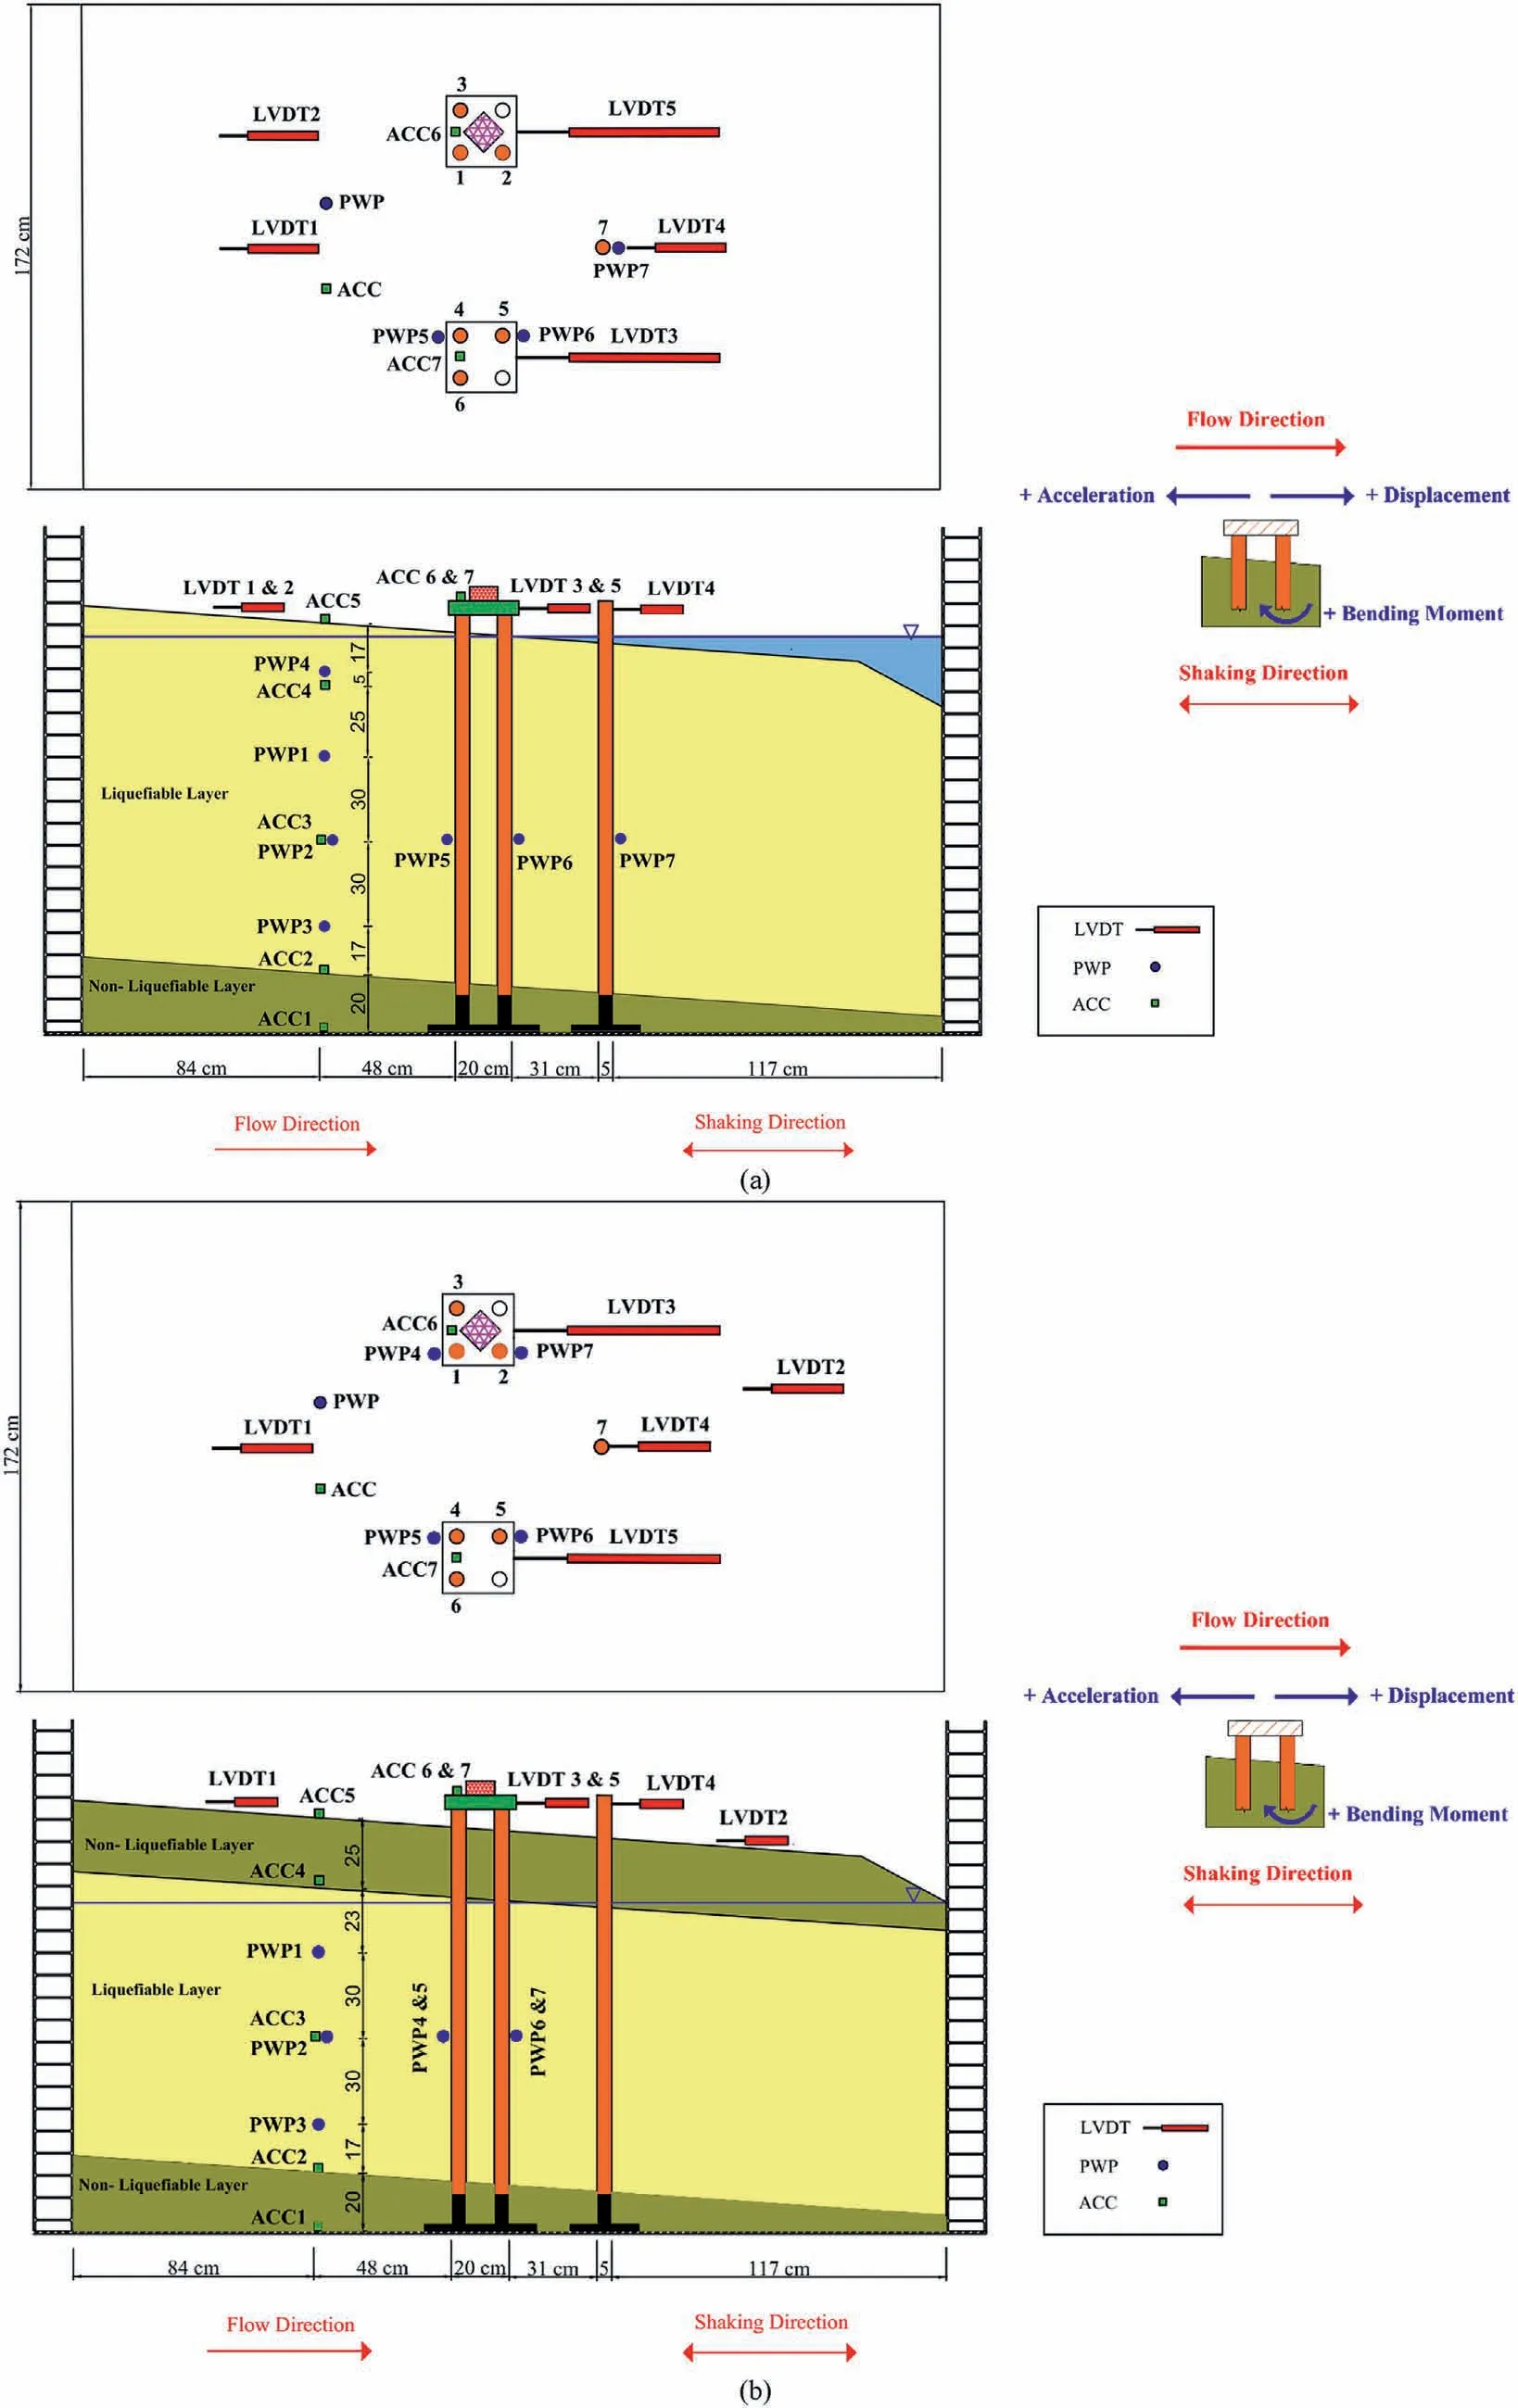
Fig.1.Schematic plan view,cross-section view,and diagram of the positive direction of different sensors:(a)The model without the crust layer,and(b)The model with the crust layer.
The present paper has focused on the response of 2 × 2 pile groups to liquefaction-induced lateral spreading.In the last two decades, some researchers conducted physical modeling experiments to investigate the effects of lateral spreading on 2 × 2 pile groups (Abdoun et al., 2003; Pamuk et al., 2007; Gonzalez et al.,2009; Sato et al., 2010; Sato and Tabata, 2011; Knappet and Madabhushi, 2012; Kavand et al., 2013; Tang et al., 2014; Liu et al., 2017; Ebeido et al., 2019).The effects of various parameters,including pile spacing, non-liquefied crust layer, soil permeability,and superstructure weight,on the response of 2×2 piles to lateral spreading are investigated in these studies.sKnappett and Madabhushi (2012) performed a series of centrifuge modeling to investigate the effects of superstructure weight on the behavior of floating 2×2 pile groups in a sloping ground with a non-liquefiable crust layer.The results of that study showed that neglecting the axial loads from the superstructure weight may significantly underpredict the deflection of the lateral pile groups.Kavand et al.(2013) conducted a shake table test to study the effects of superstructure weight on the behavior of 2×2 pile groups in a rigid box with a medium dense sand.Kavand et al.(2013) found that the superstructure weight affected the maximum bending moment induced in the piles.Ebeido et al.(2019) carried out a series of large-scale shake table tests to investigate the effects of the existence of the non-liquefiable top layer on the response of 2×2 pile groups to lateral spreading and found that the presence of the crust layer increased maximum bending moments of the piles due to relatively high lateral pressure exerted by the crust.
In spite of the valuable results of the aforementioned studies,there are still numerous uncertainties in different aspects of the response pile groups to lateral spreading.Hence further investigations are required.The main purpose of this research is to investigate the effects of the existence of the non-liquefiable crust layer and the weight of the superstructure (lumped mass on the pile cap) on the response of 2 × 2 pile groups subjected to liquefaction-induced lateral spreading.This aim is obtained by comparing the results of two similar shake table models.In each model,two 2×2 pile groups were installed and all characteristics of the models were the same except the existence of the nonliquefiable crust layer.
2.Physical modeling
Sharif University of Technology(SUT)shake table was employed to study the effects of the non-liquefiable crust layer on the response of two 2 × 2 pile groups to lateral spreading.SUT shake table is a 4 m×4 m,3 degrees of freedom facility,capable of taking models of up to 30 tons.A large laminar shear box which is designed and constructed to perform the experiments is made of 23 steel laminates with inner dimensions of 306 cm in length,172 cm in width, and 180 cm in height.
In order to investigate the effects of the non-liquefiable crust layer on the responses of 2 × 2 pile groups, two physical models were constructed.Fig.1 shows the schematic plan and crosssection views of the models.Both physical models were fully instrumented with different types of transducers (e.g.displacement,pore water pressure,and acceleration).Two 2×2 piles made of aluminum pipes (T6061 alloy) with 150 cm length, 5 cm outer diameter, and 0.15 cm thickness were used in each model.
In order to determine the mechanical and geometrical properties of the piles in the physical model, the generalized similitude law proposed by Iai (1989) and Iai et al.(2005) was used.Applicability of the generalized similitude law to the fully nonlinearregime of soil-structure system was proved by Ueda et al.(2019).Ueda et al.conducted centrifuge tests using Iai’s similitude laws.They converted the model results to the prototype scale using Iai’s scaling factors, and then compared the results with the field data.They concluded that Iai’s similitude law works even for liquefaction and non-linear behavior of soils.In the present research, the geometrical scale was selected as λl=8(prototype/model).Table 1 summarizes the scaling factors applied in this study.
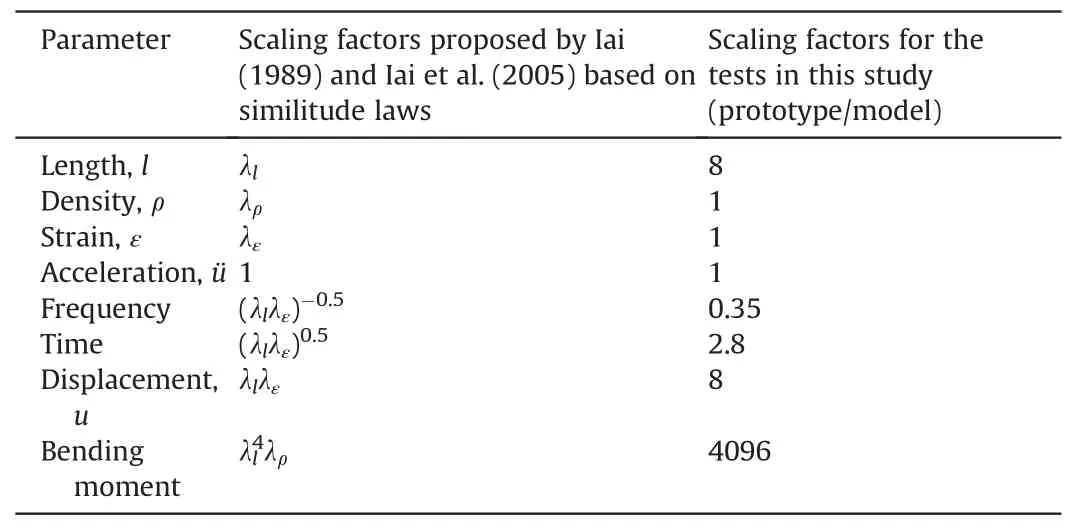
Table 1 Scaling factors for 1g shake table tests.

Table 2 Main properties of the piles in this study.
The main properties of the piles in the prototype and the models are presented in Table 2.It should be mentioned that satisfying all the similarity laws in the model tests conducted under 1g condition is not possible,thus the similarity laws that were used in the main physical parameters of concern should be satisfied and the other relatively trivial ones can be neglected(Hamayoon et al.,2016;Zhu et al., 2021).This issue and its effect on 1g experiments were explained and discussed in Haeri et al.(2023).
In any of the models of the present study,six piles(three piles in each group) named by numbers 1 to 6 (Fig.1) were heavily instrumented with pair strain gauges to obtain profiles of bending moment and lateral pressure on piles due to lateral spreading.Schematic views of the instrumented piles with strain gauges and the photo of the instrumented piles installed in the physical models are exhibited in Fig.2.Note that the piles were fixed at the bottom in translational and rotational directions in order to simulate fixedend piles.The piles were also fixed at the head using a pile cap,however,the amount of their fixities were not exactly known.The pile caps were made of plexiglass to be transparent for observation of the soil movement beneath the caps during and after the shaking.It should be noted that a single pile is also installed downstream of both models and at an adequate distance from the pile groups.The focus of this paper is on the effect of the crust layer and superstructure on the responses of 2×2 pile groups to lateral spreading.Hence this paper does not include the results of the single pile.The distance between two pile groups in the models was set at 60 cm,i.e.12 times the diameter of the piles and almost twice the width of each pile group to minimize the interaction between the pile groups in the models considering the dimensions of the laminar shear box and the required distancing from the walls of the container.
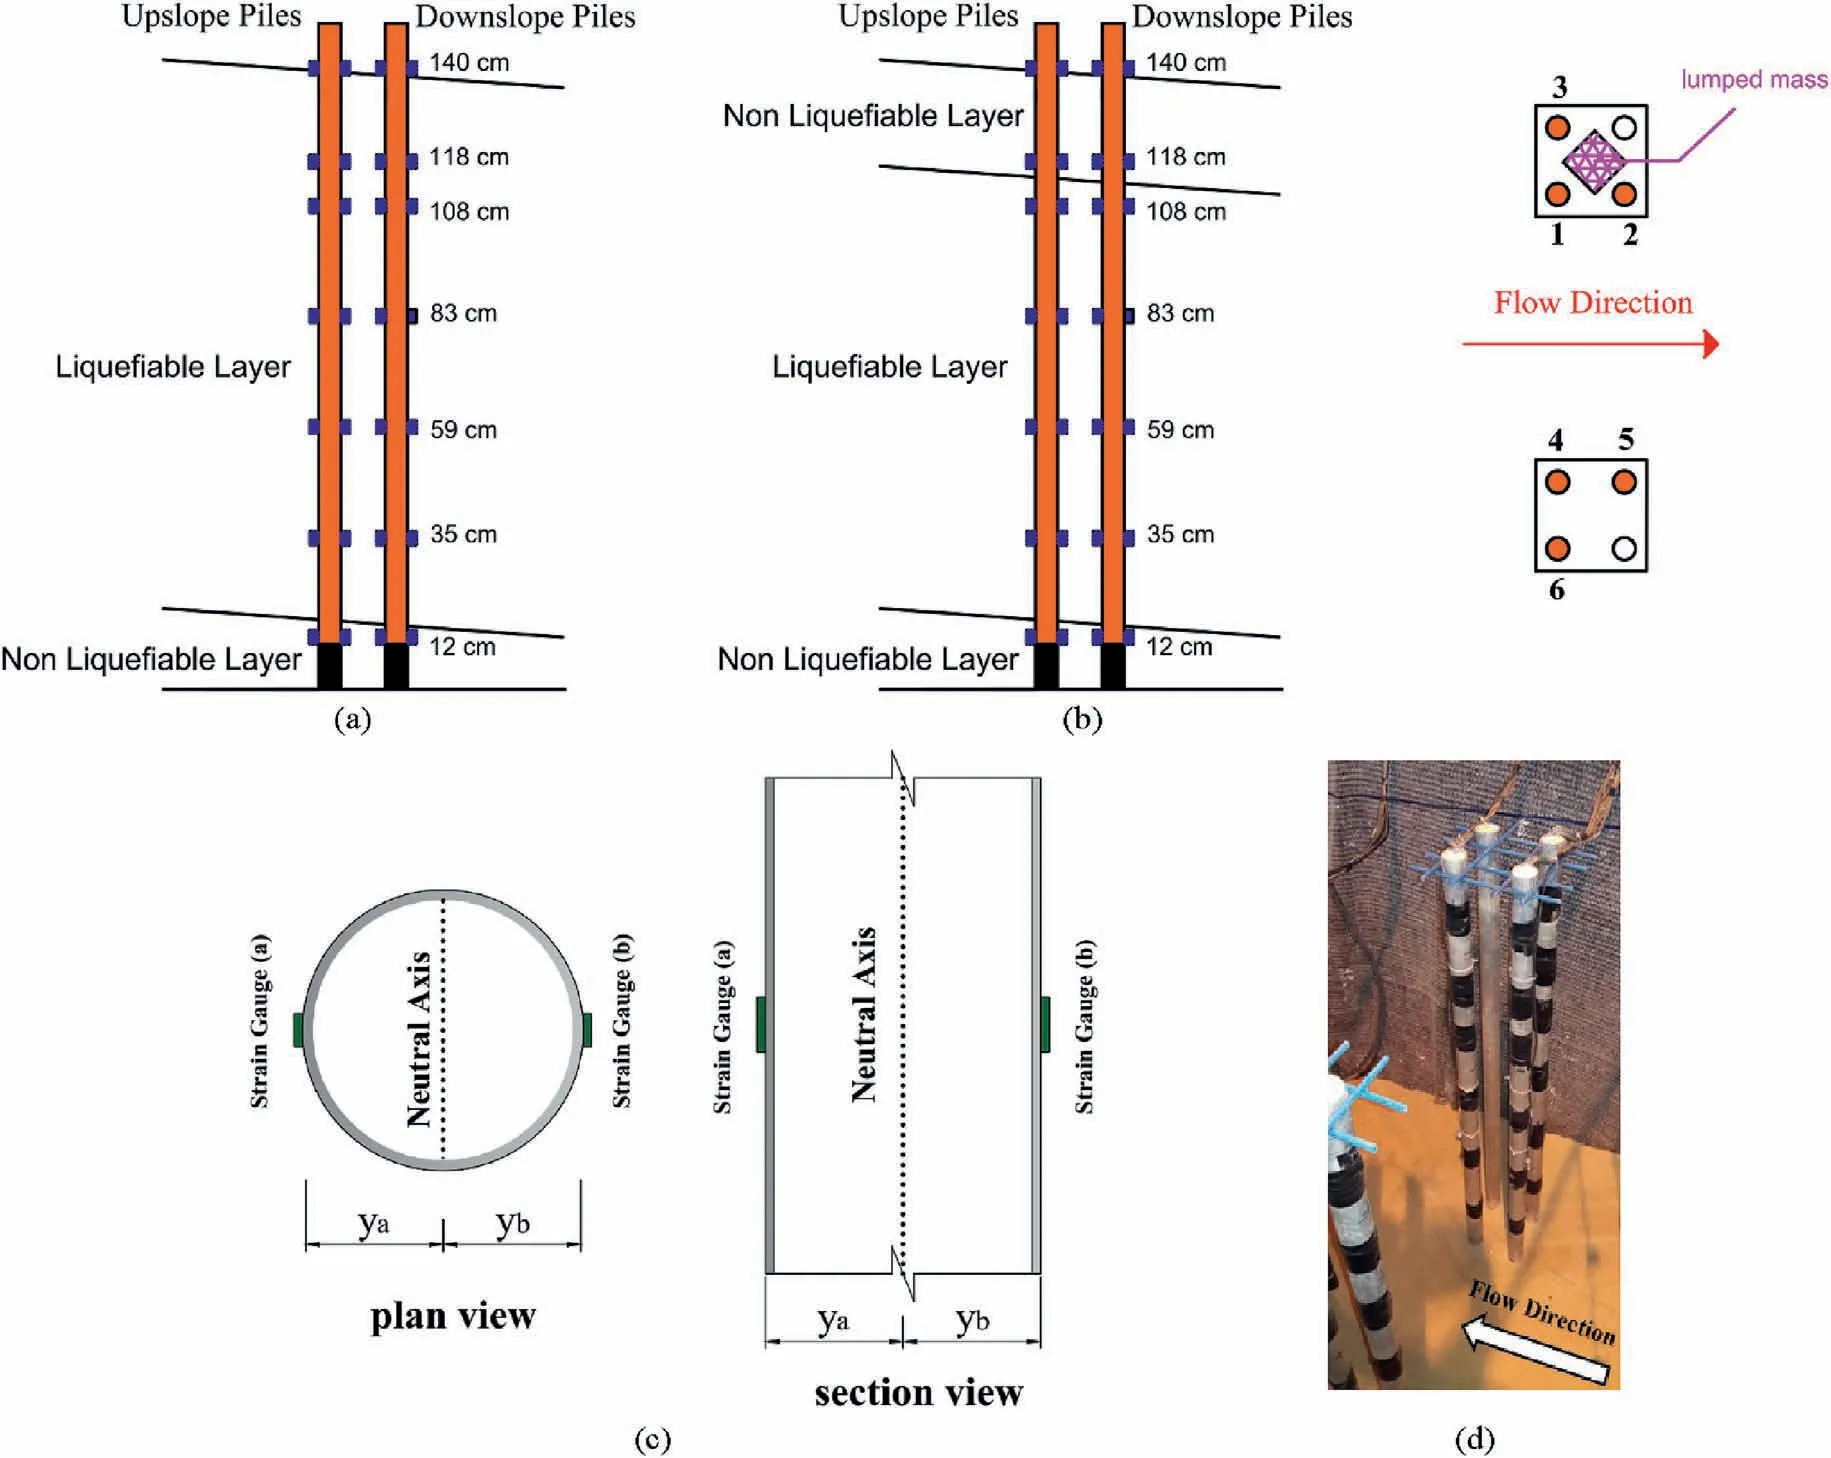
Fig.2.Photos of arrangement of the strain gauges on the piles:(a)Model without the crust layer,(b)Model with the crust layer,(c)Schematic section of a instrumented pile,and(d)Instrumented piles installed in the physical models.
In this paper, the models without and with the crust layer are named the crustless and the crusted models,respectively.According to Fig.1, the crustless model consisted of two soil layers: a thick liquefiable layer with a relative density of 15%,underlain by a dense non-liquefiable sand.As seen in Fig.1, the difference between the layers of the two models is the non-liquefied crust layer.The very dense non-liquefiable layer with a relative density of 80% was constructed using the wet tamping method at the bottom of the models.To construct the liquefiable layer, the lined laminar shear box was filled with water to the level of the ground water table.The liquefiable layer, with a relative density of about 15%, was constructed using the water sedimentation technique by pouring sand through a special bucket from almost zero height into the water to make the liquefiable layer as loose as possible.In this way, a fully saturated liquefiable layer with identical density was obtained in both models.This type of sedimentation was performed, tested and calibrated in the previous works at SUT by Haeri et al.(2012).Due to the same construction method of the liquefiable layer in the models,identical mass density of the soil at the same depth is expected.When the construction of the models was completed, a grid was created over the ground surface, with a gray color sand.The crust layer in the crusted model was constructed by dry deposition of a mixture of 85%sand and 15%clay with a liquid limit of 38%to produce a clayey sand(SC)for casting a dry non-liquefiable layer.In the crusted model,the water table was set at the depth of 25 cm to ensure that liquefactionwould not occur in the crust layer.The stratum was constructed with standard Firuzkuh silica sand No.161 which is a crushed sand with a uniform gradation with a mean grain size of about 0.24 mm.This sand is widely used in geotechnical experimental research in Iran,especially for those related to liquefaction.The main properties of Firuzkuh sand No.161 are presented in Table 3.All layers in the models without and with the crust layer had a ground slope of 4°in the longitudinal direction.A lumped mass of 51 kg was attached to the cap of one of the pile groups to study the effect of inertial loading due to the presence of a superstructure on the response of the pile group to liquefaction-induced lateral spreading.According to the similitude law, this mass can represent the dead load (bridge deck and pier) and live load (a 20 tons truck) of a bridge section.The photos of the models after construction and prior to the test loading are exhibited in Fig.3.As seen in this figure, the lumped mass was welded to a steel plate and was rigidly connected to the pile cap with thick bolts and belts to remain fixed during shakings.

Table 3 Main properties of the Firuzkuh silica sand No.161.
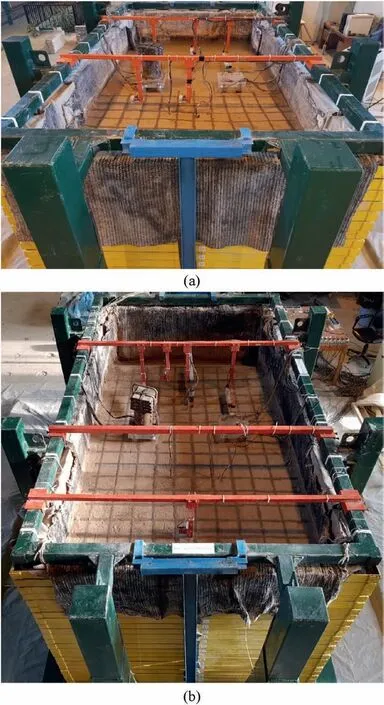
Fig.3.Photos of the physical models after construction: (a) The crustless model, and(b) The crusted model.
3.Results
Identical input shakings parallel to the ground slopes were applied to the crustless and crusted models.In order to measure the input motion, one accelerometer (ACC1) was attached to the rigid base of the laminar shear box in both models.The input shaking includes 30 complete sinusoidal cycles with amplitude of 0.3g and frequency of 3 Hz and two 3 cycles ascending and descending ramps.
The main results of the experiments including measurements of acceleration, displacement, pore water pressure,bending moment and calculation of soil pressure in free field and on piles are presented and discussed.It should be noted that all the acceleration data in this study were band-pass filtered to remove the undesired data with frequencies higher than 25 Hz and lower than 0.1 Hz.
3.1.Soil acceleration at free field
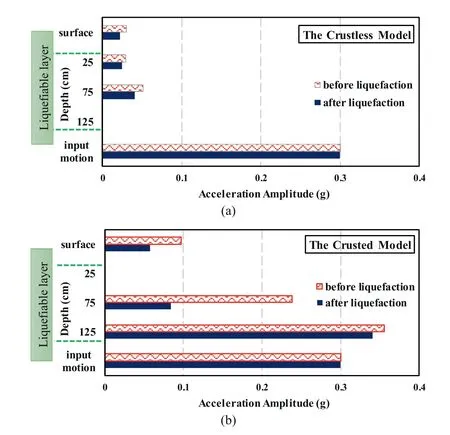
Fig.4.Acceleration amplitude at free field before and after liquefaction: (a) In the crustless model, and (b) In the crusted model.
To detect soil acceleration at free field,five accelerometers were installed at various elevations of the models.Acceleration amplitudes at the free field before and after liquefaction are presented in Fig.4.The results of two accelerometers(at a depth of 125 cm in the crustless model and at a depth of 25 cm in the crusted model) are not presented due to the erroneous data obtained during the experiment probably because of the sensors failure.According to Fig.4, the maximum soil acceleration in various depths of the ground for the crusted model,before and also after the liquefaction,was much more than those for the model without the crust layer.For instance, soil acceleration at the ground surface of the crusted model was about 3.2 and 2.6 times that before and after liquefaction in the other model, respectively.In addition, the acceleration amplitude of the liquefied soil at the depth of 75 cm for the crusted model was approximately twice that for the other model.The maximum acceleration at the surface of the crusted model was higher than the other model because the top layer of the crusted model maintained its shear strength during the test, while the surface layer of the crustless model experienced liquefaction and associated shear strength loss.Therefore, the stress wave was slightly amplified in the crust of the crusted model after an attenuation in the liquefied layer,while it did not occur for the crustless model in which the attenuated acceleration was recorded at the surface.In addition,as the water table in the crusted layer is lower,the effective stress and associated shear modulus and shear strength of the soil layers at each depth of the crusted layer were higher than those of the crustless model.Therefore, the peak accelerations at all depths of the crusted model were higher than those for the crustless one.
In the crusted model, one accelerometer ACC2 was installed at the bottom of the liquefiable layer,near the boundary of liquefiable and underlying non-liquefiable layer (Fig.1).The results illustrate that an acceleration amplification of almost 19% occurred at this elevation of the model as the non-liquefiable bottom layer was very dense.Another important point which can be deduced from Fig.4 is that the attenuation of acceleration at various depths of the liquefiable layer occurred due to the loss strength of the soil.These results illustrate incapability of liquefiable soil in propagation of shear waves.
3.2.Accelerations at the pile caps
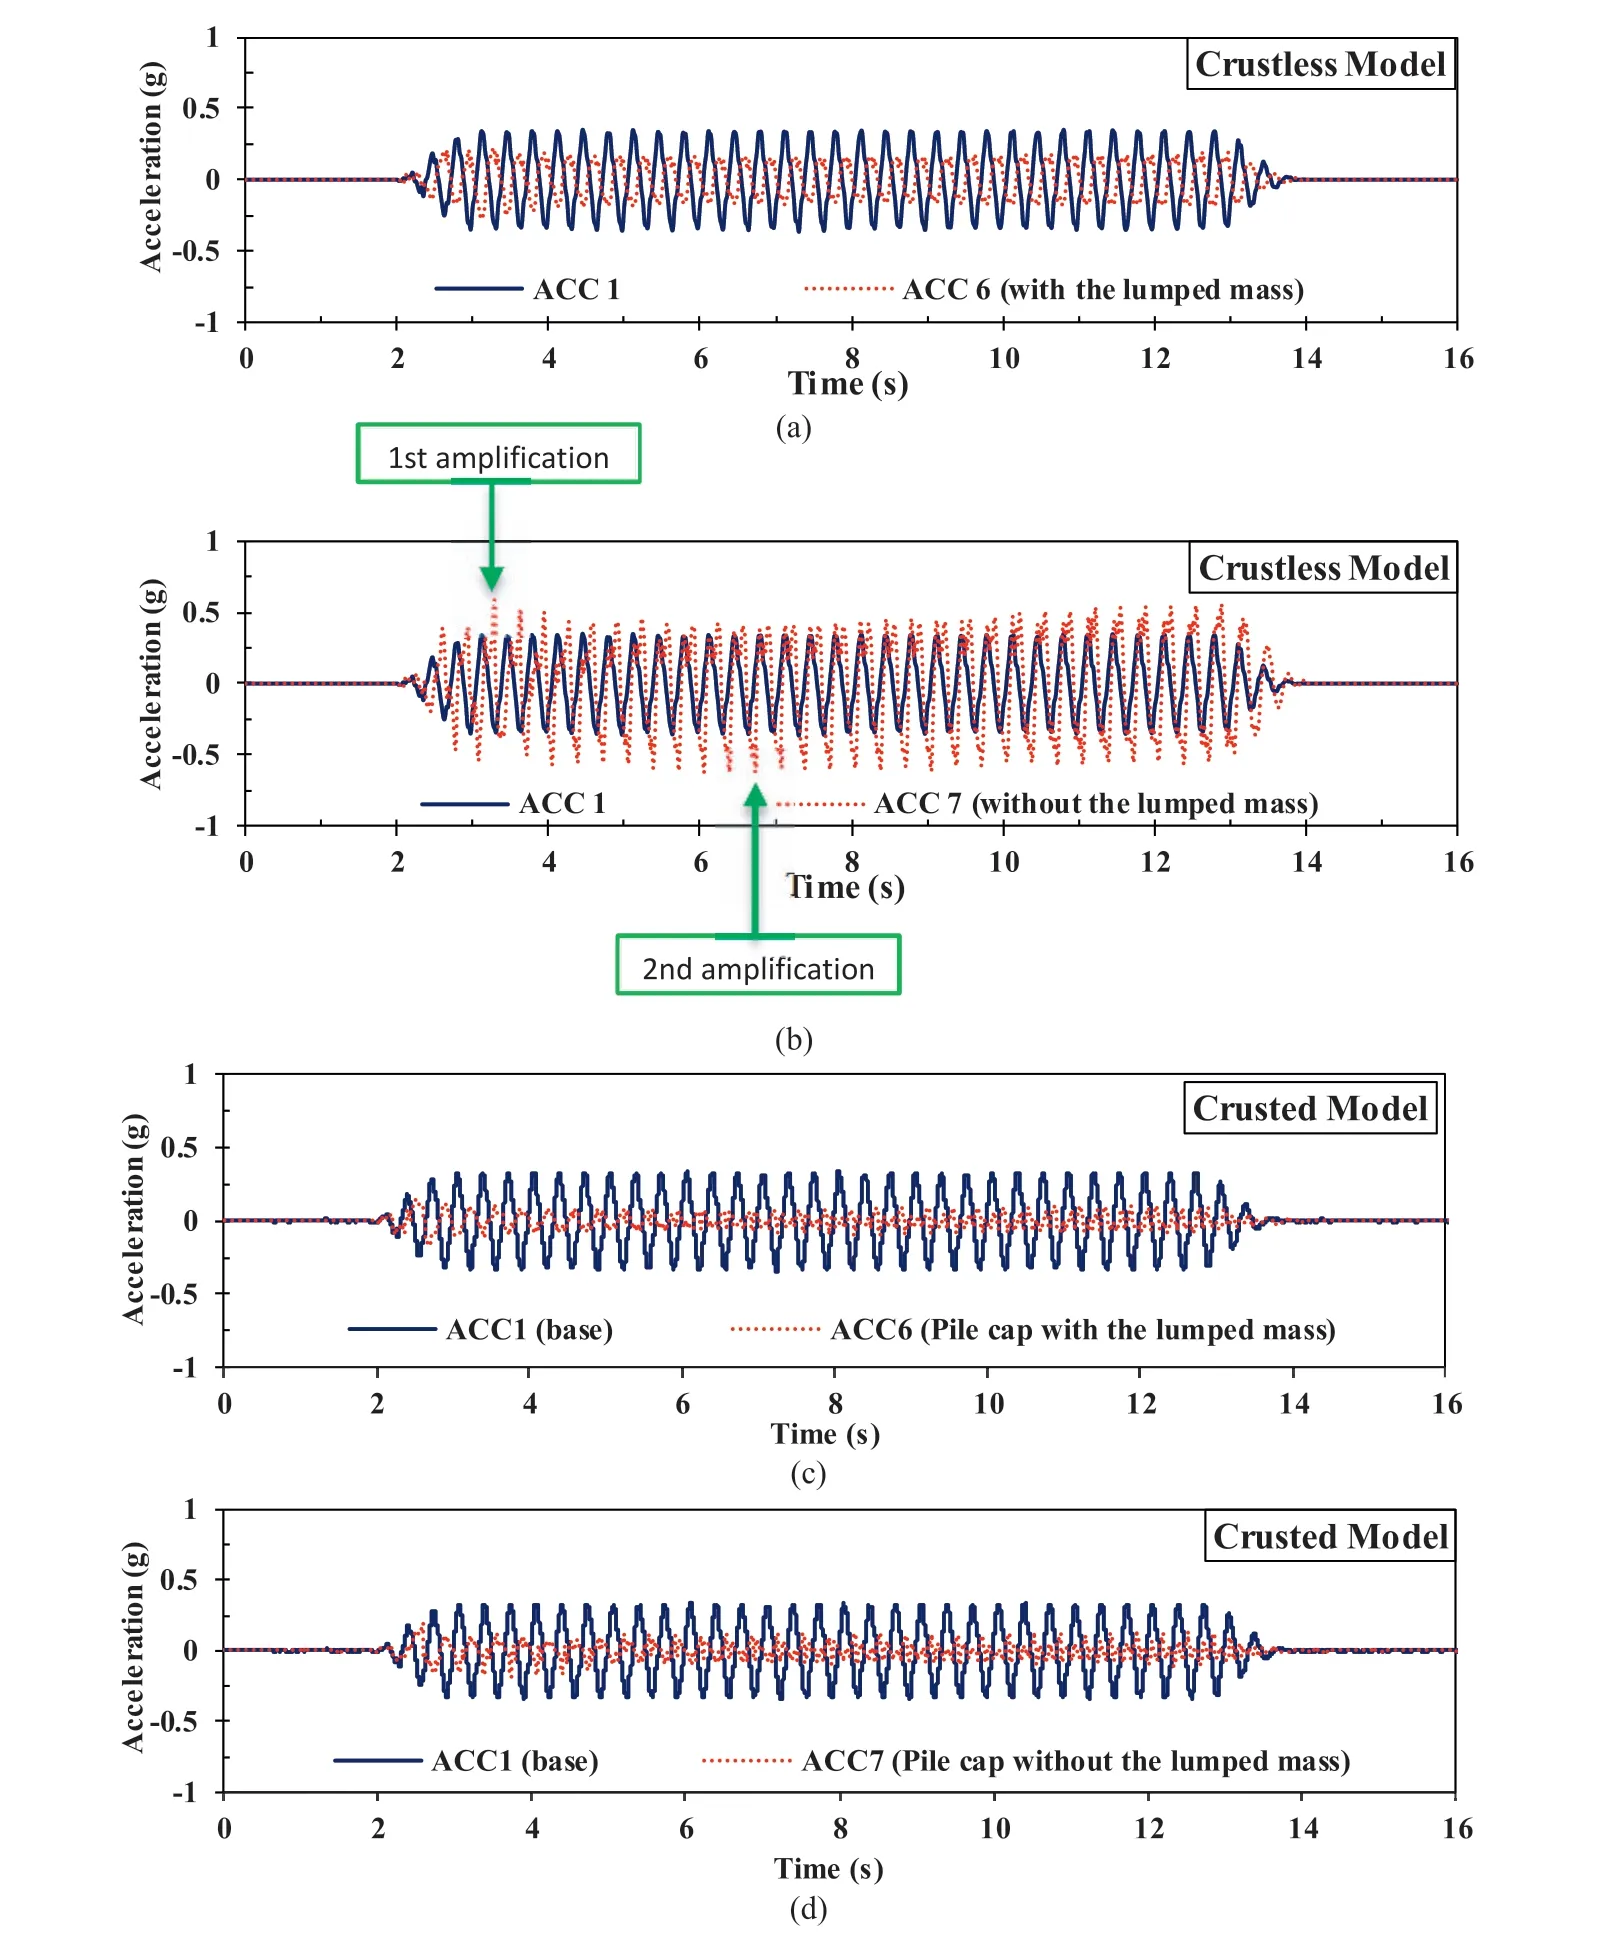
Fig.5.Comparison of time histories of the input motion and the pile cap acceleration: (a) Pile cap with the lumped mass in the crustless model, (b) Pile cap without the lumped mass in the crustless model, (c) Pile cap with the lumped mass in the crusted model, and (d) Pile cap without the lumped mass in the crusted model.
Two accelerometers were used in each model to measure pile caps acceleration.A lumped mass of 51 kg was fixed on one of the pile caps in each model,to study the effect of inertial loading on the presence of a superstructure.According to the implemented similitude law, this mass can be a representative of the dead load(bridge deck and pier)and the live load(a 20 tons truck)of a bridge section.Time histories of the acceleration of the pile caps in the models are shown in Fig.5.Time history of the input motion(ACC1)is displayed as well to compare with the accelerations of the pile caps.As seen in this figure,there is a phase difference between the acceleration in the pile caps and the base.The velocity of the wave propagation through the piles can be determined considering this phase difference.On this basis,the velocity of the wave propagation along the piles in both models was approximately equal to 10.6 m/s.This result illustrates that wave propagation along the piles was independent of the existence of the crust layer.
According to Fig.5, in the crustless model, two different amplifications in the acceleration of the pile cap without the lumped mass can be detected at the 4th and 14th cycles of the loading.The amplitudes of acceleration on the pile cap at these times were 62%and 82%more than the amplitude of the input motion,respectively.The first amplification occurred because of the wave propagation through the piles from the base to the cap when the pile was confined in the soil just before liquefaction triggering, while the liquefaction considerably reduced the confinement of the piles which resulted in higher amplification in the second pick acceleration.
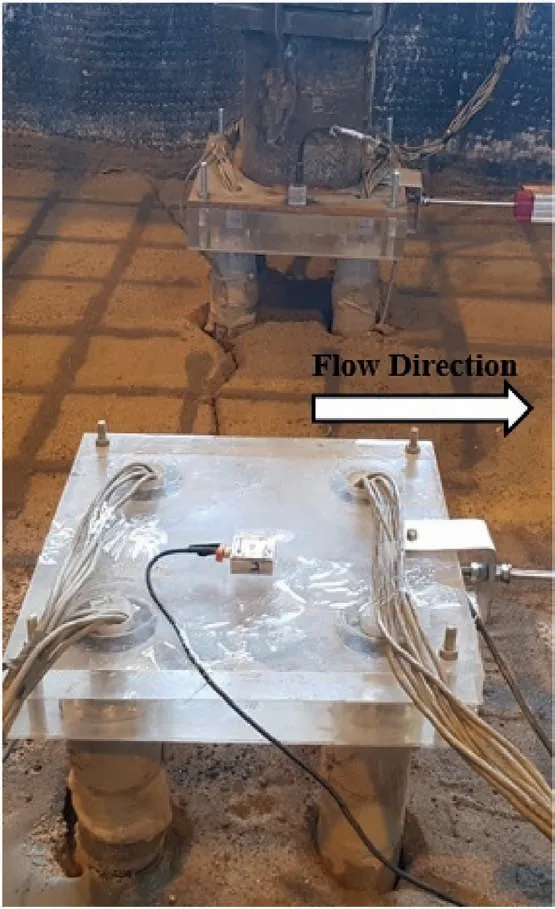
Fig.6.Photo of the gaps between soil and the piles in the crusted model.
According to Fig.5,there are many spikes and multiple peaks in the acceleration time histories of the pile caps in the crusted model,especially after the liquefaction triggering,which can be attributed to the collisions of the crust layer and the piles.In other words,impacts of soil mass on the piles,due to the gaps created between the soil and the piles(Fig.6),resulted in a sort of disturbance in the piles movements and consequently creating some spikes in the pile caps acceleration.Acceleration amplitudes of the pile caps for both models are compared in Fig.7.An important point which can be extracted from Fig.7 is related to the effect of superstructure weight on the response of the pile cap.As seen in this figure,in both models,the maximum acceleration of the pile cap with the lumped mass was less than that in the other pile cap.Existence of the superstructure mass decreased the maximum acceleration of the pile caps in the crusted and crustless models,approximately by 9%and 56%, respectively.This phenomenon can be attributed to the Newton’s second law.In fact, similar kinematic lateral forces from the liquefied soil due to lateral spreading were imposed on both pile groups of the model.Therefore,an increase in the mass of the pile-superstructure system resulted in the reduction of the acceleration amplitude of the pile cap,in the case with the lumped mass.In the crustless model, the maximum acceleration of the pile cap with the lumped mass, after liquefaction, was 38% less than the input motion.Another important point obtained from Fig.7 is related to the effect of the crust layer on the acceleration response of the pile cap.As seen, in the crusted model, acceleration amplitudes of both pile caps with and without the lumped mass were 45% and 40% less than the input motion before liquefaction.A comparison of the results of both models reveals that the interaction of the non-liquefiable crust layer and the piles caused a considerable decrease in the acceleration amplitudes of the pile caps.This finding is in good agreement with the work reported by Sato et al.(2010) who performed a large shake table test to study the response of a 2 × 2 pile group behind a quay wall to lateral spreading.A lumped mass as a superstructure was installed on the pile cap and the ground consisted of a liquefiable layer overlain by a dry non-liquefiable layer.In that research, the maximum acceleration of the pile cap was approximately 60% less than the acceleration amplitude of the input motion.
3.3.Lateral soil displacement in the free field
A linear variable differential transformer (LVDT), named LVDT1 in Fig.1, was placed at a similar position on the ground surface of the models to measure the free field displacement.The process of installation of LVDTs in the free field and adjusting the measured records was presented in Haeri et al.(2023).Time histories of lateral displacement of the ground surface in the free field for both models of the present study are compared in Fig.8.As seen in this figure, at the beginning of the loading, the models experienced similar ground surface displacements.After the 4th cycle of the loading, the difference between the lateral soil displacements increased.It can be postulated that the crust layer slipped over the liquefiable layer due to the flow liquefaction in the liquefiable layer.
The ground displacement consisted of kinematic and cyclic components due to the ground slope and the ground shaking,respectively.In this study, time histories of the kinematic or monotonic soil displacement were obtained by elimination of the cyclic part of the data from the recorded displacement.The procedure of obtaining monotonic and cyclic components of the records was explained in Haeri et al.(2012, 2023).Time histories of the total, cyclic, and monotonic soil displacement for both models are presented in Fig.8.The monotonic displacements of the models approached their maximum, simultaneously, at the 16th cycle of the test loading after which no kinematic displacements occurred.This means that at the subsequent cycles of the shakings, the ground surface merely oscillated without any permanent displacements.In other words, lateral spreading of the ground surfaces terminated at the 16th cycle.However, it should be noticed that the measured monotonic soil pressures on the piles,which are discussed in Section 3.7, indicate that the lateral spreading in the liquefiable layer continued until the end of the shaking,due to the slope of the base layer.

Fig.7.Bar chart of the amplitudes of the input motion and the pile caps.
A noticeable point resulted from Fig.8 was that the existence of the non-liquefiable crust layer increased the maximum lateral displacements of the ground surface by 55% with respect to the crustless case.In addition, the final (residual) surface displacement in the crusted model was approximately 70% greater than that for the crustless model.It is very possible that the excess pore water pressure generated due to liquefaction had been trapped below the crust layer, producing a thin lens of water at the boundary between the non-liquefiable crust and the liquefiable layer, which could be responsible for the extensive lateral movement of the crust.However, this result is not in agreement with that of Motamed et al.(2010) who carried out shake table experiments using a rigid box to study the effects of a number of parameters on the effect of lateral spreading on a 3×3 pile group including the existence of a crust layer.The result of their study indicated that the existence of the top non-liquefiable layer significantly reduced the soil lateral movement at the surface.In that experiments, all layers including the crust layer were completely saturated.The reason for the difference between the obtained results from this study and those by others is not exactly known because of several dissimilarities and unknown parameters of the experiments.Further experiments with the same properties may be required to clarify this issue.It should be noted that the results of image processing(in Section 3.10),well confirm the LVDT results of the present study.
3.4.Displacements of the pile caps
Time histories of displacements of the pile caps for both models are exhibited in Fig.9.As seen in this figure, the maximum displacement of the pile caps in both experiments occurred prior to the liquefaction triggering, noting that it occurred only in a very short period of time.Then, the pile groups slightly bounced back toward upstream due to the stiffness and elastic behavior of the piles especially with respect to the liquefied soil around them.The final(residual)displacements in the pile caps were negligible at the end of the loading.The observations in this respect are in good agreement with the results of some researchers (e.g.Motamed et al., 2010; Haeri et al., 2012; Su et al., 2016).According to Fig.9,before liquefaction triggering, the maximum displacements of the pile caps for the crusted model were greater than those for the crustless model, because the crust layer imposed a higher lateral forces on the piles.However, after liquefaction triggering, the maximum displacements of the pile caps in the crusted model were less than those in the crustless model.As seen in Fig.9, in the crusted model, negative pile caps displacements, which indicates the pile cap movement toward upstream, were limited.It can be deduced that the non-liquefiable crust layer imposed a high resistance against the pile movement toward upstream.The maximum displacements of the pile caps are presented in Table 4.A remarkable point obtained from this table is related to the effects of superstructure weight on the responses of the pile caps.The superstructure mass increased the maximum displacements of the pile caps in the crustless and crusted models by 35% and 5%,respectively.In fact, the lumped mass increased the maximum displacements of the pile caps in both models due to the second order P-delta effect,where P denotes the vertical load on a column(here, the pile), and delta is the horizontal displacement or eccentricity of the load atop the column.
3.5.Pore water pressure
PWP transducers were installed at an adequate distance from piles and container boundaries to measure excess pore water pressure at the free field.PWP1 and PWP2 were placed at approximate depths of 40 cm and 70 cm, respectively, in both models.Time histories of the ru(the ratio of excess pore water pressure to initial effective stress)for the free field are exhibited in Fig.10.As seen in this figure,liquefaction occurred at the 3rd cycle of the loading, indicating that the liquefiable layer was very loose.According to Fig.10, in the crustless model, excess pore water pressure generated with a steeper slope at the first cycles of the loading and dissipated faster after the completion of the shaking,when compared with those of the crusted case.This observation means that the presence of a non-liquefiable crust layer can postpone the full dissipation of excess pore pressure which in turn may cause greater lateral soil movement and pressure on piles, and consequently, a higher level of damage to the structures.
As seen in Fig.1,several PWP transducers were installed close to the pile groups in the models to evaluate liquefaction around the piles.In this paper, the recorded excess pore water pressures by PWP5 and PWP6 which were located upslope and downslope of the pile group without the lumped mass are presented and discussed.Time histories of rufor PWP5 and PWP6 are exhibited in Fig.10.Different trends of excess pore water pressure generation for the crustless and crusted models can be well seen in this figure.Noticeable fluctuations in pore water pressure of the crusted model can be attributed to the larger gaps between the soil and the piles in the crusted model, which occurred due to the lateral spreading associated with the ground shaking.The gaps which will be exhibited in Section 3.10 generated a drainage path during the shaking and then affected the pore pressure variations.It is also deduced from Fig.10 that similar to that of the free field, faster generation and dissipation of excess pore water pressure occurred for the crustless model compared to those for the crusted model.This can be attributed to the effects of low hydraulic conductivity of the unsaturated non-liquefiable crust layer.
3.6.Total bending moments in the piles
The piles were heavily instrumented with pair strain gauges to obtain profiles of the total bending moments in the piles (Fig.2).Total bending moment at different sections of the piles was determined by measuring strains using following equation,extracted from Euler-Bernoulli beam theory.
where M is the total bending moment; EI is the flexural rigidity of the pile;k is the curvature factor;ais the strain at point a;bis the strain at point b; and yaand ybare the distances of points a and b from neutral axis,respectively(Fig.2c).The total bending moment comprises of kinematic and inertial components of bending moment.Profiles of the total bending moments along the piles at various times for the crustless and crusted models are exhibited in Fig.11.This figure demonstrates that the maximum bending moments for all of the piles in both models generated at the lowest section which was the boundary between the liquefiable and underlying non-liquefiable layers.Small bending moments at pile heads illustrate minor fixity of the piles at the caps.According to Fig.11, the piles experienced the maximum bending moments at the 2nd cycle of the loading which was slightly prior to liquefaction triggering.By liquefaction triggering at the 3rd cycle, the piles gradually bounced back to their initial position.Then bending moments in the piles were decreasing in the following cycles of the loading.Minor amounts of bending moment remained in the piles at the end of the loading.
Bar graph of the maximum bending moments experienced by the piles is displayed in Fig.12.Noticeable differences in the amounts of the maximum bending moments in the corresponding piles for crustless and crusted models can be observed.Existence of the crust layer resulted in the increase in the maximum bending moments generated in the piles from 41% to 169%, with respect to those for the crustless model.In fact,the non-liquefiable crust layer maintains its shear strength during the test loading and exerts highlateral pressure on the piles.Another point which can be deduced from Fig.12 is related to the importance of the position of the piles.The results illustrate that in both experiments,the piles in upslope rows of the groups experienced higher bending moments than the piles in downslope rows.For example, the maximum bending moments in the Pile 1 of crustless and crusted models were 14%and 32%higher than those for the Pile 2 of the models, respectively.In the same way, for the crustless model, the maximum bending moment in the Pile 4 was 45%greater than that in the Pile 5.In the crusted model, the maximum bending moment of the Pile 4 was also greater than that of the Pile 5, albeit slightly.Hence, the upstream piles behaved as obstacles,thus the downstream piles were relatively protected against lateral spreading.This issue can be attributed to the “shadow effects” which has been observed in some researches (e.g.He et al., 2008; Haeri et al., 2019, 2021).He et al.(2008) conducted a shake table test to investigate the effects of lateral spreading on a 2×1 pile group without a pile cap in a ground with one soil layer.In that research, the ratio of the maximum bending moment of the upslope pile to that of the downslope one was about 2.64.A case study by Haeri et al.(2021)was carried out to investigate the response of a 3×5 pile group to lateral spreading.They observed that the maximum bending moment of the piles in the upslope row was approximately 30%greater than those for the downslope piles.Likewise,the maximum bending moment for the upslope pile in the Haeri et al.(2019)research was slightly greater than that for the downslope pile.However, contradictory results were also reported by some researchers.For instance, Ebeido et al.(2019) reported that the downslope piles in a 2 × 2 pile group experienced approximately 20% higher bending moment than the upslope piles.It seems that many factors are involved in the behavior of the piles and hence,further experiments are required to understand the complex interaction of liquefiable soil-pile system.

Table 4 Maximum displacement of the pile caps.
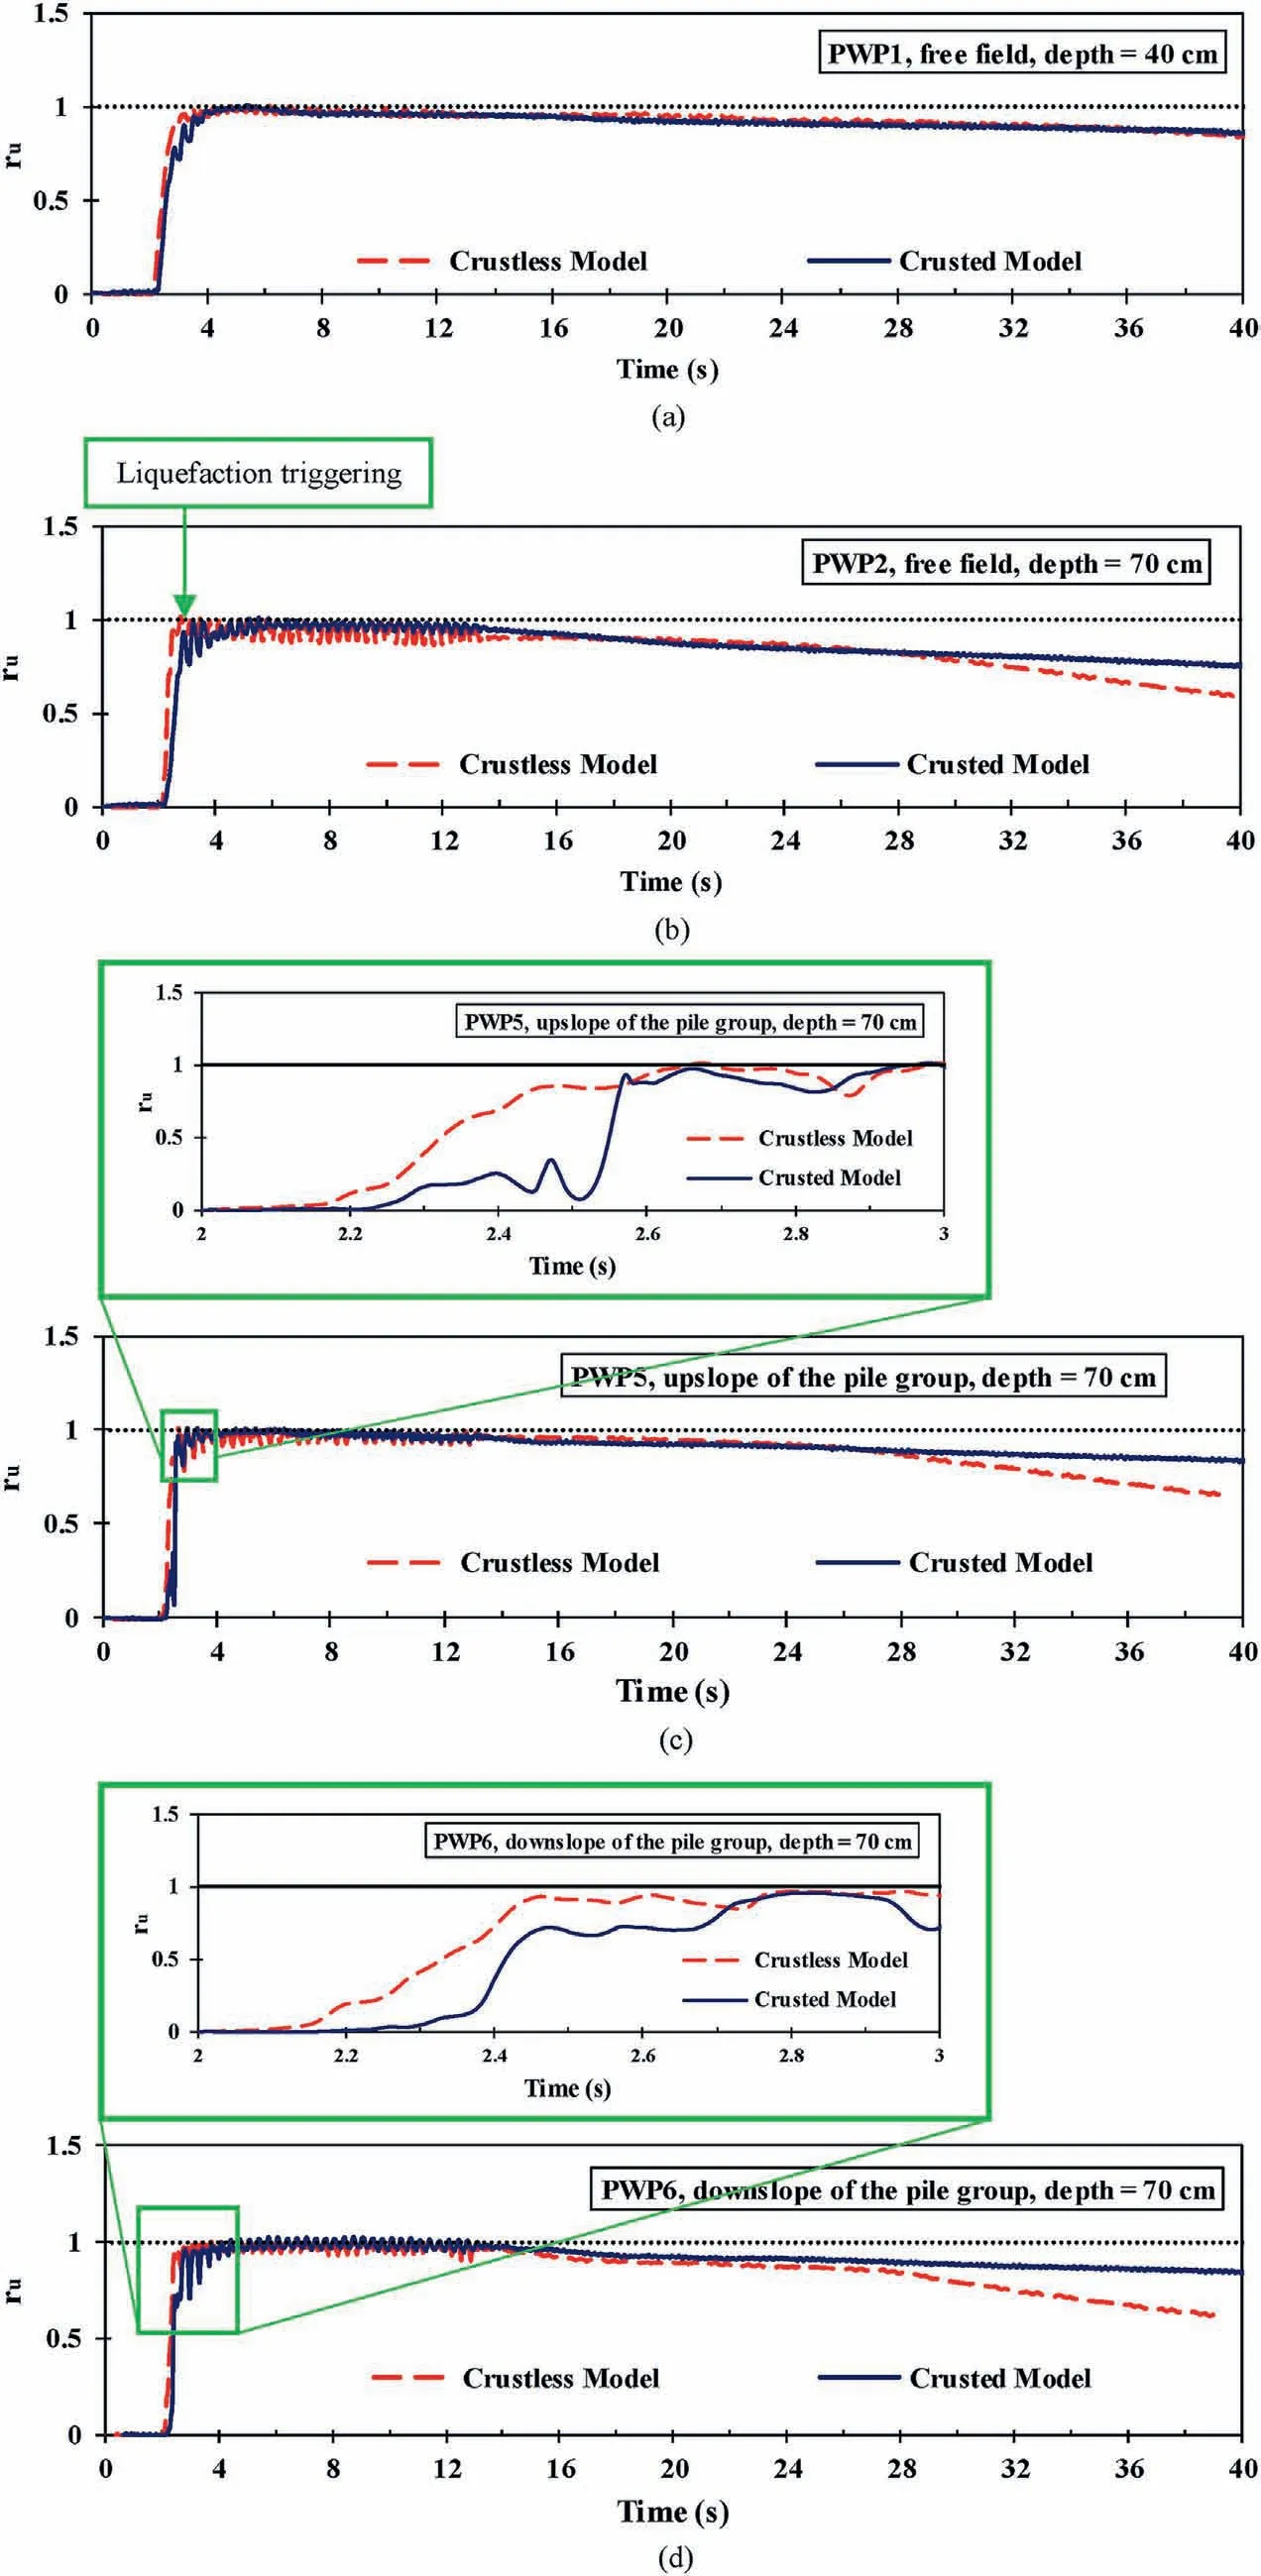
Fig.10.Time histories of ru value:(a)At depth 40 cm of free field,and(b)At depth 70 cm of free field,(c)Upslope of the pile group without the lumped mass,and(d)Downslope of the pile group without the lumped.
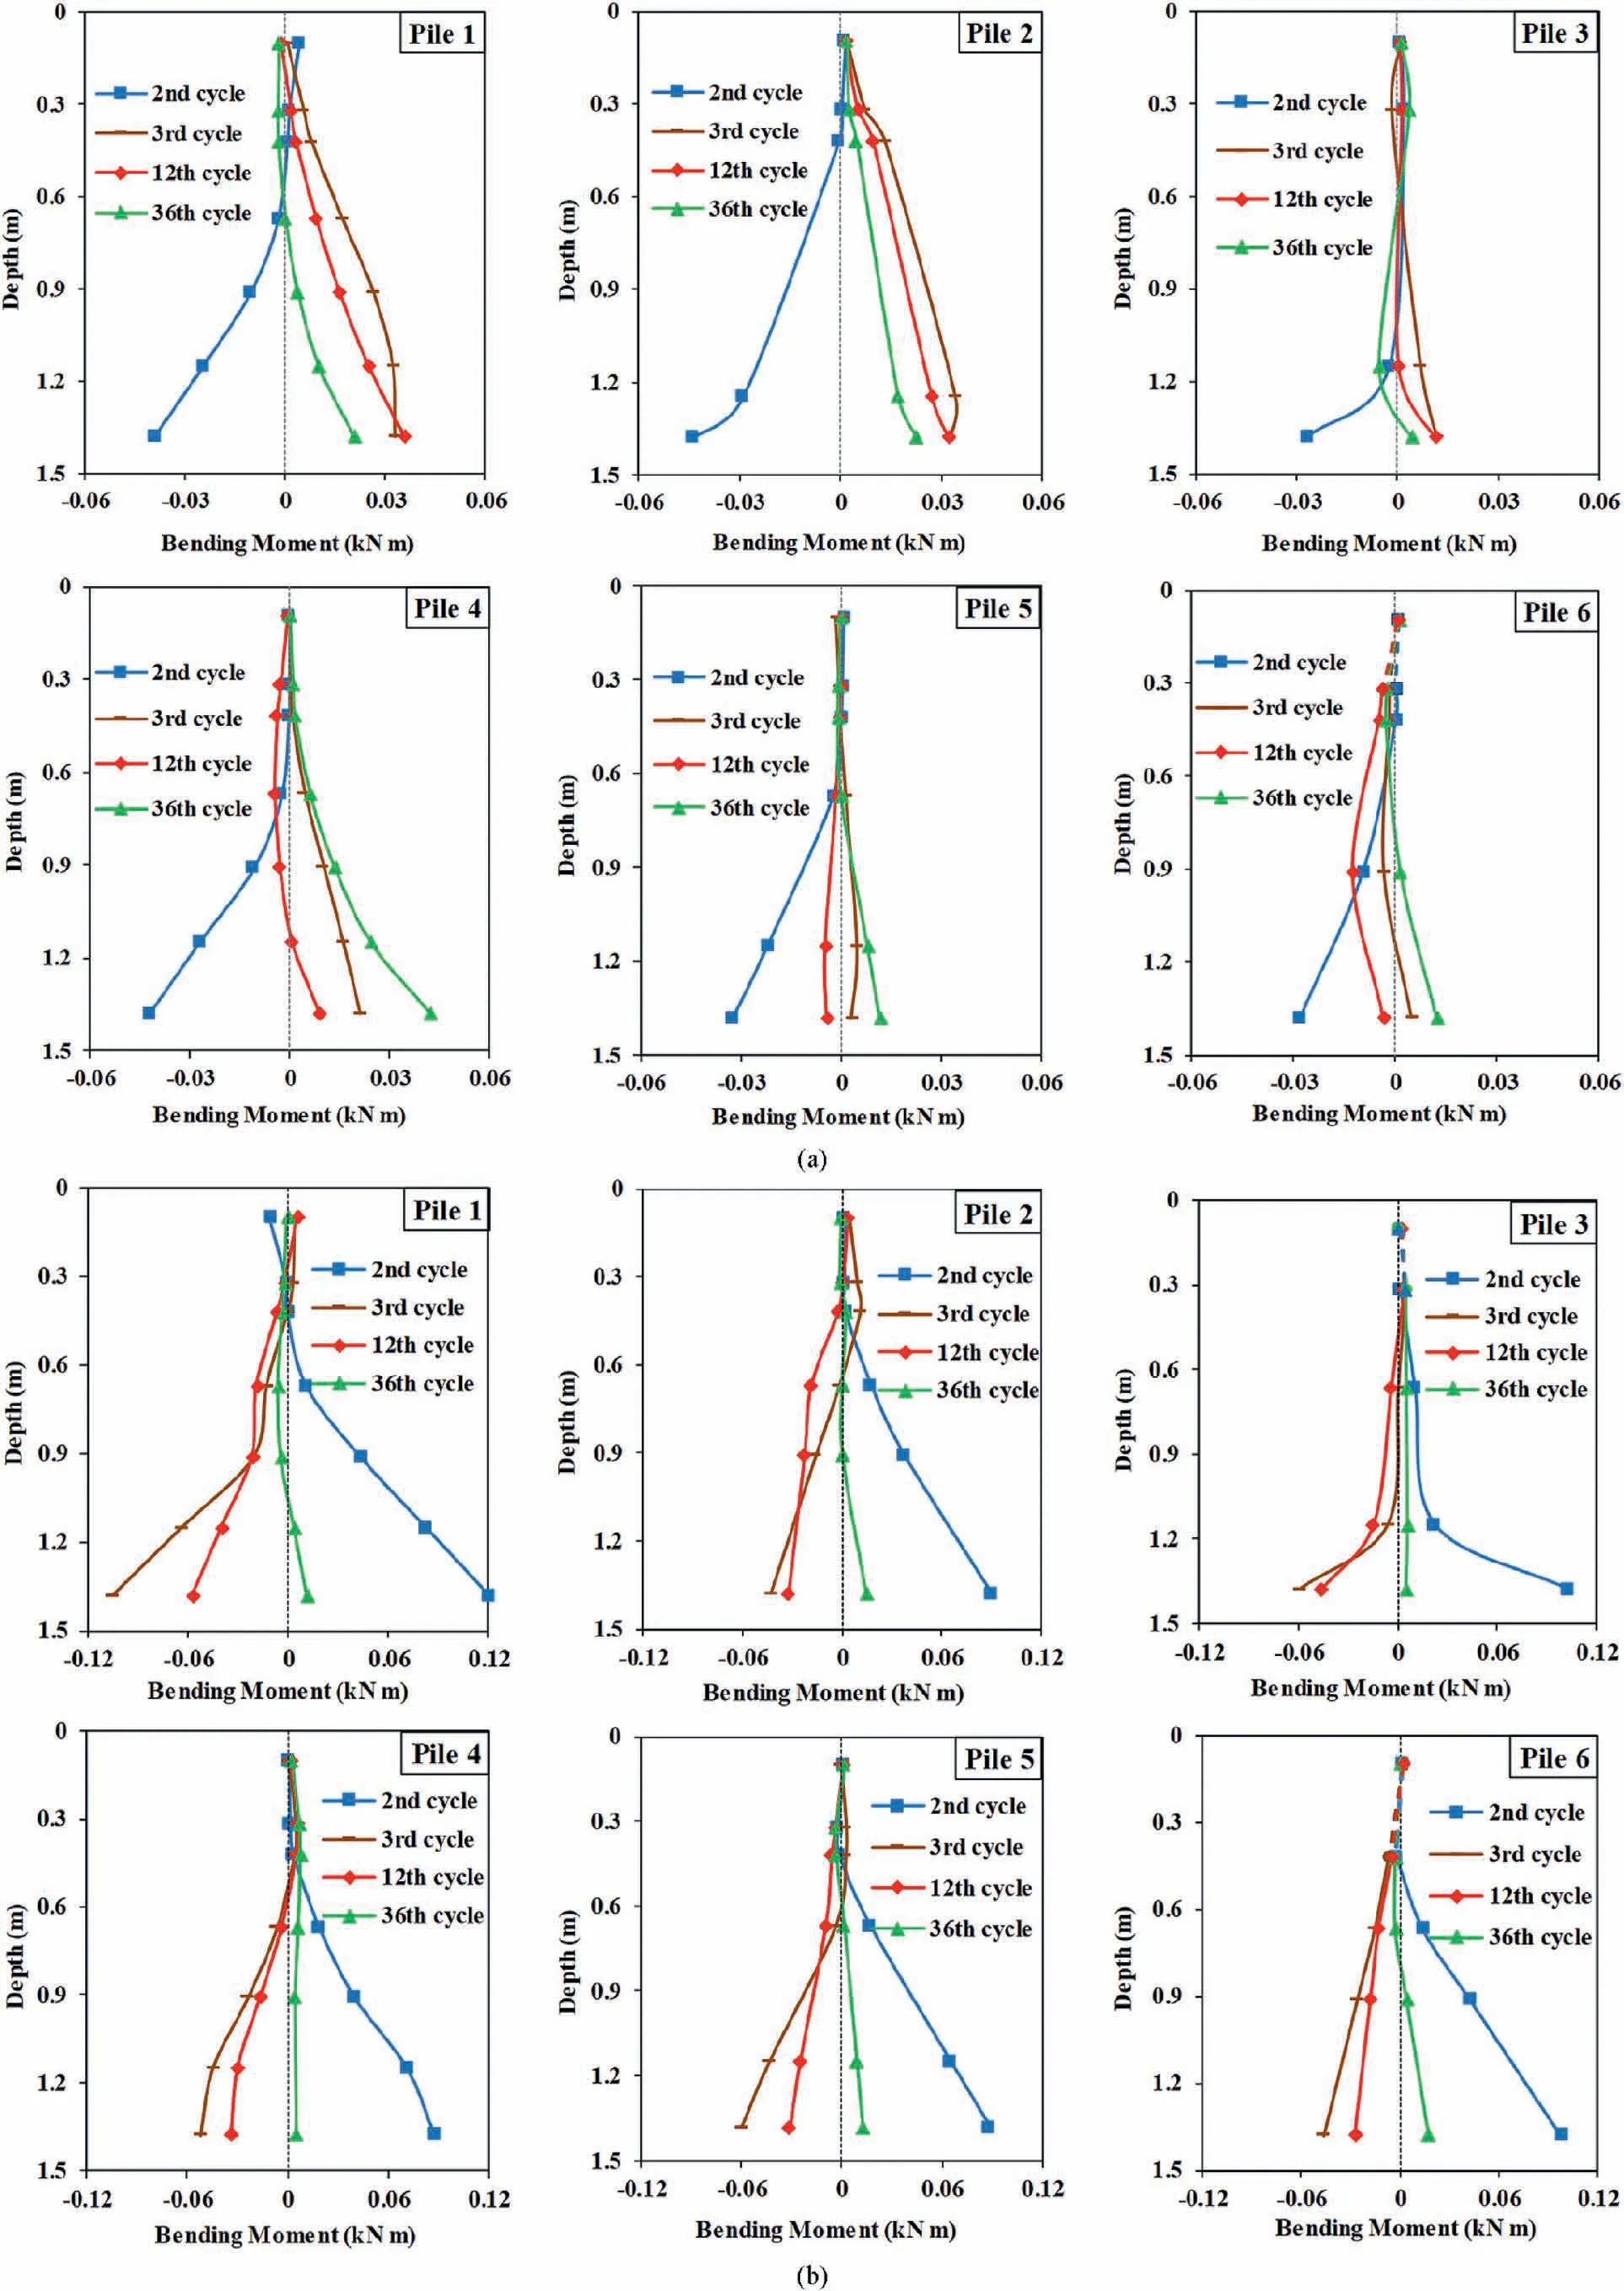
Fig.11.Profiles of total bending moments in the piles at various times: (a) In the crustless model, and (b) In the crusted model.

Fig.12.Bar graph of maximum total bending moments of the piles.
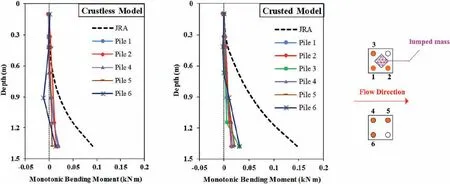
Fig.13.Profiles of maximum monotonic bending moments in these experiments and JRA (2002) code.
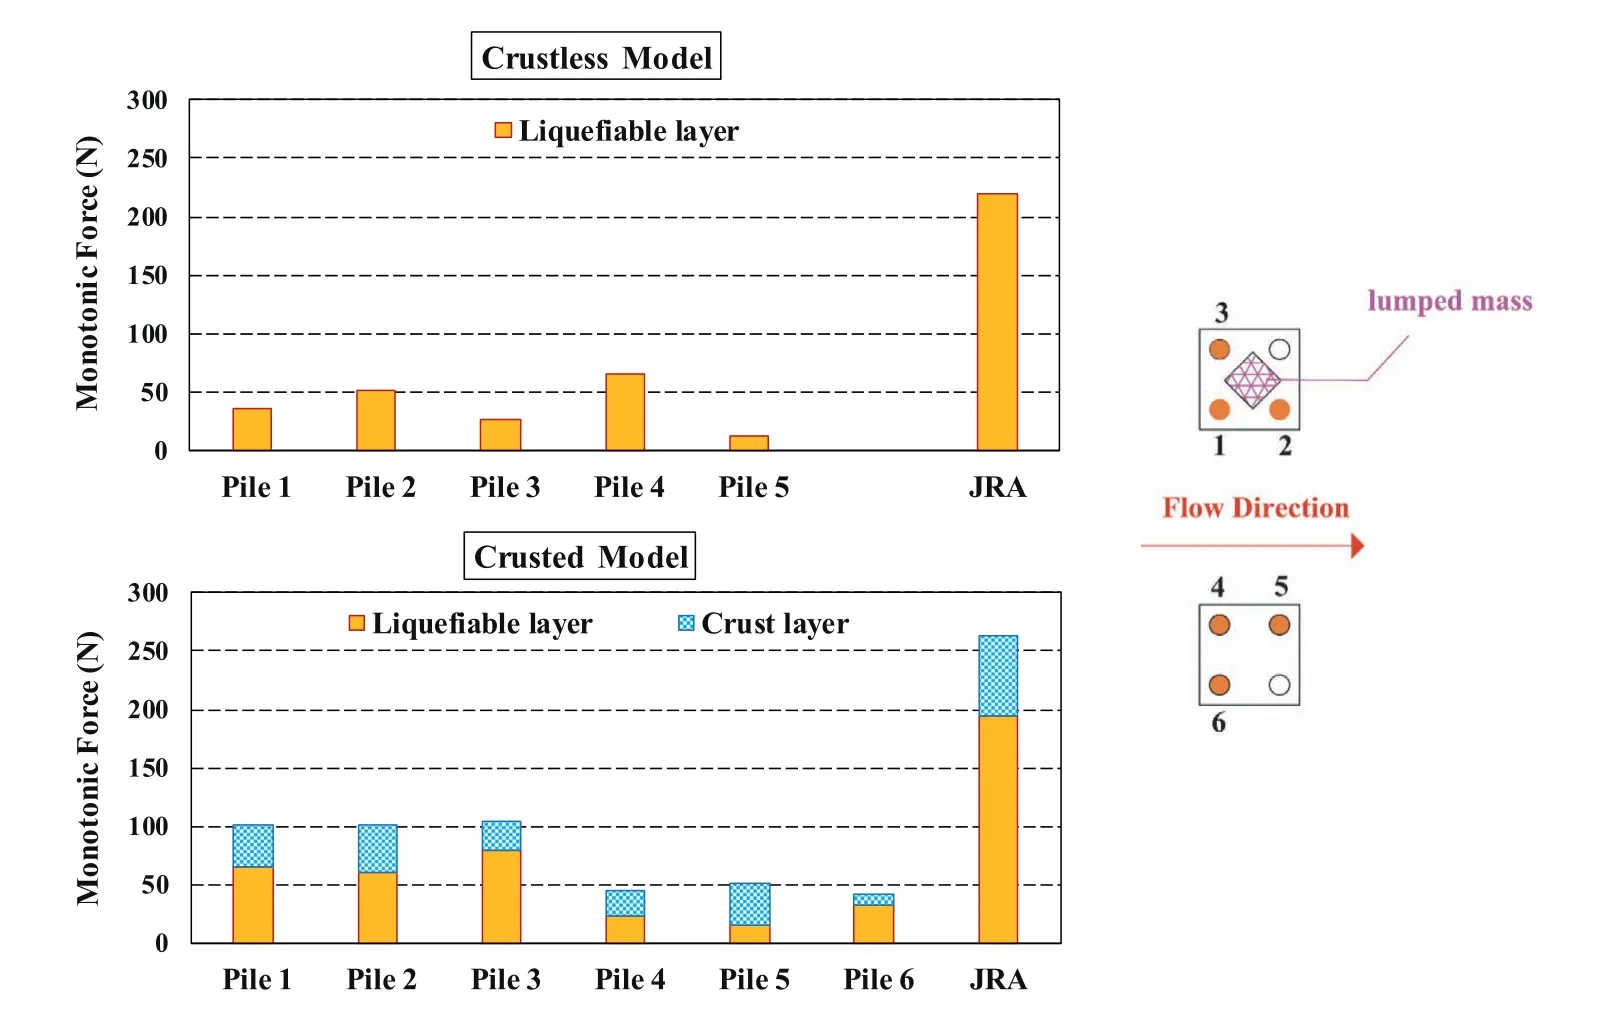
Fig.15.Bar graphs of maximum monotonic lateral forces on the piles.
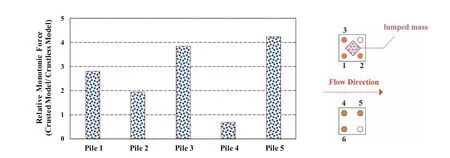
Fig.16.Bar graphs of relative maximum monotonic lateral forces (crusted model/crustless model).
According to Fig.12,the maximum bending moments of the Pile 1 were 64%and 16%greater than those of Pile 3 in the crustless and crusted models, respectively.Similarly, in the crustless model, the maximum bending moment of Pile 4 was 17% greater than that of Pile 6.It can be attributed to the observations that Piles 1 and 4 were subjected to more soil movement due to lateral spreading than Piles 3 and 6.This issue can be attributed to the“neighboring effect”which has been observed similarly by Haeri et al.(2012)who conducted a shake table test to investigate the effects of lateral spreading on a group of piles without caps in a crustless stratum.They observed that the adjacent piles(in a row perpendicular to the flow direction)experienced different amounts of bending moment.It should be noticed that in the present research, the maximum bending moment of Pile 4 was unexpectedly 6% less than that of Pile 6 in the crusted model.For a better understanding and interpretation of this result,further experiments might be required.
The effects of superstructure weight on the response of the piles can also be deduced from Fig.12.Comparing the amounts of the maximum bending moment of the corresponding piles in the groups with and without the lumped mass for each model,it can be concluded that the superstructure weight notably affects the piles response to lateral spreading.According to Fig.12, the maximum bending moments for the Piles 1 and 2 in both crusted and crustless models were greater than those for the Piles 4 and 5, respectively.Existence of the superstructure mass increased the maximum total bending moment generated in the piles up to 26% and 32% in the crustless and crusted models, respectively.
3.7.Monotonic bending moments of the piles
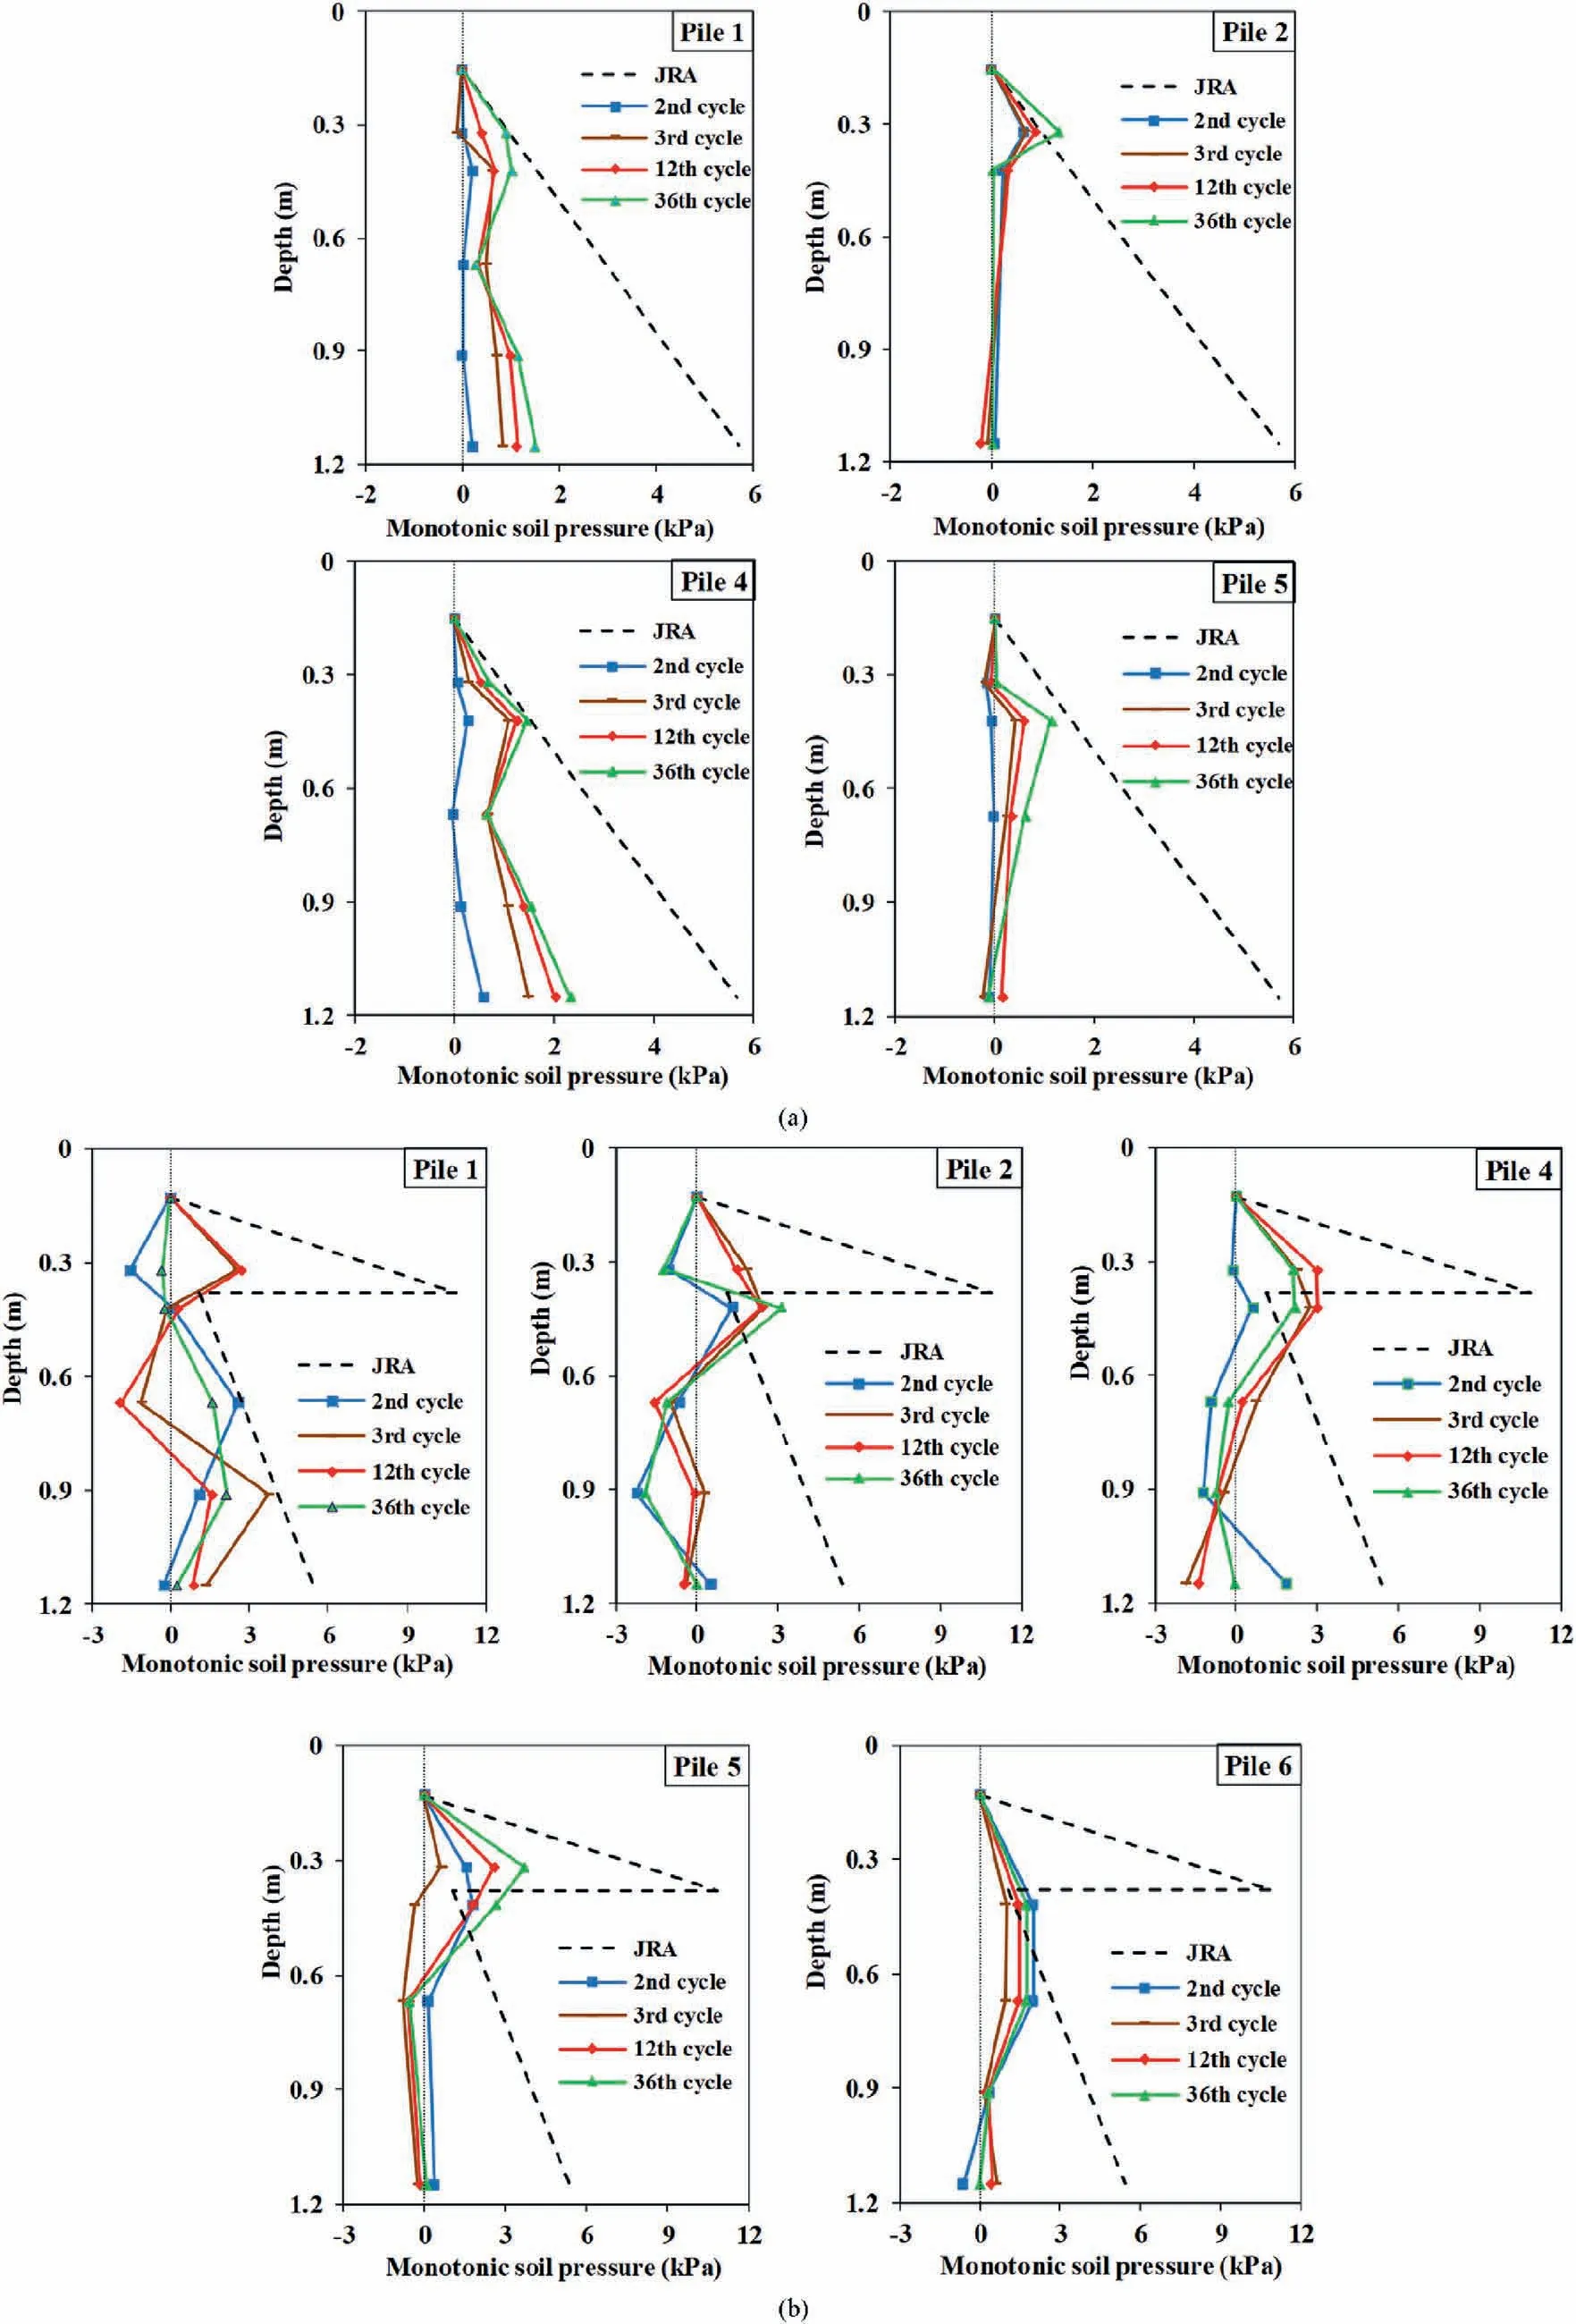
Fig.17.Profiles of monotonic soil pressure on the piles: (a) In the crustless model, and (b) In the crusted model.

Fig.18.Top view photos of the models: (a) Before shaking in the crustless model, (b)After shaking in the crustless model, (c) Before shaking in the crusted model, (d)Tension cracks during shaking in the crusted model,and(e)Sand boiling after shaking in the crusted model.
Back-calculated bending moments consisted of cyclic and monotonic components due to the inertial and kinematic interactions, respectively.Inertial soil pressures were exerted by ground oscillations while kinematic pressures were induced by lateral soil flow.In fact,in the real world,lateral spreading is usually a post-liquefaction and post-earthquake event which includes only the monotonic ground displacements.However, this fact does not occur in the modeling tests and both components occur together.Therefore, the monotonic component of the bending moments of the piles should be extracted from the measured total bending moments which can be related to the kinematic effects of the lateral spreading.In order to obtain the monotonic component of the bending moment,the cyclic component of the bending moment should be subtracted from the total bending moments.Profiles of the maximum monotonic bending moments of the piles for both models are shown in Fig.13.The profile for Pile 3 in the crustless model is not presented because of some unreliable and unknown errors in the result.The profiles of the maximum monotonic bending moments based on the Japan Road Association(JRA)code are also obtained and shown in Fig.13.JRA(2002)suggested one of the most practical methods for pile design against lateral spreading.In this force-based method,pressure from the non-liquefiable crust layer is assumed to be the passive pressure of the crust layer.Also,it is proposed that 30% of the total vertical stress is imposed on the piles in the liquefiable soil layer.It should be noticed that JRA(2002) has no criterion to consider the effects of position of the piles in a group.In other words, according to JRA (2002), it is assumed that the pressures and kinematic forces on different piles of a pile group are identical due to lateral spreading.According to Fig.13, contrary to JRA (2002), the piles experienced different amounts of monotonic bending moments.Hence the position of the piles in the group is an important parameter to estimate the kinematic bending moments due to lateral spreading.The bar graph of the maximum values of the monotonic bending moments for the piles in both models are presented in Fig.14.According to Fig.14,the piles in the upslope row of the groups experienced higher monotonic bending moments.This issue illustrates the shadow effects in the pile groups which were mentioned earlier.The maximum monotonic bending moments for most piles of the crusted model are higher than those in the model without the crust layer.Another remarkable point is that the maximum monotonic bending moments estimated according to JRA (2002) are highly overestimated.The estimated values by JRA (2002) for the models are approximately 2.2 and 3.5 times greater than the experimental values.
3.8.Monotonic lateral forces on the piles
The lateral forces on the piles of this study due to lateral spreading were calculated by differentiation of the bending moment along the piles using weighted residual method (WRM)proposed by Brandenberg et al.(2010).Haeri et al.(2023) have explained the aforementioned method to obtain monotonic lateral forces on 3 × 3 pile groups due to lateral spreading.Bar graphs of the maximum monotonic forces on the 2×2 piles in the crustless and crusted models of the present study are shown in Fig.15.The maximum monotonic forces estimated by JRA (2002) are demonstrated in this figure as well.The maximum monotonic force for Pile 6 in the crustless model was not presented because of some unreliable and unknown errors in the result.As seen in Fig.15, there are significant differences between the maximum forces predicted by JRA (2002) and those determined from the experiments.Predicted forces for the piles of each group of this research using JRA(2002) do not resemble the results of the experiments.According to Fig.15,soil pressure may change direction along the piles,while JRA (2002) considers the lateral soil pressures due to lateral spreading along the piles to be in the downstream direction.Hence the maximum monotonic forces on the piles predicted by JRA(2002) seem to be overestimated, though on the safe side.In the models with and without the crust layer,the maximum monotonic forces on the piles predicted by JRA (2002) are much higher than those obtained from the experiment.In the crusted model, the maximum monotonic forces on the piles predicted by JRA (2002)were between 2.6 and 6.3 times those obtained from the experiment.In the crustless model, the ratio of the maximum monotonic forces on Piles 1-4 predicted by JRA (2002) to those obtained from the experiment were between 3.3 and 8.1.This value for Pile 5 in the crustless model reached 18.3.
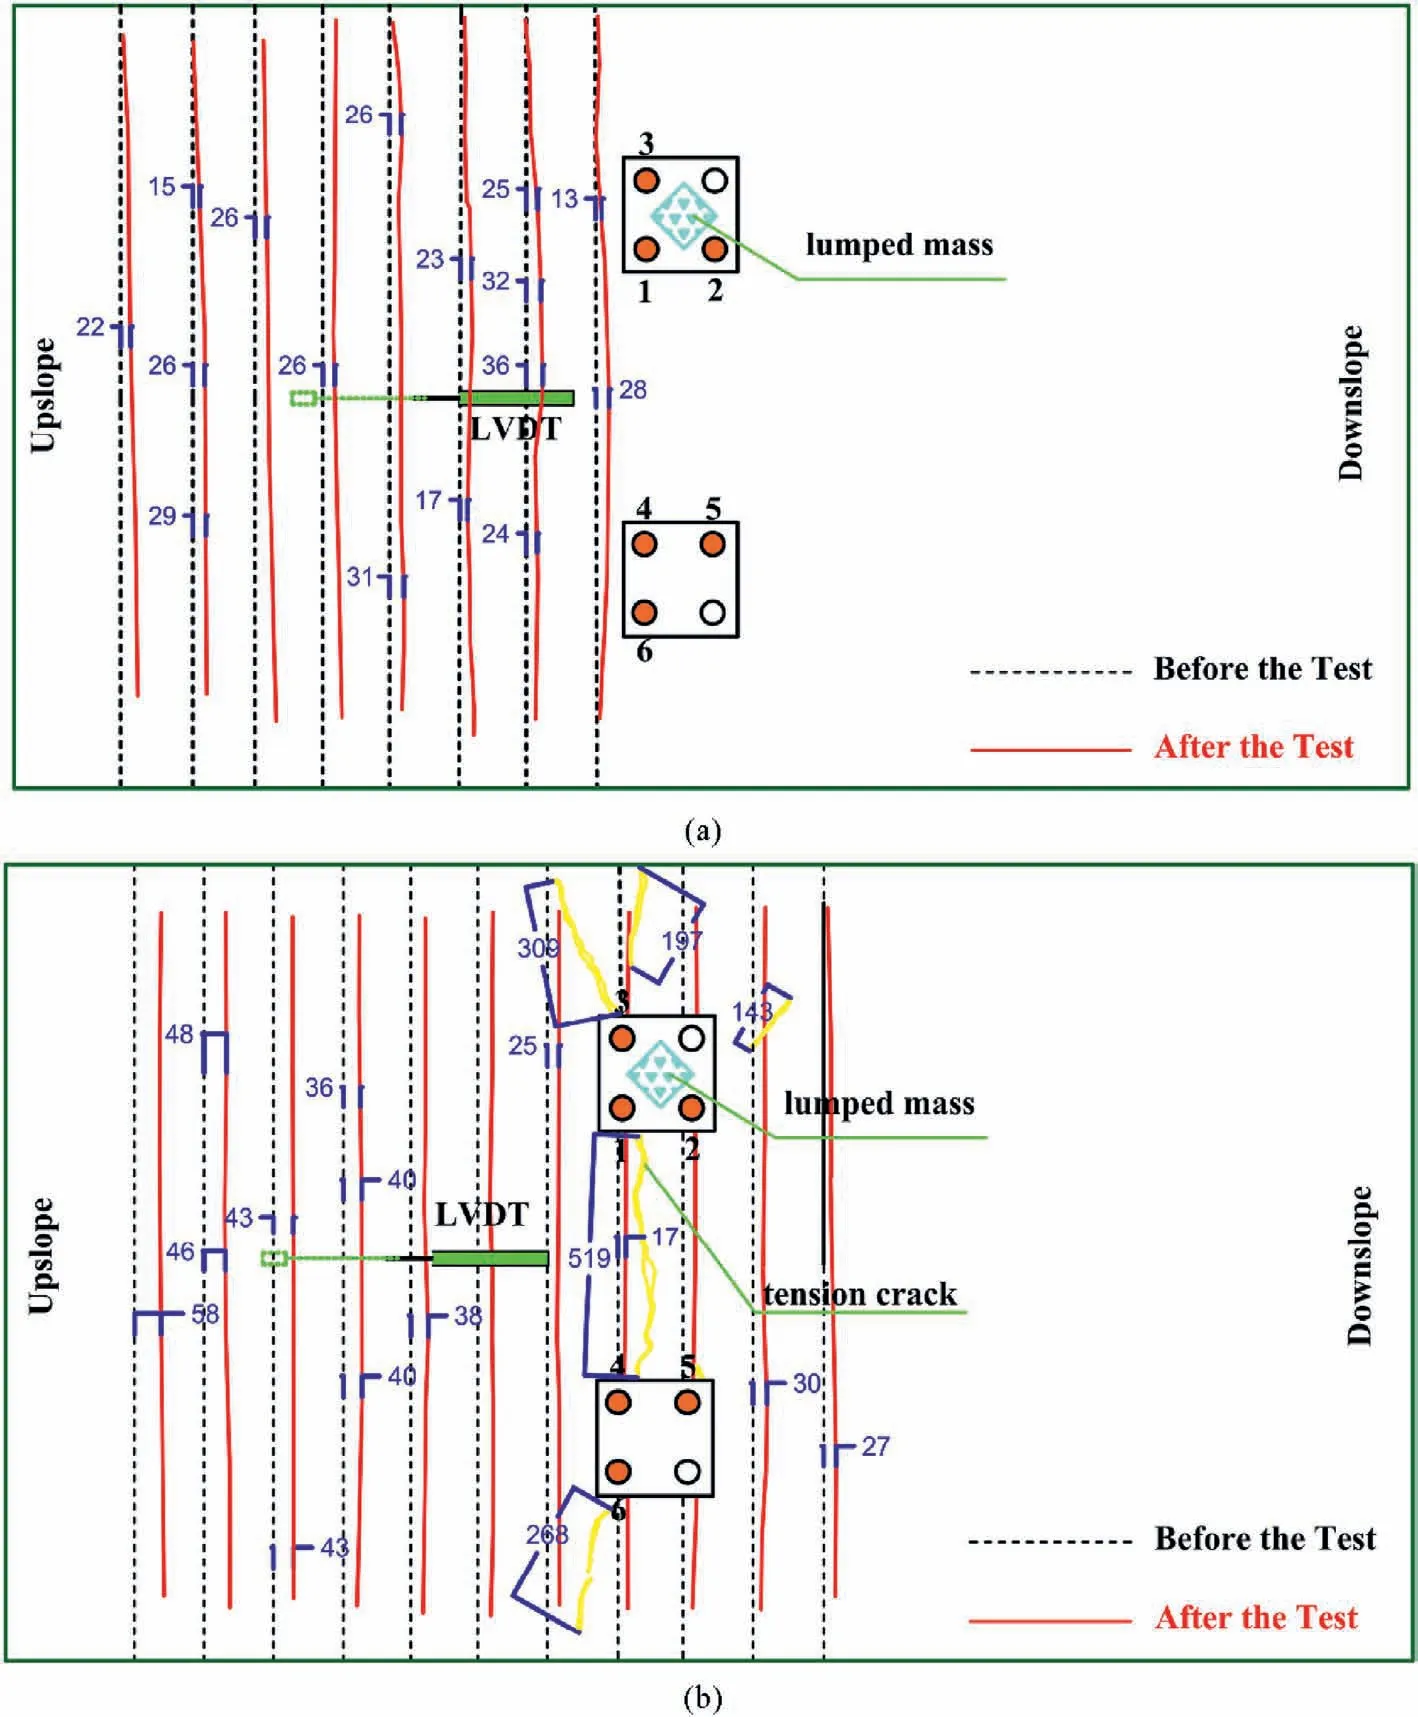
Fig.19.Patterns of surface displacements obtained by image processing: (a) The crustless model, and (b) The crusted model (black lines: initial position of mesh lines; red lines:final position of mesh lines; unit: mm).
Bar graph of the ratio of the maximum monotonic force on the piles in the crusted model to those of the associated crustless model is exhibited in Fig.16.A notable point from Fig.16 is that monotonic forces imposed on all piles,except Pile 4(downslope of the pile group without the lumped mass), were greater in the crusted model than the corresponding piles in the crustless model.The existence of the crust layer resulted in an increase between 90%and 330%of the maximum kinematic forces,applied to the piles due to lateral spreading.This issue can be related to the effects of the curst layer on lateral pressures to the piles,due to lateral spreading.
3.9.Soil pressure on the piles
In this study, the lateral soil pressures on the piles were determined using WRM proposed by Brandenberg et al.(2010).Haeri et al.(2023) explained the aforementioned method to obtain monotonic soil pressure on 3 × 3 pile groups due to lateral spreading.Implementing the same procedure, the profiles of monotonic soil pressure on the piles for the crustless and crusted models of the current study are exhibited in Fig.17.The Profiles of monotonic soil pressure for Piles 3 and 6 in the crustless model are not presented because of some unreliable and unknown results.In Fig.17,soil pressure estimated by JRA(2002)guideline is exhibited with a dashed line.JRA (2002) has no criterion to consider the effects of the position of the piles in a group.According to JRA(2002),it is assumed that the pressures on different piles of a pile group are identical due to lateral spreading.While the results of this research proved that different amounts of lateral pressure were exerted on various piles in the groups.As seen in Fig.17, the predicted and obtained amounts of soil pressure at the boundary of the crust and liquefiable layers in the crusted model are in good agreement.However,in most sections of the piles,the maximum soil pressure was less than those estimated by JRA (2002).In other words, JRA(2002) conservatively estimates the maximum soil pressure on the piles.This result is in good agreement with Liu et al.(2017)results who performed a shake table test on a 2 × 2 pile group in a soil layer stratum behind a quay wall.Their results demonstrated that the JRA (2002) code overestimates the liquefied soil pressure due to lateral spreading on the piles.In general, JRA (2002) code seems to be a worthy and suitable method for the design of piles against lateral spreading considering its simplicity.The effects of the non-liquefiable crust layer on the lateral pressure on the piles can be deduced by comparing the corresponding profiles of soil pressure in Fig.17.For instance, Pile 1 experienced 61% greater lateral soil pressure in the crusted model than in the model without the crust layer.Therefore, the crust layer is responsible for greater soil pressures on the piles according to higher shear strength than the liquefiable layer.
3.10.Visual observations during and after the experiments
Several professional cameras were employed to record movies from the models before,during and after the shaking from various viewpoints.One of the cameras was used to record the ground surface from above the models.Some snapshots recorded by this camera for the crustless and crusted models are displayed in Fig.18.These photos were analyzed and evaluated to discern the patterns of the lateral soil displacement at the ground surface before,during and after liquefaction and lateral spreading.According to Fig.3,square meshes were constructed using colored sand for better observation and analysis of the soil lateral movements, before,during and after the shakings.Fig.18a and c exhibits the surface of the models at the end of construction and just before input shaking.Fig.18b shows the final view of the crustless model after the input loading.The sand boils may not be obvious in this photo because the ground surface was lowered to a level under the water table.Fig.18d shows the tension cracks generated at the upslope of the piles in the crusted model during the shaking.Lateral spreading caused tension cracks perpendicular to the direction of the sloped ground.Similar tension cracks due to lateral spreading have been observed by some researchers, e.g.tension cracks in the ground near to piers of the Nishinomyia Bridge during the 1995 Kobe earthquake (UC Davis, Civil and Environmental Engineering).In Fig.18e,the final view of the crusted model after the input shaking can be observed.Sand boiling phenomenon occurred at several points of this model ground.Sand boiling occurred along with the dissipation of excess pore water pressure which was generated during input loading in the liquefiable layer and mainly started after the termination of the shaking.
The patterns of the surface displacement of the models were obtained by image processing of the ground surface mesh as shown in Fig.19.Initial and final positions of the lines associated with the mesh at the ground surface are demonstrated with black and red lines,respectively.As seen in this figure,the amounts of maximum surface displacement of the crustless model were significantly higher than those of the crusted model for the corresponding positions.
Schematic section views of the models after the input loadings are shown in Fig.20.It should have been noticed that the ground subsidence due to the shakings was measured after full dissipation of excess pore water pressure.On this basis,the new relative density of the liquefiable layer was calculated assuming that the non-liquefiable layers of the models did not densify by shakings due to the cohesion or high density.The surface slope disappeared in both models due to lateral spreading.Based on these measurements and the results of image processing, it was deduced that the new amount of relative density of the liquefiable layer in the crustless model was 46% due to the shaking, whereas this parameter reached 30% in the crusted model.These findings also proved the effects of the crust layer on the response of the physical model.
4.Conclusions
In this research, two relatively large-scale shake table experiments have been conducted to investigate the effects of the nonliquefiable crust layer and the superstructure mass on the responses of 2 × 2 pile groups to lateral spreading.Each physical model test contained two pile groups with and without superstructure mass and were either crusted or crustless, which were studied in detail.The most remarkable conclusions of this study are drawn as follows:
(1) Existence of the crust layer increased the maximum bending moments generated in the piles with respect to those for the crustless model.In addition, the existence of the crust layer increased the maximum and residual lateral displacements of the ground surface compared to those for the crustless model.The monotonic or kinematic forces due to lateral spreading imposed on all piles were greater in the crusted model than the corresponding piles in the crustless model,except for Pile 4-a downslope pile in the pile group without the lumped mass.
(2) Existence of the superstructure mass increased the maximum total bending moment generated in the piles in both crustless and crusted models.
(3) The maximum soil accelerations in various depths of the ground for the crusted model, before and after the liquefaction,were much higher than those for the crustless model.
(4) Existence of the crust layer decreased the maximum acceleration of the pile caps,with and without the superstructure mass.
(5) Existence of the superstructure mass decreased the maximum acceleration of the pile caps in the models with and without the crust layer.
(6) The maximum displacements of the pile caps for the crusted model were greater than those for the crustless model before liquefaction.However, after triggering liquefaction, the maximum displacements of the pile caps in the crusted model became less than those in the crustless model.
(7) The superstructure mass increased the maximum displacements of the pile caps in the crustless and crusted models.
Declaration of competing interest
The authors declare that they have no known competing financial interests or personal relationships that could have appeared to influence the work reported in this paper.
Acknowledgments
The partial financial support by the Construction and Development of Transportation Infrastructures Company affiliated with the Ministry of Roads and Urban Development of Iran and partial financial support granted by the Research Deputy of the Sharif University of Technology are acknowledged.The experiments were conducted at the Shake Table Facilities of the Civil Engineering Department,Sharif University of Technology.The contribution of all faculty,students,and technicians in performing the experiments is acknowledged as well.
 Journal of Rock Mechanics and Geotechnical Engineering2023年10期
- Journal of Rock Mechanics and Geotechnical Engineering的其它文章
- Analytical solutions for the restraint effect of isolation piles against tunneling-induced vertical ground displacements
- Characterizing large-scale weak interlayer shear zones using conditional random field theory
- Displacement-based back analysis of mitigating the effects of displacement loss in underground engineering
- Investigation of long-wavelength elastic wave propagation through wet bentonite-filled rock joints
- Mechanical properties of a clay soil reinforced with rice husk under drained and undrained conditions
- Evaluation of soil fabric using elastic waves during load-unload
