Shear sliding of rough-walled fracture surfaces under unloading normal stress
Qin Yin,Chun Zhu,Jingyu Wu,Hi Pu,Qi Wng,Yuncho Zhng,Hongwn Jing,Tinci Dng
a State Key Laboratory for Geomechanics and Deep Underground Engineering, China University of Mining and Technology, Xuzhou, 221116, China
b School of Earth Sciences and Engineering, Hohai University, Nanjing, 210098, China
c State Key Laboratory of Geohazard Prevention and Geoenvironment Protection, Chengdu University of Technology, Chengdu, 610059, China
d State Key Laboratory for Geomechanics and Deep Underground Engineering, China University of Mining and Technology (Beijing), Beijing,100083, China
e College of Civil Engineering, Fuzhou University, Fuzhou, 350108, China
Keywords:
ABSTRACT Through high-precision engraving, self-affine sandstone joint surfaces with various joint roughness coefficients(JRC=3.21-12.16)were replicated and the shear sliding tests under unloading normal stress were conducted regarding various initial normal stresses (1-7 MPa) and numbers of shearing cycles (1-5).The peak shear stress of fractures decreased with shear cycles due to progressively smooth surface morphologies, while increased with both JRC and initial normal stress and could be verified using the nonlinear Barton-Bandis failure criterion.The joint friction angle of fractures exponentially increased by 62.22%-64.87%with JRC while decreased by 22.1%-24.85%with shearing cycles.After unloading normal stress, the sliding initiation time of fractures increased with both JRC and initial normal stress due to more tortuous fracture morphologies and enhanced shearing resistance capacity.The surface resistance index (SRI) of fractures decreased by 4.35%-32.02% with increasing shearing cycles due to a more significant reduction of sliding initiation shear stress than that for sliding initiation normal stress, but increased by a factor of 0.41-1.64 with JRC.After sliding initiation, the shear displacement of fractures showed an increase in power function.By defining a sliding rate threshold of 5 10-5 m/s, transition from “quasi-static” to “dynamic” sliding of fractures was identified, and the increase of sliding acceleration steepened with JRC while slowed down with shearing cycles.The normal displacement experienced a slight increase before shear sliding due to deformation recovery as the unloading stress was unloaded, and then enhanced shear dilation after sliding initiation due to climbing effects of surface asperities.Dilation was positively related to the shear sliding velocity of fractures.Wear characteristics of the fracture surfaces after shearing failure were evaluated using binary calculation, indicating an increasing shear area ratio by 45.24%-91.02% with normal stress.
1.Introduction
Natural rock mass is usually a complex geological body containing numerous randomly distributed discontinuous structural planes due to the effects of tectonic stress and engineering disturbance (Gratchev et al., 2016; Meng et al., 2016; Yang et al.,2022).The shear resistance ability of these structural planes is far lower than that of intact rock matrix, and shear sliding along existing joints is a common failure mode in the surrounding rock mass for underground projects (Eberhardt et al., 2004; Tang and Wong, 2016).Many engineering practices have implied that shear sliding along a potential path of rock slopes due to natural interference (gravity, water and weathering), and shear sliding zones generated around tunnel surrounding rock mass caused by periodic excavation are typical long-term or short-term mechanical problems of unloading(Fig.1).Unloading in the direction normal to the joint planes would result in fractured rock mass that is more prone to shear sliding and failure(Ji et al.,2019;Huang et al.,2020).Thus,investigating the shear mechanical properties of rock fracture surfaces under unloading normal stress conditions is of profound theoretical and practical significance.
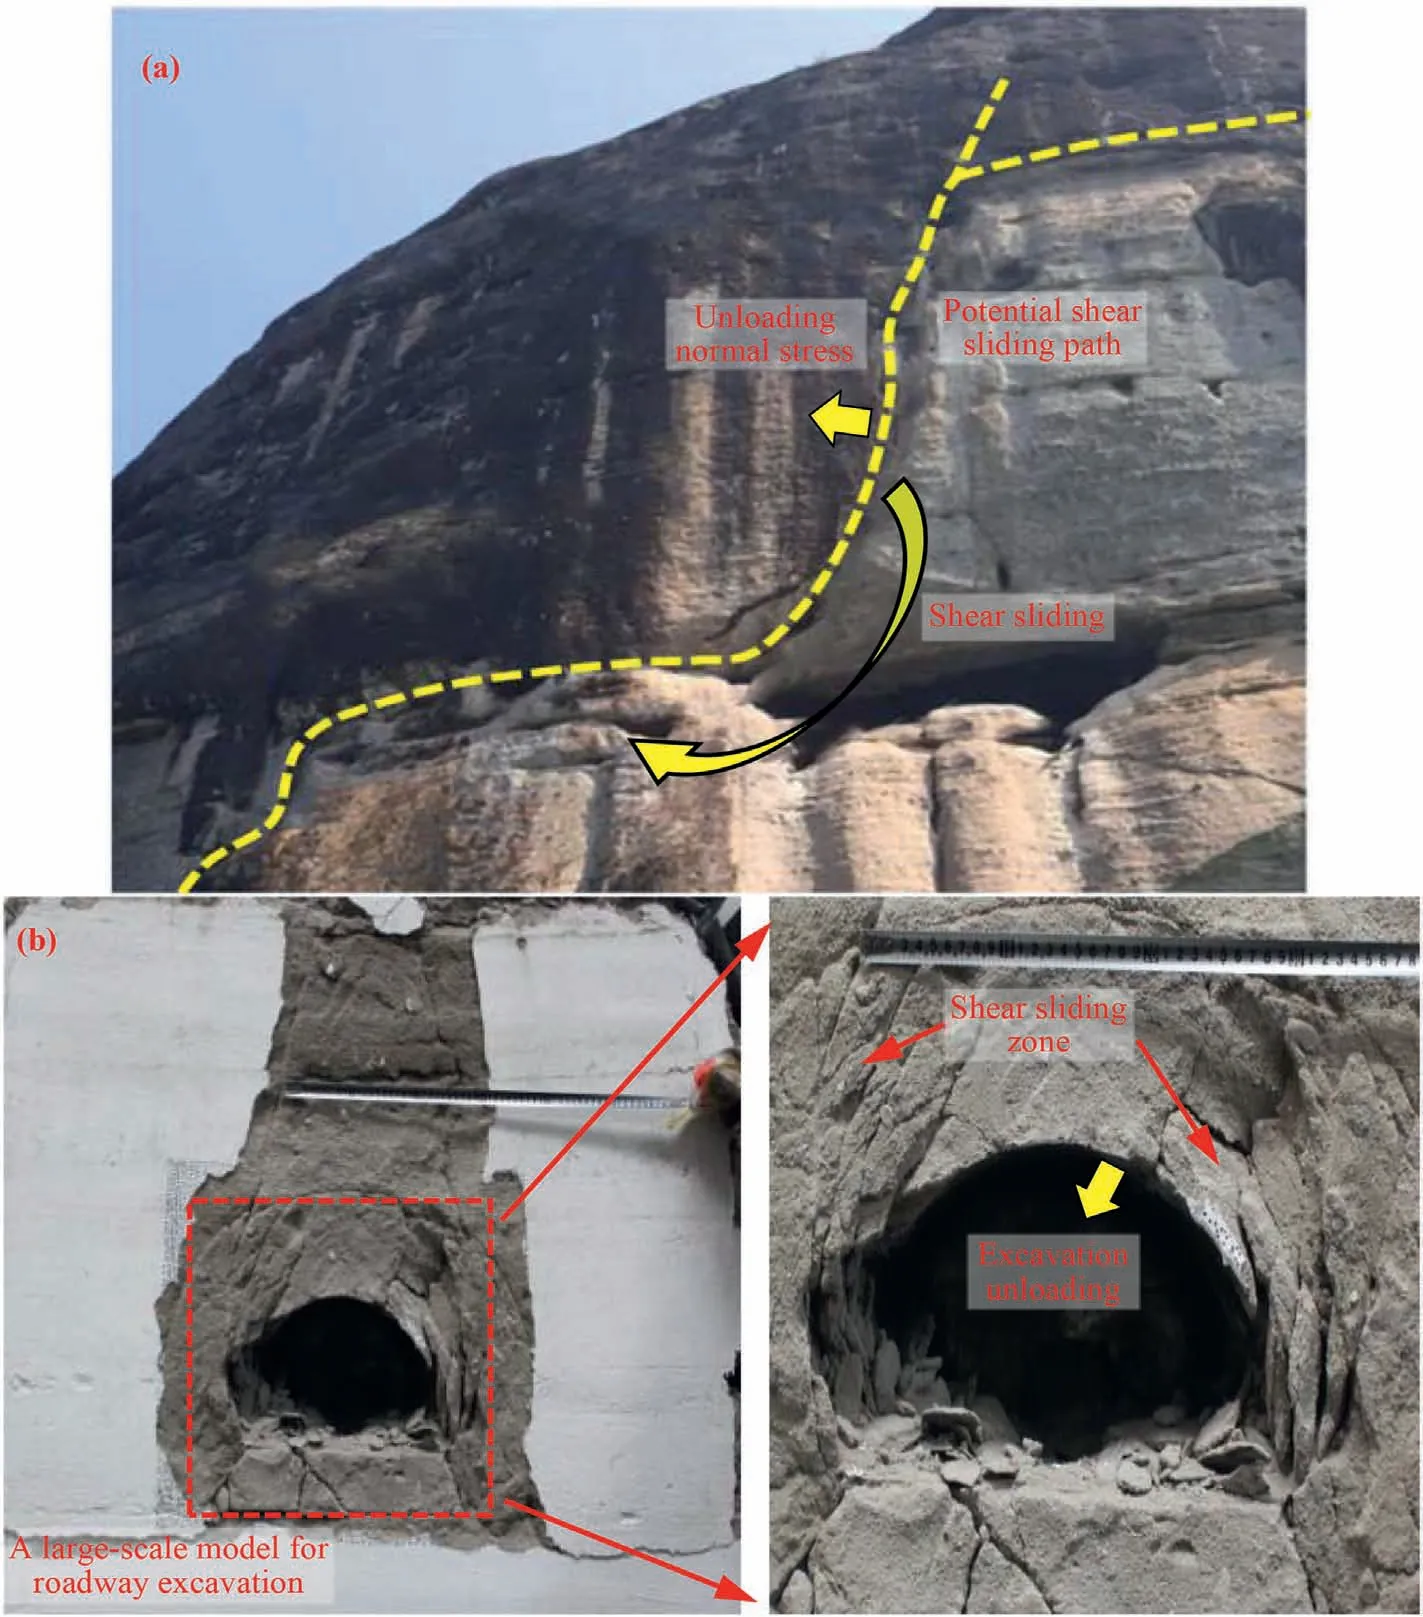
Fig.1.Unloading induced by (a) natural interference and (b) excavation (Han et al., 2020a; Jing et al., 2020).
For decades,extensive research has been carried out to evaluate the influences of joint roughness coefficient (JRC), boundary conditions, shear rate and cyclic shearing on shear mechanical behaviors, normal deformation, friction effects, acoustic emission(AE) responses, and surface deterioration for three-dimensional(3D) rough fracture surfaces through experiment, numerical simulation and theoretical analysis(Barton,1971,1973;Barton and Choubey,1977;Lee et al.,2001;Jiang et al.,2004;Mirzaghorbanali et al.,2014;Thirukumaran and Indraratna,2016;Meng et al.,2016;Zhao et al., 2017; Li et al., 2018; Han et al., 2020b).However, the above studies were generally focused on random rock joint surfaces obtained through Brazilian splitting or the same joint surfaces replicated by rock-like materials, which cannot accurately reflect the most real shear mechanical characteristics of natural rock fractures.In addition, the normal stress or normal stiffness boundary conditions generally remain unchanged in the whole shear process of fractures.Few studies of shear sliding for rock fracture surfaces under unloading normal stress have been reported.Recently, several reports focused on the shear failure behaviors of jointed rock under unloading normal stress have appeared.Huang et al.(2020) experimentally studied the mechanical behaviors of sandstone containing a pre-existing flaw under unloading normal stress with constant shear stress.Five failure modes based on crack propagating mechanisms regarding various flaw angles were identified.Zhao et al.(2022)analyzed the influences of unloading normal stress paths on shear mechanical behaviors of rock-like materials with an embedded flaw, and the fracture morphologies and failure patterns were evaluated.Zhong et al.(2020) and Yin et al.(2021a) conducted normal unloading shear tests on rock samples containing parallel fissures.The strength and deformation behaviors, stress distribution, cracking and failure patterns of rock bridges were investigated.However,the above studies were focused on the shear characteristics of rock containing closed prefabricated flaws, rather than penetrating 3D rough-walled joint surfaces.Dang et al.(2020)studied the frictional responses of fracture surfaces under cyclic normal load conditions concerning various impact frequencies and normal load amplitudes.A mathematical equation was proposed to predict the shear strength of rock-like planar joint surfaces, while the sliding initiation behaviors and effects of JRC were not considered.
Therefore,in this study,a series of fractured sandstone samples containing self-affine 3D rough joint surfaces with various JRC values (3.21-12.16) was copied using high-precision surface engraving to eliminate the influence of irregular random joint surface morphologies when investigating the role of other factors in shear performances of rock joints.A new shear sliding path under unloading normal stress was proposed, which can simulate the shear activation characteristics of natural joints more realistically under the excavation unloading stress conditions.The shear sliding tests under unloading normal stress were conducted regarding various initial normal stresses (1-7 MPa) and the numbers of shearing cycles(1-5)to simulate the effects of periodic excavation disturbance.From the experimental results, unloading normal stress induced shear mechanical behaviors, sliding initiation responses and sliding resistance capacity, shear sliding rate and dilatancy properties, as well as surface wear characteristics of real 3D rough joint surfaces were discussed.The experimental findings can provide valuable information for estimating shear slip deformation and determining support parameters of surrounding rock mass in underground projects during the unloading process of in situ excavation.
2.Experimental procedures
Four 3D rough joint surface morphologies with different JRC values of 3.21 (#S1), 5.62 (#S2), 7.36 (#S3) and 12.16 (#S4) calculated by using Eqs.(1)and(2)were first chosen,with an x0y plane projection area of 100 mm 200 mm(Han et al.,2020b),as shown in Fig.2a.
where xiand ziare the coordinates of the chosen two-dimensional(2D) joint profiles along the x-direction, and M is the number of sampling points along the joint profiles with a fixed spacing of 1 mm (Tse and Cruden, 1979).A total of 50 2D sections were extracted from the joint surfaces along the x-direction with an equal interval of 2 mm(y-direction).The average JRC value of these 2D profiles was regarded as the JRC of the 3D rough joint surface based on the suggested method put forward by other researchers,e.g.Rong et al.(2016) and Huang et al.(2018).
Then, based on the surface coordinate data, high-precision surface engraving was conducted on a yellow sandstone matrix with a high-speed bit of 18,000 r/min using an automatic carving machine.Flowing water was applied for cooling treatment during the engraving process.The sandstone was a typical type of finegrained rock with a density of 2710 kg/m3and uniaxial compressive strength of 49.88 MPa.The raw rock materials were obtained from Wuding County,Yunnan Province,China(Fig.2b).For a given joint morphology,a couple of rock blocks engraved with self-affine rough surfaces were prepared to obtain well-matched fractured rock samples (Fig.2c).To evaluate the engraving accuracy and reliability, 3D representation and digital reconstruction of the engraved surface morphologies were achieved via a high-precision laser scanning equipment with an accuracy of 10 μm, and compared to the raw surface data in Fig.2a.A series of 2D profiles along the x-direction at y = 20, 40, 60 and 80 mm for JRC = 12.16 was respectively extracted (Fig.2d), which showed a good agreement between the engraved and raw joint surface data.Four replicas were machined for each JRC and a total of 16 fractured rock samples were finally prepared(Fig.2e).
The shear sliding tests for the fractured samples under unloading normal stress were conducted via the MIS-233-1-55-03 shear test apparatus at Nagasaki University(Yin et al.,2021b),with typical stress and displacement variation paths presented in Fig.3.First,the samples with self-affine joint surfaces were placed in the shear box, and an initial normal stress σn0was applied with a loading rate of 0.5 MPa/min.In this study,four various σn0values of 1,3,5 and 7 MPa were respectively designed.Afterwards,the upper shear box was kept fixed,and the lower shear box was driven by the horizontal jack with a loading rate of 0.3 mm/min to impose the shear stress τ.As τ reached the peak shear stress τmax, the loading mode of shear stress was transferred from displacement control to stress control,from which time,τ was linearly unloaded with a rate of 1 MPa/min until approximate 85%τmax,with an always constant σn0.Extremely small values of both shear displacement u and normal displacement δnduring this process could be recognized.Note the direct shear process did not continue to the post-peak stress drop and shear sliding stages, and the slight surface damage of fractures induced by the small shear displacement was ignored during the latter analysis.In this stress state, the Mohr’s circle was below the strength envelope,and the fractured samples were stable,as shown in Fig.4.Afterwards,τ was kept constant for a period of time before σn0was unloaded at a rate of 0.6 MPa/min.When the normal stress σnwas continuously unloaded to σsiat t=tsi,u began to increase and the limit equilibrium stress state of fractured samples was reached (Fig.4).At this time, initial sliding occurred to the rock fracture, and tsiwas defined as the sliding initiation time, with the corresponding sliding initiation shear stress τsi, sliding initiation normal stress σsi, shear displacement increment Δu and normal displacement increment Δδn.The rock fractures quickly entered the rapid sliding stage soon after the sliding initiation, along with a rapid reduction in τ while a rapid increase in u.Notably, in the shear tests of rock fractures under unloading normal stress,the equipment stiffness should be able to provide a constant shear stress boundary condition(Ji et al.,2022).However, a reducing shear stress was observed here after sliding initiation.The main reasons are as follows.Accompanied by a rapid increase in shear displacement after the transition point of sliding initiation, the indenter of equipment providing shear stress could not move synchronously with the fractured sample,because there was not a large enough shear velocity to maintain constant shear stress due to a self-protection response.This resulted in a reduction in shear stress.δnalso showed a significant increase due to reduction in normal stress induced shear dilation (Fig.3).Throughout the shear process under unloading normal stress,σn,τ,u and δnof the rock fractures were gathered in real-time using the data collection system of equipment,with a sampling frequency of 1 Hz.
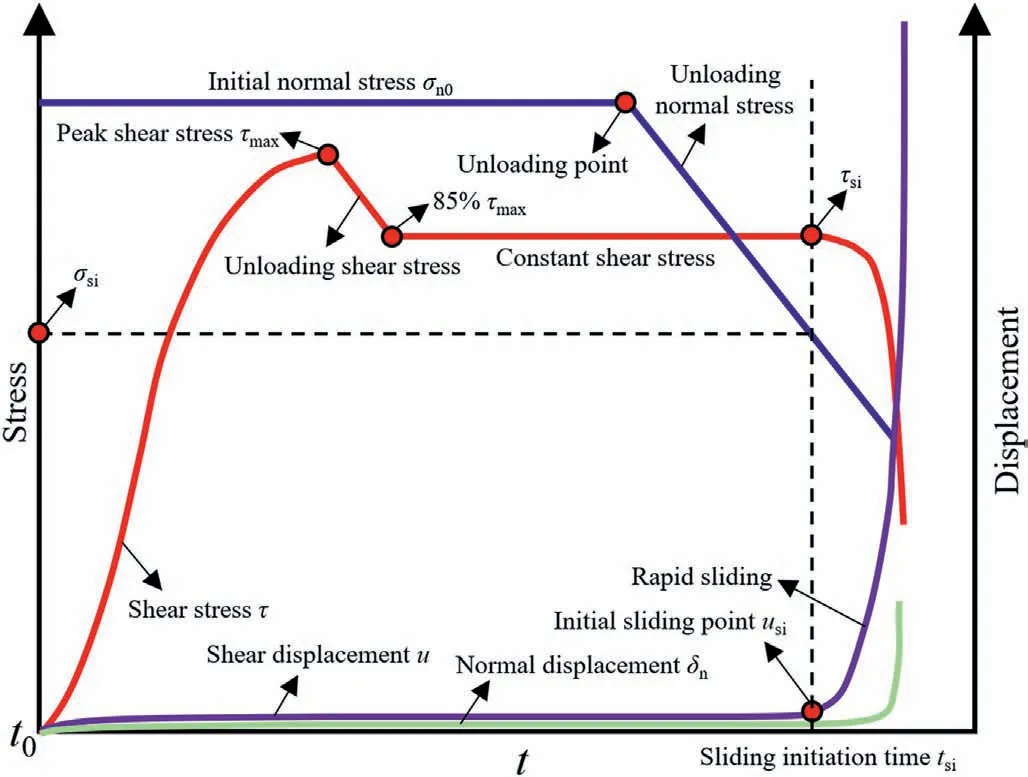
Fig.3.Typical stress and displacement variation paths for shear induced by unloading normal stress.
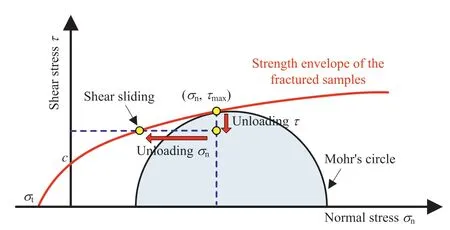
Fig.4.Typical shear sliding paths under unloading normal stress.
The typical stress and displacement responses for the shear sliding under unloading normal stress in Fig.3 are for one shear cycle of the 3D rough fracture surfaces.Here,the influence of cyclic shearing (n = 1, 2, 3, 4 and 5) on the shear sliding performance of the rough rock fracture surfaces was also estimated.Notably, for a certain fractured rock sample, the next shear cycle could be performed after u was restored to 0, and only shearing along the positive direction was considered.Overall, a total of 80 groups of shear tests were conducted.
3.Shear sliding responses under unloading normal stress
Fig.5 presents the whole evolution process of τ,σnand u for the rough fracture surfaces regarding various JRC, σn0and n values, in which τ1-τ5,σn1-σn5and u1-u5denote τ,σnand u for the fractures at n = 1-5, respectively.From Fig.5, for a certain JRC and σn0, as n increased,the variation curves of τ shifted downwards,resulting in a reduction in both τmaxand the corresponding time due to gradual cutting and shearing off of the surface asperities.The fracture surfaces tended to be smooth and the shear resistance capacity weakened.As n increased, the u variation curves shifted to the right,and tsiwas increased,thus to produce a reduction in σsidue to the linear unloading of normal stress with time.For a small σn0(1 MPa), the τ variation curves significantly fluctuated, and the fluctuation gradually weakened as σn0increased.For a given n,the shear resistance ability of fractures was enhanced with an increase in both JRC and σn0,resulting in an increasing τmax,accompanied by an increase in tsibut a reduction in σsi.The shear displacement experienced a slight increase during the former direct shearing stage of the fracture surfaces, and then remained generally unchanged during the constant τ stage before showing an increase with a gradually increasing rate during the shear sliding stage under unloading normal stress, which would be later discussed in detail.
Variations in τmaxof the fracture surfaces achieved from the former direct shear are estimated in Fig.6a.With an increase in JRC,the 3D fitting surfaces of τmax=f(σn0,n)shifted upwards,implying an increase in τmax, while the increase extent generally weakened with n.Four binary quadratic fitting functions in Eq.(3) were put forward to evaluate the increasing variation of τmaxagainst σn0while decreasing variation of τmaxagainst n.The fitting coefficients reflected the shear resistance properties enhanced by the initial JRC values but weakened by cycling shearing of the joint surfaces.Choosing JRC = 7.36 as an example, τmaxdecreased by 24.98%-32.57%in the n range of 1-5,but increased by a factor of 4.55-5.31 for σn0=1-7 MPa.Generally,for a certain JRC,the increase extent of τmaxwith σn0enhanced with an increasing n, and the decrease extent of τmaxwith n weakened with an increasing σn0.
Through conducting a large number of shear tests on natural joint surfaces, the nonlinear Barton-Bandis theoretical formula for predicting shear strength of rock joints was put forward (Barton,1971,1973; Barton and Choubey,1977;Bandis et al.,1981):
where φbis the basic friction angle for flat unweathered rock joint surfaces, and JCS is the joint wall compressive strength.
From Fig.6a, variations in τmaxas a function of σn0for the fractures regarding various JRC values at n = 1 can be achieved.Then,the experimental σn0-τmaxrelations were evaluated using the Barton-Bandis failure criterion.For most flat unweathered rock joint surfaces,φbis generally in the range of 25°-35°,and here,the value of φb=30°for sandstone was determined based on previous literature (Barton and Choubey, 1977; Barton et al., 1985).Comparison between the experimental and theoretical results is given in Fig.6b.The experimental σn0-τmaxrelations agreed well with the theoretical results obtained using the Barton-Bandis failure criterion except for JRC=3.21 might due to the calculation error of the equivalent JRC value for 3D rough joint surfaces.
The zero-intercept linear strength envelopes describing the σn0-τmaxrelations presented in Fig.6a were achieved using Eq.(3),from which the joint friction angle φ for the fracture surfaces could be calculated based on the slopes of the fitting curves.Fig.6c shows the 3D fitting surface of variations in φ as a function of n and JRC,which could be well evaluated using Eq.(5).φ was exponentially increased by 62.22%-64.87%in the JRC range of 3.21-12.16,but was linearly decreased by 22.1%-24.85%in the n range of 1-5.
From the theoretical results describing the σn0-τmaxrelations using the nonlinear Barton-Bandis failure criterion for the fracture surfaces at n = 1 shown in Fig.6b, variations in the equivalent secant friction angle φswere evaluated by connecting a straight line from the origin to the(σn0,τmax)points on the Barton-Bandis failure surface (Prassetyo et al., 2017).As indicated in Fig.6d, different from a constant φ value of the fracture surfaces for σn0=1-7 MPa at n = 1, φsshowed a gradual reduction with an increasing σn0as a result of nonlinear σn0-τmaxrelations in the Barton-Bandis failure criterion.In addition, the secant friction angle φswas larger than the basic friction angle φb(30°) attributed to the added friction effects contributed by the joint surface asperities.As JRC increased,the φsvariation curves moved upwards,implying enhanced friction effects of the joint surfaces.
The sliding initiation for fractures induced by unloading normal stress appeared to be affected by JRC,σn0and n(Fig.7).Generally,as JRC was increased, the fitting surfaces of tsi= f(σn0, n) moved upwards, implying an increase in tsidue to more tortuous fracture morphologies.The sliding resistance capacity of fracture surfaces was enhanced.Taking σn0=1 MPa as an example,in the JRC range of 3.21-12.16, tsiwas increased from 231-240 s to 273-292 s.Similarly, tsialso presented an increase against σn0due to the enhanced shear modulus of the fracture surfaces.In the σn0range of 1-7 MPa, tsiwas generally linearly increased by 34.2%-58.33%(#S1), 49.8%-52.72% (#S2), 39.25%-50.9% (#S3) and 39.56%-45.89% (#S4), respectively.Interestingly, an increasing tsicould be observed with a larger n value, although the increase extent was relatively small.Taking JRC=12.16 as an example,in the n range of 1-5, tsiexperienced an increase by 6.96%-19.69%.For a given sample,as n was increased,both σsiand τsiwere decreased,and the sliding initiation behaviors of the fractures were closely related to both σsiand τsi, i.e.SRI, which would be explained later.
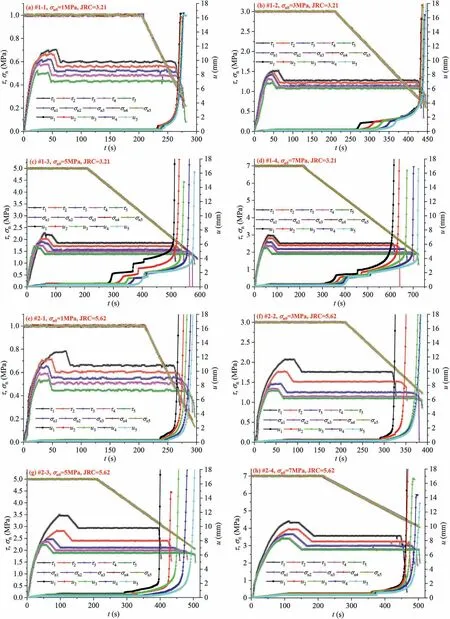
Fig.5.Variation process of τ, σn and u for the fracture surfaces during the whole shearing process under unloading normal stress.
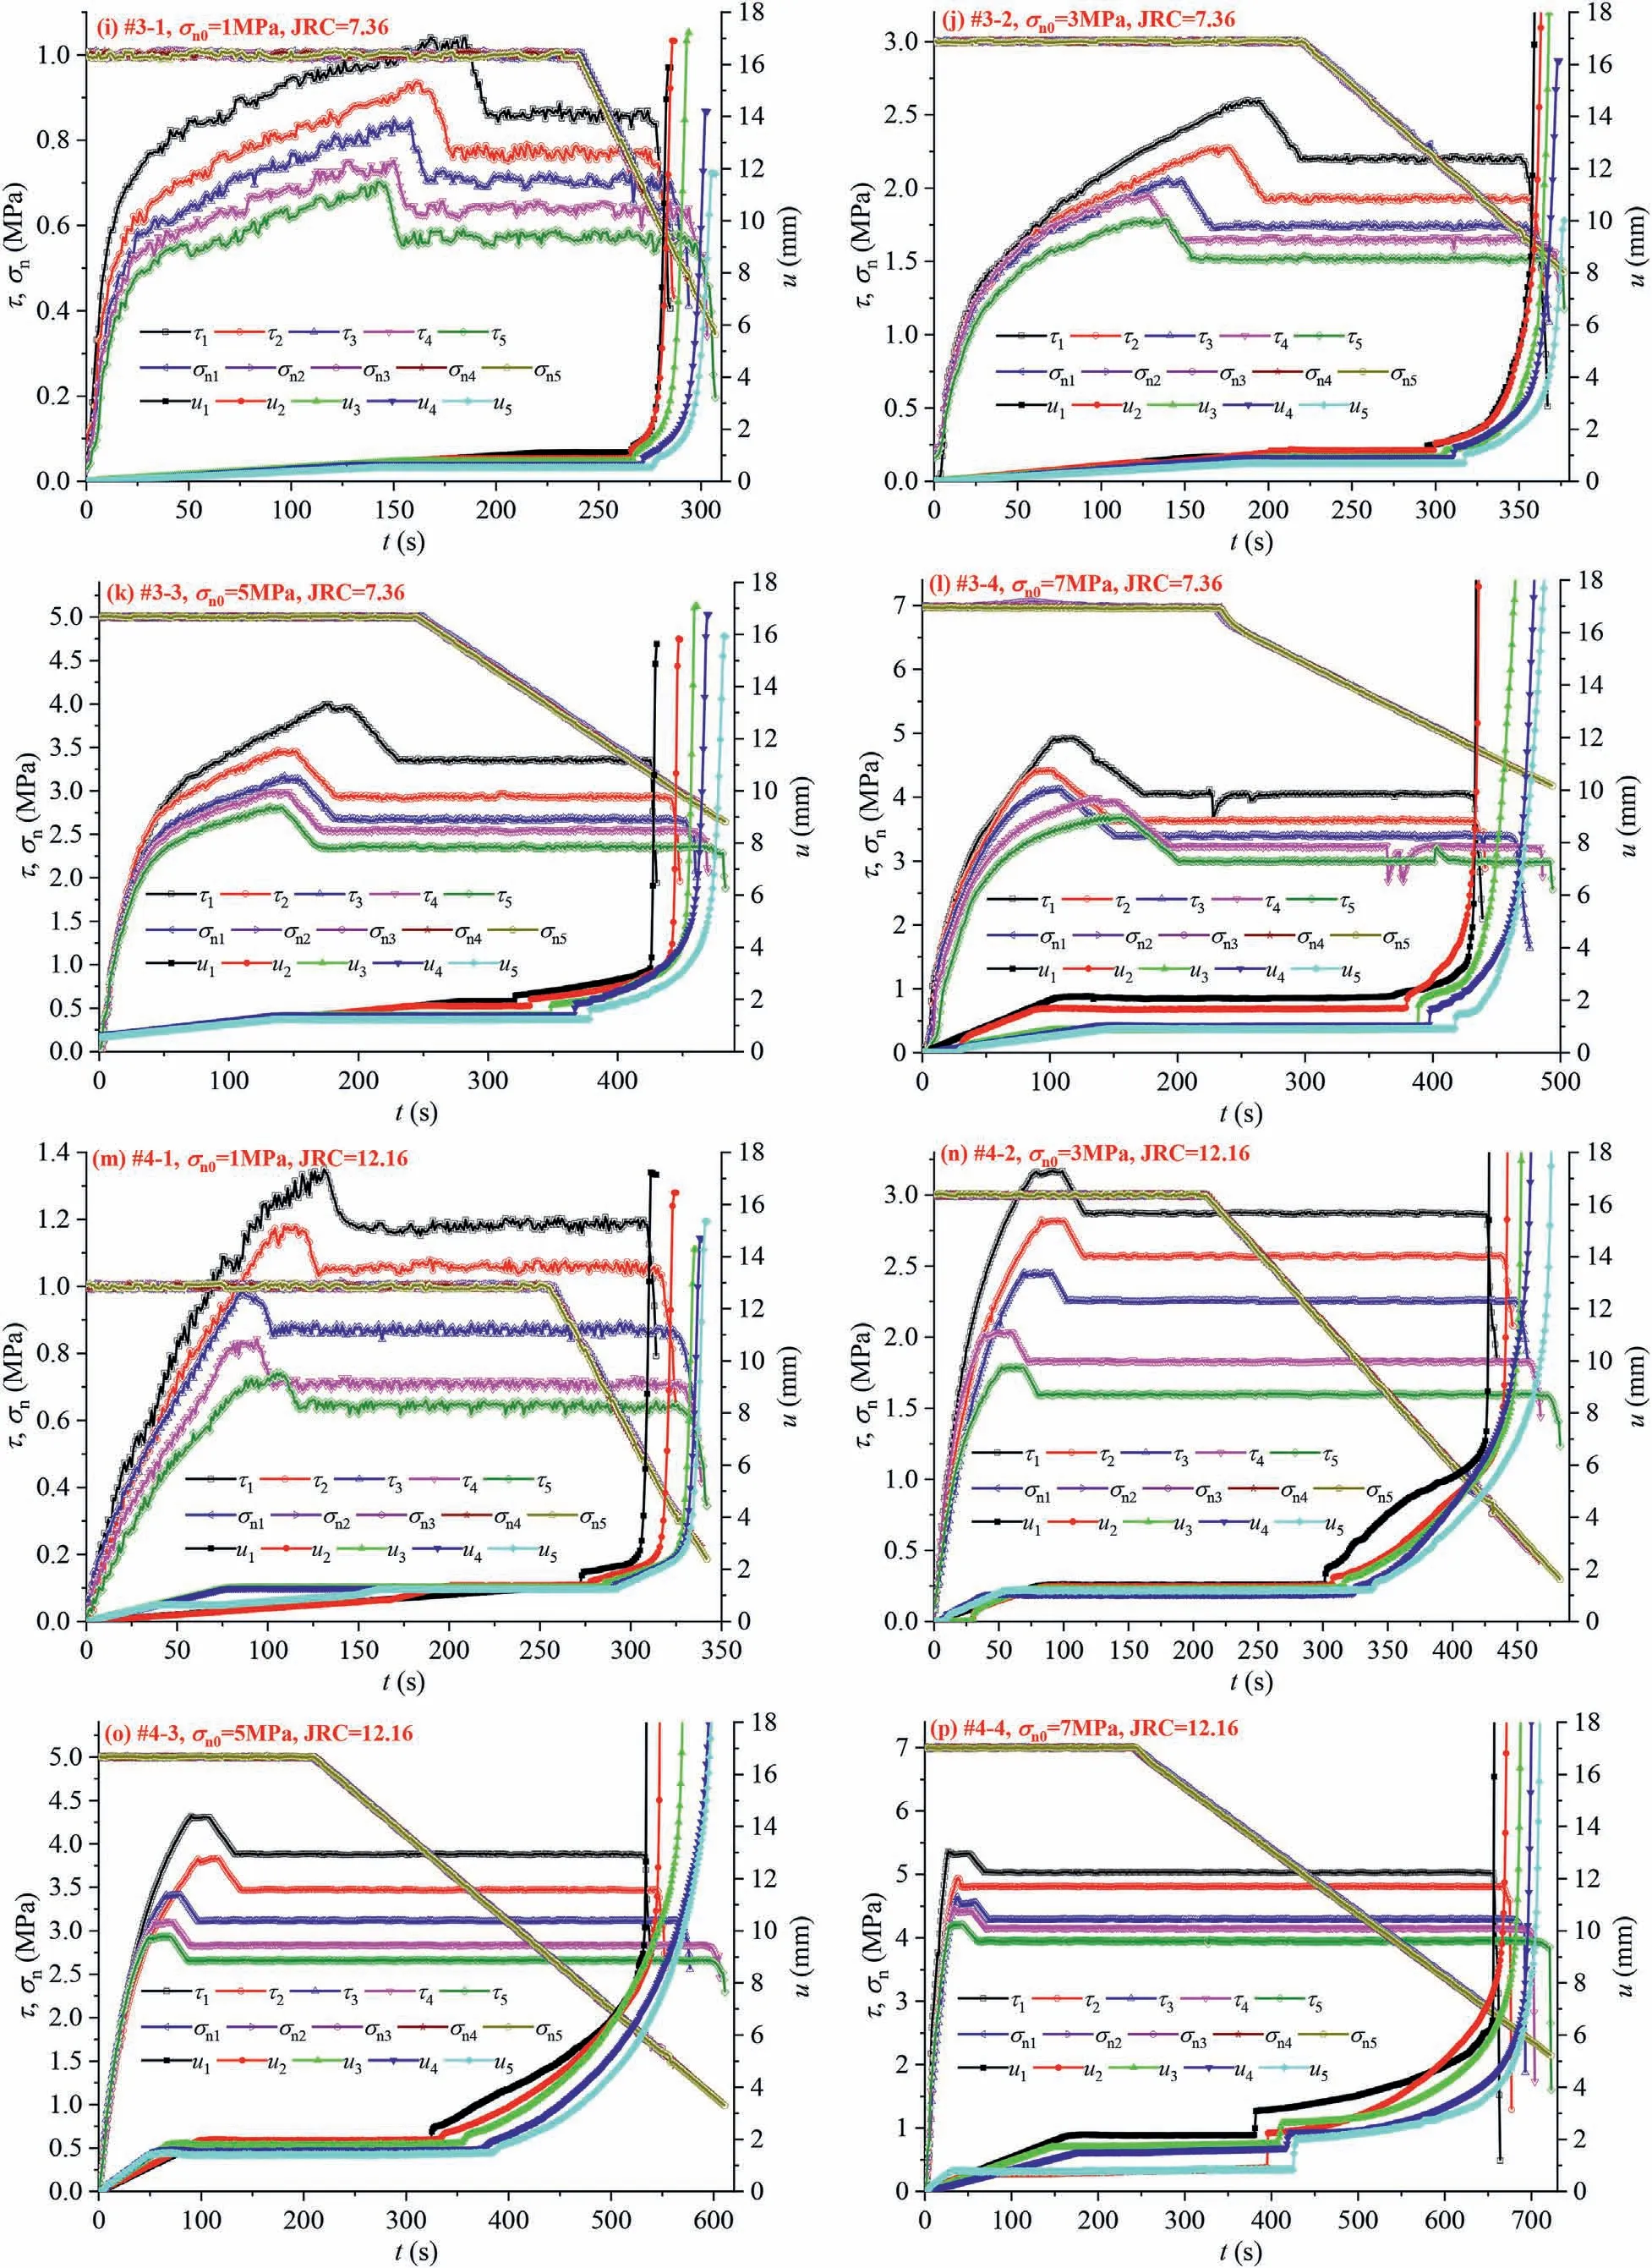
Fig.5.(continued).
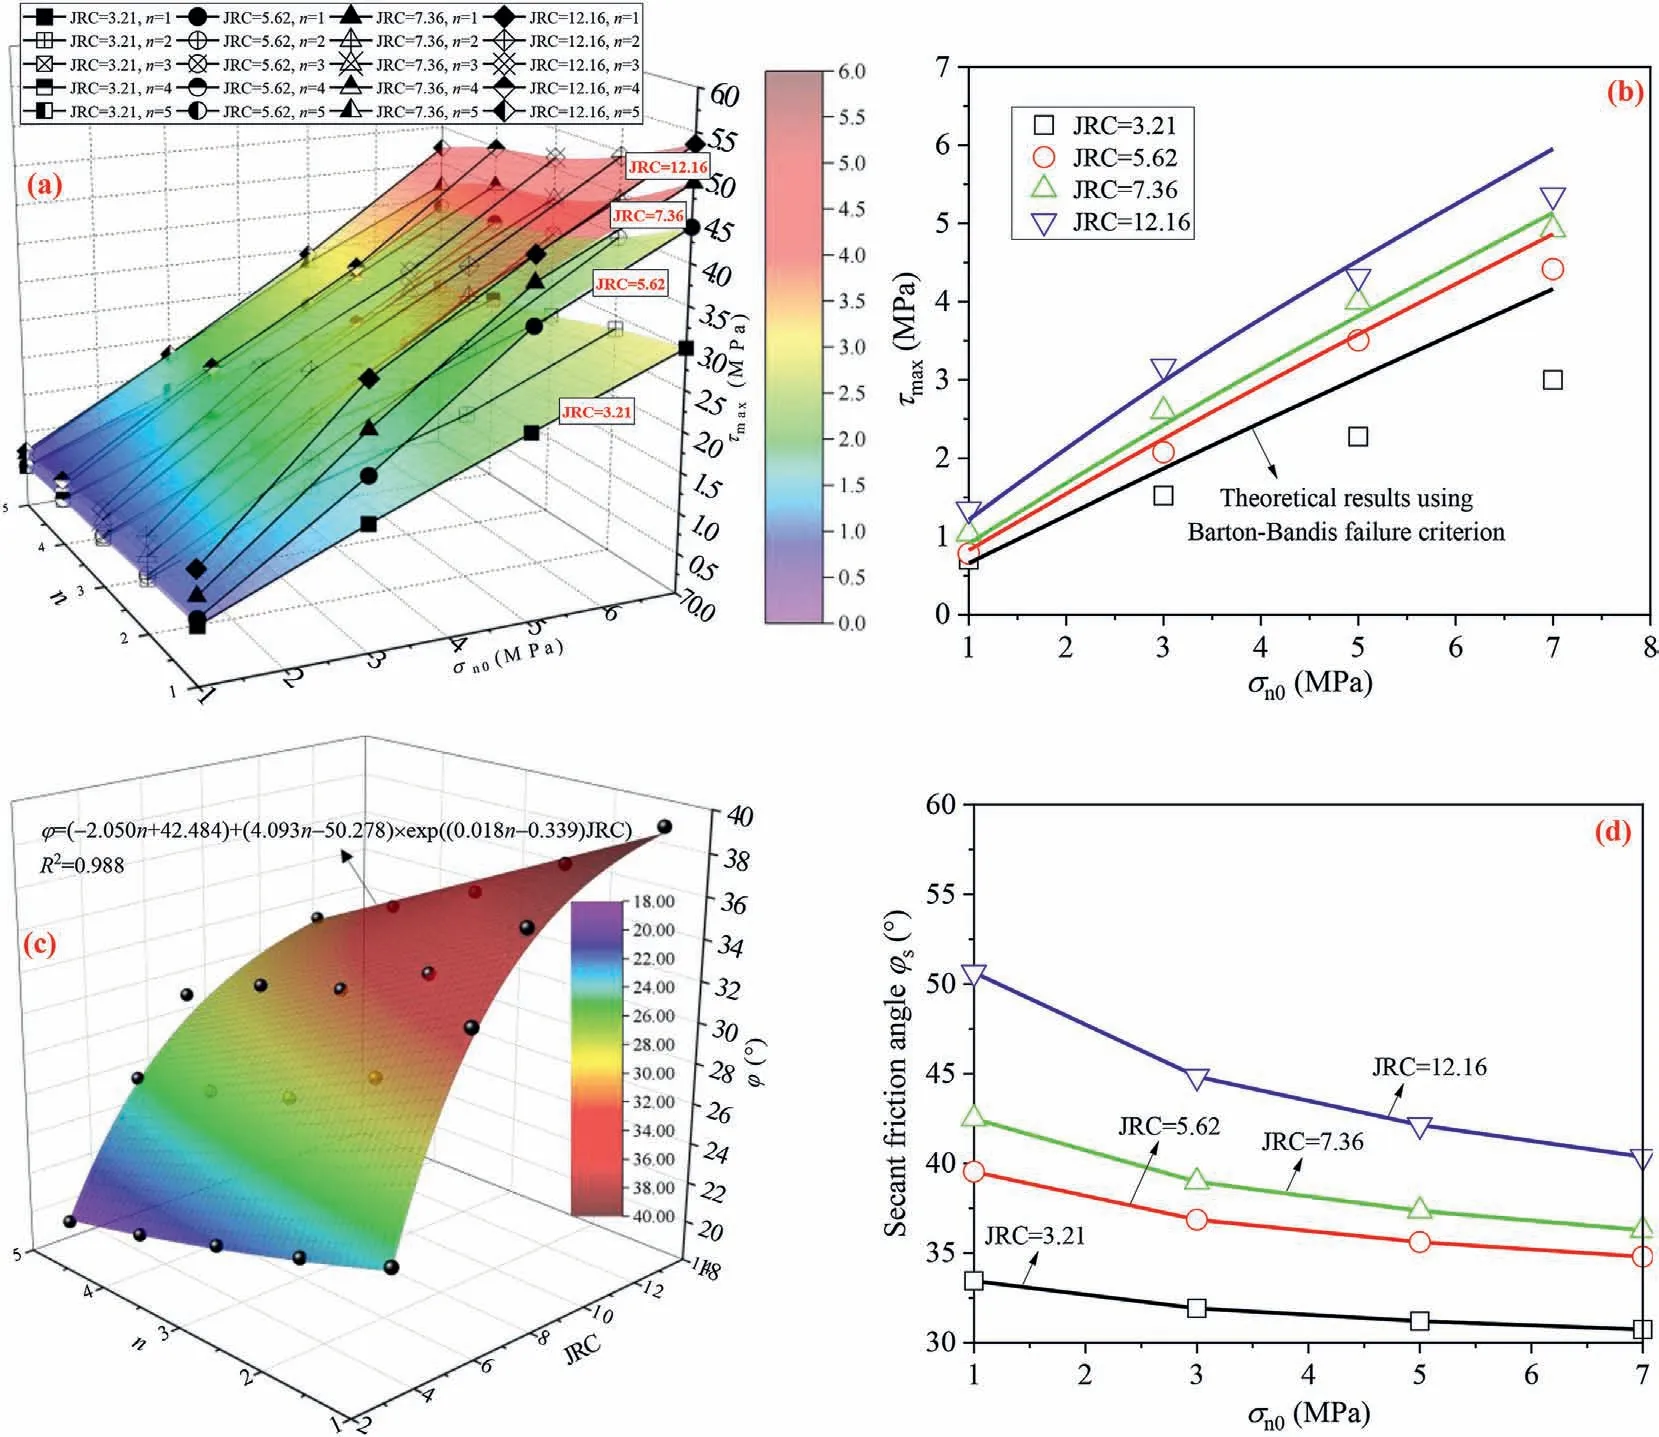
Fig.6.(a) Changes in τmax against various JRC, σn0 and n; (b) Comparison of experimental σn0-τmax relations with theoretical results obtained using the Barton-Bandis failure criterion regarding various JRC for n=1;(c)Fitting surface of φ regarding various n and JRC;and(d)Changes in the equivalent secant friction angle φs from the nonlinear Barton-Bandis failure criterion for n = 1.
Fig.8a shows variations in σsifor the sliding initiation of the fracture surfaces.As σn0increased, σsisignificantly increased by a factor of 5.71-8.09, while as n increased, variations in σsiwere gentle, implying a reduction by 3.61%-23.29%.In addition, in the JRC range of 3.21-12.16,σsiwas fluctuated within a small range and did not present a monotonous variation.Then,based on Fig.8a,the normal stress drop Δσn, defined as σn0minus σsi, of the fracture surfaces was respectively calculated, as plotted in Fig.8b (taking JRC = 3.21 and 12.16 as examples).For σn0= 1-7 MPa, Δσndramatically increased by a factor of 2.65-3.69 (JRC = 3.21) and 4.2-7.46(JRC=12.16),respectively,which also verified the fact that sliding resistance capacity of fracture surfaces was enhanced as the applied σn0increased.Similarly, Δσnalso presented an increase with JRC due to a rougher fracture surface morphology.
Variations in τsiof the fracture surfaces are shown in Fig.9a,which increased by a factor of 3.17-5.19 with σn0,while decreased by 16.71%-44.91%with n.Note,for JRC=3.21-12.16,the τsi=f(σn0,n)fitting surfaces shifted upwards,indicating an increasing τsi,but the increase extent weakened with n.To evaluate the friction coefficients of fracture surfaces resisting shear sliding,the SRI defined as the ratio of shear stress to normal stress was proposed(Lee et al.,2014;Fang et al.,2017).Here,the SRI for fractures corresponding to sliding initiation was calculated using Eq.(6)and plotted in Fig.9b.
When n was increased, due to a more remarkable reduction amplitude of τsiover that for σsi, for a certain JRC and σn0, SRI exhibited a decrease by 4.35%-32.02% for n = 1-5.The fracture surfaces became smoother owing to deterioration of surface asperities during cyclic shearing,and shear sliding was more prone to initiate after the normal stress was unloaded.However, the SRI presented an increase by a factor of 0.41-1.64 for JRC=3.21-12.16,because more tortuous morphologies inhibited the sliding tendency of the fracture surfaces, but the increase extent generally weakened with n.Additionally, for a certain JRC and n, as σn0was increased from 1 to 7 MPa,due to more significant increase extent of σsiover that for τsi,the SRI for the fracture surfaces at the sliding initiation point reduced by 21.7%-49.7%,which was consistent with some existing reports(e.g.Lee et al., 2014; Yin et al., 2020).
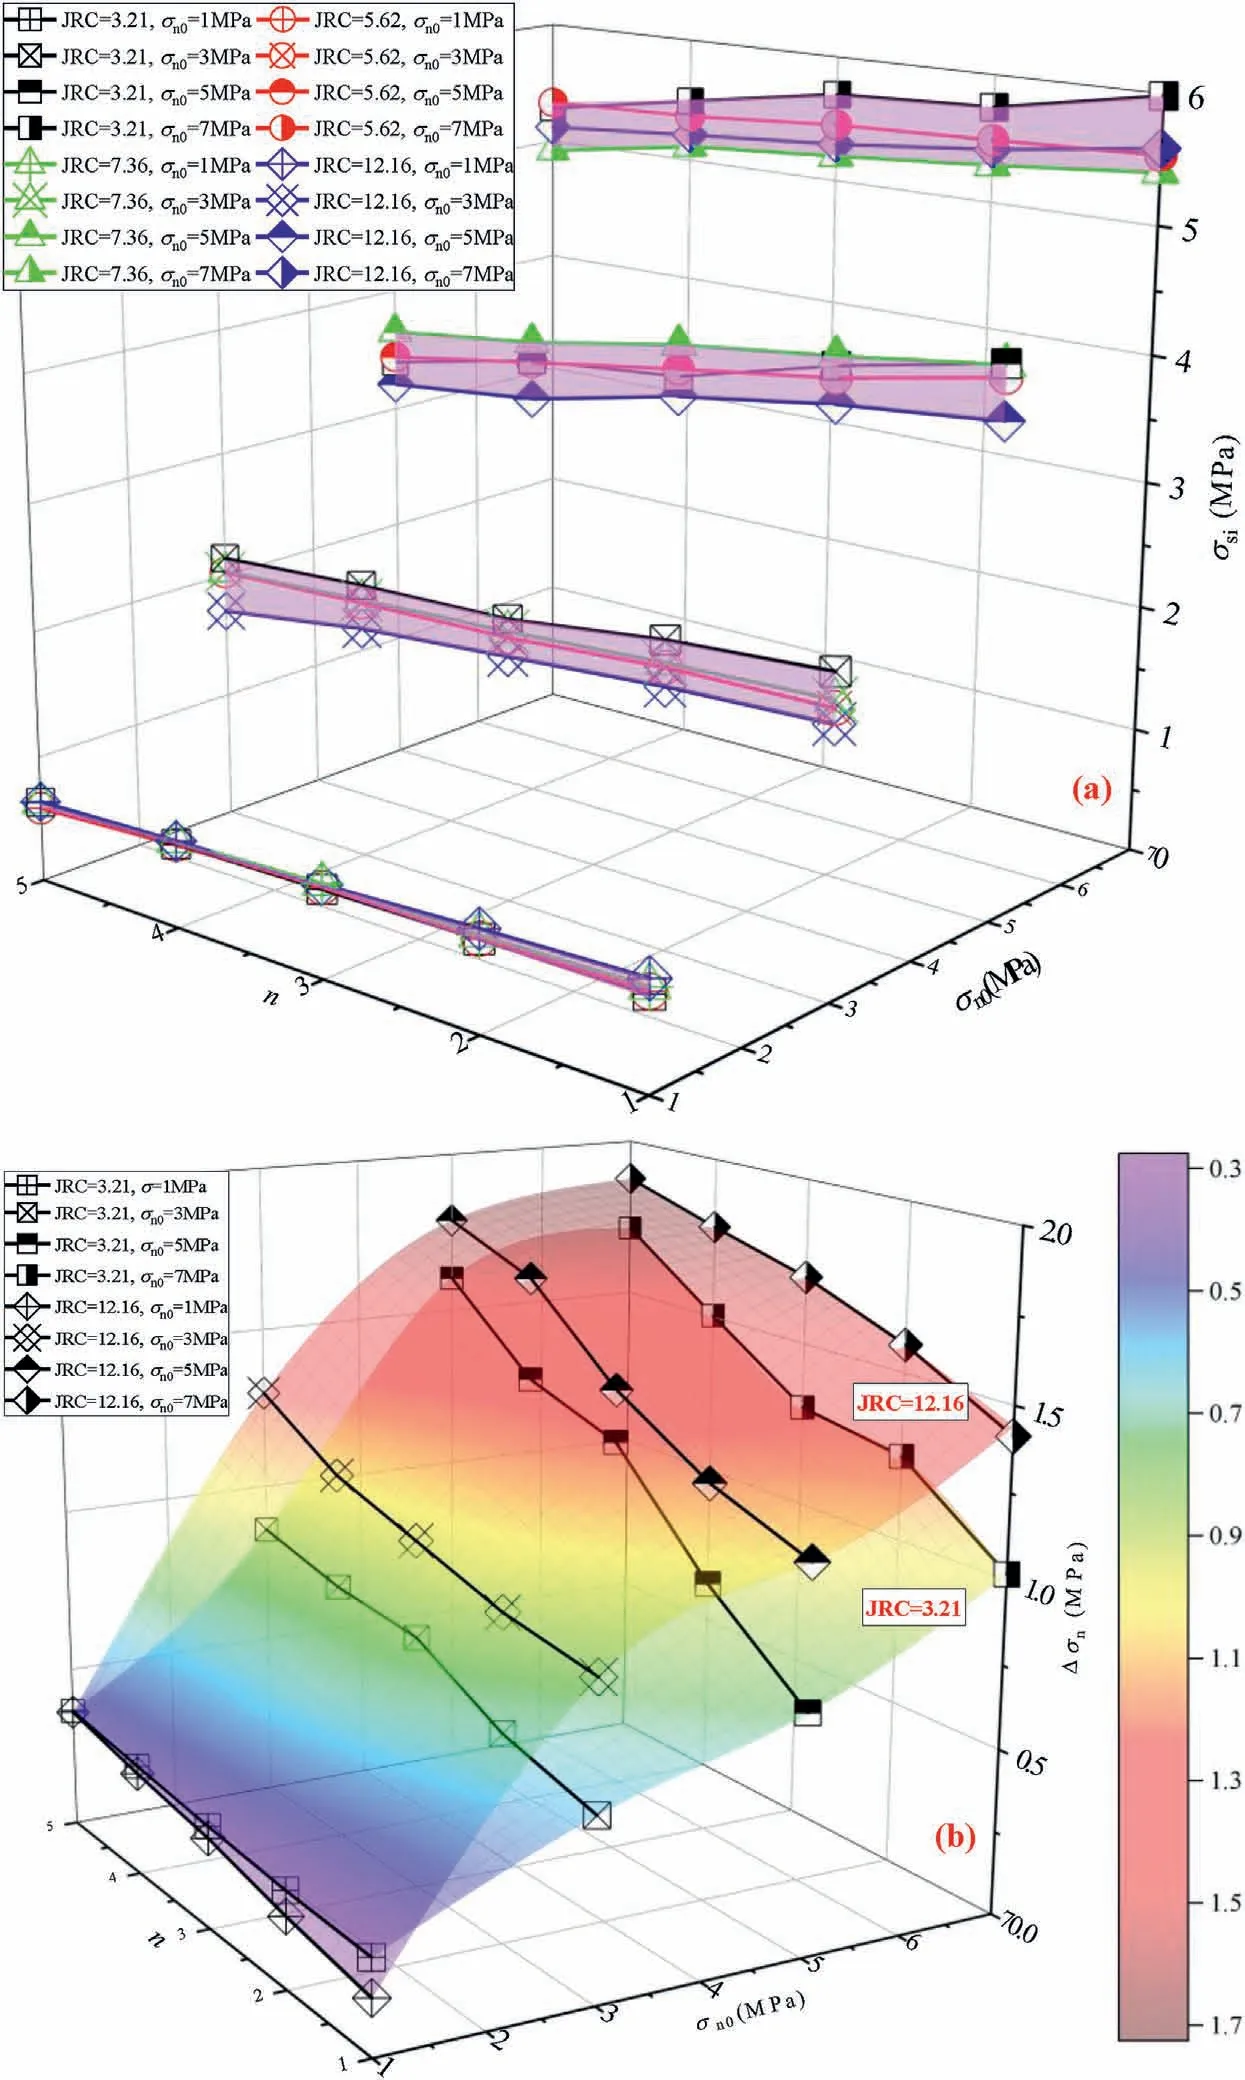
Fig.8.Changes in (a) σsi, and (b) Δσn for the rough fracture surfaces.
Fig.10 shows the evolution process of the shear displacement u for the rough fracture surfaces from the sliding initiation point(t=tsi)(taking JRC=3.21-12.16 for σn0=1 MPa,and σn0=1-7 MPa for JRC= 3.21 as examples).Note that the shear displacement was not increased from zero due to the early accumulation of shear deformation during the direct shear process before unloading normal stress.Generally,for a given σn0,the sliding initiation shear displacement uifor the fractures increased with JRC due to more tortuous fracture surfaces while reduced with n due to progressively flattened surface morphologies after cyclic shearing(Fig.10a-d).In addition, uiof the fracture surfaces was also enhanced with an increasing σn0from 1 to 7 MPa(Fig.10e-h).After sliding initiation,the shear displacement of the fractures generally showed a power function increase, implying an increasing shear sliding rate v.Through first-order and second-order derivation of u(Eq.(7)),both shear sliding rate v and shear sliding acceleration a0for the fracture surfaces from tsicould be obtained, as shown in Figs.10 and 11.
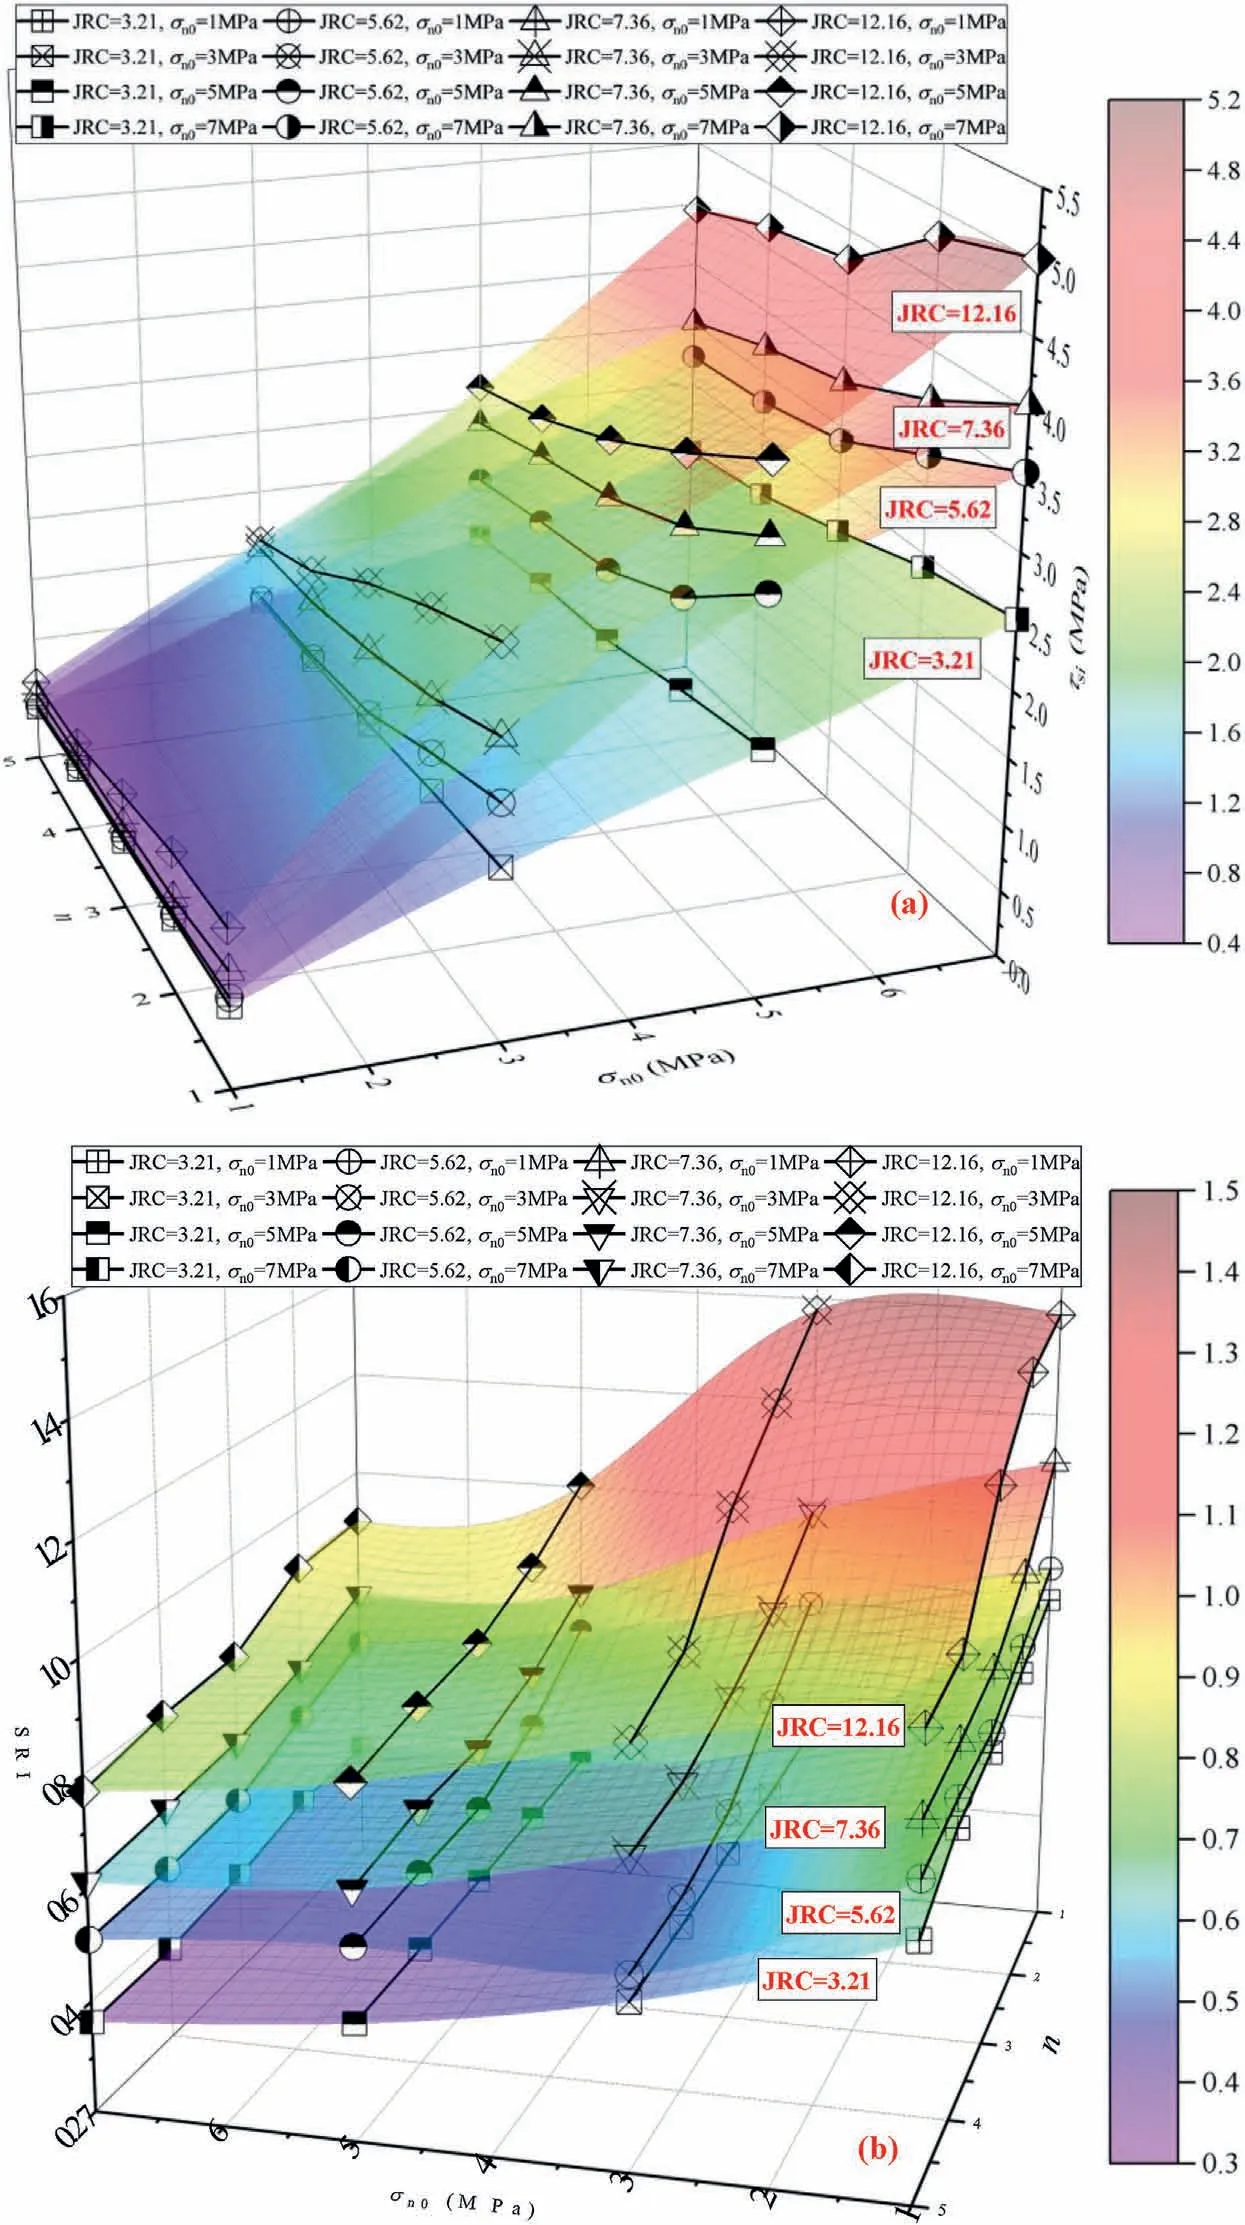
Fig.9.Changes in (a) τsi and (b) SRI for the rough fracture surfaces.
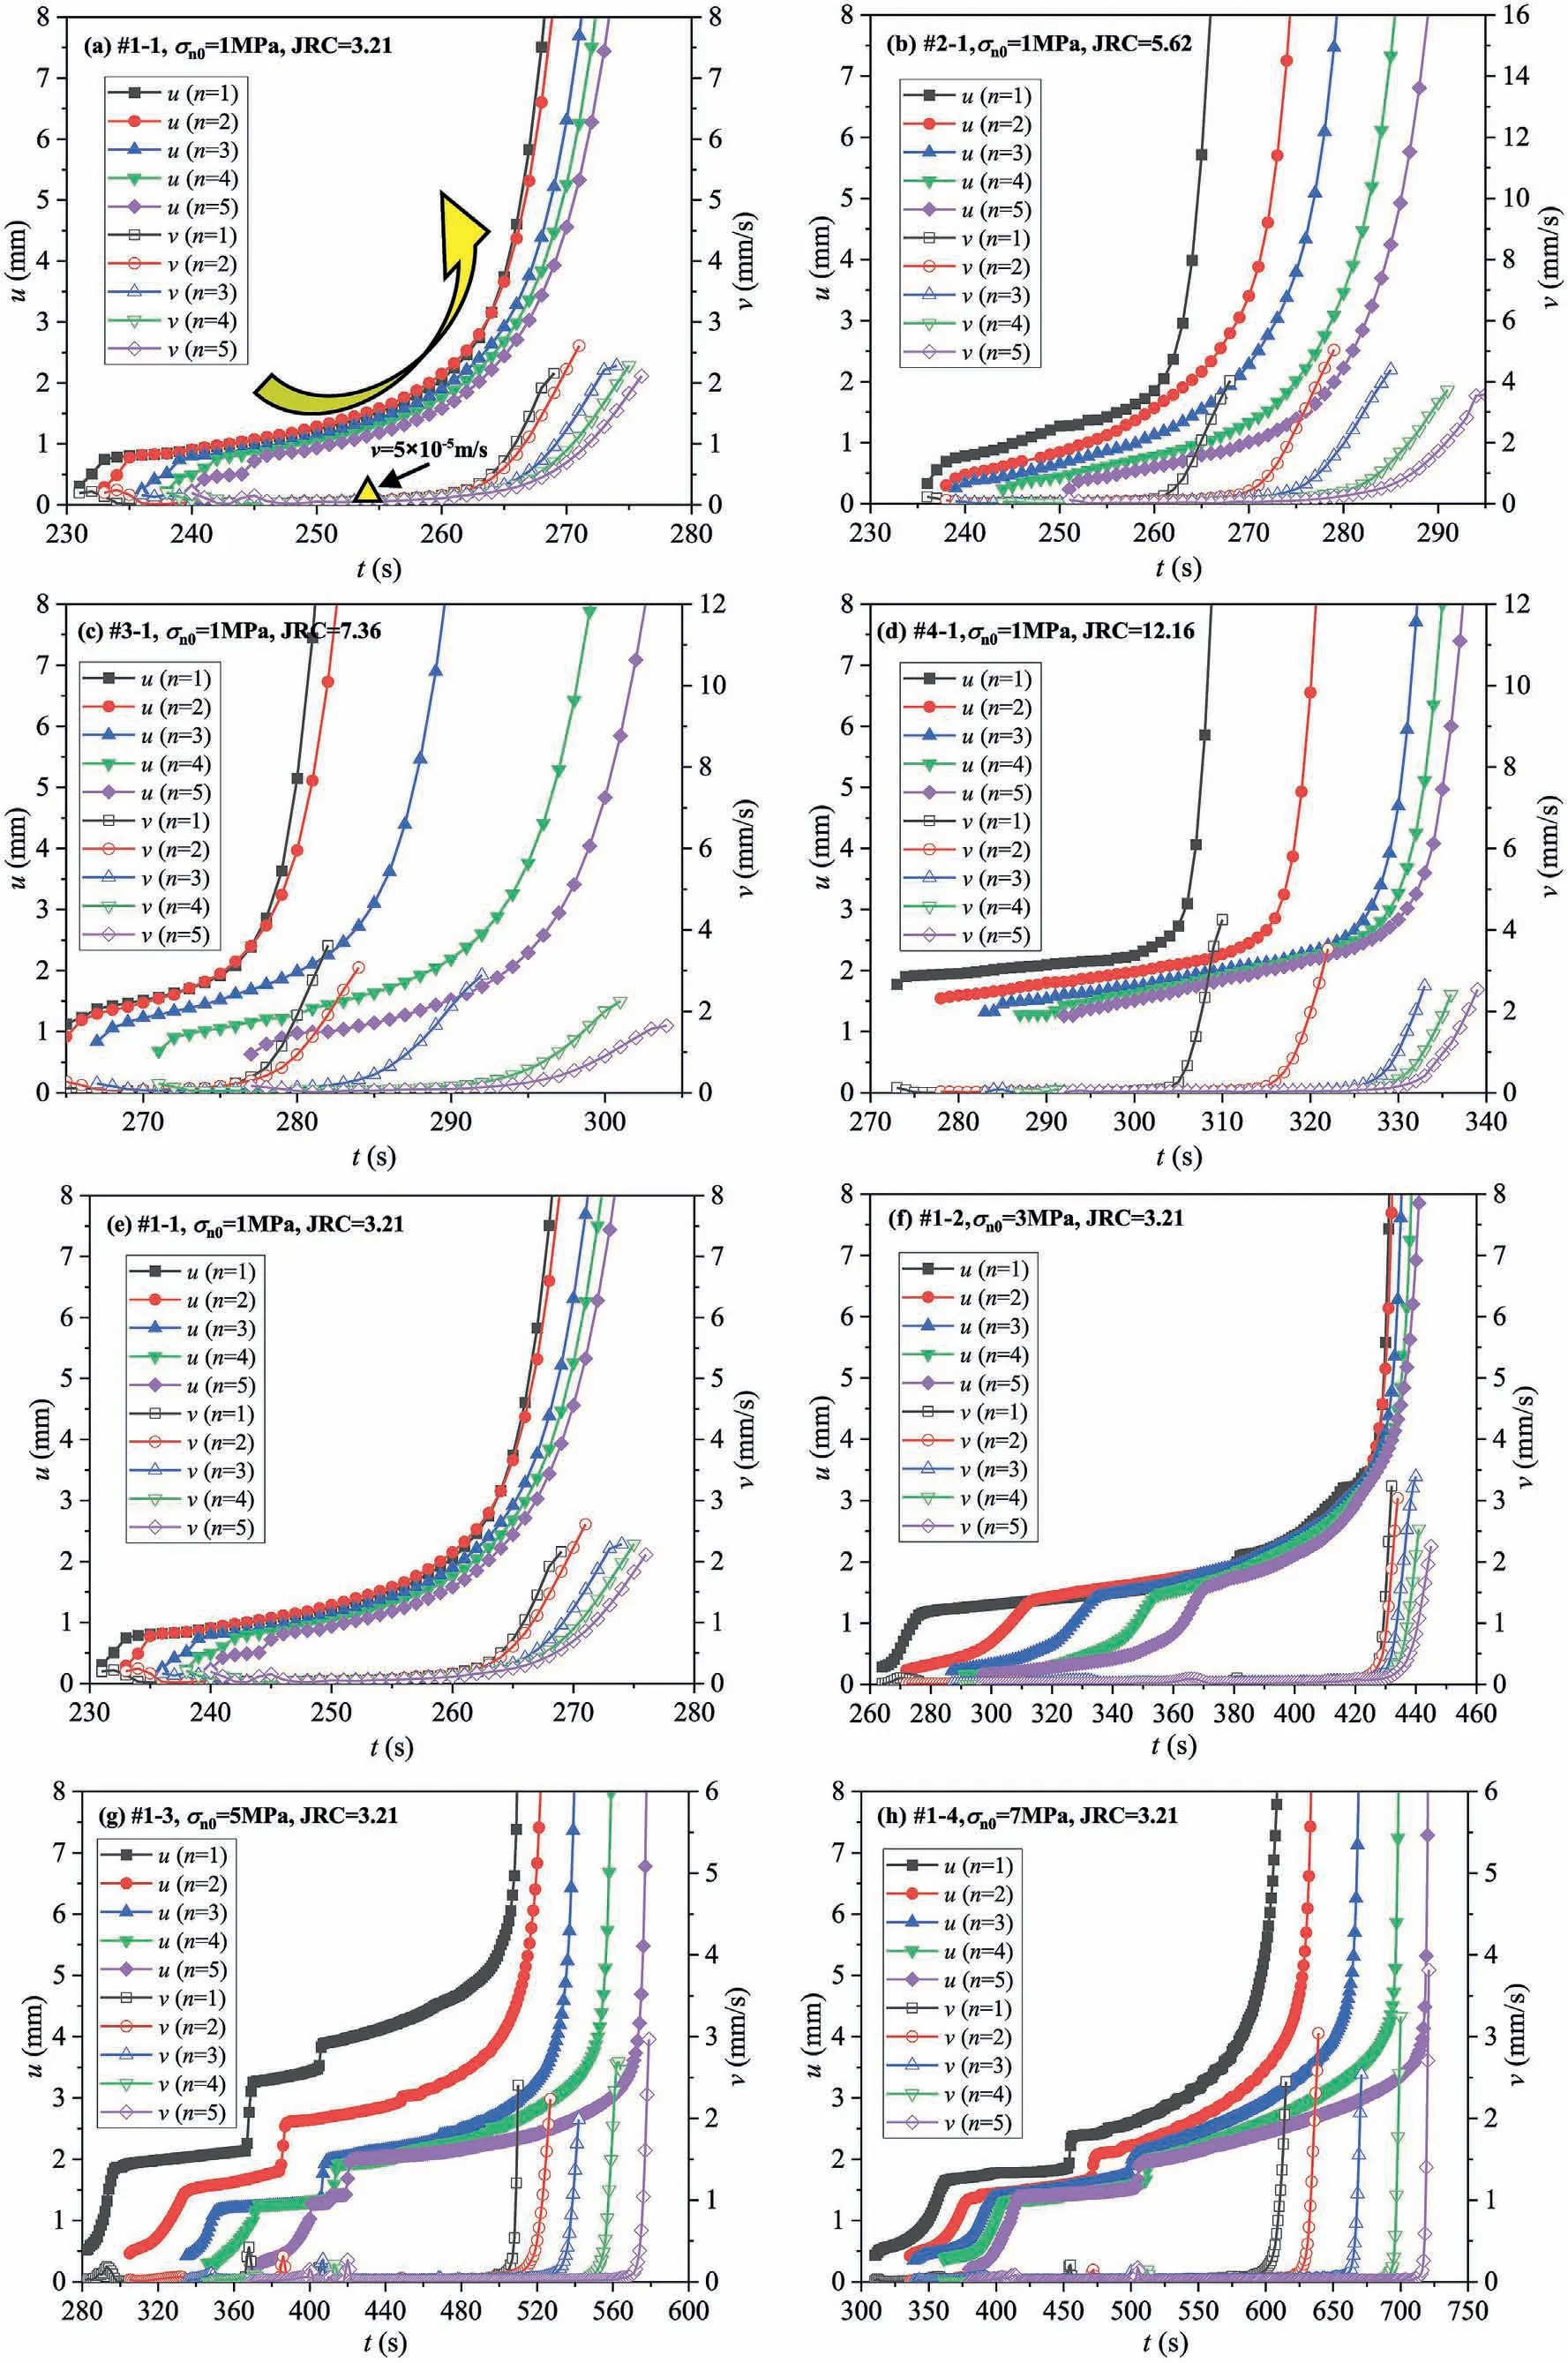
Fig.10.Evolution process of shear displacement and sliding velocity for the rough fracture surfaces from the sliding initiation point.
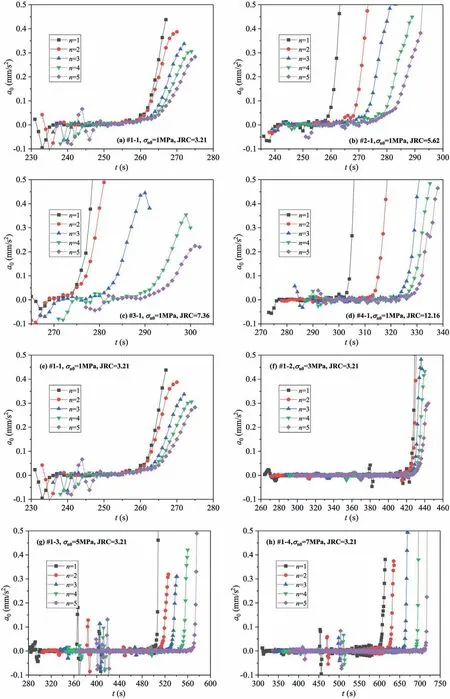
Fig.11.Evolution process of sliding acceleration for the rough fracture surfaces from the sliding initiation point.
From Fig.10, variations in v could be divided into two stages,including fluctuation around an extremely small value and then exponential increase.The slope of the exponential increase in v steepened with JRC while slowed down with n(Fig.10a-d),leading to an enhanced increase extent of v (the sliding acceleration a0)with JRC while a weakened increase extent of v with n,as shown in Fig.11a-d.In addition, for a given JRC, the increase extent of the sliding rate was enhanced with σn0(Fig.10e-h), resulting in an increasing sliding acceleration of the fracture surfaces(Fig.11e-h).
Generally, for a certain JRC, the threshold t value, from which v began to exponentially increase,showed an increase as n or σn0was increased.Several previous reports proposed a threshold v value of 5 10-5m/s to distinguish the “quasi-static” sliding (less than 5 10-5m/s)and“dynamic”sliding(larger than 5 10-5m/s)for fracture surfaces during the injection-induced shear tests(Nemoto et al., 2008; Ye and Ghassemi, 2018).Here, the critical v value of 5 10-5m/s was chosen to identify the sliding patterns,and from the shear sliding rate variation curves,the time tdcorresponding to v = 5 10-5m/s was obtained.Then, by defining the sliding resistance duration Δt as the time interval from unloading normal stress (tu) to td, the influences of JRC, σn0and n on the sliding resistance properties of fractures could be estimated (Fig.12).Δt showed an increase with σn0by a factor of 7.18-9.3 (JRC = 3.21),1.86-2.64 (JRC = 5.62), 3.08-5.81 (JRC = 7.36) and 5.09-8.4(JRC = 12.16), respectively.JRC produced a monotonic decreasing effect on Δt except for JRC=12.16,might due to the dominant role of critical asperities of surface #S4 on the sliding response.Δt fluctuated in a small range with n.
The evolution process of the normal displacement increment Δδnfor the fracture surfaces from the unloading stress point(tu)is shown in Fig.13.Here, Δδnwas defined as the dilatancy of the fractures minus the cumulative normal deformation induced by the early direct shear process before unloading.For t=tu-tsi,the rock fracture surfaces were stable with no sliding, and a slight increase in Δδncould be observed for all cases due to unloading normal stress rather than shear dilation.This time interval was shortened with both JRC(Fig.13a-d)and σn0(Fig.13e-h).The increase extent of Δδnat t = tu- tsiwas not obviously affected by n, but was enhanced with both JRC and σn0.The main reason might be as follows.Before t=tu,the fracture surfaces were compressed under the applied σn0.During t=tu-tsi,the normal stress drop Δσnof the fractures was increased with both JRC and σn0, leading to a relatively larger normal deformation recovery.This observation is based on the hyperbolic model denoting the relations between compression deformation and normal effective stress of the fractures proposed by Bandis et al.(1983) as follows:
where ΔVjis the closure of the fractures, Kn0is the initial normal stiffness of fractures,bm0is the initial fracture aperture under zero stress state, and σfneis the normal effective stress of the fractures.
After sliding initiation of the fractures, Δδnwas continuously increased due to climbing effects of the surface asperities,and the shear dilation phenomenon was enhanced with JRC.As the sliding pattern was transferred to “dynamic” sliding at t = td, a dramatic increase extent of Δδncould be observed.The time interval(tu-tsi)generally showed an increase with both JRC and σn0.For a given fracture surface,as n was increased,the Δδnvariation curves shifted downwards due to the gradually smoother fracture surface after cyclic shearing, and the increase extent of Δδnfor t = tsi- tdwas reduced.However, the increase extent of Δδnwas generally increased with σn0due to the further increased normal stress drop.Then, the normal displacement experienced a sudden increase soon after tduntil failure of the fracture surfaces after continuous shear wear induced by a large shear displacement.The shear dilation for the fracture surfaces at t = tdwas presented in Fig.14,which generally indicated an increasing variation trend with both JRC and σn0, while a relatively decreasing variation with n.
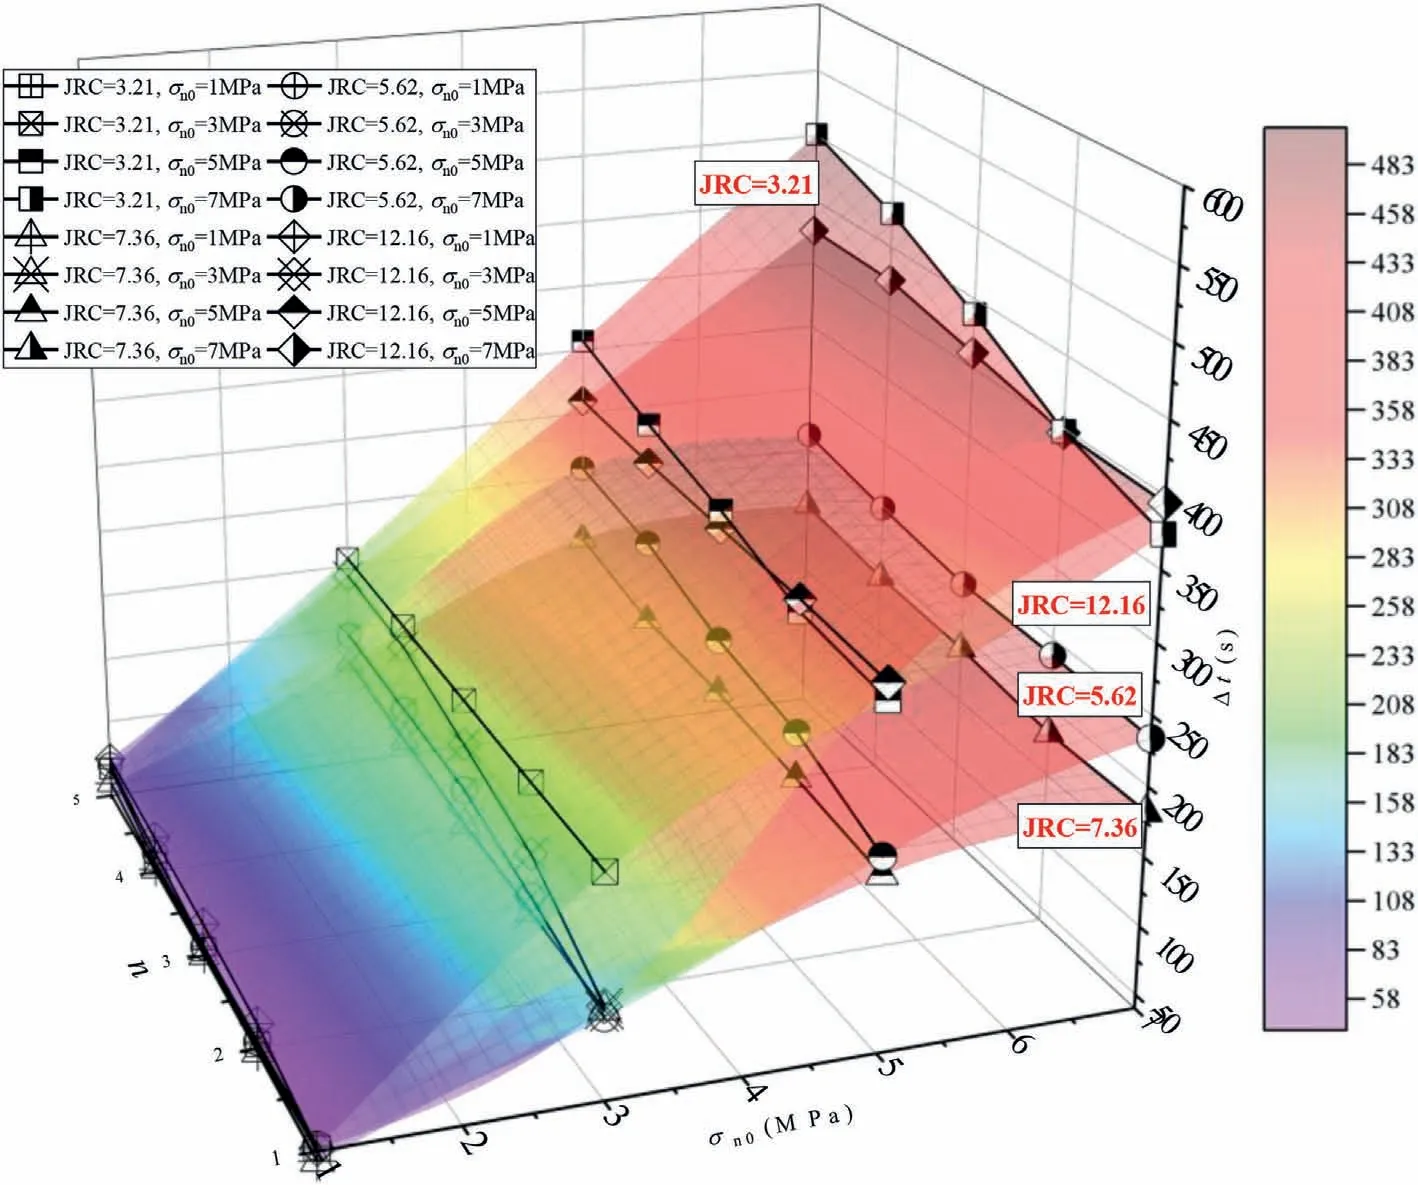
Fig.12.Variations in sliding resistance duration Δt from unloading point of normal stress.
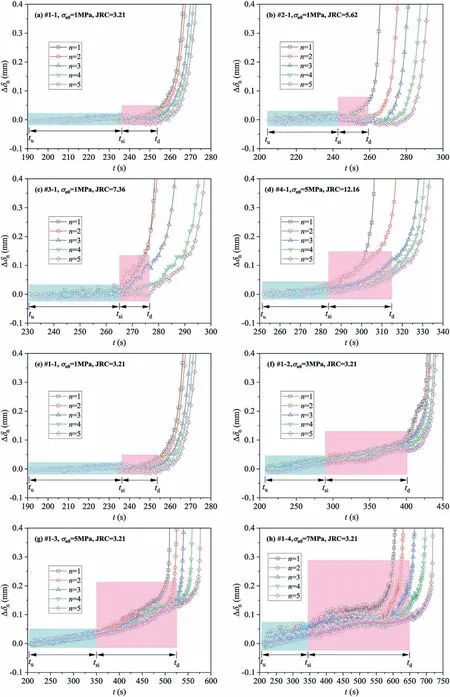
Fig.13.Evolution process of the normal displacement increment Δδn from the unloading normal stress point.
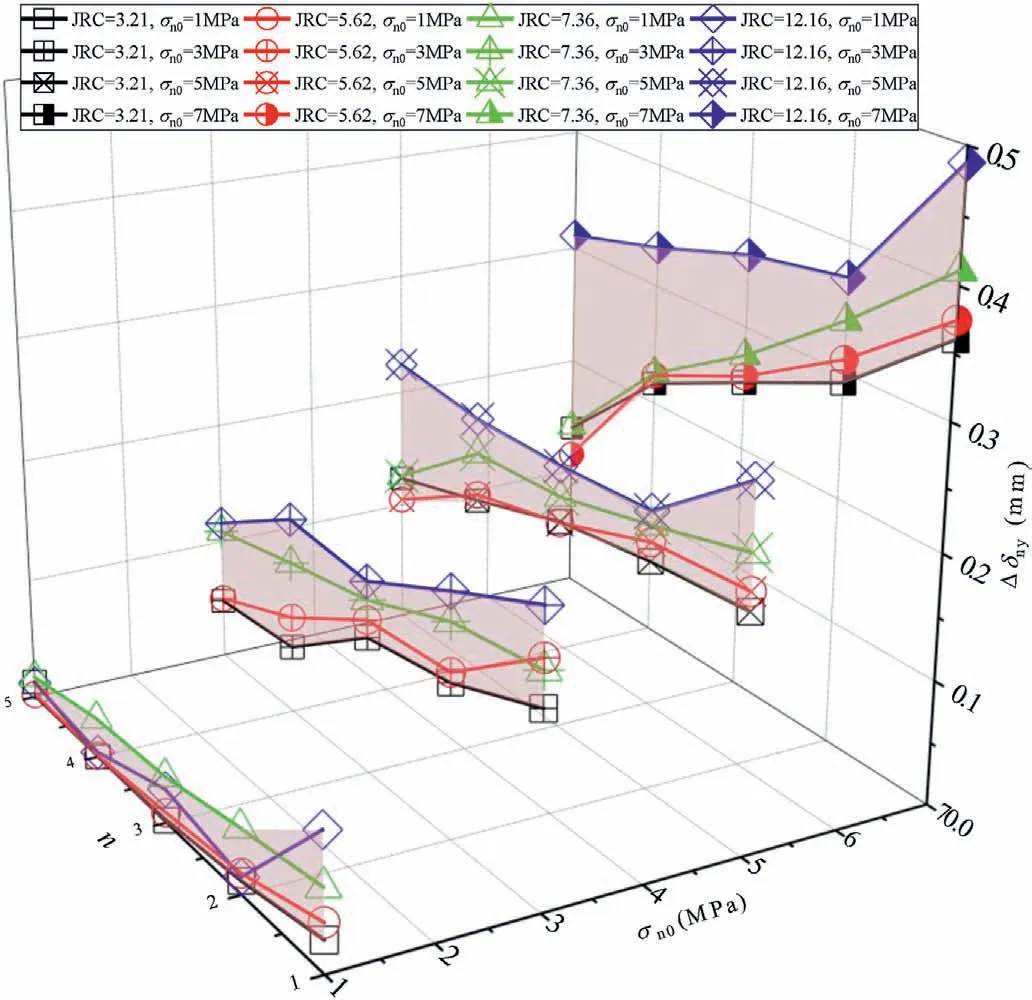
Fig.14.Changes in the shear dilation for the fracture surfaces at the“dynamic”sliding point.
Furthermore, the climbing effects (shearing dilation) of rough rock fractures are shearing velocity dependent.From the variations for sliding velocity in Fig.10 and normal displacement increment in Fig.13,the changes in Δδnas a function of v for the rough fractures from tsiwere evaluated, as shown in Fig.15.Here, test cases for σn0=1 MPa regarding various JRC and n (Fig.15a) and JRC = 3.21 regarding various σn0and n (Fig.15b) were taken as examples.Generally, the fractures experienced a gradually significant shear dilation when subjected to an increasing shear sliding velocity,which is consistent with some previous studies (Segall and Rice,1995; Samuelson et al., 2009; Fang et al., 2017).It is due to the fact that, during shearing of sandstone fractures,the strong brittle minerals for surface asperities were difficult to be crushed into finer particles, resulting in a positive correlation between dilation and the shear sliding velocity(Fang et al., 2017).
Fig.16a shows the shear failure characteristics of the rough rock fractures after shearing, indicating basically consistent main shear wear characteristics for both upper and lower fracture surfaces for σn0= 1-7 MPa, but the wear areas exhibited a gradual increase with an increasing σn0.In addition, a larger σn0would result in fracturing failure at the boundary position of samples, and several secondary cracks and shear crushing zones were initiated,resulting in intensified damage degree of the fracture surfaces.Using a selfdeveloped MATLAB image processing procedure,binary treatment of the surface wear behaviors after shearing was conducted(Fig.16b).Through setting a threshold, shear wear areas and the remaining parts without failure on the surfaces were defined as white and black,respectively.The binary calculation results agreed well with the actual shear failure behaviors.Fig.16b presents changes in the average ratio η of shear areas for both upper and lower surfaces to the total projected fracture surface areas.In the σn0range of 1-7 MPa, η increased by 45.24%-91.02%, and an increasing JRC generally aggravated the shearing failure degree of the fractures.
4.Conclusions
In the present study, a series of fractured sandstone samples containing self-affine 3D rough joint surfaces (JRC = 3.21-12.16)was copied and used to perform the shear sliding tests under unloading normal stress with respect to various initial normal stresses(1-7 MPa)and numbers of shearing cycles(1-5).Based on the experimental results, sliding initiation responses, sliding resistance capacity, shear sliding rate, normal dilatancy and shear wear behaviors of the rough joint surfaces were investigated.The main conclusions are drawn as follows:
(1) As the number of shear cycles increased, variation curves of shear stress shifted downwards.The fracture surfaces became smoother, leading to gradually reduced peak shear stress.However, the shear resistance capacity of fractures showed an increase with both JRC and initial normal stress.The initial normal stress-shear strength relations agreed well with the theoretical results obtained using the Barton-Bandis failure criterion.The joint friction angle of fractures exponentially increased by 62.22%-64.87% with JRC but linearly decreased by 22.1%-24.85% with the number of shearing cycles.As the normal stress was unloaded to the strength envelope of the fractured rock samples, shear sliding initiation occurred, resulting in shear wear failure of the rough fracture surfaces.
(2) The sliding initiation time increased with both JRC and the initial normal stress due to more tortuous fracture surface morphologies and enhanced shear deformation resistance ability.As the number of shearing cycles increased, due to more remarkable reduction extent for the sliding initiation shear stress (16.71%-44.91%) over that for sliding initiation normal stress(3.61%-23.29%),the SRI of fractures decreased by 4.35%-32.02%.The SRI increased by a factor of 0.41-1.64 with JRC but reduced by 21.7%-49.7% with initial normal stress.
(3) After sliding initiation,the shear displacement increased as a power function.The sliding initiation shear displacement of the fractures increased with JRC due to more tortuous fracture surfaces but reduced with the number of shear cycles due to progressively flattened surface morphologies.The sliding rate was divided into two stages of fluctuation around a small value and exponential increase.The exponential increase of sliding acceleration steepened with JRC while slowed down with shearing cycles.Through defining a critical sliding rate of 5 10-5m/s,“quasi-static”and“dynamic”sliding of rock fractures were identified, and the sliding resistance duration increased with the initial normal stress while generally decreased with JRC.
(4) A slight normal displacement induced by unloading normal stress before shear sliding was observed.The normal displacement increment was enhanced with the initial normal stress due to a relatively larger normal deformation recovery caused by an increasing normal stress drop.After sliding initiation,the normal displacement was continuously increased due to effects of uphill surface asperities, and the dilatancy was enhanced with JRC.Then, the normal displacement showed a sudden increase after “dynamic”sliding until failure.The shear wear patterns of the fractures were consistent for a certain JRC, and a large initial normal stress resulted in a more intensified damage degree and an increased ratio of shear areas by 45.24%-91.02% for the fracture surfaces.
The findings in this study could supply specific useful references for prediction and effective control of shear slipping deformation in surrounding rock mass.However, underground projects usually contained rich flowing water.Further understanding of hydromechanical coupling characteristics during fracture shearing,wettinginduced deterioration of rock joints, and injection-driven shearing reactivation of fractured rocks is essential to determining the longterm stability for rock projects, which is the top priority in our future study.
Data availability statement
All data used during this study are available from the corresponding author by request.
Declaration of competing interest
The authors declare that they have no known competing financial interests or personal relationships that could have appeared to influence the work reported in this paper.
Acknowledgments
The financial support from the National Natural Science Foundation of China (Grant Nos.52174092 and 52104125) and the Fundamental Research Funds for the Central Universities, China(Grant No.2022YCPY0202) is gratefully acknowledged.
 Journal of Rock Mechanics and Geotechnical Engineering2023年10期
- Journal of Rock Mechanics and Geotechnical Engineering的其它文章
- Analytical solutions for the restraint effect of isolation piles against tunneling-induced vertical ground displacements
- Characterizing large-scale weak interlayer shear zones using conditional random field theory
- Displacement-based back analysis of mitigating the effects of displacement loss in underground engineering
- Investigation of long-wavelength elastic wave propagation through wet bentonite-filled rock joints
- Mechanical properties of a clay soil reinforced with rice husk under drained and undrained conditions
- Evaluation of soil fabric using elastic waves during load-unload
