A true triaxial strength criterion for rocks by gene expression programming
Jin Zhou, Rui Zhng, Yingui Qiu, Mnoj Khndelwl
a School of Resources and Safety Engineering, Central South University, Changsha, 410083, China
b Institute of Innovation, Science and Sustainability, Federation University Australia, Ballarat, VIC, 3350, Australia
Keywords:
ABSTRACT Rock strength is a crucial factor to consider when designing and constructing underground projects.This study utilizes a gene expression programming (GEP) algorithm-based model to predict the true triaxial strength of rocks, taking into account the influence of rock genesis on their mechanical behavior during the model building process.A true triaxial strength criterion based on the GEP model for igneous,metamorphic and magmatic rocks was obtained by training the model using collected data.Compared to the modified Weibols-Cook criterion, the modified Mohr-Coulomb criterion, and the modified Lade criterion, the strength criterion based on the GEP model exhibits superior prediction accuracy performance.The strength criterion based on the GEP model has better performance in R2,RMSE and MAPE for the data set used in this study.Furthermore, the strength criterion based on the GEP model shows greater stability in predicting the true triaxial strength of rocks across different types.Compared to the existing strength criterion based on the genetic programming (GP) model, the proposed criterion based on GEP model achieves more accurate predictions of the variation of true triaxial strength (σ1) with intermediate principal stress(σ2).Finally,based on the Sobol sensitivity analysis technique,the effects of the parameters of the three obtained strength criteria on the true triaxial strength of the rock are analysed.In general, the proposed strength criterion exhibits superior performance in terms of both accuracy and stability of prediction results.
1.Introduction
During the design process of underground works such as tunnels and shafts, rock strength is a crucial factor that requires significant consideration, particularly in deeper areas (Hoek and Brown, 1980; Haimson, 2006; Li et al., 2015; Wang et al., 2021;Du et al., 2022a, 2022b; Xie et al., 2022).As the depth of the underground excavation increases,the stress in the surrounding rock gradually increases.When the stress in the surrounding rock approaches or exceeds the rock strength, the rock is susceptible to failure if appropriate support or pressure relief measures are not implemented (Zhang et al.,2019; Wang et al.,2020).Therefore, an effective means of rock strength prediction is an important guarantee for the rational design of underground engineering.
The most conventional and widely used means for rock strength prediction are various types of theoretical and empirical rock strength criteria.With the development of geomechanics, many researchers have conducted in-depth studies on the damage behaviour of rocks.Through various theoretical analyses and experimental practices,a wide variety of rock strength criteria have been proposed,such as the Mohr-Coulomb criterion(Jiang and Xie,2011),Drucker-Prager damage criterion(Drucker and Prager,1952),unified strength criterion(Yu et al.,2002),Mogi empirical strength criterion (Mogi, 1967, 1971), Griffith damage criterion (Griffith,1921), extended Griffith damage criterion (McClintock and Walsh,1962), Bieniawski-Yudbir criterion (Bieniawski, 1974), Hoek-Brown criterion (Hoek and Brown,1980), the Wiebols-Cook criterion(Wiebols and Cook,1968),the modified Weibols-Cook(MWC)criterion (Zhou, 1994), the Lade-Duncan criterion (Lade and Duncan, 1975), the modified Lade (ML) criterion (Ewy, 1999), the Mogi-Coulomb criterion(Singh et al.,2011),the three-dimensional(3D) version of the Hoek-Brown criterion (Zhang and Zhu, 2007),the modified Mohr-Coulomb (MMC) criterion (Zhang et al., 2010),the Rafiai criterion (Rafiai, 2011), the modified Hoek-Brown criterion (Zhang et al., 2013), and the true-triaxial exponent criterion (Zhang et al., 2018).
The conventional rock strength criterion has several limitations.Firstly,they are often not applicable to all types of rocks and stress states.Secondly,determination of the parameters for these criteria is complicated, and the methods of obtaining them are not well established, leading to subjective parameter values.If the parameters are obtained by fitting true triaxial test data of the same types of rocks, an additional true triaxial test is required, which is not conducive to practical applications due to the numerous processes involved.However,to overcome these limitations,researchers have explored alternative means for rock strength prediction,which are various machine learning algorithm-based rock strength prediction models.
With the continuous development of computing technology,various machine learning algorithms provide new means to analyse complex engineering problems (Faradonbeh et al., 2016;Armaghani et al., 2018; Xie et al., 2021; Li et al., 2021; Yong et al.,2021; Chen et al., 2023), and also provide a new way of thinking for rock strength prediction.For example, Moshrefi et al.(2018)developed a strength prediction model for shale based on artificial neural network (ANN) with intermediate and minimum principal stresses at shale failure as input and maximum principal stress as output.The developed ANN model showed a better accuracy compared to other models such as the support vector machine(SVM),multiple linear regression(MLR),and various rock strength criteria such as the Drucker-Prager and Mogi-Coulomb criteria.Moreover, the model was applied to determining the shale formation breakpoints in the Gachsaran oil field in southwestern Iran.Yu et al.(2022)developed an optimized genetic programming(GP)model for predicting the true triaxial strength of rocks.Through training data on sandstone, shale, granite, limestone and trachyte,the corresponding strength model for each rock type was obtained.By comparing the statistical evaluation indices such as the sum of absolute errors, the mean value, the a10 index and the regression coefficient of determination, the results indicated that the prediction results of the established optimized GP model were more accurate than those of the multiple regression analysis.Fathipour-Azar (2022) developed nine different machine learning models based on six machine learning algorithms, including MLR, SVM,random forest (RF), extreme gradient boosting (XGBoost), K-nearest neighbours, and multivariate adaptive regression splines(MARS) methods, for predicting true triaxial rock strength.The training data set was used to train these models, and seven of the nine prediction models performed excellently on quantitative indices such as coefficient of determination(R2),root mean square error (RMSE), and absolute average relative error percentage(AAREP) when tested with the test data set.The XGBoost-based algorithm model performed best among the seven models.Additionally, these seven machine learning models outperformed the existing strength criteria including the Drucker-Prager criterion,Mogi-Coulomb criterion,and MWC criterion in terms of prediction accuracy.
Limited by the characteristics of the algorithms used,the models obtained in existing studies often struggle to find a good balance between prediction performance and interpretability.For example,among the nine models developed by Fathipour-Azar (2022), the only MLR model that was able to generate interpretable model expressions performed poorly in terms of prediction performance.The equivalent Mohr-Coulomb expressions that Rafiai et al.(2013)and Zhu et al.(2015)translated their established machine learning models with good prediction performance into are still too complex in form compared to existing strength criteria.This complexity hinders the practical application of these models.The issue of achieving good prediction accuracy while also making the model easy to use has become a crucial issue in rock strength prediction research.The advent of gene expression programming (GEP) provides a solution to this challenge.
GEP was proposed by Ferreira (2001), and it evolved from genetic algorithm(GA)and GP,inheriting the advantages of both.GEP solves complex nonlinear problems by simple coding and produces mathematical expressions of models (Faradonbeh et al., 2016).Therefore, it has been widely used by researchers in various geoengineering fields.For example, Ince et al.(2019) applied the GEP algorithm to the prediction of the uniaxial compressive strength(UCS) of volcanic clastic rocks and obtained a mathematical formulation and achieved higher prediction accuracy compared to the MLR models.Afrasiabian and Eftekhari (2022) established a rock mode I fracture toughness prediction model based on the GEP algorithm.By training with different input parameters,the outputs of seven GEP models with different parameter compositions were obtained.The best-performing model was selected by comparing prediction indices and then compared with an established MLR model.The results of the comparison indicated that the GEP model outperformed the MLR model in terms of prediction accuracy,demonstrating the effectiveness of the GEP algorithm in this application.Zhou et al.(2021a) developed a peak particle velocity prediction model for blasting based on the GEP algorithm.By evaluating the effective parameters of the GEP model, the best model with mathematical relationships was obtained.The results showed that the model can accurately predict the peak particle velocity, which provides a guarantee for the determination of the blasting safety zone.Armaghani et al.(2018)proposed a new model for predicting the settlement of embedded rock piles based on GEP.The results showed that for the model based on the GEP algorithm outperforms the model using the MLR techniques in all three quantitative analysis metrics used,both on the training and testing data sets.
The previous studies on predicting rock strength using machine learning algorithms have another drawback in that they did not consider the similarities and differences in mechanical properties among various rocks.For example,the model obtained by Moshrefi et al.(2018)is only for shale.Fathipour-Azar(2022)used input data from 29 rocks without classifying them during the model training process.Although Fathipour-Azar considered the UCS of each rock,it is clear that relying solely on UCS to distinguish the mechanical characteristics of different rocks is insufficient.Rock structure,mineral species and grain size have been proven to have a significant impact on the mechanical characteristics of rocks(Askaripour et al., 2022).The rock genesis affects the rock structure, mineral species and grain size (Hunter, 1996).Thus, considering the rock genesis allows for further classification of rock mechanical characteristics without the need for additional measurement parameters.
In this study, the effect of genesis on the mechanical characteristics of rocks is considered, and a GEP-based true triaxial strength prediction model for three different genetic rocks is developed.The model predicts the true triaxial strength(maximum principal stress,σ1)based on the intermediate principal stress(σ2),minimum principal stress (σ3), and UCS (σc) data.The true triaxial test data of 29 different rocks are collected from existing literature and randomly divided them into a training data set (70% of the data)and a testing data set(30%of the data).The training data set is used to train the model and fit the parameters of the existing strength criterion.Evaluation metrics such as R2, RMSE and mean absolute percentage error (MAPE) are selected to compare the model’s accuracy with the existing strength criteria on the training and testing data sets.The prediction performance of the model developed in this paper is also compared with the existing GP model in the σ1-σ2plane.The outliers in the model prediction results are analysed from the perspective of the mechanism of the effect of intermediate principal stress on rock strength.Finally,the effects of the three model input parameters on the output are analysed by Sobol sensitivity analysis.
2.GEP
GEP is a new GA based on genotypes and expressions proposed by Ferreira(2001).Like GA and GP,it mimics the natural selection of populations by natural ecology and the operations of inheritance and mutation among individuals in populations (Laskar and Majumder, 2017; Lawal et al., 2021; Onifade et al., 2021).It uses fitness to select individuals in populations and uses one or more genetic operators to inherit and mutate the selected individuals to generate new populations and achieve the evolution of populations.
In GEP,a single gene is composed of a fixed-length linear string of symbols,structured into a head and a tail.The head symbol can be selected from the set of function symbols and the set of terminal symbols, and the tail symbol can only be selected from the set of terminal symbols (Oltean and Grosan, 2003).The structure of the gene plays a crucial role in ensuring the compatibility of the gene and the chromosome,which guarantees the stable operation of the GEP program, even after undergoing a series of genetic manipulations.Individuals in a population (also called chromosomes or genomes)consist of one or more genes,which are connected to each other by the linking function.The chromosomes are compiled in the Karva language and can be expressed as nonlinear entities of different sizes and forms,i.e.expression trees(ETs)(Ferreira,2001).The detailed transformation is shown in Fig.1.
The basic GEP algorithm involves four basic steps,i.e.creating an initial randomized overall, executing the GEP procedure, verifying the termination conditions and generating a subsequent overall or final optimal solution in the form of a simple mathematical expression.The details are shown in Fig.2.During the four steps,the training data set is only used to evaluate the model’s fitness in the validation termination condition.Firstly, the population’s individuals (chromosomes) are transformed into mathematical expressions using the Karva language.Then,for each set of data in the training data set, the input values are substituted into the expression to obtain the corresponding output values.The predicted values are compared to the actual values using the fitness function to obtain the corresponding fitness value of an individual.
3.Rock strength criterion
This section provides a brief overview of three existing rock strength criteria that were used for comparison in the study.These criteria include the MWC criterion,the ML criterion,and the MMC criterion.
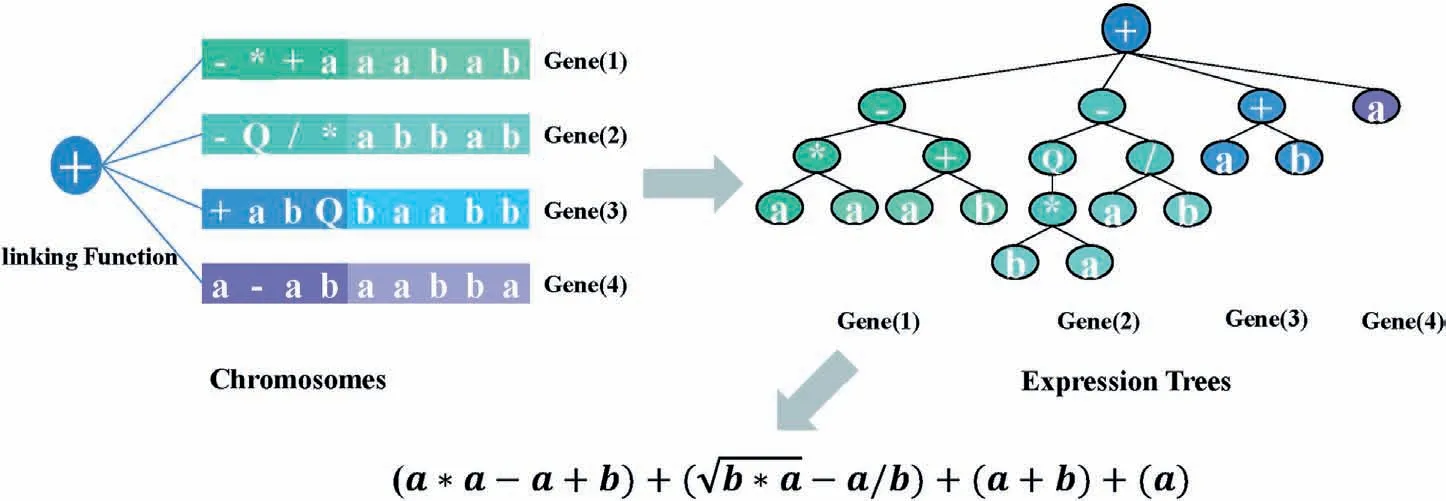
Fig.1.Transformation relationships between chromosomes, ETs, and mathematical expressions.
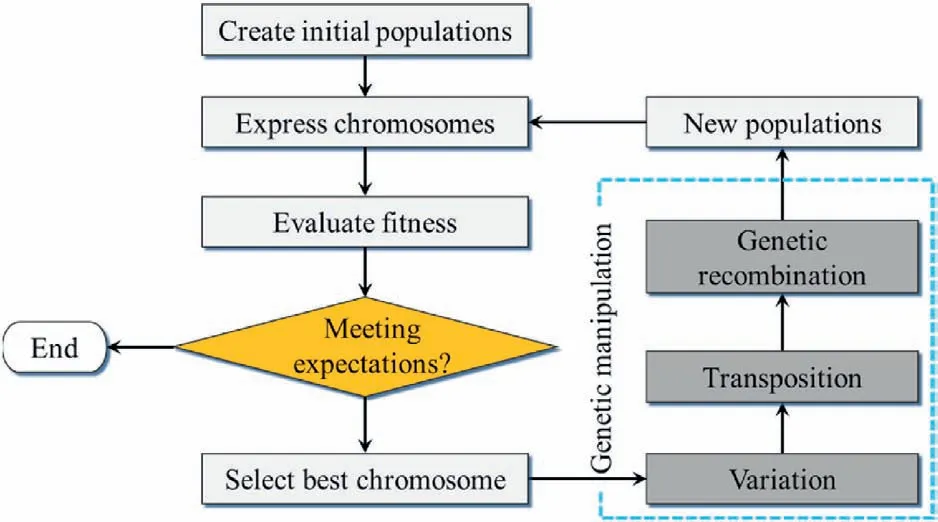
Fig.2.The flowchart of GEP algorithm.
3.1.MWC criterion
Zhou (1994) modified the extended von Mises theory (also known as the Drucker-Prager criterion)again based on the Griffith microcracking theory and proposed a strength criterion similar to the Weibols-Cook criterion but simpler, which takes the following form:
where J1represents the average effective surrounding pressure;and the parameters A, B and C are the constants related to rock cohesion c and rock internal friction angle ϕ, which can be determined by the following equations:
3.2.ML criterion
The ML criterion is derived from Ewy’s modification of the Lade-Duncan criterion, which is more accurate in predicting the true triaxial strength of rocks than the Mohr-Coulomb criterion because it takes into account the effect of intermediate principal stresses.Meanwhile, the ML criterion is not as extreme as the Drucker-Prager criterion in consideration of the effect of intermediate principal stresses on the true triaxial strength (Ewy, 1999).The specific form of the criterion is as follows:
where S and η are the coefficients related to the rock cohesion c and the angle of internal friction ϕ, respectively, and can be written as
3.3.MMC criterion
Singh et al.(2011) obtained a new nonlinear strength criterion for intact rocks, called the MMC criterion, by introducing Barton’s concept of the critical state of rocks based on the conventional Mohr-Coulomb criterion.The constitutive parameters of this strength criterion are consistent with the conventional Mohr-Coulomb criterion, and the effect of intermediate principal stress on strength is considered.The form of the criterion is as follows:
When multiple rock triaxial experimental data are available,the following equations can be used to obtain sinϕi0:
4.True triaxial test data
The quantity and quality of rock true triaxial strength test data affect the prediction accuracy and generalisability of rock strength models based on machine learning.In this study,a large amount of rock true triaxial test data was collected from the existing literature,and a data set with a variety of rock true triaxial test data was established.The data set includes the maximum principal stress σ1,the intermediate principal stress σ2, the minimum principal stress σ3and the UCS σcof the rock at failure during the true triaxial test.
Fig.3 shows the distribution of data with respect to the correlation between the variables.From Fig.3, it can be seen that the correlations between variables differ between the three rock types:igneous, sedimentary and metamorphic rocks.The correlations between σ1and σ2are more different from those between σ1and σ3for the igneous and metamorphic rocks, while the correlations between σ1and σ2are closer to those between σ1and σ3for the sedimentary rocks.Furthermore, the correlations between σ1and σcalso differ among the three types of rocks.
The Welch test is a test of whether the mean values of the groups are equal by using statistics from the Welch distribution(Patil,2021).The Welch distribution is similar to the F distribution and does not require homogeneity of variances.Therefore, when the distribution of the dependent variable does not meet the requirement of variance chi-square, the Welch test is more robust than the analysis of variance.The Games-Howell test is a post hoc one-way analysis of variance(ANOVA)with unequal variances and unequal group sizes based on Welch’s correction for degrees of freedom by t-test and studentized range statistics (Zhou et al.,2022b).As shown in Fig.4, σ1(p = 4 ×10-42<0.001, CI95%[0.42,1]), σ2(p = 2.58 × 10⁻⁹< 0.001, CI95%[0.06, 1]), σ3(p = 6.15 × 10⁻¹⁰< 0.001, CI95%[0.07, 1]) and σc(p=9.25×10-36<0.001,CI95%[0.27,1])were significantly affected by rock type.Meanwhile, σ1was present in samples of different types of rocks and there were statistically significant differences(FWelch(2,278.97)=136.78,p <0.001).This was also shown for σ2(FWelch(2,318.3)=21.06,p <0.001),σ3(FWelch(2,303.21)=22.76,p <0.0011), and σc(FWelch(2, 388.26) = 100.01, p <0.001).From this, it is clear that rocks with different geneses have different strength characteristics under true triaxial stress.
To ensure the accuracy and reliability of the developed model,the data set was randomly divided into a training data set (70% of the data)and a testing data set(30%of the data).The training data set was used to train the model and fit the parameters of the existing strength criterion, while the testing data set was used to evaluate the generalisation ability of the model.By using a large and diverse data set and a rigorous data splitting approach, the developed model is expected to have a better prediction performance and wider applicability in practical engineering problems.Table 1 shows the statistical description of variables in the training and testing data sets.
5.Parameter fitting of the conventional intensity criterion
In order to compare the prediction performance of the GEP model with the existing conventional triaxial strength criteria,the parameter settings of the conventional true triaxial strength criteria for different rocks need to be determined.To obtain the parameters required by the conventional strength criteria for different rocks, data fitting was used in this study.This is because the true triaxial test data of the rocks used were mostly documented in the source literature as only the stress data and UCS of the rocks at the time of damage.Therefore,it is unable to calculate the cohesion and internal friction angle of the rock to obtain the parameters required by the conventional strength criteria.By using data fitting techniques, it is possible to determine the parameter settings that best fit the strength data for the conventional strength criteria(Rafiai et al.,2013;Rukhaiyar and Samadhiya,2017a;Wang et al., 2022).The training data set which was used for GEP model training is used to fit the parameters in the three strength criteria,i.e.ML,MWC and MMC.The final obtained parameters of the three conventional rock strength criteria for each type of rock in the data set are shown in Table 2.
6.Comparative analysis metrics
The correlation coefficient (R2), RMSE and MAPE were selected as the evaluation indices of the prediction performance of the established GEP model and the conventional strength criterion.These three metrics are frequently used in model evaluation(Zhou et al., 2021b, 2021c).The correlation coefficient can reflect the correlation between the predicted value of the strength criterion and the actual value of the true triaxial strength of the rock.The closer the value of R2is to 1, the better the strength criterion predicts the true triaxial test data of the rock, and the closer the predicted rock strength is to the true strength of the rock.The correlation coefficient R2is calculated as follows:
where yidenotes the actual value,y denotes the mean of the actual value,fidenotes the predicted value,and f denotes the mean of the predicted value.
RMSE reflects the standard deviation of the fitting error between the predicted and actual values (Zhou et al., 2022a).The closer the RMSE is to 0, the higher the prediction accuracy of the model.RMSE is written by
MAPE depends on the magnitude and error of the predicted values, thus the size of the data does not affect MAPE.MAPE is written by
7.Model training and comparison
7.1.Parameter setting
In this study, the GEP model takes σ2, σ3and σcas input parameters and σ1as the output parameter.The final model results can be expressed by the following equation:
The function symbol set of GEP model is set to{+,-,/,*,Q,sin,cos,tan,e,pow,atan,asin,acos}(Q denotes open root,pow denotes subdivision, atan denotes the arctangent function arctan, asin denotes the arcsine function arcsin, and acos denotes the inverse cosine function arccos).In addition,the main parameters of the GEP model include the number of evolutionary generations,the number of populations, the number of chromosomal genes, the linking function,the gene head length,the probability of transposition,and the probability of recombination.After several adjustments, the final settings of each parameter are determined, as shown in Table 3.
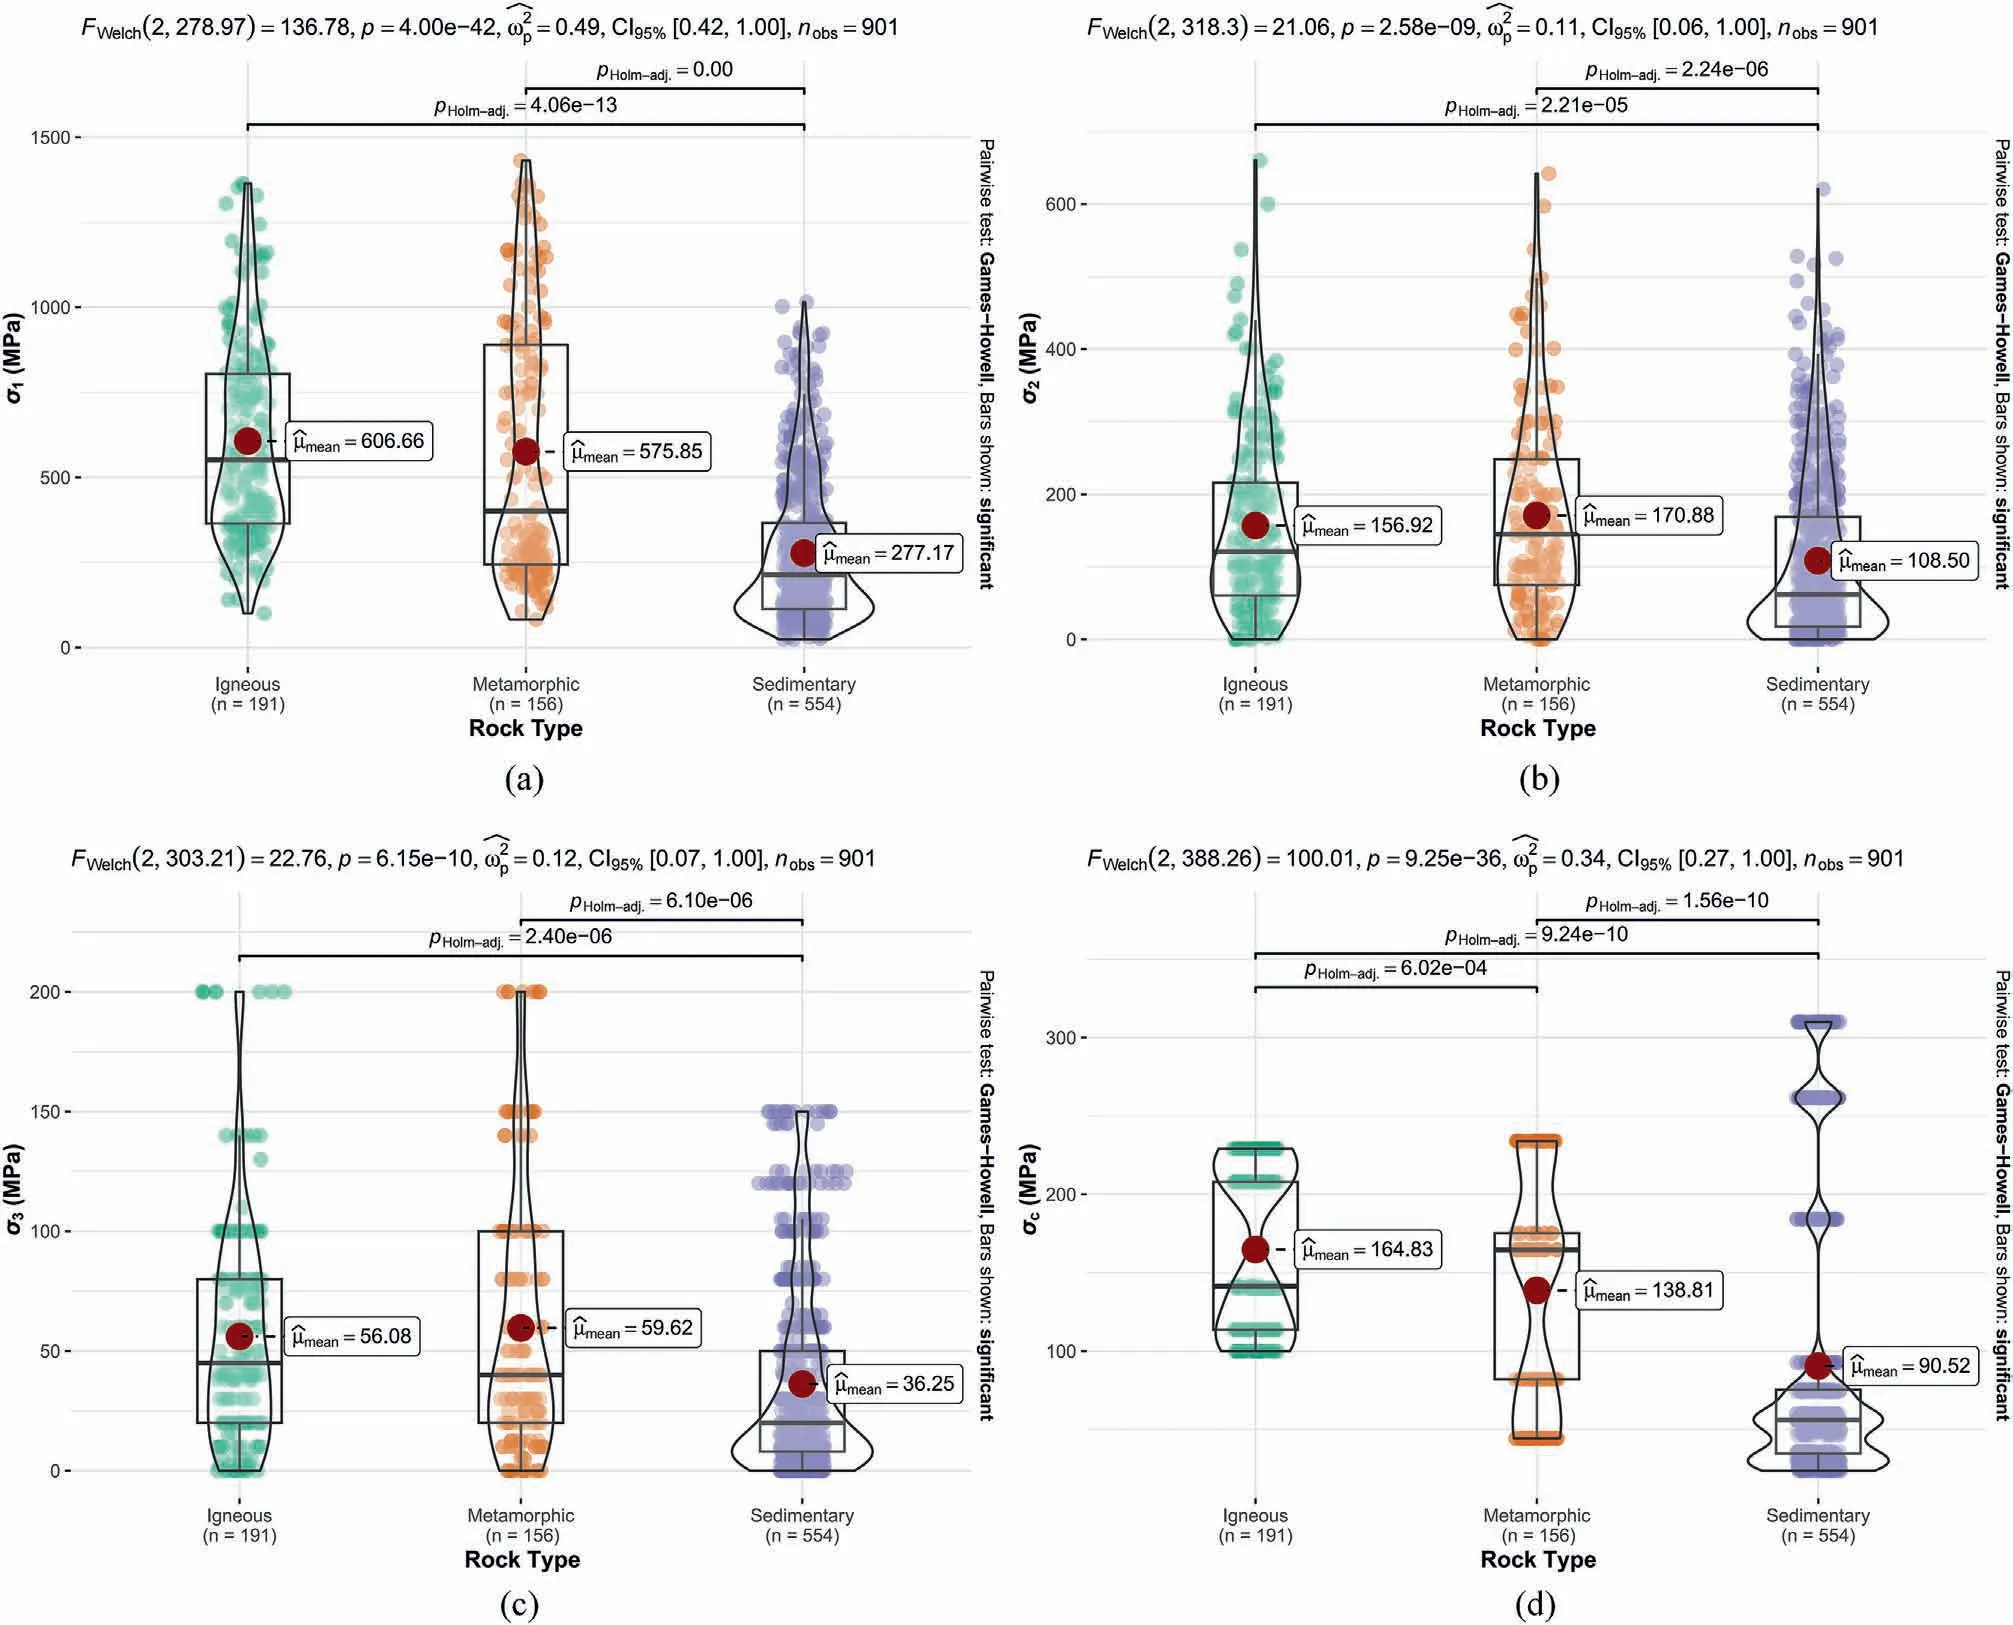
Fig.4.Distribution of four input parameters for three types of rocks: (a) σ1, (b) σ2, (c) σ3, and (d) σc.

Table 1 Statistical description of variables in the training and testing data sets.
The fitness of a single individual is calculated as follows:
where S1denotes the total sum of squares, S2denotes the regression sum of squares, S3denotes the residual sum of squares, yidenotes the actual value of σ1corresponding to the input data,y denotes the mean of the actual σ1corresponding to the input data,and fidenotes the predicted σ1value predicted by the expression represented by the individual for the input data.
7.2.Model training results
The basic parameters of the above GEP model are substituted into the GEP model for training, and Fig.5 shows the variation of the fitness of the optimal individual of the GEP model with the number of iterations.The final generated true triaxial strength criterion for the three rock types is written in Eqs.(27)-(29).Fig.6 shows the ETs for three types of rock GEP models.
7.3.Model prediction performance comparison
The test data set is used for comparing the prediction accuracy of the strength criterion based on the GEP model with the selected conventional strength criteria (ML, MWC and MMC).The correlation between the predicted values and the actual values of the true triaxial strength of the rock is shown in Fig.7.One can see that the sample points of the strength criterion based on the GEP model are generally clustered around their respective fitted lines,with only a few data points showing significant deviations from the lines.In contrast, all three conventional strength criteria exhibit a large number of training and testing data points with notable deviations from their respective fitted lines.Notably, the deviations between predicted values from the strength criterion based on GEP model and experimental values occur mainly in the range of 1000-1500 MPa for σ1.Similarly,the three conventional strength criteria also perform poorly in this interval.However,for the experimental value of σ1in the range of 0-1000 MPa,the strength criterion based on GEP exhibits better prediction performance, whereas the three conventional strength criteria have a large number of outliers in this interval.Thus,it is evident that the strength criterion based on the GEP model offers higher and more stable prediction accuracy than the three conventional strength criteria, especially for the lower true triaxial strength of rocks.
Table 4 summarizes the prediction performance metrics of the strength criterion based on the GEP model and the three conventional strength criteria.To better compare the performance of the models at different stages, the prediction performance of the models for the testing and training data sets are presented separately.For the training set,R2of the strength criterion based on the GEP model is 0.9776,RMSE is 65.1618,and MAPE is 0.2031.For the testing data set, R2is 0.9755, RMSE is 64.4162, and MAPE is 0.215.From the R2, RMSE and MAPE of the four models for the training and testing data sets, the prediction performance of the strength criterion based on the GEP model is significantly better than that of the three conventional strength criteria selected.For the R2andRMSE, the strength criterion based on the GEP model has a significant improvement over the selected conventional strength criteria.It can also be seen that the prediction performance of the strength criterion based on the GEP model is almost equal for the training and testing data sets.This indicates that the strength criterion based on the GEP model has better prediction accuracy performance and also has excellent generalisation ability.
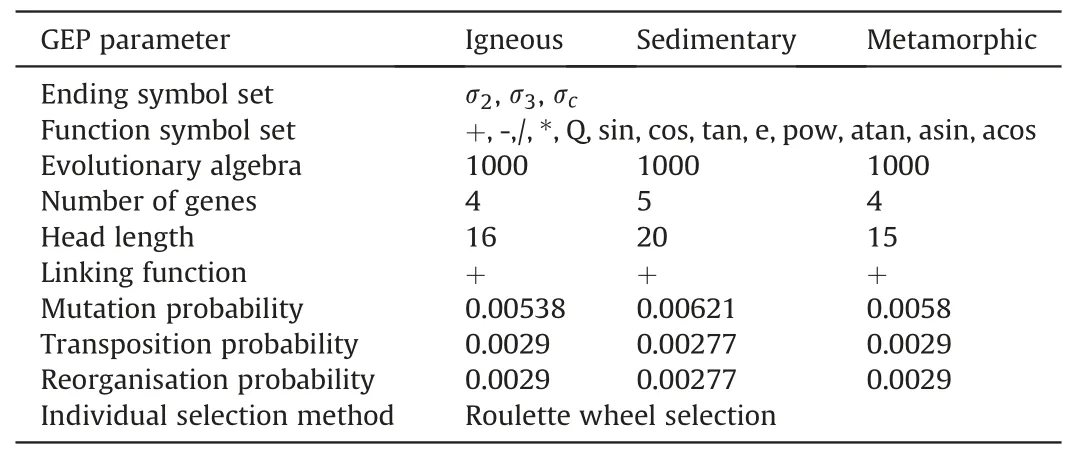
Table 3 GEP model parameter settings.
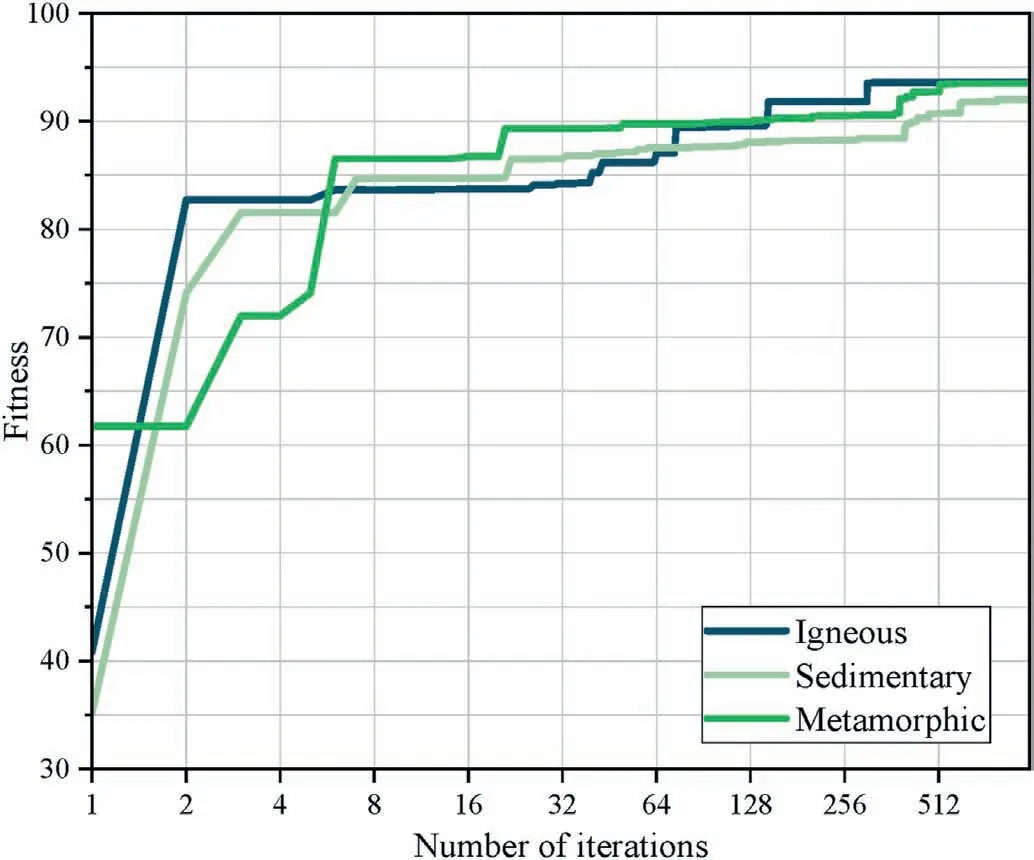
Fig.5.Plot of model fitness versus the number of iterations.
Compared to tables, Taylor diagrams provide a more visual representation of the prediction power of multiple models(Taylor,2001).The closer the points on the diagram are to the labelled measurement points,the better the prediction performance of the strength criterion represented by that point.Fig.8 shows the Taylor plots of the four strength criteria for the training and testing data sets.One can see that the strength criterion based on the GEP model has a better prediction performance, both on the training and testing data sets.
By analysing Table 4, Figs.7 and 8, it is evident that the prediction performance of the strength criterion based on the GEP model is better than the three conventional strength criteria.To further analyse the prediction performance of the above criteria for different types of rocks,the prediction accuracy of the training and testing data sets are further divided,as shown in Fig.9.The y-axis in the figure represents the R2between the predicted and experimental values.From Fig.9a, it can be seen that the prediction performance of the strength criterion based on the GEP model is stable and excellent for igneous, sedimentary and metamorphic rocks.The three conventional strength criteria, i.e.ML, MWC and MMC,all have limitations in predicting certain types of rocks.
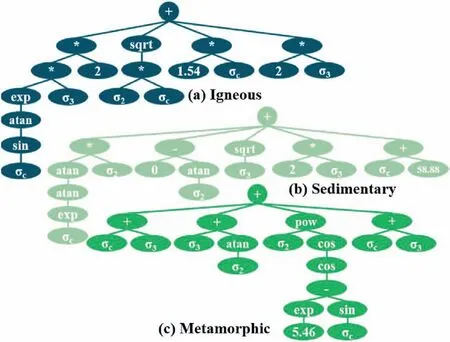
Fig.6.ETs for three types of rock GEP models.
Fig.9b further shows the prediction performance of the model for various rocks.The data for rocks of the same type were combined into one and used to compare the prediction performance of different criteria for that type of rock.One can see that the strength criterion based on the GEP model has a good prediction accuracy for all seven rock types except siltstone and marble.In contrast,the conventional strength criteria, except for their poor performance on siltstone and marble, also have one or more unsuitable rock types.This indicates that the strength characteristics of siltstone are quite different from those of sandstone, limestone and dolomite,which are also sedimentary rocks, and are not suitable with the three conventional strength criteria.The strength characteristics of marble differ from those of amphibolite and monzonite,which are also metamorphic rocks,and are only suitable for the ML criterion among the three conventional strength criteria.During the training process in this study, the strength model represented by the final output strength criterion approached the overall strength characteristics of the training data set through continuous iterations.However, for individuals that deviate from the overall data characteristics, their prediction accuracy may be impacted.However,the generalisability of the strength criterion based on the GEP model is better than that of the three commonly used conventional strength criteria selected.
Fig.10 shows the relationships between the predicted and experimental values in the σ1-σ2plane.Meanwhile, to better compare the model performance, the strength criterion based on the GP model for granite and sandstone with the best accuracy performance was selected for comparison from the study of Yu et al.(2022).The specific expressions are as follows:
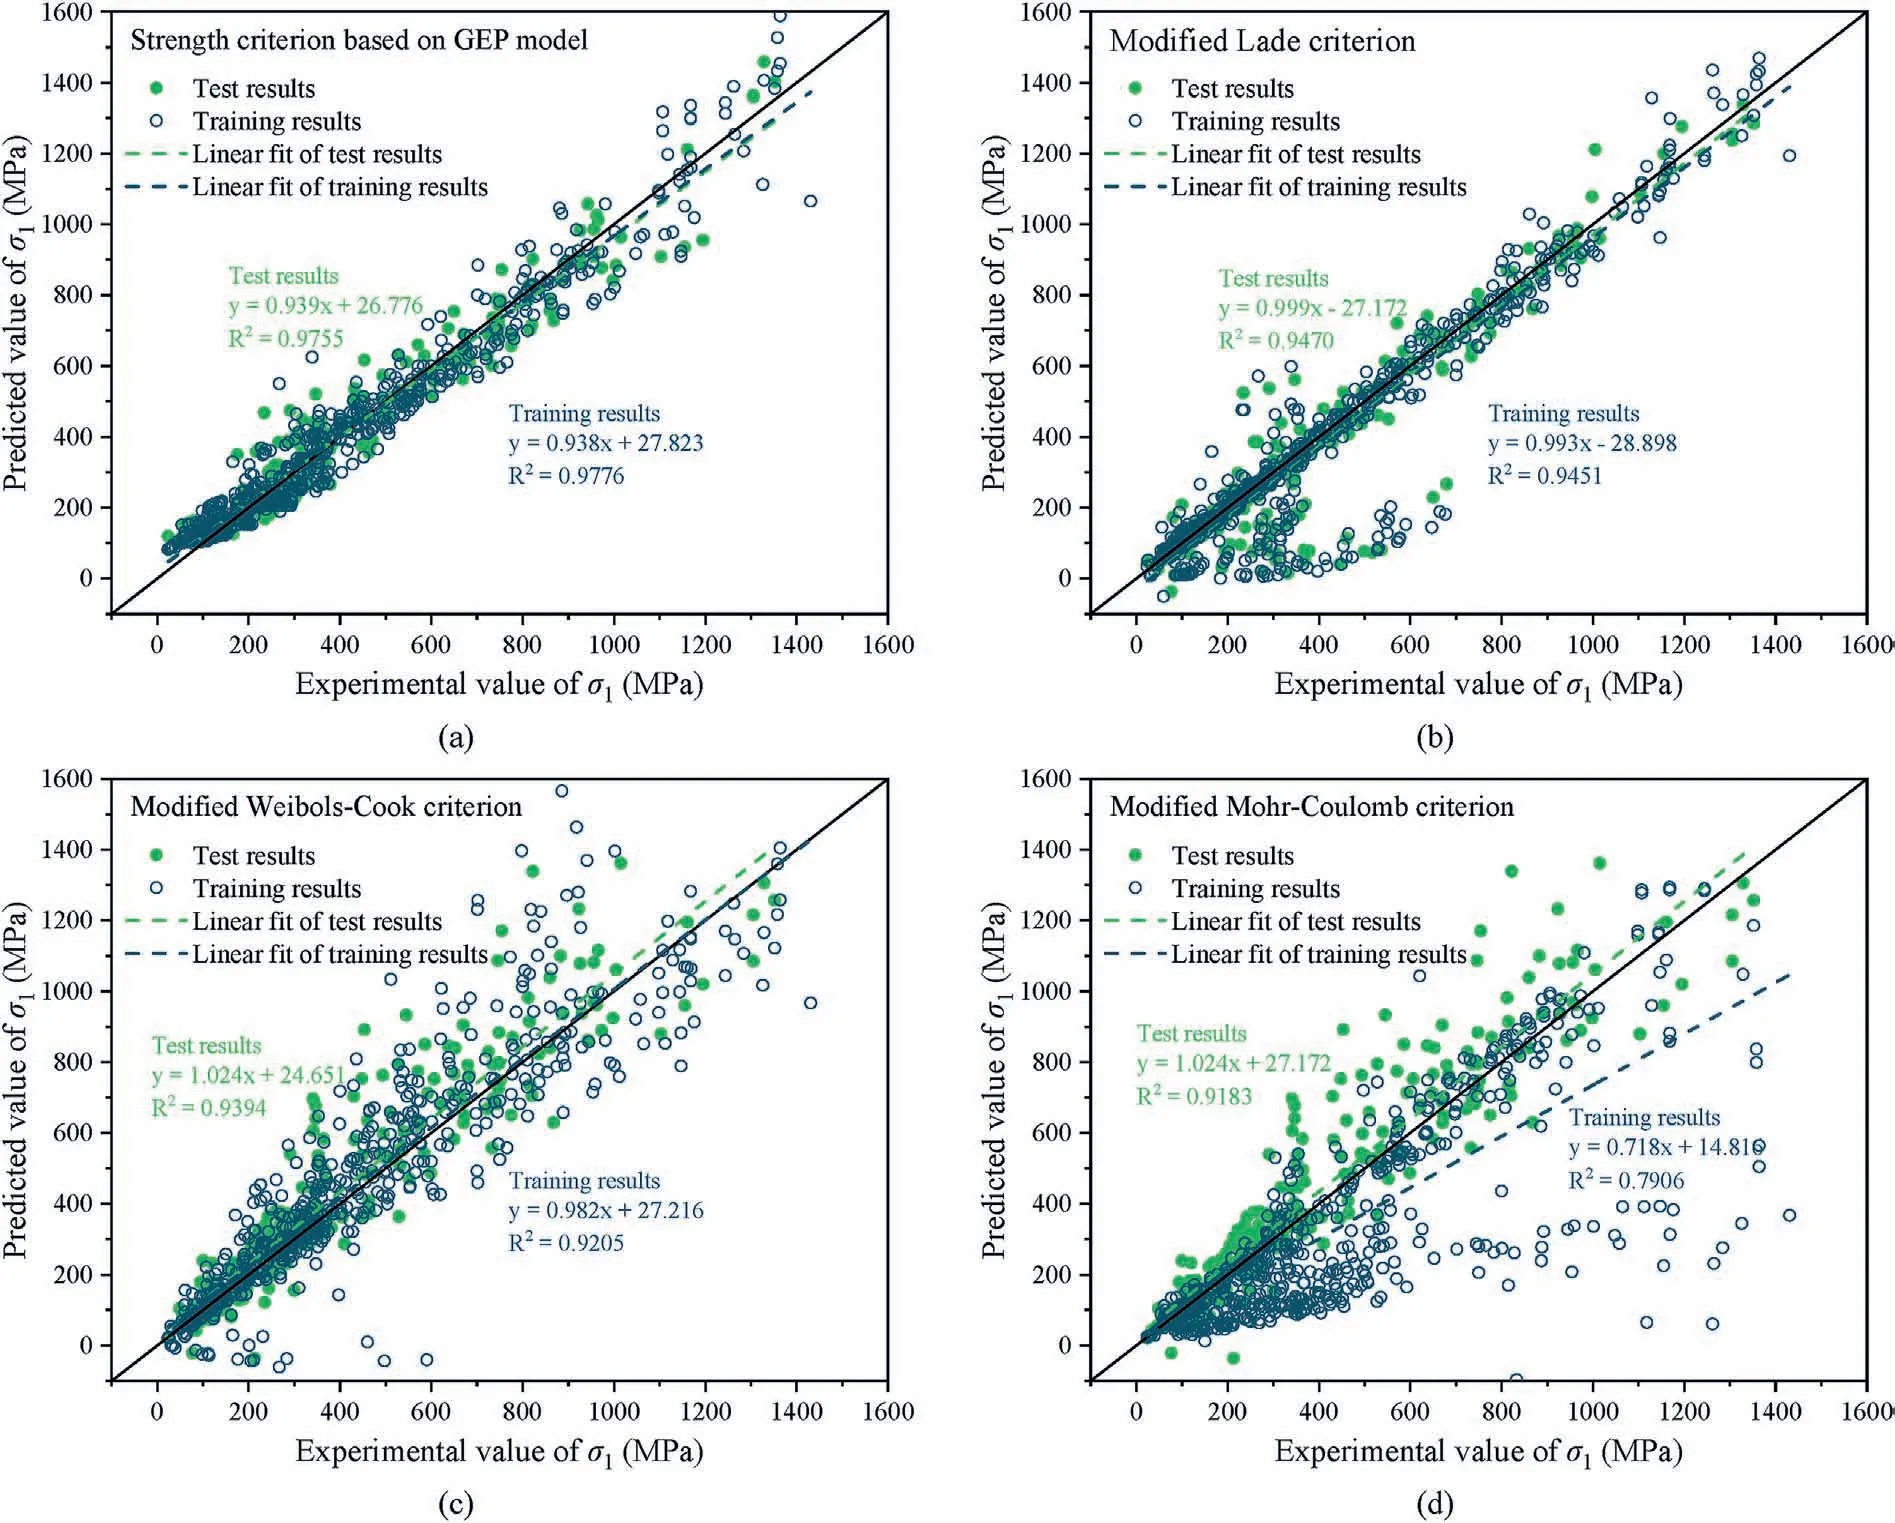
Fig.7.Scatter plots of experimental and predicted values of σ1 for training and testing data sets:(a)Strength criterion based on GEP model,(b)ML criterion,(c)MWC criterion,and(d) MMC criterion.
As shown in Fig.10,the proposed strength criterion based on the GEP model more accurately predicts the enhancement of σ2to σ1compared to the strength criterion based on the GP model.However, both strength criteria have the drawback of not accurately predicting that σ1decreases as σ2increases after σ2reaches a certain value.During the loading process, new microcracks continuously generate inside the rock, which gradually develop into fracture faces after coalescing with the original microcracks.While σ2can limit the generation and development of microcracks,thus improving the rock strength (σ1).However, after σ2reaches a certain value,the rock undergoes damage along the σ2-σ3plane,at which time the increase in σ2leads to a decrease in the rock strength(σ1)(You,2009).Pan et al.(2012)showed that the effect of σ2on the true triaxial strength of the rock(σ1)is influenced by the rock heterogeneity.The input parameters σ2,σ3and σcconsidered in this paper do not reflect the rock heterogeneity.The chosen conventional strength criterion also lacks consideration of the rock heterogeneity.Therefore, in Fig.7, it appears that all four strength criteria perform poorly in the prediction of σ1between 1000 MPa and 1500 MPa.Thus, for a complete prediction of the trend of the true triaxial strength (σ1) with σ2for different rocks, parameters that represent the rock heterogeneity need to be considered.
Table 5 shows the parameter settings of the four strength criteria.One can see that the parameter setting of the strength criterion based on the GEP model is the simplest and the easiest to obtain.The σcof the rocks can be obtained directly by simple uniaxial tests.However,the cohesion(c)and internal friction angle(ϕ)of the rock need to be obtained by the Mohr strength envelope of the rock,and then by the Mohr strength envelope through triaxial tests.
Finally, the importance of the input variables for the strength criterion based on the GEP model was confirmed through Sobol sensitivity analysis (Yu et al., 2022).As shown in Fig.11, for the strength criterion of igneous rocks (sensitivity score: 0.015 for σ2,0.568 for σ3,0.436 for σc),σ3is the primary factor affecting the true triaxial strength of rocks, followed by σcand finally σ2.The same ranking of the importance of the input factors in the strength criterion of sedimentary rocks and the strength criterion of metamorphic rocks was observed as well.It can be seen from Fig.10 that under the same σ2state, σ1has a significant increase with the increase of σ3.Also,under the same σ2and σ3state,a larger σcresults in a higher σ1.As for σ2, as it increases, σ1increases and then decreases,which has been discussed earlier.Meanwhile,the strength criterion based on the GEP model obtained for igneous, sedimentary and metamorphic rocks have different importance of input parameters.For example, the strength criterion obtained for igneous rocks has a sensitivity score of 0.568 for σ3and 0.436 for σc,which are relatively closer in importance.However,the importance of σ3and σcfor the strength criterion of metamorphic and sedimentary rocks differs more significantly.Among the three types of rocks, σchas the largest influence on the output of the strength criterion of igneous rocks, followed by metamorphic rocks, and finally sedimentary rocks.This is consistent with the ranking of themean values of σcfor the three rock types in Fig.4d, with igneous rocks(μmean=164.84)being the largest,followed by metamorphic rocks (μmean= 138.81), and finally sedimentary rocks(μmean=90.52).It can be observed that the influence of UCS(σc)on the true triaxial strength (σ1) increases with UCS increase.
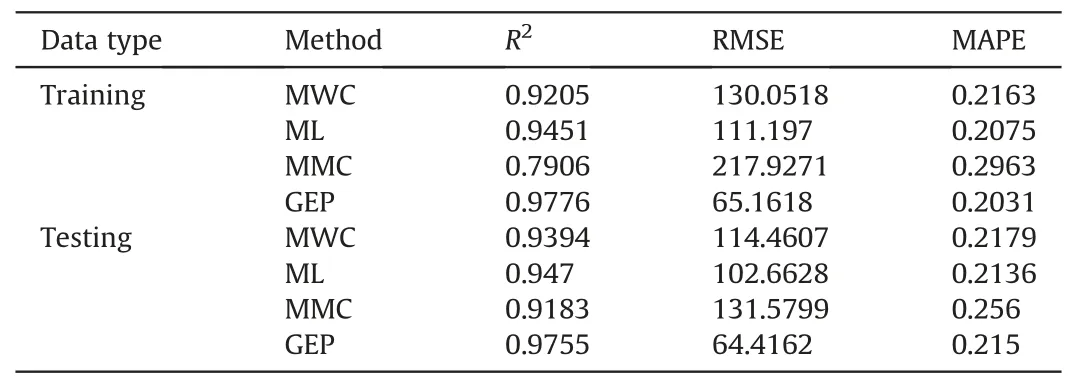
Table 4 Prediction performance measures of GEP model and three conventional strength criteria.
8.Limitations of the proposed method
The proposed method has some shortcomings, such as:
(1) The classification of rocks based solely on their geneses might not fully reflect their mechanical properties, as the properties can vary greatly even within the same rock type.To improve the accuracy of the classification, more rigorous approaches that consider additional factors affecting mechanical properties, such as mineralogical composition and structure, could be explored.
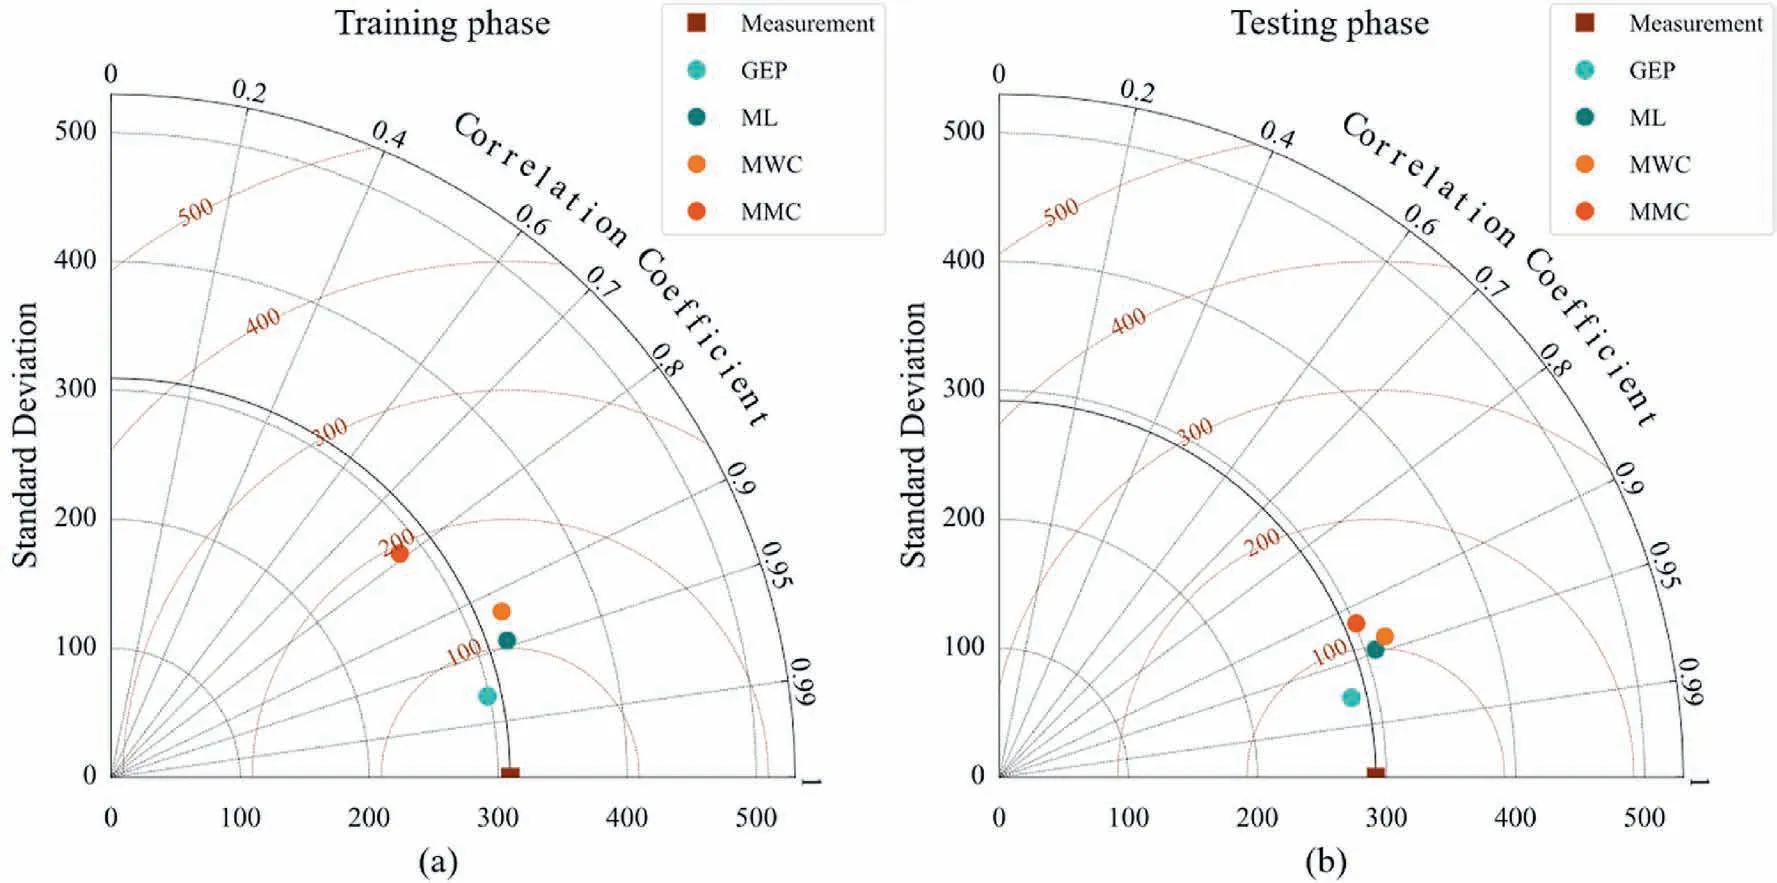
Fig.8.Taylor diagrams of the predicted results of the GEP model and three conventional strength criteria: (a) Training phase, and (b) Testing phase.
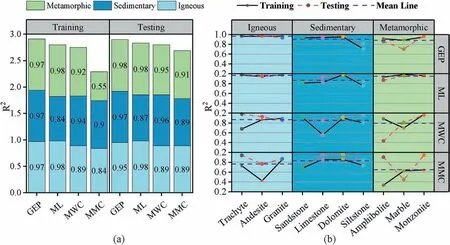
Fig.9.Prediction accuracy for (a) rocks of different geneses and (b) different types of rocks.
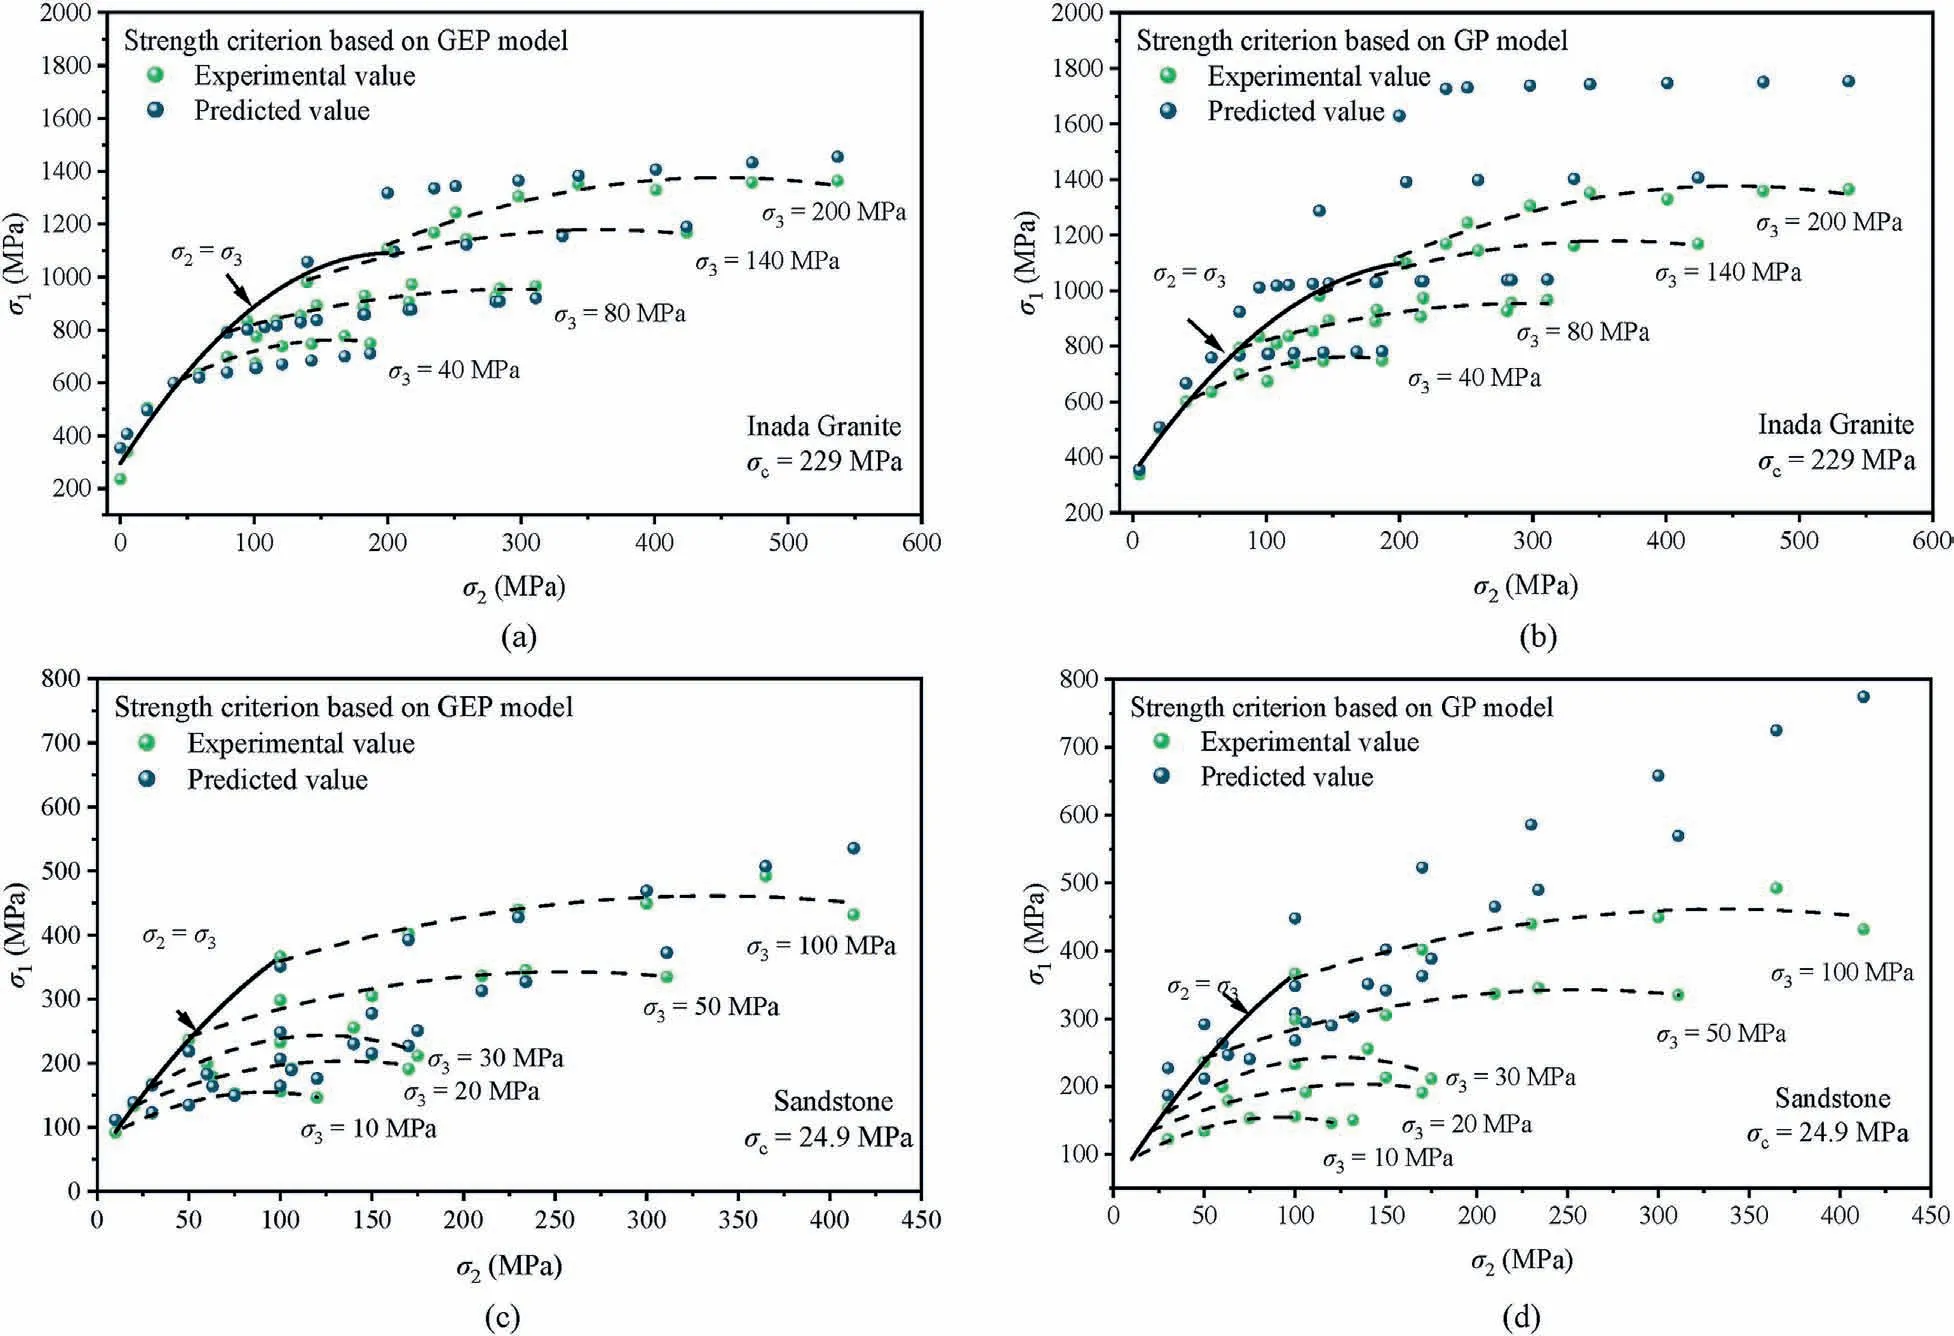
Fig.10.Trend of the predicted and experimental values in the σ1-σ2 plane: (a) GEP model with Inada granite data, (b) GP model with Inada granite data, (c) GEP model with sandstone data, and (d) GP model with sandstone data.

Table 5 Parameter composition of the GEP model and three conventional strength criteria.
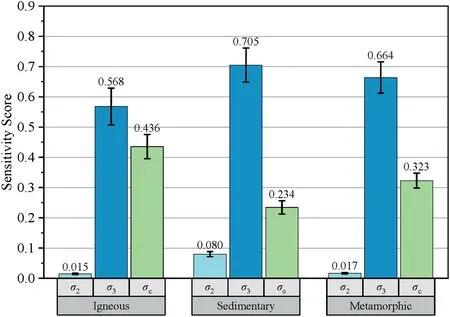
Fig.11.Total sensitivity from Sobol sensitivity analysis.
(2) The proposed model cannot completely predict the variation of σ1with σ2because the parameters related to rock heterogeneity are not considered.Rocks are often heterogeneous in terms of their mineralogical composition,structure, and other factors, which can greatly affect their strength characteristics.Future studies could focus on quantifying rock heterogeneity and incorporating it into the input parameters of the model to improve its accuracy.
9.Conclusions
In this paper, the influence of rock genesis on the mechanical characteristics of rocks is considered.A true triaxial strength prediction model based on the GEP algorithm for three different genetic rocks is developed.A total of 901 sets of true triaxial test data for 29 rocks are collected from the literature.The data are then randomly divided into a training data set (70% of the data) and a testing data set(30%of the data).By training with the data from the training data set,the strength criterion of igneous,sedimentary and metamorphic rocks based on the GEP model is obtained.The same training data set is used to determine the parameters of the three conventional strength criteria (ML, MWC and MMC).Then the testing data sets are used to compare the prediction performance of these models.The obtained strength criterion is also compared with that of the GP model.Finally, the Sobol sensitivity analysis technique is used to analyse the effect of the model input variables on the output.Based on these analyses, the paper arrived at the following conclusions:
(1) For the testing data set used, the rock strength criterion based on the GEP model has better prediction performance than the three conventional strength criteria.In comparison,the true triaxial strength criterion based on the GEP model improves R2by 3.1%-6.2%,reduces RMSE by 37.3%-51%,and reduces MAPE by a maximum of 16%.
(2) The rock strength criterion based on the GEP model suits more types of rocks, compared to the three conventional strength criteria.The prediction performance is more stable for different types of rocks.For the nine different rocks in the data set used, the rock strength criterion based on the GEP model shows low prediction accuracy for only two rock types.All three conventional strength criteria have three and more rocks with low prediction accuracy.
(3) Compared to the strength criterion based on the GP model developed by Yu et al.(2022),the strength criterion based on the GEP model proposed in this paper provides more accurate prediction of the true triaxial strength of rocks.However,the input parameters of both models do not take into account the parameters that can represent the rock heterogeneity.Therefore, both models do not predict the effect of σ2on σ1changing from enhanced to weakened after a certain point.For a complete prediction of the true triaxial mechanical behaviour of rocks,input parameters that represent the rock heterogeneity need to be considered.
(4) The results of Sobol sensitivity analysis indicate that for the three types of rocks of different geneses, the true triaxial strength (σ1) is most influenced by σ3, followed by σc, and finally by σ2.However, for rocks of different geneses, σ2, σ3and σchave different percentages of influence on σ1.Additionally,the influence of σcon the true triaxial strength of the rock (σ1) increases with σcincrease.
Declaration of competing interest
The authors declare that they have no known competing financial interests or personal relationships that could have appeared to influence the work reported in this paper.
Acknowledgments
This research is partially supported by the National Natural Science Foundation of China (Grant No.42177164), the Distinguished Youth Science Foundation of Hunan Province of China(Grant No.2022JJ10073) and the Innovation-Driven Project of Central South University (Grant No.2020CX040).
 Journal of Rock Mechanics and Geotechnical Engineering2023年10期
- Journal of Rock Mechanics and Geotechnical Engineering的其它文章
- Analytical solutions for the restraint effect of isolation piles against tunneling-induced vertical ground displacements
- Characterizing large-scale weak interlayer shear zones using conditional random field theory
- Displacement-based back analysis of mitigating the effects of displacement loss in underground engineering
- Investigation of long-wavelength elastic wave propagation through wet bentonite-filled rock joints
- Mechanical properties of a clay soil reinforced with rice husk under drained and undrained conditions
- Evaluation of soil fabric using elastic waves during load-unload
