Numerical and experimental analyses of rock failure mechanisms due to microwave treatment
Hithm M.Ahmed, Adel Ahmdihosseini, Ferri Hssni, Mohmmed A.Hefni,HussinA.M.Ahmed, Hussein A.Sleem, Essm B.Moustf, Agus P.Ssmito,*
a Mining Engineering Department, King Abdulaziz University, Jeddah, 21589, Saudi Arabia
b Department of Mining and Materials Engineering, McGill University, Montreal, QC, H3A0E8, Canada
c Mechanical Engineering Department, King Abdulaziz University, Jeddah, 21589, Saudi Arabia
Keywords:
ABSTRACT Despite the extensive studies conducted on the effectiveness of microwave treatment as a novel rock preconditioning method,there is yet to find reliable data on the rock failure mechanisms due to microwave heating.In addition, there is no significant discussion on the energy efficiency of the method as one of the important factors among the mining and geotechnical engineers in the industry.This study presents a novel experimental method to evaluate two main rock failure mechanisms due to microwave treatment without applying any mechanical forces,i.e.distributed and concentrated heating.The result shows that the existence of a small and concentrated fraction of a strong microwave absorbing mineral will change the failure mechanism from the distributed heating to the concentrated heating, which can increase the weakening over microwave efficiency (WOME) by more than 10 folds.This observation is further investigated using the developed coupled numerical model.It is shown that at the same input energy,the existence of microwave absorbing minerals can cause major heat concentration inside the rock and increase the maximum temperature by up to three times.
1.Introduction
Rock excavation and associated problems are significant in mining industry and geotechnical engineering (Rostami and Ozdemir,1993).Engineers employ either non-continuous or batch(e.g.drilling and blasting) or continuous (e.g.mechanical excavation) methods to address this problem.The uncertainties of the non-continuous methods such as mine collapse and groundwater inrush along with low mine productivity due to longer cycle time needed to clear-out blasting fumes and its environmental effect have made the mining industry lean toward the continuous methods(Ma et al.,2019a,2019b;Wang et al.,2019).Nevertheless,continuous methods have their own limitations.For example,mechanical excavation suffers from slow excavation rate,short life span of the cutting discs and periodic equipment maintenance(Kahraman et al., 2020).In order to address the issues by continuous methods,rock pre-conditioning has been introduced in which one of the most promising methods is the microwave treatment (Hassani, 2010).
In a general view, microwave irradiation can heat up some minerals like pyrite,while it does not have any effect on others like allanite(Chen et al.,1984).Therefore,during microwave treatment,there are some minerals that are heated and expanded due to the thermal expansion which induce stress to their contact surfaces with other surrounding minerals.The generated internal stress creates micro/macro cracks inside the rock that results in a strength reduction of the microwaved sample before the excavation starts and consequently, addresses the issues of the continuous excavation methods to some extent (Jones et al., 2005; Hassani, 2010;Zheng et al., 2020a).
Increasing either power or exposure time increases the microwave output energy dosage that gives rise to a higher temperature and potentially, a higher strength reduction in the rock(Nekoovaght,2009).In this regard,many studies have investigated the effect of different dosages of microwave energy on rock strength parameters.These studies are jointed together by stating that increasing the energy dosage would cause more strength reduction.For instance, Peinsitt et al.(2010) treated sandstone,granite, and basalt rocks with a microwave power of 3 kW and exposure times of 60 s, 120 s, 180 s, 240 s, and 300 s.They emphasized the strength reduction of the samples caused by microwave energy by comparing uniaxial compressive strength(UCS)values of the rocks before and after treatment.Moreover, Nejati et al.(2012) evaluated the effect of microwave treatment on the fracture toughness of basalt.Different powers of 1-5 kW with an exposure time of up to 30 s was used to treat small cylindrical samples with a diameter of 50 mm and a height of 15 mm, which resulted in large microwave energy dosages and a reduction of stress intensity factor.These studies have been continuing over the past decade.For example,Bisai et al.(2020)investigated the effect of microwave energy on uniaxial tensile strength (UTS) and UCS reduction in granite and sandstone rocks.Yuan et al.(2020)investigated the crack propagation in olivine basalt at different powers and exposure times and it was shown that there is an increase in the crack density after microwave treatment.In previous studies, it is mentioned that the strength reduction and crack density are increased when the microwave power and exposure time are increased.However,to the best of the authors’knowledge,there has not been a thorough evaluation of the energy efficiency of the microwave treatment of rocks,especially for the heterogeneous samples(Jones et al.,2007;Hassani et al.,2011;Hartlieb et al.,2018;Lu et al., 2019, 2020; Li et al., 2020; Bai et al., 2021).One should consider that neglecting the amount of energy spent on reducing rock strength with microwave energy can cause major conceptual issues in the studies.To address this issue, Hassani et al.(2020)proposed an innovative approach by adding calorimetric measurements.After each microwave heating experiment, the sample is put inside a calorimeter to measure the energy absorption.Measuring the energy absorptions led to the introduction of two new parameters named heat over microwave efficiency (HOME)and weakening over microwave energy (WOME), which can quantify the evaluation of the energy efficiency of the microwave treatment method.
Experimentally investigating the effect of microwave treatment on improving mining excavation can be time-consuming and expensive.Developing numerical models can address a lot of these issues (Salsman et al., 1996; Whittles et al., 2003).A variety of research works have been conducted to numerically evaluate the effect of microwave energy on rock strength reduction.Numerical investigation of complex coupled phenomena such as microwave heating of rocks can face several challenges including but not limited to high computational cost and convergence issues.To overcome these challenges, researchers have implemented different numerical approaches (e.g.discrete element method(Wang et al., 2008; Ali and Bradshaw, 2010) and continuum methods (Whittles et al., 2003; Wang et al., 2008; Ali and Bradshaw, 2009; Wang and Djordjevic, 2014), simplified assumptions (e.g.using Lambert’s law instead of Maxwell’s equations to find the electromagnetic distribution in the space(Xu et al.,2020))and simplified boundary conditions(e.g.disregarding the accurate design of the cavity(Toifl et al.,2016,2017)).The limitations in the conducted methods and especially the simplified assumptions create major differences between numerical modeling, field, and experimental data, leading to improper validation and verification of the developed models (Li et al., 2019; Pressacco et al.,2022).
Recent advancements in the development of numerical models as well as increased accessibility to high-power computer systems have resulted in major improvements in the developed numerical models.For instance, Toifl et al.(2016, 2017) developed a threedimensional (3D) numerical model to investigate the damage caused by microwave treatment on heterogeneous rock.However,not using proper boundary conditions created a deviation between the reality and the model.In one of the most recent examples in Shadi et al.(2022), they have been able to capture the energy absorption of the homogeneous samples during microwave treatment with less than 3% error.Continuing the development of these numerical models can significantly improve the understanding of the effect of microwave treatment on the rock’s strength reduction.
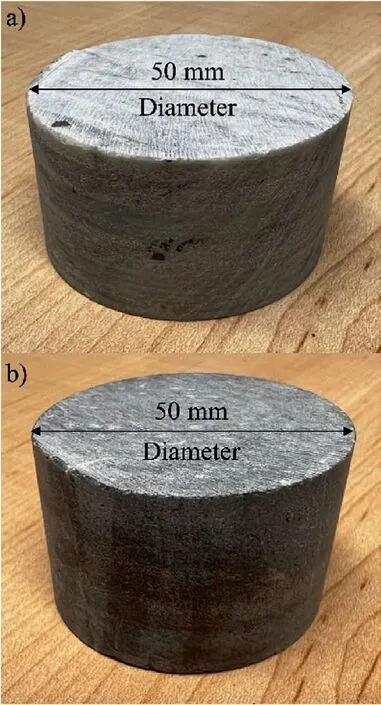
Fig.1.Two visually distinctive patterns among the samples used for the microwave treatment experiment: (a) Light pattern; and (b) Dark pattern.
To address the knowledge gap and build upon the previous research works, it is intended to introduce a new experimental procedure by concentrating on energy as the major parameter as well as heterogeneous rocks that constitute high microwave absorbing minerals.The effect of the existence of the major microwave absorbing minerals in the rock mass has been evaluated both numerically and experimentally.
2.Methodology
2.1.Experimental procedure
This section describes the experimental procedure followed in this study to evaluate the effect of microwave treatment on reducing the strength of rocks.The experimental investigation is conducted in two parts.First, the characteristics of the rocks are evaluated using different experiments and techniques.The gathered results provide some insight into the nature of the rocks used for microwave treatment experiments.Some of these results are also used as input parameters for the developed numerical model.Second,the procedure for the microwave treatment experiments is provided in detail by describing the industrial microwave system used in the study and the specifications of the heating experiments,such as power, exposure time, and frequency.The detail of each subsection is provided as follows.
2.1.1.Material characterization
The samples used in this study are categorized as Rhyolite rocks and are gathered from Najran Area in Saudi Arabia (Ahmed et al.,2022).The samples are taken out in intact form using core drilling with a diameter of 50 mm.The surfaces of the cores are polished to reach a tolerance of 0.04 according to the ASTM standard (ASTM D4543, 2019) (see Fig.1).There are two visually distinctive patterns for the rocks which can be categorized in light and dark, as shown in Fig.1a and b, respectively.Furthermore, different techniques, such as scanning electron microscopy (SEM), X-ray fluorescence (XRF), and X-ray Diffractions (XRD), are employed to characterize the samples in a more quantified manner(Tables 1-3).The significant variation in the weight percentage of different minerals and elements between the samples discussed in Tables 1-3 and the distinct visual patterns in Fig.1 emphasize the heterogeneous nature of the rocks used in this study.It should be noted that some of the minerals,such as pyrite,are microwave absorbent,and their percentage in the sample can significantly change the response of the rock to the microwave energy.
The core diameters are 50 mm, and they are cut into 100 mm sections to provide UCS-sized samples with a height to diameter ratio of 2:1.Afterward, the top and the bottom surfaces of each sample are ground using a mechanical grinding machine to ensure that the flat surfaces are horizontal and parallel and also, the dimensions are consistent.
The heat capacity is calculated by measuring the heat transfer between rock and water when they have different temperatures until reaching thermal equilibrium.The thermal conductivity is measured by employing a KD2Pro probe.It should be noted that the tests for measuring both heat capacity and thermal conductivity are repeated three times and the average value is reported to ensure the reliability of the results in representing the rock characterization parameters (Table 4).
The thermal expansion of the sample is measured using a thermomechanical analyzer(TMA)apparatus.The main concept of the TMA is to measure the change in the dimension of the sample when the temperature changes.The procedure for each test includes multiple steps as follows.
(1) The temperature is set at 298.15 K;
(2) The sample and equipment stay isothermal for 1 min at 298.15 K;
(3) The temperature increased at the rate of 3 K/min up to 673.15 K;
(4) The temperature decreased at the rate of 3 K/min down to 298.15 K; and
(5) Steps 3 and 4 are repeated.
For the sample to be used in this experiment, the inclusion of two parallel surfaces is required.The initial distance between the two parallel surfaces is 24.57 mm.During the entire test, the deformation of the sample between the two parallel surfaces is recorded.Fig.2 depicts the dimension change versus the temperature,which also shows a cyclic behavior for the thermal expansion of the rock.However, considering the fact that there is no cyclic phenomenon during the microwave heating tests,the values of the first heating cycle should be considered as the main parameter in microwave treatment.
The electromagnetic properties of the rocks include three main parameters: relative permittivity, relative permeability, and electrical conductivity.When the rock is not constituted of any major magnetic or electrically conductive minerals, the relative permeability and electrical conductivity parameters are approximately 1 and 0,respectively.The relative permittivity of the samples in this study is measured using two different methods.
The first method to measure the dielectric properties is the coaxial probe.In this method, a high-temperature coaxial probe is employed.Applying this method to solid materials requires flat and smooth surfaces to ensure proper contact between the probe and the rock.Therefore, two samples are chosen randomly, and their surfaces are smoothened using sandpapers to ensure proper contact between the rock and the probe.The probe is used at three different locations and in each location the measurement is repeated three times to ensure that the results are reliable.The experiments are performed at the intermediate frequency bandwidth(IFBW)of 300 Hz and the power of 10 dBm.The samples used for the measurements have a diameter of 50 mm and a length of 30 mm.The recommended test specifications are detailed in Table 5(Keysight, 2017a, b).It should be noted that Rhyolite rocks are not good microwave absorbents and therefore, the recommendations for the loss tangent values might not be satisfied.
Using a coaxial probe for the measurement of the dielectric properties for the samples with low microwave energy absorption might not provide accurate results.Therefore, in this study, the cavity perturbation method is utilized as an alternative method for the measurement of the dielectric properties.This method is performed based on the system developed by Hutcheon et al.(1992a,b),which includes using small-sized samples(diameter of 3.71 mm and a length of 12.32 mm).In this method, the sample is encountered with an electric field and afterward, the change in the frequency and the introduced electromagnetic energy is related to the complex dielectric properties of the material.One of the advantages of using this method is its capability in measuring the dielectric properties at high temperatures up to 1400°C.This method has been previously used in literature to measure the temperature-dependent permittivity of rock materials (e.g.Samouhos et al., 2012; Hartlieb et al., 2016; Bobicki et al., 2020;Shadi et al.,2022).However,because of the small-size samples,it is difficult to provide useful information for heterogeneous rocks.Furthermore, compared to other methods like the coaxial probe,the measurements are more time-consuming.
In this study, both of the introduced methods of dielectric properties measurements are employed and compared.
2.1.2.Microwave heating experiments
The purpose of the microwave heating experiments in this study is to evaluate the required microwave energy to break rock samples.The heating experiments are performed using an industrial microwave cavity working at the frequency of 2.45 GHz.The detailed dimension of the cavity is shown in Fig.3.The electromagnetic wave is radiated through a rectangular waveguide with length and width of 88 mm and 46 mm, respectively.For each experiment,the UCS-sized sample is placed inside the cavity where the distance between the waveguide port and the top surface of thesample is 15 mm.Then,the sample is exposed to microwave power of 3 kW.The microwave radiation continues until a major failure is observed in the sample.Immediately after the major failure is observed, the radiation is stopped and the sample is put inside a calorimeter to measure the absorbed energy during the microwave heating.Then,based on the absorbed and input energies,the HOME is calculated as follows:

Table 1 Elemental compositions (%) of samples.

Table 2 Chemical composition (%) of samples determined by XRF.

Table 3 Mineral phase identification of the samples and their weight percentage(%).

Table 4 Rock material properties.
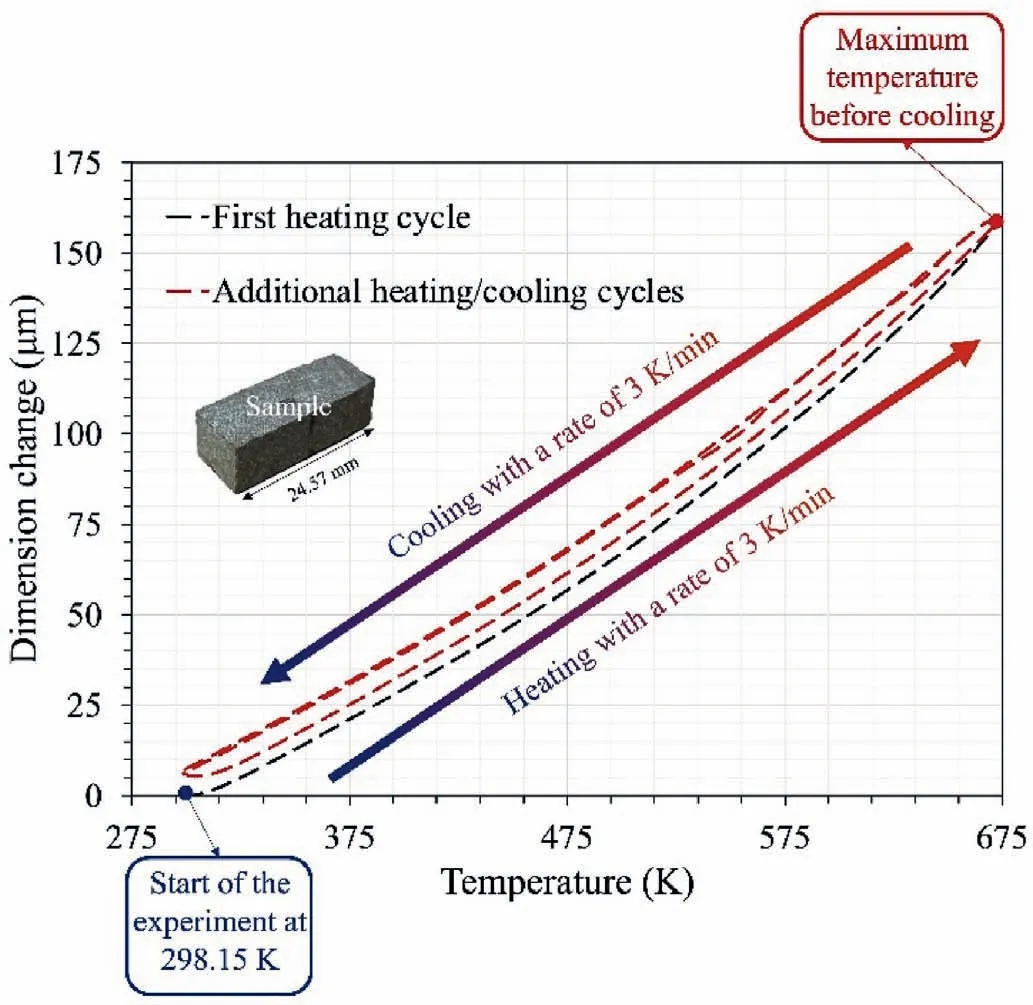
Fig.2.The TMA experiment results of the sample’s thermal expansion behavior in different continuous heating cycles.Since there is no cooling during the microwave treatment, the first heating line (depicted in black) is more important.

Table 5 Recommendations for the test specifications for the measurement of the dielectric properties using the coaxial probe.
Furthermore, considering the major destruction of the sample during the heating experiments, it is assumed that the applied energy has caused a 100% strength reduction of the material.Therefore, the WOME can be calculated:
2.2.Numerical model
A 3D coupled numerical model is developed to investigate the energy absorption and the temperature change at different locations of the rock during the microwave treatment.This model has been previously verified, validated, and explained in detail in Ahmadihosseini et al.(2022).This section is only focused on the main points of the developed numerical model and the readers are referred to Ahmadihosseini et al.(2022)for a detailed description.
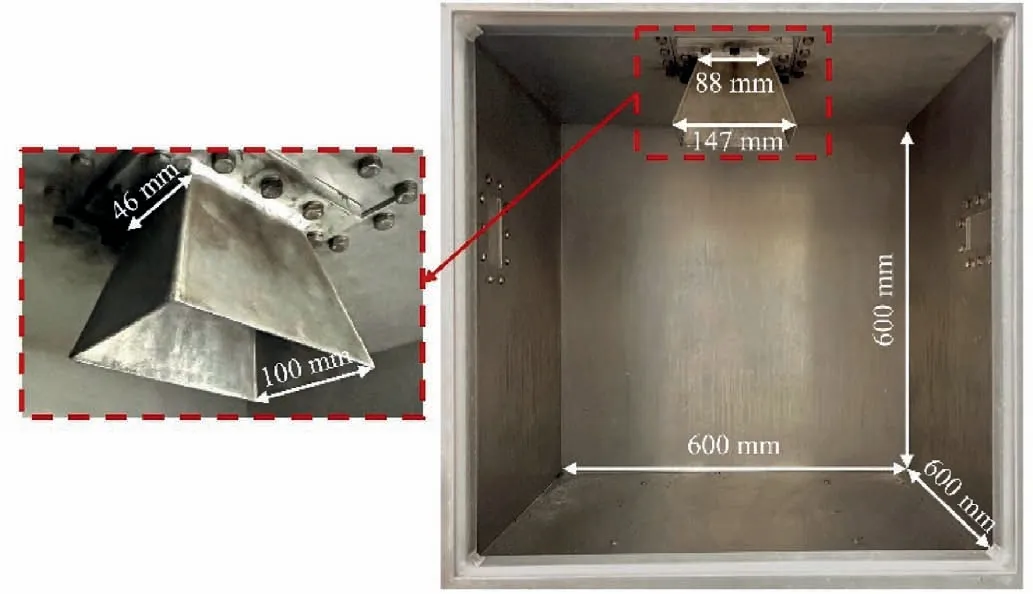
Fig.3.The industrial microwave cavity and its dimensions used for the microwave heating experiments.
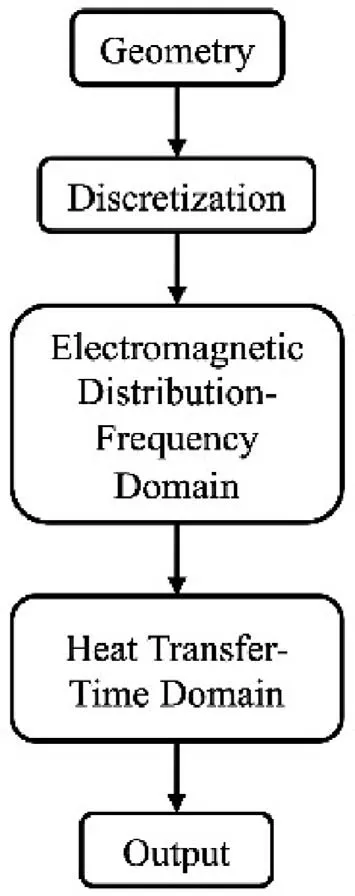
Fig.4.The flowchart specifying the solution procedure for the developed numerical model.
2.2.1.Governing equations
To describe the electromagnetic wave distribution throughout the cavity, the time harmonic form of the Maxwell’s equations is used as follows:
where E is the electric field intensity; σ is the electrical conductivity;ω is the angular frequency;μris the relative permeability;i is the unit imaginary number;0is free space permittivity; and k0is the wavenumber in free space,which can be calculated as follows:
where μ0is the free space permeability.It should be noted that for rocks, the relative permittivity and permeability are complex numbers constituting real and imaginary parts as follows:
Since in most rocks, there is no magnetic loss (μr≈1), the relative permittivity becomes the main parameter governing the electromagnetic distribution in the cavity and therefore,in order to capture correctly the electromagnetic distribution in the material,it is necessary to have accurate measurements of both the real and imaginary parts of the relative permittivity.
The energy absorption of the sample is calculated by solving the energy conservation equation as follows:
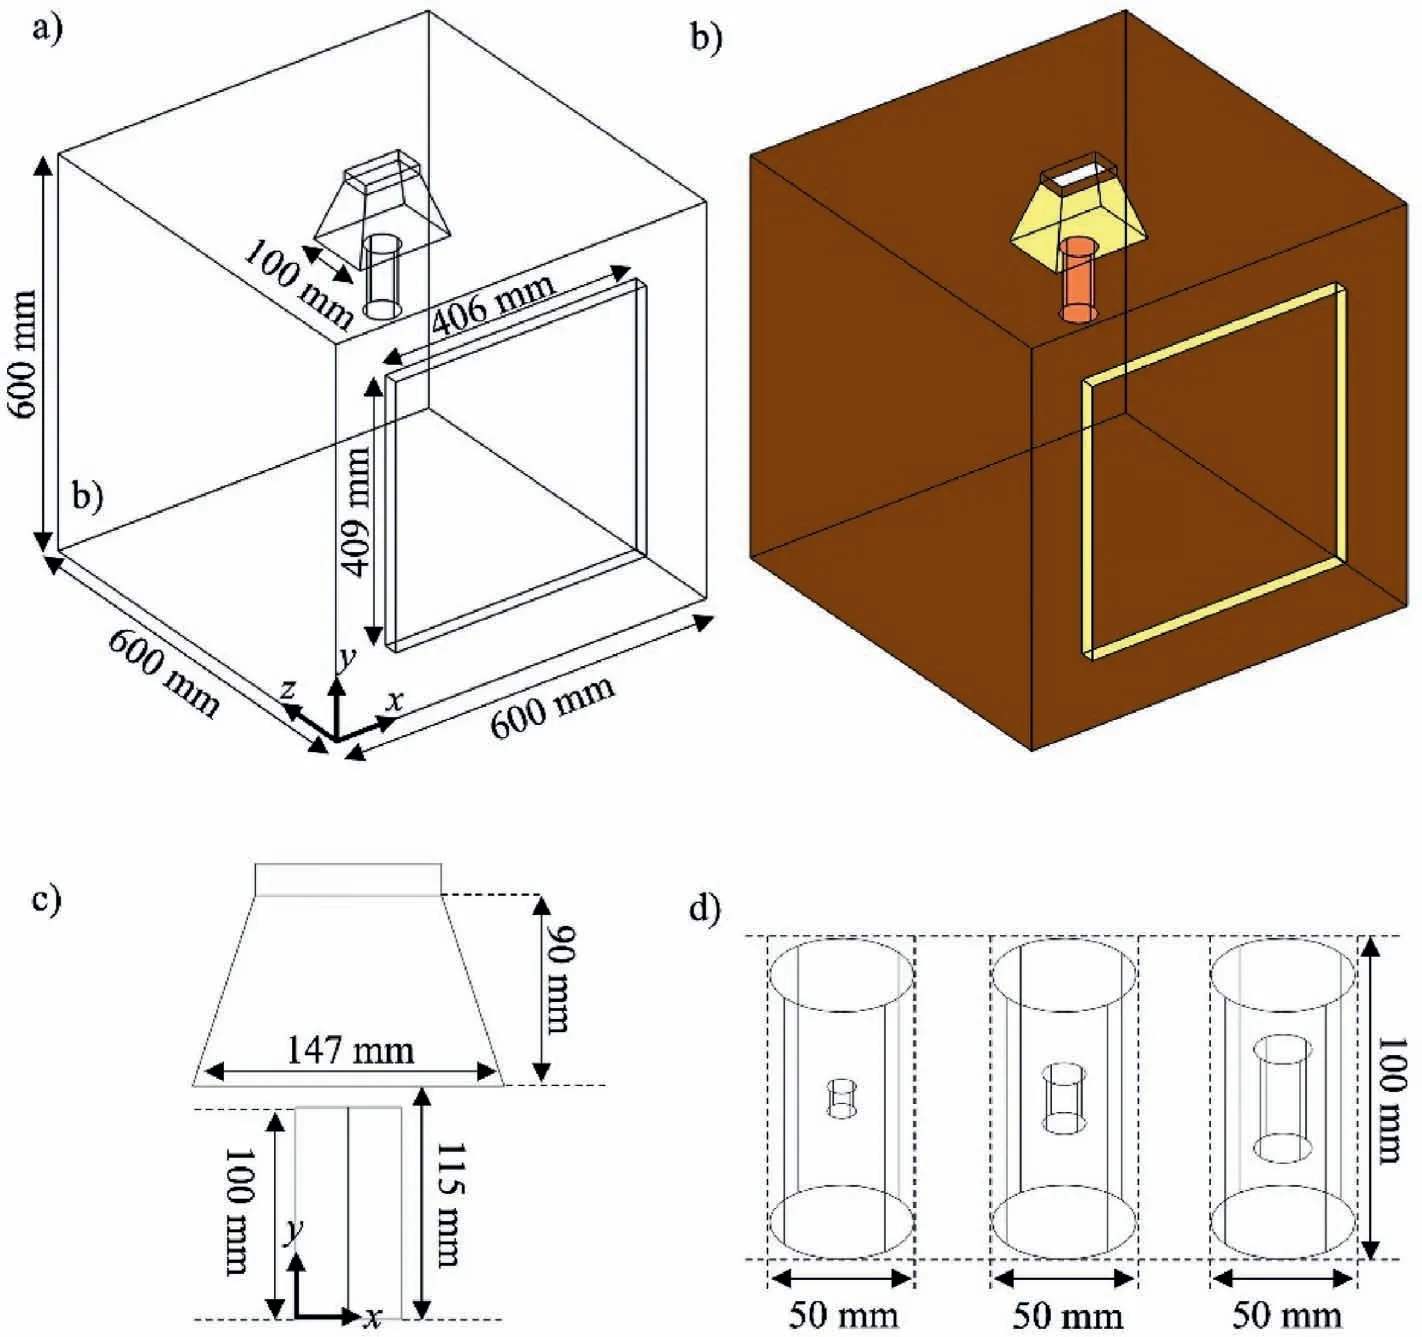
Fig.5.(a) The geometry of the numerical model; (b) The sample, external, and internal boundary conditions specified in the geometry in different colors of orange, brown, and yellow,respectively;(c)The dimensions of the waveguide port and the sample;and(d)The different core sizes considered inside the sample with diameters of 10 mm,15 mm and 20 mm and lengths of 10 mm, 20 mm, and 40 mm for the smallest size to the biggest size, respectively.
where ρ is the density of rock, C is the heat capacity, T is the temperature,k is the thermal conductivity,and Q is the heat source that is generated inside the material during the microwave treatment and can be obtained using Eq.(8)as follows:
where H is the magnetic field intensity.
The solution procedure of the aforementioned equations in the numerical model is depicted in Fig.4.
2.2.2.Boundary conditions
The following boundary conditions are considered for the development of the numerical model.
(1) All the internal and external aluminum boundaries of the microwave cavity are perfect electric conductors;
(2) The electromagnetic wave is radiated through the port boundary condition into the cavity with mode 10 of transverse electric field (TE10)into the cavity; and
(3) The external aluminum surfaces are adiabatic boundary conditions.
In order to elaborate the boundary surfaces,they are depicted in different colors in Fig.5b.
2.2.3.Model description
The geometry of the cavity in the numerical model is designed based on the experimental equipment in the geomechanics laboratory of McGill University (Fig.5a).The geometry includes two cubes with the dimensions of 600 mm × 600 mm × 600 mm(length × width × height), and 88 mm × 46 mm × 15 mm(length × width × height) to represent the cavity and the port of the microwave, respectively.Shadi et al.(2022) investigated the effect of a full-length waveguide geometry compared to a simple cube and showed that a simplified cubic geometry is a good representative of the port for rectangular waveguides.Therefore,in this study, the port geometry is chosen with the length and width representing the waveguide and a height of 15 mm.The waveguide port is depicted as a shape of a horn with the detailed dimensions shown in Fig.5a and c.It should be mentioned that an internal boundary is added to the model to represent the door of the microwave with a length of 22.5 mm in z-direction, as shown in Fig.5a.The sample is included in the design as a cylinder with a diameter of 50 mm and a length of 100 mm to represent the UCSsized samples in the cavity.Three extra geometries are designed to consider a core with different material properties in the middle of the sample representing the microwave absorbent minerals.To evaluate the temperature distribution and electric field inside the sample after microwave treatment, a cross-section is considered that cuts the sample in half and is parallel to xy plane.As for the initial conditions, the temperature is set at 293.15 K, and both the electric and magnetic fields are set at 0.
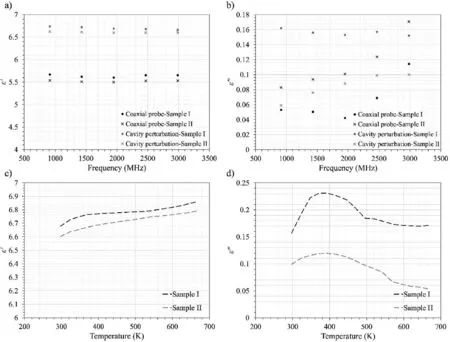
Fig.6.Comparison between the results of the coaxial probe and cavity perturbation methods at different frequencies for(a)Real part,and(b)Imaginary part of the permittivity.The temperature dependency of (c) Real part, and (d) Imaginary part of the permittivity measured using the cavity perturbation method.
The geometry is discretized using tetrahedral elements.The details of the mesh independency analysis are provided in Ahmadihosseini et al.(2022), which includes the final size criteria with the maximum element size of 18 mm,minimum element size of 0.923 mm,and maximum element growth of 1.35.This creates a total of approximately 660,000 tetrahedral elements for the whole geometry.
3.Results and discussion
3.1.Permittivity properties analysis
To measure the relative permittivity of the rock using the methods described in Section 2.1.1, two samples (Sample I and Sample II) are chosen randomly.First, the coaxial probe is employed to measure the dielectric properties of each sample.The measurement is performed at three different locations for each sample and the average value is used as the representative of the sample.Afterward, a smaller cylindrical sample proper for the cavity perturbation method is drilled from each of the two samples and the measurement of the dielectric properties is performed using the second method.The results of the measurements are shown in Fig.6.
Fig.6a depicts the real part of the permittivity of the two rocks captured using two measurement methods.The values obtained by the cavity perturbation method are larger than those by the coaxial probe method in all the frequencies.This could be due to the imperfect contact between the surfaces of the probe and the rock.Furthermore,the results show that there is no significant change in the real part of the permittivity when the frequency changes.In summary,at the frequency of 2.45 GHz,the average value of all four measurements of the real part of the permittivity is 6.11.
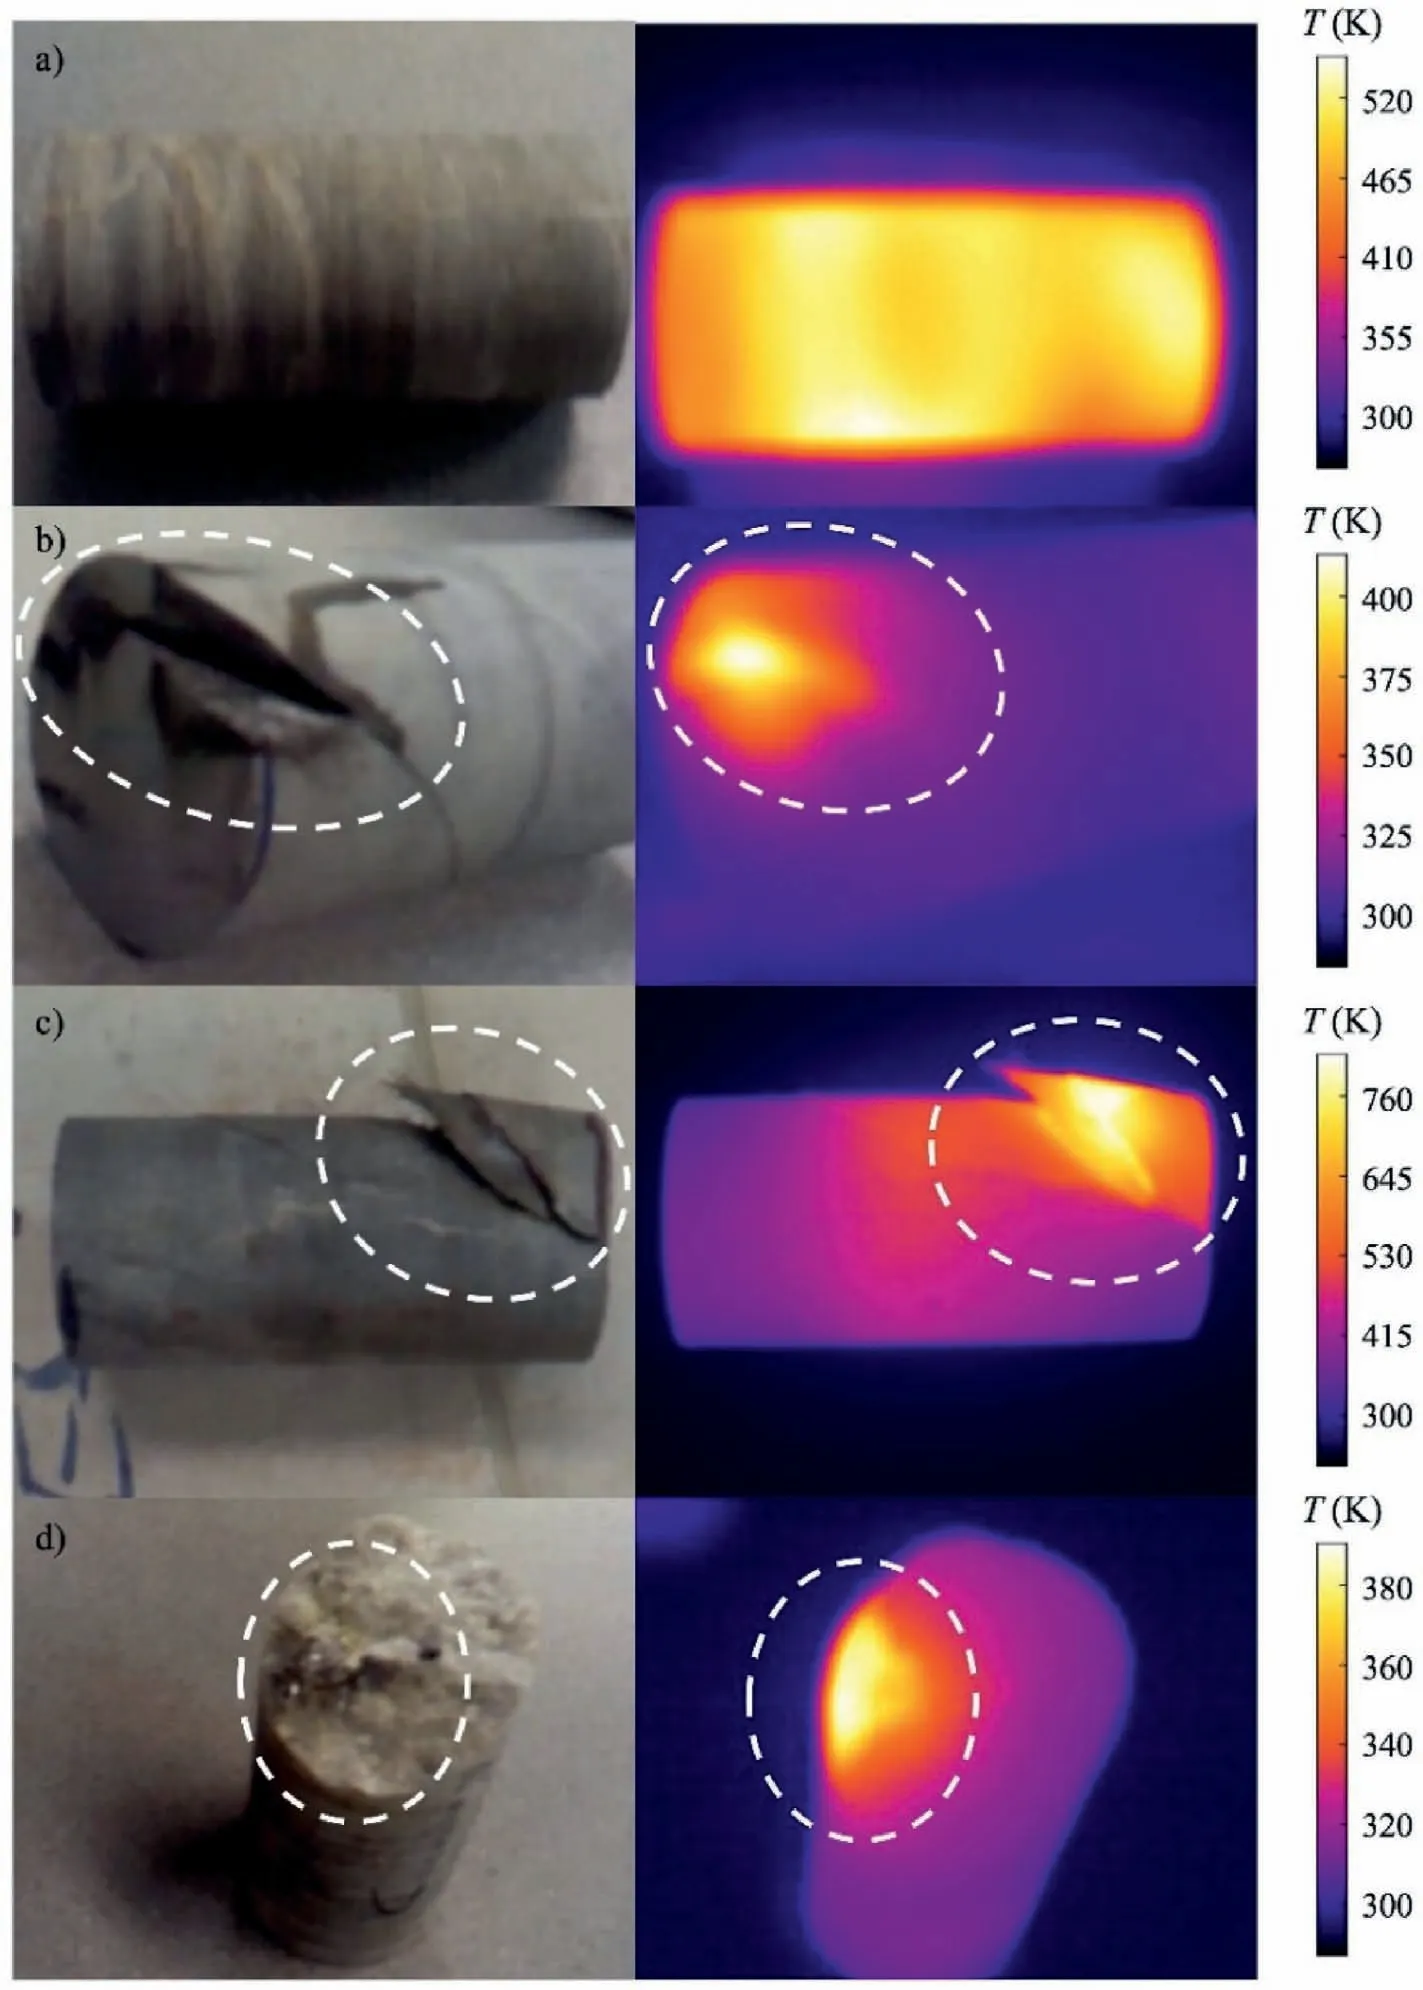
Fig.7.Different types of heat distribution after microwave treatment with 3 kW: (a) Distributed heating; and (b-d) Concentrated heating.
Fig.6b compares the imaginary part of the relative permittivity measured using the two probes for the selected two samples.Even though the same samples are used for the measurement of dielectric properties, there is a noticeable difference between the captured values between the two methods.The difference is more significant in Fig.6b, which compares the imaginary part of the permittivity at different frequencies.The trends of the charts in Fig.6b are more irregular compared to the real part of the permittivity shown in Fig.6a.The results of the coaxial probe show that the values of the imaginary part of the permittivity increase when the frequency increases.However,for the cavity perturbation method,while the same trend can be observed for Sample II,there is no significant change in the imaginary part of the relative permittivity for Sample I when the frequency changes.Another explanation for the difference between the two measurement methods is the fact that the Rhyolite rocks used in this study are weak microwave absorbers.This fact adds further error in the results presented by the coaxial probe.The results of Fig.6b shows that the average value of the imaginary part of the permittivity at the frequency of 2.45 GHz is 0.112 with an approximate range of 0.06-0.18.
The effect of temperature on the real and imaginary parts of the permittivity is shown in Fig.6c and d.The results of the permittivity at high temperatures are captured only using the cavity perturbation method.The charts for samples I and II have a noticeable difference due to the heterogeneous nature of the rocks used in this study.Fig.6c shows that there is an overall increasing trend in the real part of the permittivity for both samples when the temperature increases.However,this trend is different for the imaginary part as there is a peak in the values at 380 K approximately for both samples.In other words, the values for the imaginary part of the permittivity increase until 380 K to a maximum of approximately 0.23 and beyond the peak temperature,the values start to decrease.The following points can be deduced by comparing the two methods of measuring the relative permittivity of the rocks.
(1) Even though the coaxial probe is an appropriate method to capture the permittivity of the solid materials, establishing the perfect contact between the surfaces of the rocks and the probe is rather difficult;
(2) The coaxial probe is easier and quicker to employ for permittivity measurements;
(3) The coaxial probe provides the average value of the permittivity surrounding the contact surface of the rock and the probe, while cavity perturbation can provide more detailed information since it requires smaller samples;
(4) Using the cavity perturbation method for the heterogeneous samples is time-consuming and expensive as it requires the measurement of several samples, and directions, etc.;
(5) The cavity perturbation method can provide information at higher temperatures while the coaxial probe can only be used at room temperature;and
(6) For the samples that are weak microwave absorbers, the cavity perturbation method has superiority over the coaxial probe measurements.
Considering the advantages and disadvantages of each method,it is up to engineers to make the decision on which method to use for different microwave applications.
3.2.Failure mechanisms due to microwave treatment
The samples are exposed to microwave power of 3 kW for all the experiments.For each test, the exposure time is continued until a major failure occurs.The thermal images taken from the samples after the microwave treatment show two general forms of distributed and concentrated heating as shown in Fig.7a, and Fig.7b-d, respectively.In the distributed heating, the whole sample is heated uniformly, while in concentrated heating there is a major heating zone where the failure initiates.The visual observation also confirms extreme microwave absorption and accordingly burning of some minerals in the rocks failing with concentrated heating.Fig.8 shows the specific burning spots of the samples after microwave irradiation.According to Tables 1-3, this burning can be related to some of the minerals in the rocks with high microwave absorption,such as pyrite.In general,the samples with concentrated heating fail at a shorter exposure time compared to the distributed heating.
To further evaluate the distributed and concentrated heating,the cumulative percentage of the samples that fail at different exposure times is shown in Fig.9a.For instance,approximately 78%of the samples failed before 240 s of microwave exposure time with a power of 3 kW.In Fig.9a, two major steps can be observed.The first and second steps start at approximately 20 s and 80 s,respectively.The experimental observations with the help of thermal images showed that the first step is the transition between concentrated and distributed heating.In other words, the general trend of the failure modes due to microwave heating shows the samples that fail before the first step follow the concentrated heating, while the samples that fail after the first step follow the distributed heating.Therefore, this step is used to differentiate between the two failure modes during microwave heating.
It has been shown that there is a correlation between HOME and WOME parameters during microwave treatment (Hassani et al.,2020).They used basalt as the main rock to investigate this theory.However, basalt is considered a relatively homogeneous rock that is treated in the same manner as distributed heating.This theory has been further investigated in this study for both sets of concentrated and distributed heating.Therefore, Fig.9a can be divided into two zones, Zone 1 and Zone 2, which are the representatives of concentrated and distributed heating.The correlation between HOME and WOME has been evaluated for both zones and it is observed that the results for Zone 2 show a good correlation with R2of more than 0.8 (Fig.9b), while the results for the concentrated heating in Zone 1 are not correlated in any meaningful way.Moreover, the comparison between the two zones shows that the average WOME in Zone 1 is 6.28%/kW h/ton while this value is 0.46%/kW h/ton which shows over 10 times better efficiency.
Concerning the experimental results in Fig.9b,two data points are with HOME values of more than 40%deviated from the general trendline.It is believed that the results are related to potential sources of errors during the experiments, especially the calorimetric study for the samples with high HOME value and the distinction between distributed and concentrated heating for some of the samples.In other words,when the energy absorption of the samples is high, the potential heat loss increases during the treatment and calorimetric study, which is not included in the calculation and can add to the error.Furthermore, in some cases, the distinction between the concentrated and distributed heating is difficult to observe because there is a heat concentration in a part of the sample but the general rock body is also heated considerably.In this case,it is hard to judge whether the sample has failed based on distributed or concentrated heating which can increase the error in the calculations.
3.3.Heat absorbing minerals in the rock
In this section, the comparison between the concentrated and distributed heating is further investigated using the developed numerical model.A series of parametric studies has been conducted to evaluate the effect of heat absorbing minerals on the efficiency of the microwave treatment of rocks.To represent different sizes of heat absorbing minerals in the sample, three different geometries are considered in the modeling process as mentioned in Section 2.2.3.Then,different permittivity values have been assigned to the main rock and the mineral core.Subsequently,the energy absorption of the sample is computed using the numerical model after an exposure time of 10 s with a power of 3 kW.The temperature distribution of the sample on the defined cross section is used to compare the different cases.This parametric study has been performed in two parts.In the first part, it is assumed that the composition of the mineral core is of the same type as the main rock.Therefore, for the main rock, the average value of the real and imaginary parts of the permittivity (′= 6.11 and′′=0.112)is assigned.However,for the mineral core,while the average value is used for the real part of the permittivity(′=6.11),three different values are chosen for the parametric study on the imaginary part of the permittivity (′′= 0.06, 0.12, and 0.18).The results of the parametric study are depicted in Fig.10.It can be observed that in all the nine cases shown in Fig.10, there is no significant change in the average temperature of the sample.As for the maximum temperature,no significant change can be observed in Fig.10a and b.There is a major change in the maximum temperature of the sample(more than 85 K)when the largest mineral core size is considered in the model and′′is increased from 0.06 to 0.18 (Fig.10c).
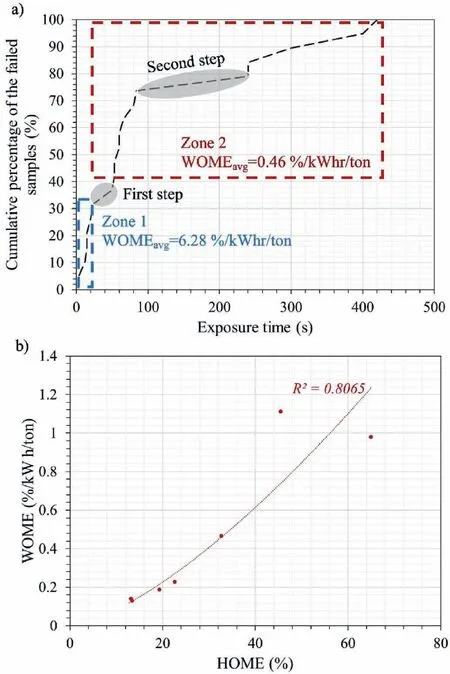
Fig.9.(a)Exposure time when the samples fail due to microwave power of 3 kW and the division of the samples’ failure into Zone 1 and 2; and (b) The relation between HOME and WOME for samples that fail in Zone 2.
In the second part, the parametric study is expanded to assign the mineral cores and the permittivity values of specific microwave absorbing minerals.In this study, magnetite and pyrite are considered as examples of strong microwave absorbing minerals.According to the study of Zheng et al.(2020b), the real and imaginary parts of the permittivity for magnetite are′= 14.5 and′′= 2.5, respectively.These values for pyrite are′= 8.25 and′′= 1, representing real and imaginary parts of the permittivity,respectively.For all the cases, the average permittivity values(′= 6.11 and′′= 0.112) are assigned to the main rock while the permittivity values of the core change based on the assumed mineral.The comparison is also performed at different core sizes.As displayed in Fig.11a,in terms of the smallest core size,when the strong microwave absorbing minerals are added to the model,there is no significant change in the average temperature of the whole sample, but the maximum temperature can increase by more than 30 K and 180 K when pyrite and magnetite are the mineral cores,respectively.Fig.11a and b shows that increasing the core size can increase the maximum temperature up to 850 K and 1550 K when pyrite and magnetite are the core minerals, respectively.It should be mentioned that there is no significant change in the average temperature of the sample with the pyrite core; however, for the magnetite core, approximately a 10 K increase can be observed.Moving to a larger core size from Fig.11a to b increases the maximum temperature.Fig.11b and c shows that increasing the core size does not always result in an increase in the temperature.For instance, the maximum and the average temperatures are decreased by 550 K and 9 K,respectively when the magnetite core size diameter increases from 15 mm to 20 mm.Fig.11 depicts a significant change in the temperature distribution in the sample after microwave treatment when the pyrite and magnetite cores are added.Overall, the temperature increase is more uniformly distributed throughout the sample when there is no mineral core,and it is more concentrated in the core when pyrite or magnetite is assumed in the model.
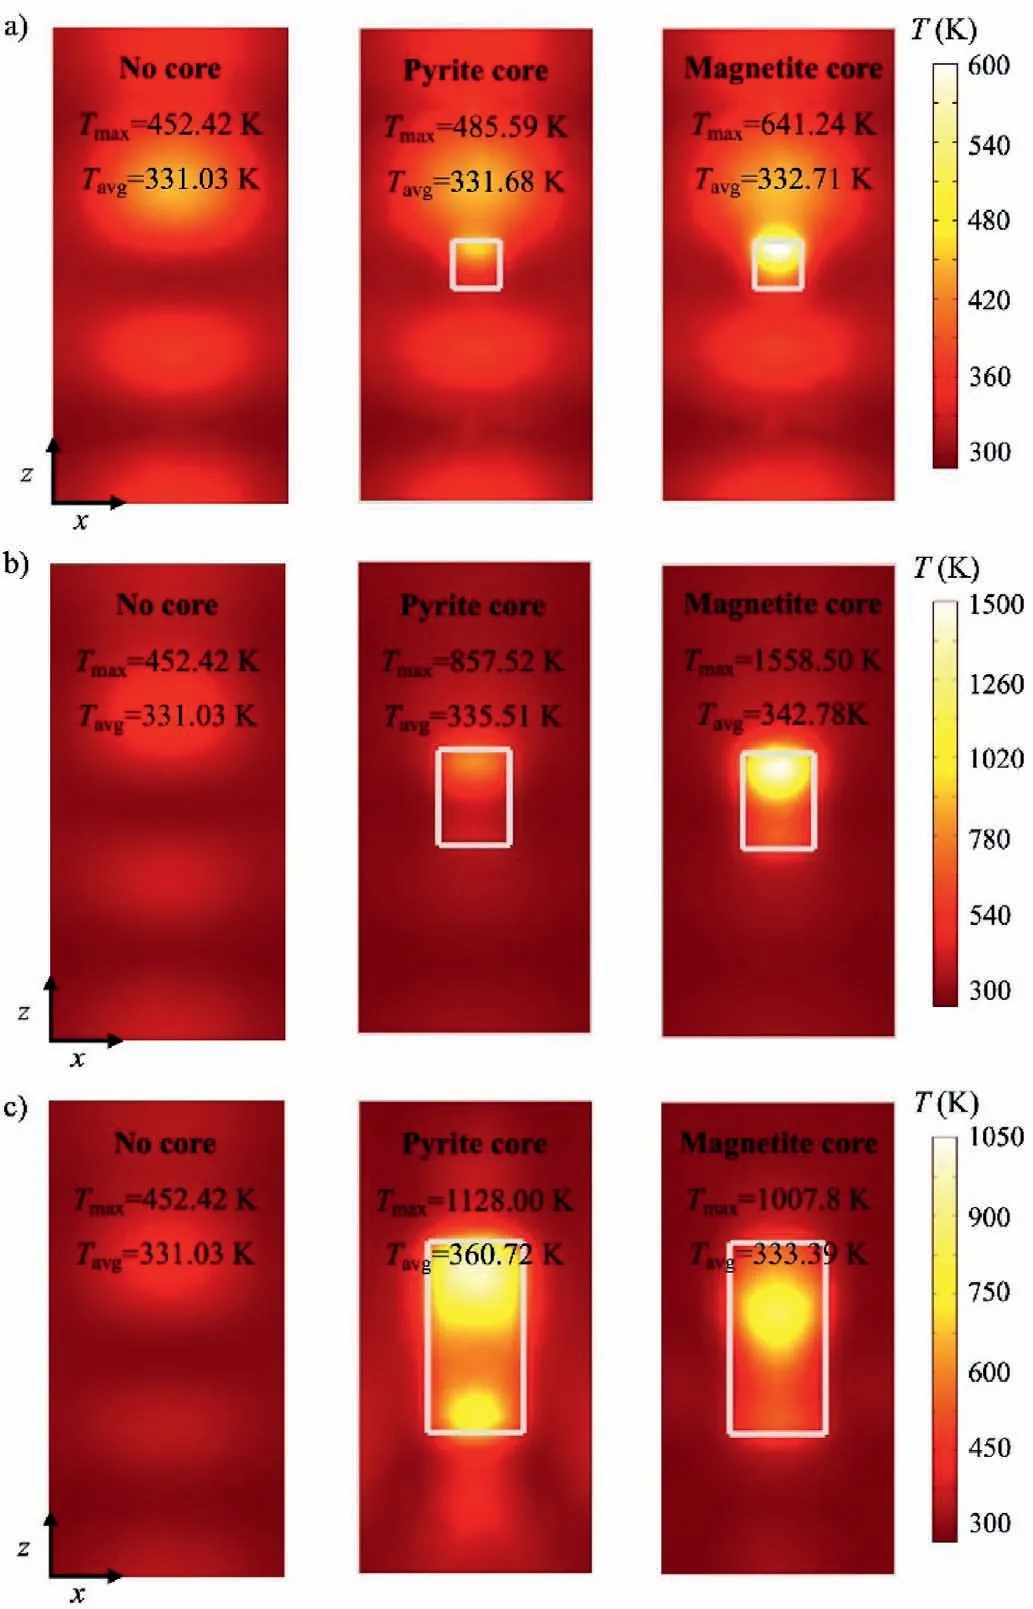
Fig.11.The effect of considering different core minerals inside the sample on the energy absorption and temperature distribution after microwave treatment for different core size with the diameters of (a) 10 mm, (b) 15 mm and (c) 20 mm.
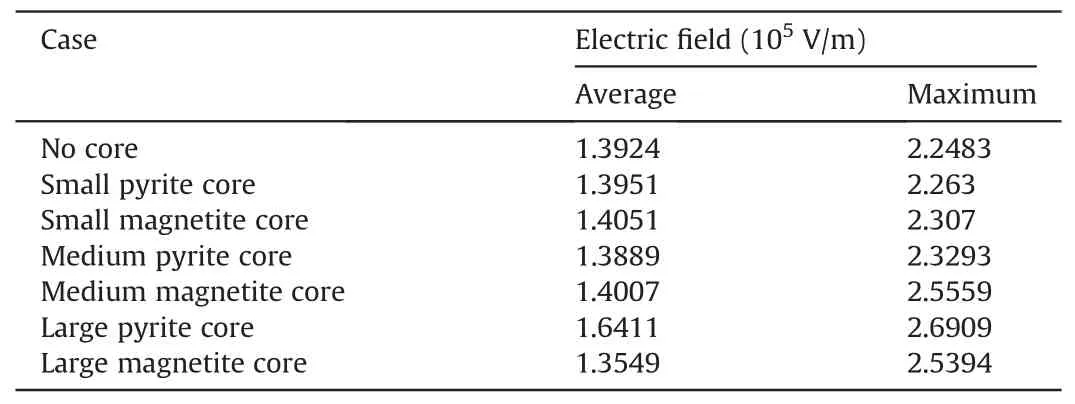
Table 6 The average and maximum electric field intensities in the cavity.
To further evaluate the effect of including microwave absorbing minerals in the rock, the electromagnetic field distribution in the cavity during microwave heating is investigated.As mentioned in Eq.(8), one of the main parameters affecting the heating rate during microwave irradiation in non-magnetic materials is the electric field intensity.Table 6 summarizes the minimum,maximum, and average electric fields in the cavity when the mineral core is added to the model in different sizes.It is evident that adding a mineral core to the material can drastically change the electric field intensity as there are major changes in the average and maximum electric field intensities in the cavity,which can be up to 17%in some cases.To further evaluate the effect of adding mineral cores on the electromagnetic distribution, the electric field intensities in the cross section of the numerical model for the whole cavity and the sample are shown in Figs.12 and 13, respectively.There is a significant effect for adding the mineral cores which drastically changes the electric field distribution in the cavity and the sample.The change in the electric field results in a change in the heating rate and temperature distribution.These data further support the results as depicted in Fig.11.
It should be noted that only the heat transfer and electromagnetic distribution equations are solved in the current model and the damage caused by microwave treatment in the model is not calculated.However, as shown in Figs.10 and 11, it is shown that when a mineral with high microwave energy absorption exists in the model, with the same energy input, a more significant and concentrated increase in temperature can be achieved.Thus,there will be a higher expansion rate and more cracks,resulting in a high strength reduction.This understanding is very important for mining engineers as the efficiency of the microwave-assisted rock fragmentation method can be much higher for heterogeneous rocks (especially when the rock constitutes microwave absorbing minerals) compared to homogeneous samples.
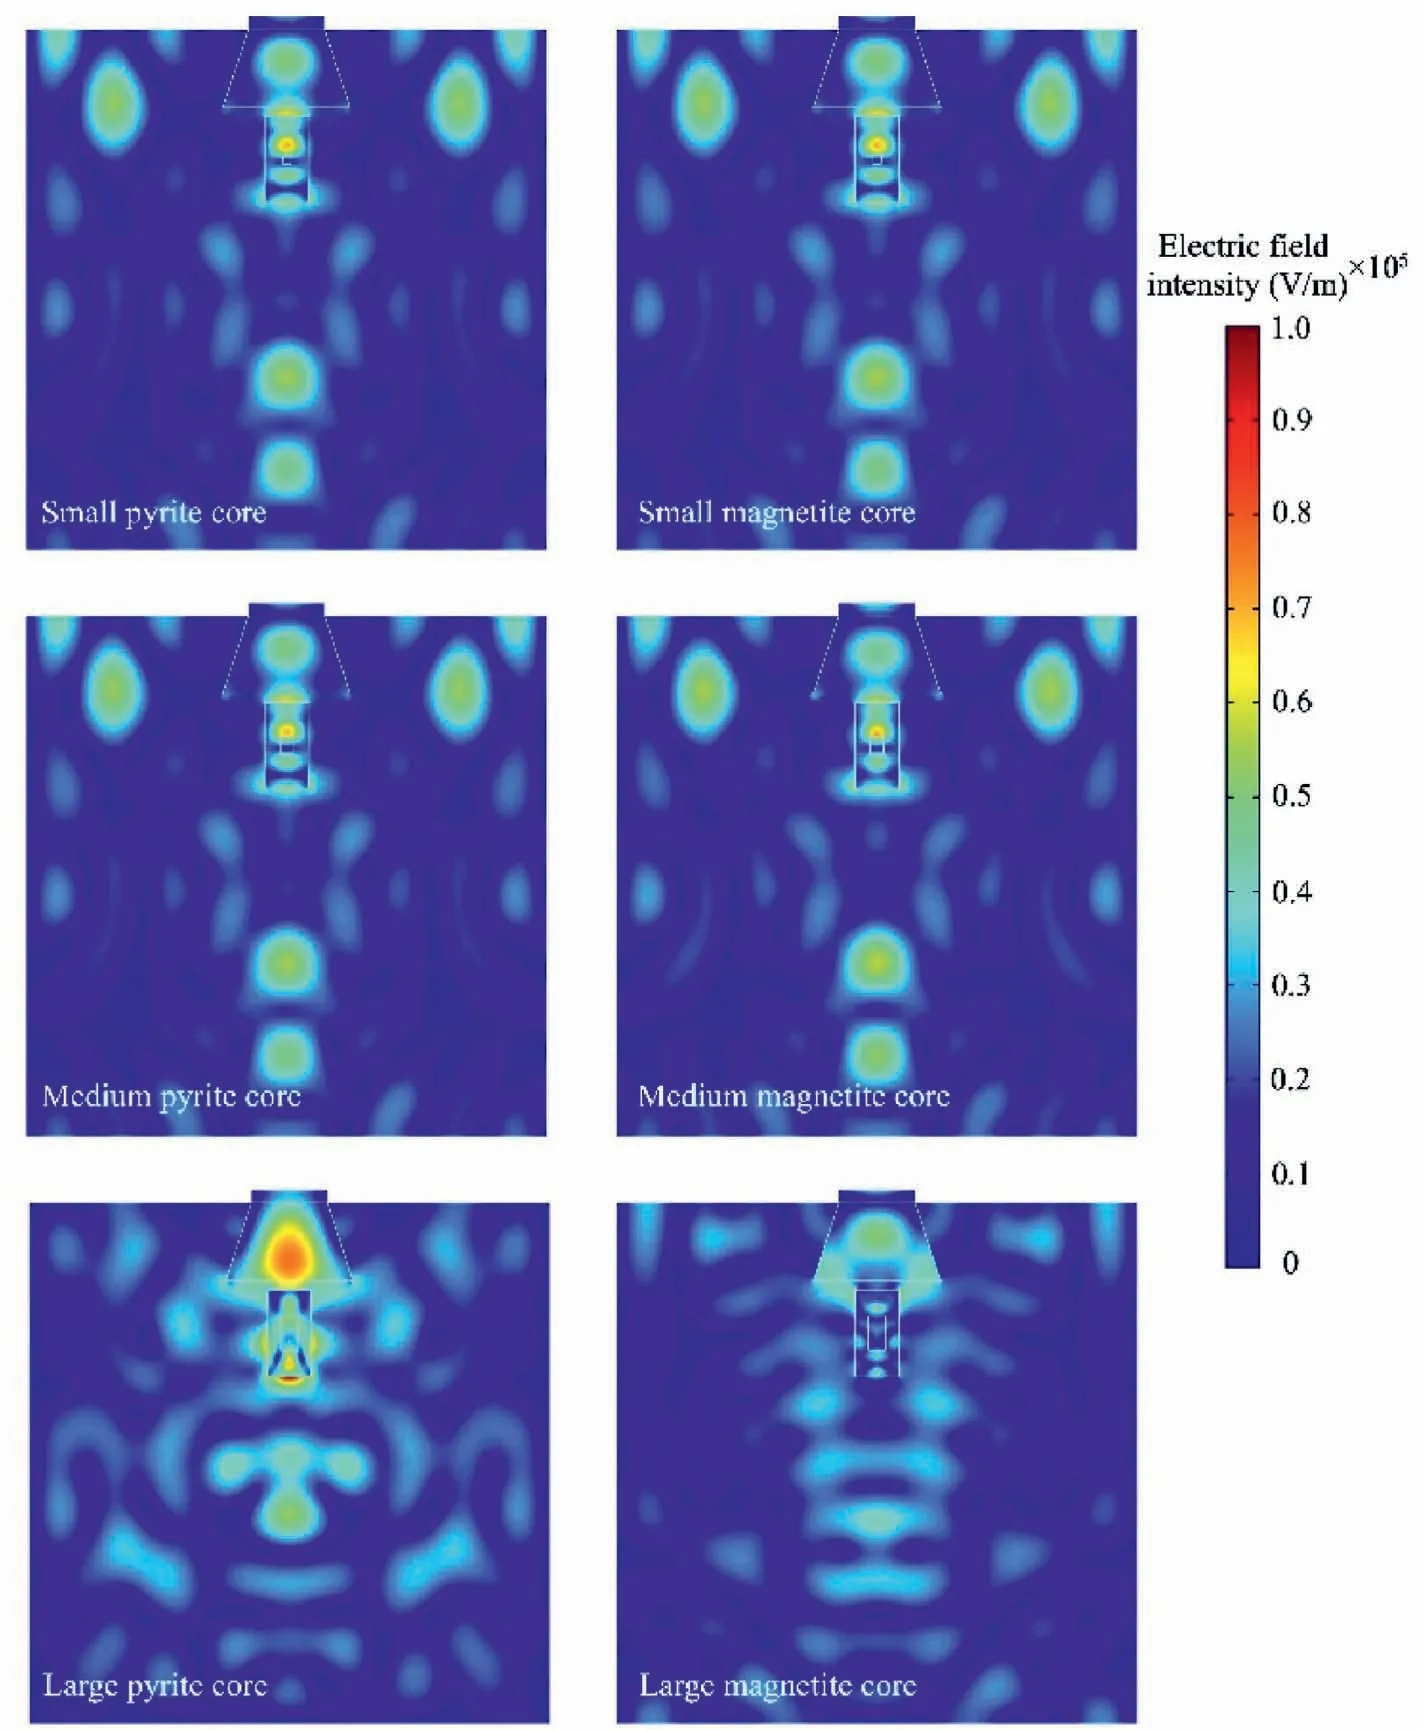
Fig.12.The electric field distribution in the cross section of the cavity after microwave radiation with a power of 3 kW.
4.Conclusions
This study evaluated different failure mechanisms of rocks due to microwave treatment.To understand the behaviors of the rhyolite rocks during microwave treatment, their relative permittivity is investigated using both coaxial probe and cavity perturbation methods.It is concluded that the coaxial probe is simpler and faster to implement,while the cavity perturbation can provide results with higher accuracy at different temperatures.
A novel experimental procedure is introduced to evaluate the failure of the samples only by microwave energy and without any external mechanical forces.It is concluded that the UCS-sized samples follow two patterns of distributed and concentrated heating due to microwave treatment.The heating patterns result in their related failure mechanisms.The concentrated heating failure mechanism is caused by a microwave absorbent mineral inside the sample.Concentrated heating has over 10 times higher efficiency compared to distributed heating having an average WOME value of 6.28%/kW h/ton, which is the highest reported value in the literature for the UCS-sized samples.
The developed numerical model is employed to further evaluate failure mechanisms caused by distributed and concentrated heating.It is shown that even a small heterogeneity in a rock such as a 0.12 difference in the′′of the mineral core can change the maximum temperature by over 85 K.Moreover, having a small microwave absorbing mineral core like magnetite or pyrite in the rock specimen can change the heat distribution drastically and create concentrated heating.In some cases, the maximum temperature of the sample is increased by more than 1000 K with the same input energy.
Declaration of competing interest
The authors declare that they have no known competing financial interests or personal relationships that could have appeared to influence the work reported in this paper.
Acknowledgments
The authors extend their appreciation to the Deputyship for Research & Innovation, Ministry of Education in Saudi Arabia, for funding this research work through the project number (IFPRC-036-135-2020) and King Abdulaziz University, DSR, Jeddah, Saudi Arabia.
 Journal of Rock Mechanics and Geotechnical Engineering2023年10期
- Journal of Rock Mechanics and Geotechnical Engineering的其它文章
- Analytical solutions for the restraint effect of isolation piles against tunneling-induced vertical ground displacements
- Characterizing large-scale weak interlayer shear zones using conditional random field theory
- Displacement-based back analysis of mitigating the effects of displacement loss in underground engineering
- Investigation of long-wavelength elastic wave propagation through wet bentonite-filled rock joints
- Mechanical properties of a clay soil reinforced with rice husk under drained and undrained conditions
- Evaluation of soil fabric using elastic waves during load-unload
