
Exploring overweight and obesity beyond body mass index:A body composition analysis in people with and without patellofemoral pain
2023-09-26 09:00AmndSchenttoFerreirBenjminMentiplyBincTordMrcellFerrzPzzinttoiocolisdeAzevedoDniloDeOliveirSilv
Amnd Schentto Ferreir,Benjmin F Mentiply ,Binc Tord ,Mrcell Ferrz Pzzintto ,Fáio Mícolis de Azevedo ,Dnilo De Oliveir Silv
a Department of Physiotherapy,School of Science and Technology,Sao Paulo State University(UNESP),Presidente Prudente 19060-900,Brazil
b La Trobe Sport and Exercise Medicine Research Centre,School of Allied Health,Human Services and Sport,La Trobe University,Melbourne,VIC 3086,Australia
Abstract Background: We compared body mass index (BMI),body fat,and skeletal muscle mass between (1) a mixed-sex nonathletic cohort of people with patellofemoral pain (PFP) and pain-free people,and (2) a nonathletic cohort of people with PFP and pain-free people subgrouped by sex(i.e.,men and women with PFP vs.pain-free men and women).Methods:This cross-sectional study included 114 people with PFP(71 women,43 men)and 54 pain-free controls(32 women,22 men).All participants attended a single testing session to assess body composition measures,which included BMI,percentage of body fat (%BFBioimpedance),and skeletal muscle mass (both assessed by bioelectrical impedance analysis),and percentage of body fat (%BFSkinfold) (assessed by skinfold caliper analysis).A one-way univariate analysis of covariance(age and physical activity levels as covariates)was used to compare body composition measures between groups(i.e.,PFP vs.pain-free group;women with PFP vs.pain-free women;men with PFP vs.pain-free men).Results: Women with PFP presented significantly higher BMI,%BFBioimpedance,and %BFSkinfold,and lower skeletal muscle mass compared to pain-free women (p -0.04;effect size:‒0.47 to 0.85).Men with PFP and men and women combined had no differences in BMI,%BFBioimpedance,%BFSkinfold,and skeletal muscle mass compared to their respective pain-free groups(p>0.05).Conclusion:Our findings indicate that BMI and body composition measures should be considered as part of the evaluation and management of people with PFP,especially in women,who have demonstrated higher BMI and body fat and lower skeletal muscle mass compared to pain-free controls.Future studies should not assess body composition measures in a mixed-sex population without distinguishing men participants from women participants.
Keywords: Body composition;Body mass index;Patellofemoral pain syndrome;Skinfold thickness
1.Introduction
The prevalence of overweight and obesity has been growing alarmingly across the world.1In the past 4 decades,the number of adults with obesity worldwide has increased more than 6 times(100 million in 1975 to 671 million in 2016),1whereas 1.3 billion adults (1 in 4) were considered overweight in 2016.1,2Despite increasing the predisposition to multiple comorbidities,3,4overweight and obesity are also detrimental to the musculoskeletal system,5-7likely via both systemic and mechanical effects.8,9Systemic effects include the production by adipose tissue of adipokines such as leptin10and the amplification of the inflammation profile through an increase in the production of interleukin-611and tumor necrosis factoralpha.12Both of these systemic changes are associated with deleterious effects to patellar cartilage (e.g.,reduced patellar cartilage volume) and pain.13,14Mechanically,the one joint most affected by overweight and obesity is the patellofemoral joint,which is subjected to loads 2 to 11 times bodyweight during stair ascent,squatting,and running activities.15-17
Patellofemoral pain (PFP),one of the most common knee conditions presented to medical centers,18,19is characterized by diffuse anterior knee pain,especially during patellofemoral joint-loading activities.20It has an annual prevalence as high as 22.7%in the general population,21and it is often suggested as a precursor of patellofemoral osteoarthritis.22-25Findings from a recent systematic review26indicate that people with PFP have higher body mass index (BMI) than pain-free controls.However,longitudinal findings suggest that high BMI does not seem to be a risk factor for PFP.26,27It is possible that due to pain associated with provoking activities,20people with PFP reduce their physical activity levels,28leading to increases in BMI.Another reasonable explanation for these conflicting findings is that many of the cross-sectional studies26and all the prospective studies26,27in these systematic reviews26,27have included only adolescents,runners,the military,or athletes.No research related to overweight or obesity has been undertaken so far in a general,nonathletic population,which represents one of the most prevalent groups affected by PFP.21
Most studies have used BMI as a measure of overweight and obesity.However,measurements of BMI do not consider important aspects of body composition (i.e.,the distribution of body fat and skeletal muscle mass) that seem to be linked to many musculoskeletal disorders,29-32including PFP.33Therefore,the assessment of body composition may provide additional information about the condition.In a recent study,we found that higher body fat and lower skeletal muscle mass,but not BMI,were associated with both poor functional capacity and impaired knee and hip strength in people with PFP.33Despite these associations,no study has explored whether people with PFP have higher body fat and lower skeletal muscle mass than pain-free controls recruited from a similar social environment.If people with PFP have higher body fat and lower skeletal muscle mass,it may indicate the need to shift the currently considered best-care for PFP(e.g.,hip and knee exercises,foot orthoses,taping,and patient education)34-36to a multidisciplinary approach,including weight-loss programs.37
Another limitation of BMI research in PFP is that previous studies have not accounted for sex differences.In one systematic review,26almost 60%of the participants with PFP(totaln=937) included in the meta-analysis comparing BMI between people with PFP and pain-free controls were women.Additionally,only 6 of the 33 cross-sectional studies included in the review subgrouped their samples by sex,26whereas 7 studies included women only.A total of 20 studies included a mixed-sex sample (i.e.,did not report women and men separately).Because women and men with PFP present different impairments (e.g.,different hip strength deficits,manifestations of pain sensitization,different kinematic risk factor profiles for the development of PFP)38-41and may have different distributions of body composition,42women and men may represent distinct subgroups within PFP.Therefore,the evaluation of the body composition in people with PFP stratified by sex may provide additional and novel information about assessment and treatment strategies for this population.
Body composition can be assessed by a number of methods,which vary in cost,feasibility,and accuracy.43,44Because there is no direct method of measuring body composition(except for cadaveric dissection),more practical indirect methods have been used,such as bioelectrical impedance and skinfold thickness.43,44Both methods are time-efficient and cost-effective and are feasible in clinical and field-based settings.43-45Although some studies have identified strong correlation (r=0.78-0.96)46-48between skinfold thickness and bioelectrical impedance analysis for estimating the percentage of body fat,others have suggested that both measures cannot be used interchangeably.49Therefore,using both methods to assess body composition in a nonathletic cohort may provide different and additional information.
The aims of our study were to compare:(1)BMI,body fat,and skeletal muscle mass between a mixed-sex nonathletic cohort of people with PFP and pain-free people;and(2)BMI,body fat,and skeletal muscle mass between a nonathletic cohort of people with PFP and pain-free people subgrouped by sex (i.e.,women and men with PFPvs.pain-free women and men).We hypothesized that:(1)all PFP groups(i.e.,all participants,women only,and men only)would present higher BMI and body fat and lower skeletal muscle mass compared with their respective pain-free groups;and (2) the effect size for differences between women with PFP and pain-free women would be larger than for the other groups with PFP compared to pain-free controls(i.e.,all participants and men only).
2.Methods
2.1.Participants
Participants between 18 and 35 years of age were recruited between October 2018 and November 2019 via advertisements at universities public parks and posts on social media.The advertisements invited people with and without knee pain to attend a functional assessment of the knee and body composition offered by the university (Supplementary Fig.1).To assess their eligibility criteria,all potential participants were invited to attend a clinical examination by an experienced physiotherapist who had more than 7 years of experience in assessing people with PFP.
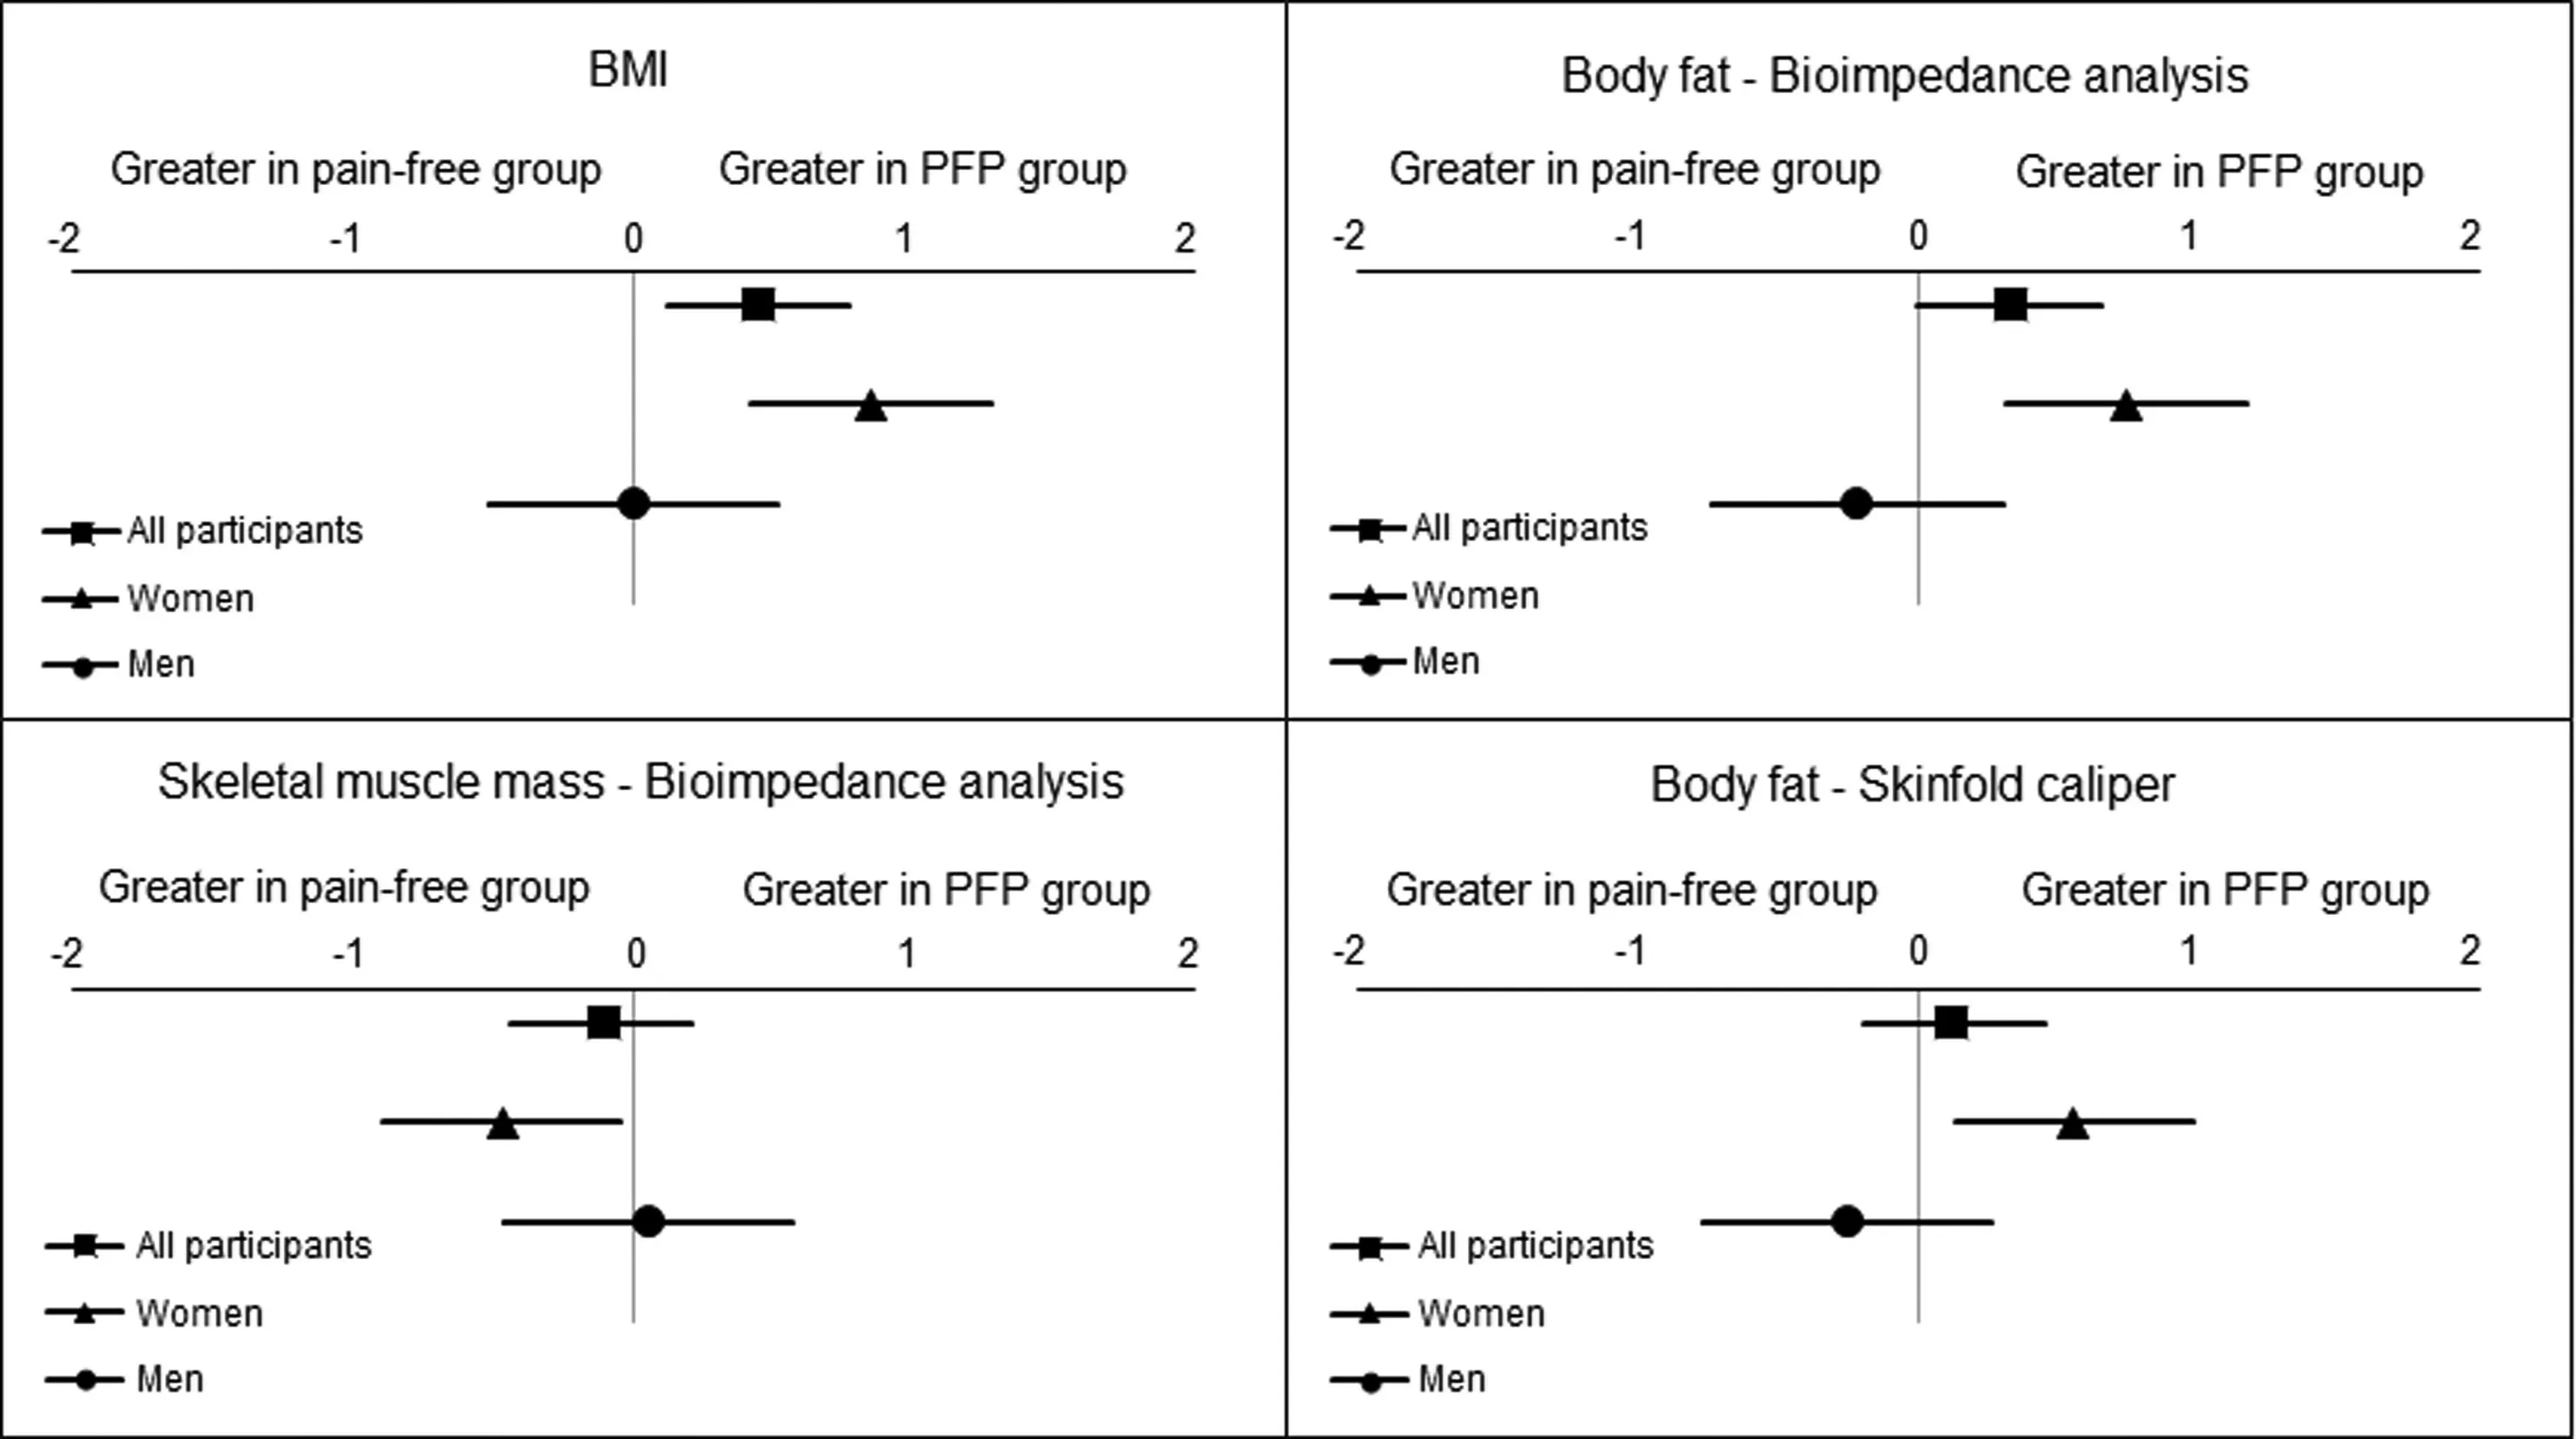
Fig.1.Effect sizes for all participants (PFP vs.pain-free),women(women with PFP vs.pain-free women),and men(men with PFP vs.pain-free men)for body composition measures.Non-normally distributed variables were log-transformed.(All participants:log BMI,log skeletal muscle mass measured by bioimpedance analysis,log %BFSkinfold.Women: log BMI.Men:log BMI,log %BFBioimpedance).%BFBioimpedance=percentage of body fat measured by bioimpedance analysis;%BFSkinfold=percentage of body fat measured by skinfold caliper;BMI=body mass index;PFP=patellofemoral pain.
Participants were included in the PFP group if they fulfilled the following criteria,which were based on the most recent international consensus statement concerning PFP diagnosis:20(1) anterior knee pain for at least the past 3 months;(2) pain aggravated by at least 2 of the following activities: running,walking,hopping,landing,squatting,stair negotiation,kneeling,or prolonged sitting;and (3) worse pain level in the previous month,corresponding to at least 30 mm on a 100 mm visual analog scale.50Participants were excluded from the PFP group if they (1) presented a history of surgery on any lowerlimb joint;(2) had a history of patellar subluxation;(3) had clinical evidence of meniscal injury51or ligament instability;52(4) had back,hip,ankle,or foot pain;or (5) had received current or recent (at least 6 months prior to data collection)physiotherapy treatment for PFP.A subset of our sample with PFP is included in 2 previous studies that explored the implications of body composition in lower-limb strength (n=100)33and pain sensitization(n=114)53in people with PFP.
Pain-free participants were also recruited from the same population by means of the same recruitment strategies used to recruit the PFP group.To be included among the pain-free participants,they could not have (1) presented any current or past (for at least 1 year) symptoms of PFP,(2) had any traumatic injury (e.g.,ligament rupture),or (3) had any other neurological or musculoskeletal condition.
Ethical approval for this study was granted by the Sao Paulo State University Ethics Committee.Each participant provided written informed consent.
2.2.Procedures
Participants attended a single testing session during which all body composition measures (BMI,percentage of body fat,and skeletal muscle mass) were completed.All participants also completed the Baecke Habitual Physical Activity Questionnaire to assess their physical activity levels.54This questionnaire includes 16 questions comprising 3 domains: work activity,sports activity,and leisure activity.The physical activity level was determined by the sum of scores obtained for each domain,with higher scores indicating a higher physical activity level.Additionally,self-reported measures of pain(worst knee pain in the previous month on a 0‒100 mm visual analog scale) and duration of symptoms (months) were obtained for the participants with PFP.
2.3.Body composition measures
2.3.1.BMI
Height (cm) and body mass (kg) were measured to the nearest 0.1 cm and 0.1 kg (Welmy 110 CH;Welmy,Santa B-arbara d’Oeste,Sao Paulo,Brazil),respectively,with the subject wearing light clothing and no shoes.BMI was calculated as body mass(kg)divided by height(m)squared.
2.3.2.Bioelectrical impedance analysis
A bioelectrical impedance analyzer (Omron HBF 514C;OMRON Healthcare Inc.,Kyoto,Japan) was used to assess percentage of body fat (%BFBioimpedance) and percentage of skeletal muscle mass of all participants.Prior to the analysis,participants received instructions to fast for at least 2 h prior to the measurements,to avoid alcohol and caffeine consumption during the previous 24 h,and to not engage in vigorous exercise during the previous 12 h,given that any physiological change related to one of the previously mentioned factors could be a confounder for the bioimpedance measurement.55Testing was conducted according to the manufacturer’s instructions.Participants had to step on the foot electrodes barefoot and maintain an evenly distributed weight on the measurement platform while holding a pair of electrodes fixed on the display unit.Then,participants extended their arms in front of the chest,maintaining a steady position until measurements were completed.Body fat and skeletal muscle mass(expressed as a percentage of total body mass)were predicted using the manufacturer’s valid and reliable equations.56Reliability of the bioelectrical impedance analyzer has been reported to be high to very high (intraclass correlation coefficient=0.87 for women and 0.96 for men).Validity based on the correlation with Air Displacement Plethysmography(BodPod GS;COSMED Inc.,Chicago,IL,USA)has also been reported to be high (r=0.89 for women andr=0.94 for men).56
2.3.3.Skinfold caliper analysis
Skinfold thicknesses were measured with a scientific skinfold caliper(Cescorf,Porto Alegre,Rio Grande do Sul,Brazil)on the right side of the subject’s body.57-59Skinfold thickness was measured to the nearest 0.1 mm at the following anatomical sites,according to standard procedures:57-59(1) triceps:over the midpoint between the acromion process and the olecranon process;(2)biceps:at the same level as the triceps skinfold and directly above the center of the cubital fossa;(3)subscapular: approximately 20 mm below the tip of the inferior angle of the scapula,at an angle of about 45˚to the vertical;and (4) suprailiac: just above the iliac crest in the mid-axillary line.57-59First,the sites were marked on the skin with a dermatograph pencil.Then the skin was pinched up firmly between the thumb and forefinger and pulled away slightly from the underlying tissues before applying the calipers for the measurement.The same trained investigator made 3 measurements of skinfold thickness for each of the 4 anatomical sites.The mean value of the 3 measurements for each body site was used in the analysis.Test-retest reliability of the skinfold thickness measurements in all 4 sites has been reported to be very high(intraclass coefficient correlation:0.98 to 1.00).60Additionally,during pilot testing,the investigator performed skinfold thickness measurements on 30 different individuals within all BMI categories (normal weight,overweight,and obese) to ensure familiarity and ability to obtain the skinfold thickness measurements and avoid biases during data collection.After skinfold thickness measurements were obtained,body density was estimated according to sex and age using the Durnin and Womersley equation,which predicts body density from the log of the sum of skinfold thicknesses at all 4 sites.61Then,percentage of body fat (%BFSkinfold) was calculated based on body density by means of the Siri equation.62Previous studies have reported a good absolute agreement63and a strong correlation (r=0.86 for women andr=0.92 for men)64between percentage of body fat assessed by the Durnin and Womersley (and Siri) equations and dual-energy X-ray absorptiometry.63,64
2.4.Statistical analysis
A priorisample size calculation was performed using G*Power Statistical Power Analysis Software (Version 3.1;Universität Düsseldorf,Düsseldorf,Germany).A previous study comparing BMI of individuals with PFP and pain-free controls by sex subgroup was used to estimate the effect size.65A minimum sample size of 19 participants per group was indicated,based on a one-way analysis of variance design comparing 4 groups with a power level of 80%,an a level of 0.05,and an estimated effect size off=0.4.We aimed to include a larger sample size than the minimum required by our sample size calculation for BMI because we also included other measures of body composition.
Data were analyzed using the PASW statistics software(Version 18;SPSS,Chicago,IL,USA).The significance level was set at 0.05 for all statistical analyses.All measurements were assessed for normality and variance homogeneity using the Kolmogorov-Smirnov test and the Levene test (PASW statistics software),respectively.
Descriptive statistics for each measurement were obtained first.Normally distributed variables were reported as mean(SD),and non-normally distributed variables were reported as median(interquartile range(IQR)).Age,body mass,height,and physical activity levels were compared between PFP and pain-free groups(all participants and sex subgroups) using independentttests or Mann-WhitneyUtests,depending on the distribution of the data.Then,all body composition measures (BMI,%BFBioimpedance,percentage of skeletal muscle mass assessed by bioelectrical impedance analysis and %BFSkinfold) were compared between groups (PFP groupvs.pain-free group,women with PFPvs.pain-free women,men with PFPvs.pain-free men) using a one-way univariate analysis of covariance (ANCOVA),where age and physical activity levels were used as covariates on the basis of previously reported associations with both body composition measures26,66and clinical presentation of PFP.28,67Nonnormally distributed variables were log-transformed before ANCOVA analyses.Effect sizes (ES) were calculated(Cohend)68for all participants with PFPvs.all pain-free participants,for women with PFPvs.pain-free women,and for men with PFPvs.pain-free men.
3.Results
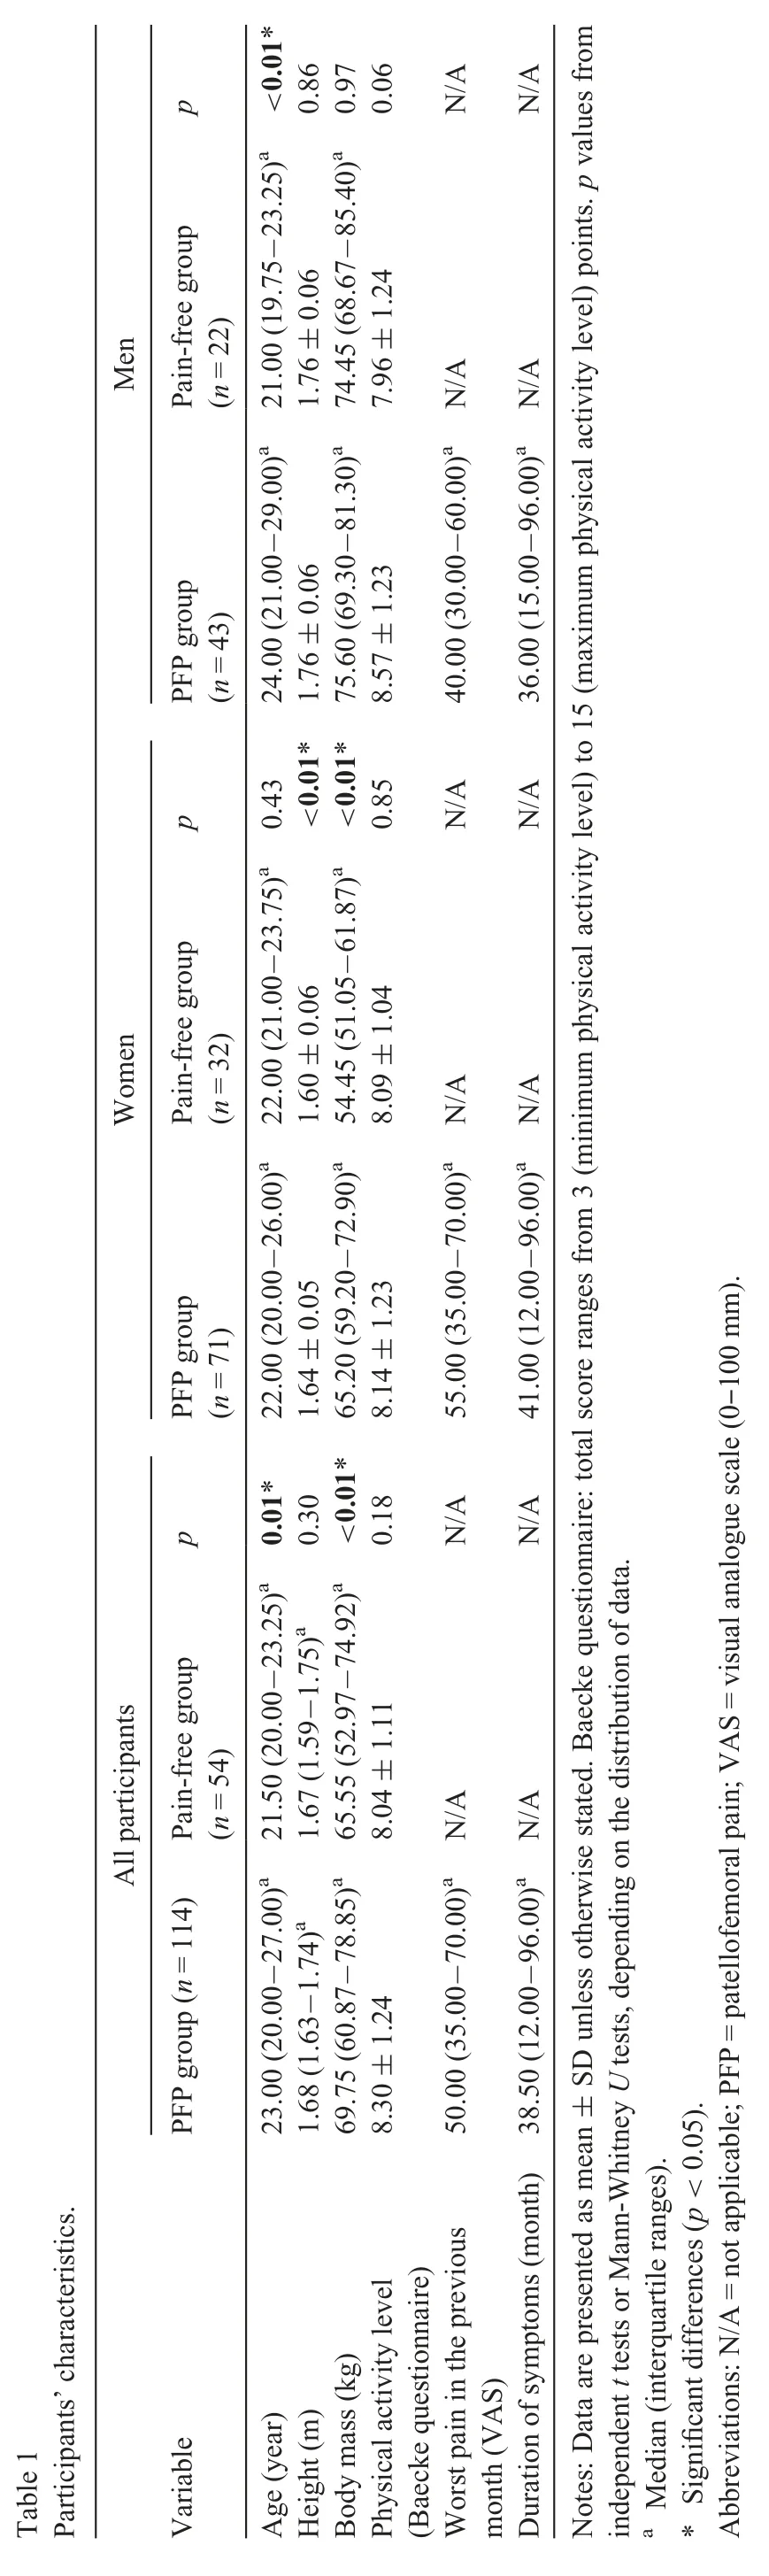
A total of 168 participants were included in the study,114 with PFP(71 women and 43 men)and 54 controls(32 women and 22 men).No differences in height and physical activity levels were observed between PFP and pain-free groups,but the PFP group presented with a significantly higher age and body mass than the pain-free group.When subgrouping by sex,no differences in age and physical activity levels were observed between women with PFP and pain-free women,but women with PFP presented with a significantly higher height and body mass than pain-free women.Additionally,no differences in height,body mass,or physical activity levels were observed between men with PFP and pain-free men,but men with PFP presented with a significantly older age than pain-free men.The characteristics of each group are summarized in Table 1.
3.1.All participants:PFP group vs.pain-free group
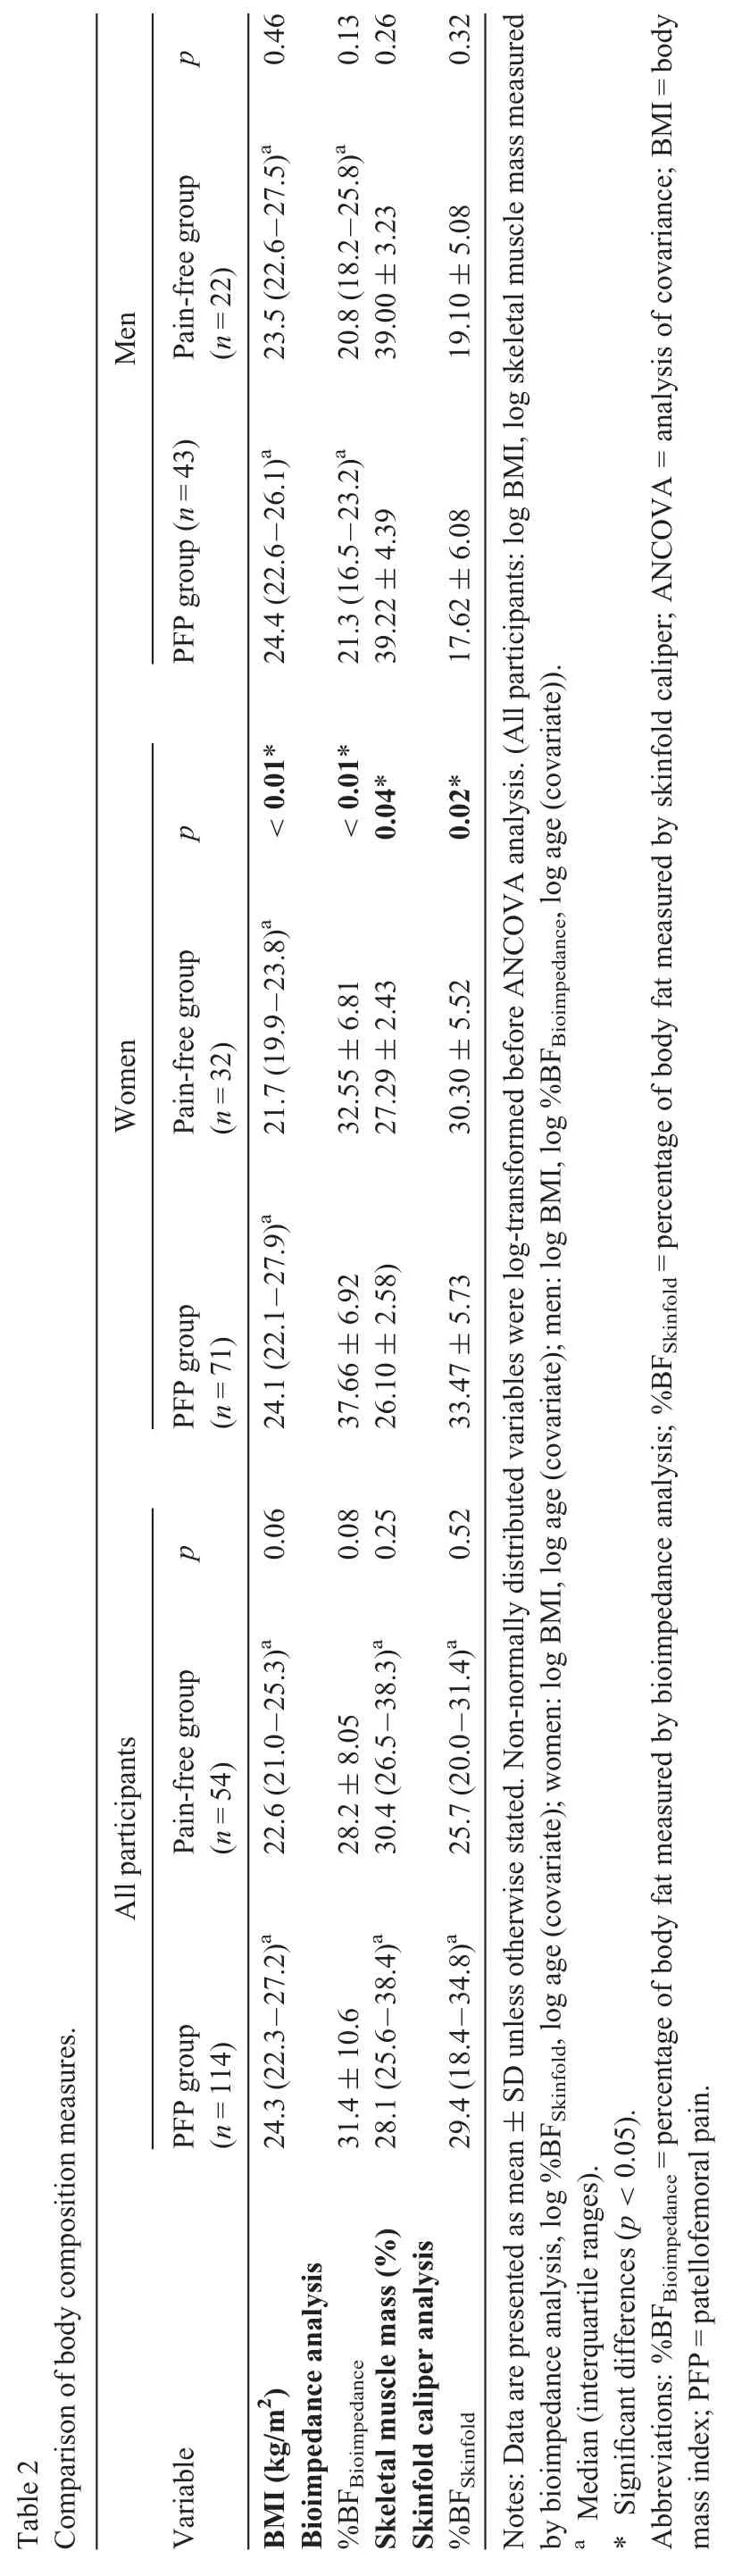
There were no significant differences (p=0.06-0.52)between the PFP group and the pain-free group for BMI(ES (95%CI)=0.45 (0.12-0.77)),%BFBioimpedance(ES(95%CI)=0.33 (0.00-0.65)),skeletal muscle mass percentage measured by bioelectrical impedance (ES (95%CI)=-0.11(-0.44 to 0.21)),or %BFSkinfold(ES (95%CI)=0.12(-0.20 to 0.45))(Table 2).Effect sizes for these differences between PFP and pain-free groups are represented in Fig.1.Adjusted means(standard error)are presented in Supplementary Table 1.
3.2.Women:PFP group vs.pain-free group
Women with PFP presented significantly(p-0.04)higher BMI (ES=0.85,95%CI: 0.42-1.28),higher %BFBioimpedance(ES=0.74,95%CI: 0.31-1.17),lower skeletal muscle mass percentage measured by bioelectrical impedance(ES=-0.47,95%CI: -0.89 to -0.05),and higher %BFSkinfold(ES=0.55,95%CI: 0.13-0.98) compared to pain-free women (Fig.1)(Table 2).
3.3.Men:PFP group vs.pain-free group
There were no significant differences(p=0.13-0.46)between men with PFP and pain-free men for BMI (ES=0.00,95%CI:-0.51 to 0.51),%BFBioimpedance(ES=-0.22,95%CI: -0.73 to 0.30),skeletal muscle mass percentage as measured by bioelectrical impedance (ES=0.05,95%CI: -0.46 to 0.57),or %BFSkinfold(ES=-0.25,95%CI: -0.77 to 0.26) (Fig.1)(Table 2).
4.Discussion
This is the first study to explore BMI and body composition in women and men with PFP compared with pain-free controls in a nonathletic population.Women with PFP had significantly higher BMIs,%BFBioimpedance,and %BFSkinfold,and lower skeletal muscle mass compared to pain-free women.However,men with PFP and both sexes combined showed no differences in BMI or body composition measures compared to their respective pain-free groups.
Our findings indicate that women with PFP,but not men with PFP,have a higher BMI compared to pain-free controls.In contrast,the systematic review by Hart et al.26provided moderate evidence that mixed-sex cohorts with PFP have a higher BMI compared to pain-free controls (with the proportion of women with PFP in the Hart et al.study similar to the number of women with PFP in our study: »60%26vs.62%,respectively).A possible explanation for the conflicting findings may be the difference in study populations: a quarter of the studies from the Hart et al.26meta-analysis included athletic populations (e.g.,runners,athletes,and military service members) whereas our study comprised a nonathletic population.BMI is calculated using only body mass and height and does not take into account overall body composition (including body fat and skeletal muscle mass).Athletic populations may have larger skeletal muscle mass due to high levels of physical activity.69,70As a consequence,the influence of a larger skeletal muscle mass on BMI might misclassify these individuals as overweight and obese;71this is less likely to occur in a nonathletic population.Similarly,a previous study69reported that a 1-liter increase in skeletal muscle mass was associated with a larger increase in BMI than a 1-liter increase in body fat(0.46vs.0.32,p<0.01)in men,but not in women,which reinforces this explanation.Another likely explanation is that in our cohort,women with PFP presented with a significantly higher body mass (kg) compared to painfree women: median (IQR)=65.20 (59.20-72.90) and 54.45(51.05-61.87),respectively;whereas men with PFP and painfree men presented with similar body-mass (kg) values: median(IQR)=75.60 (69.30-81.30) and 74.45 (68.67-85.40),respectively.This would obviously influence the BMI calculations and,therefore,the differences between groups.
Only women with PFP presented higher %BFBioimpedanceand %BFSkinfoldcompared to pain-free women in our cohort.Bioelectrical impedance and skinfold thickness analysis were able to detect similar ES differences in percentage of body fat between women with PFP and pain-free women (ES=0.74 and 0.55,respectively),indicating that both methods are useful in assessing and detecting differences in percentage of body fat in a nonathletic cohort of young adults.Visser et al.72reported that fat mass and fat percentage were the body composition parameters that had the highest association with clinical and radiographical knee osteoarthritis,especially in women.To date,only 1 systematic review has investigated the association of body fat percentage with PFP;this review reported moderate evidence from 2 studies that body fat percentage is not a risk factor for PFP in adolescents.27Body fat distribution is different in adolescents and adults,73which make comparisons difficult.Nevertheless,this finding is particularly important because increased body fat may be related not only to increased loads in patellofemoral joint74but also to systemic changes (e.g.,adipokines produced by adipose tissue may impact the patella cartilage metabolism and contribute to cartilage degradation).9,75PFP has been suggested as a precursor to patellofemoral osteoarthritis,22-25and obesity seems to have an impact on the pathogenesis of patellofemoral osteoarthritis.7Therefore,increased body fat could indicate that women with PFP may be at greater risk of developing osteoarthritis than men.76Future longitudinal studies are needed to confirm this hypothesis.
Only women with PFP had significantly lower skeletal muscle mass compared to pain-free women in our cohort.Although no previous research has compared skeletal muscle mass between people with PFP and pain-free controls,we found that skeletal muscle mass was the best predictor of knee and hip strength in our previous study.33Indeed,Rathleff et al.38reported larger deficits in hip strength for women with PFP than for men with PFP when compared to pain-free controls,which could be explained by the lower skeletal muscle mass reported in our study.Additionally,people with PFP may reduce their device-measured physical activity levels due to the persistent pain associated with the condition.28This inactivity associated with the effects of obesity (i.e.,reduced skeletal muscle mass and increase body fat) may also have an impact on muscle quality,77,78which could be determined by the accumulation of adipose tissue within the muscle.79However,further research is needed to investigate this hypothesis,because fat infiltration in muscle fibers cannot be detected by the bioelectrical impedance or skinfold calipers used in our study.Nevertheless,our findings are particularly important because exercises targeted to the hip and knee muscles are strongly recommended for people with PFP,34but little is known about the most appropriate prescription (i.e.,exercises targeting neuromuscular activation,strength,endurance,or power)80or the potential impact of evidence-based exercises on the reduction of intramuscular fat infiltration.
Interestingly,there were no significant differences in physical activity levels between people with PFP and their respective pain-free groups in our cohort.These findings may challenge the idea that overweight and obesity are a consequence of living with PFP,mediated by reduced levels of physical activity.However,it is important to highlight that we assessed physical activity levels only cross-sectionally between groups but not within groups over time.Additionally,physical activity levels in our cohort were self-reported and were not measured by a wearable device.People with PFP may reduce their physical activity levels due to the persistent pain associated with the condition28or due to the psychological impairments81-83associated with increased risk of becoming obese.84Both factors could lead to increases in BMI/body fat and reductions in skeletal muscle mass in people with PFP,hypothetically setting off a vicious circle of pain,leading to reduced physical activity levels,leading to worsening of psychological factors,leading to obesity (Fig.2).Because of the crosssectional nature of our study,we cannot imply causality or effect among physical activity levels,overweight/obesity,and PFP.Future longitudinal studies are needed to confirm this hypothesis.
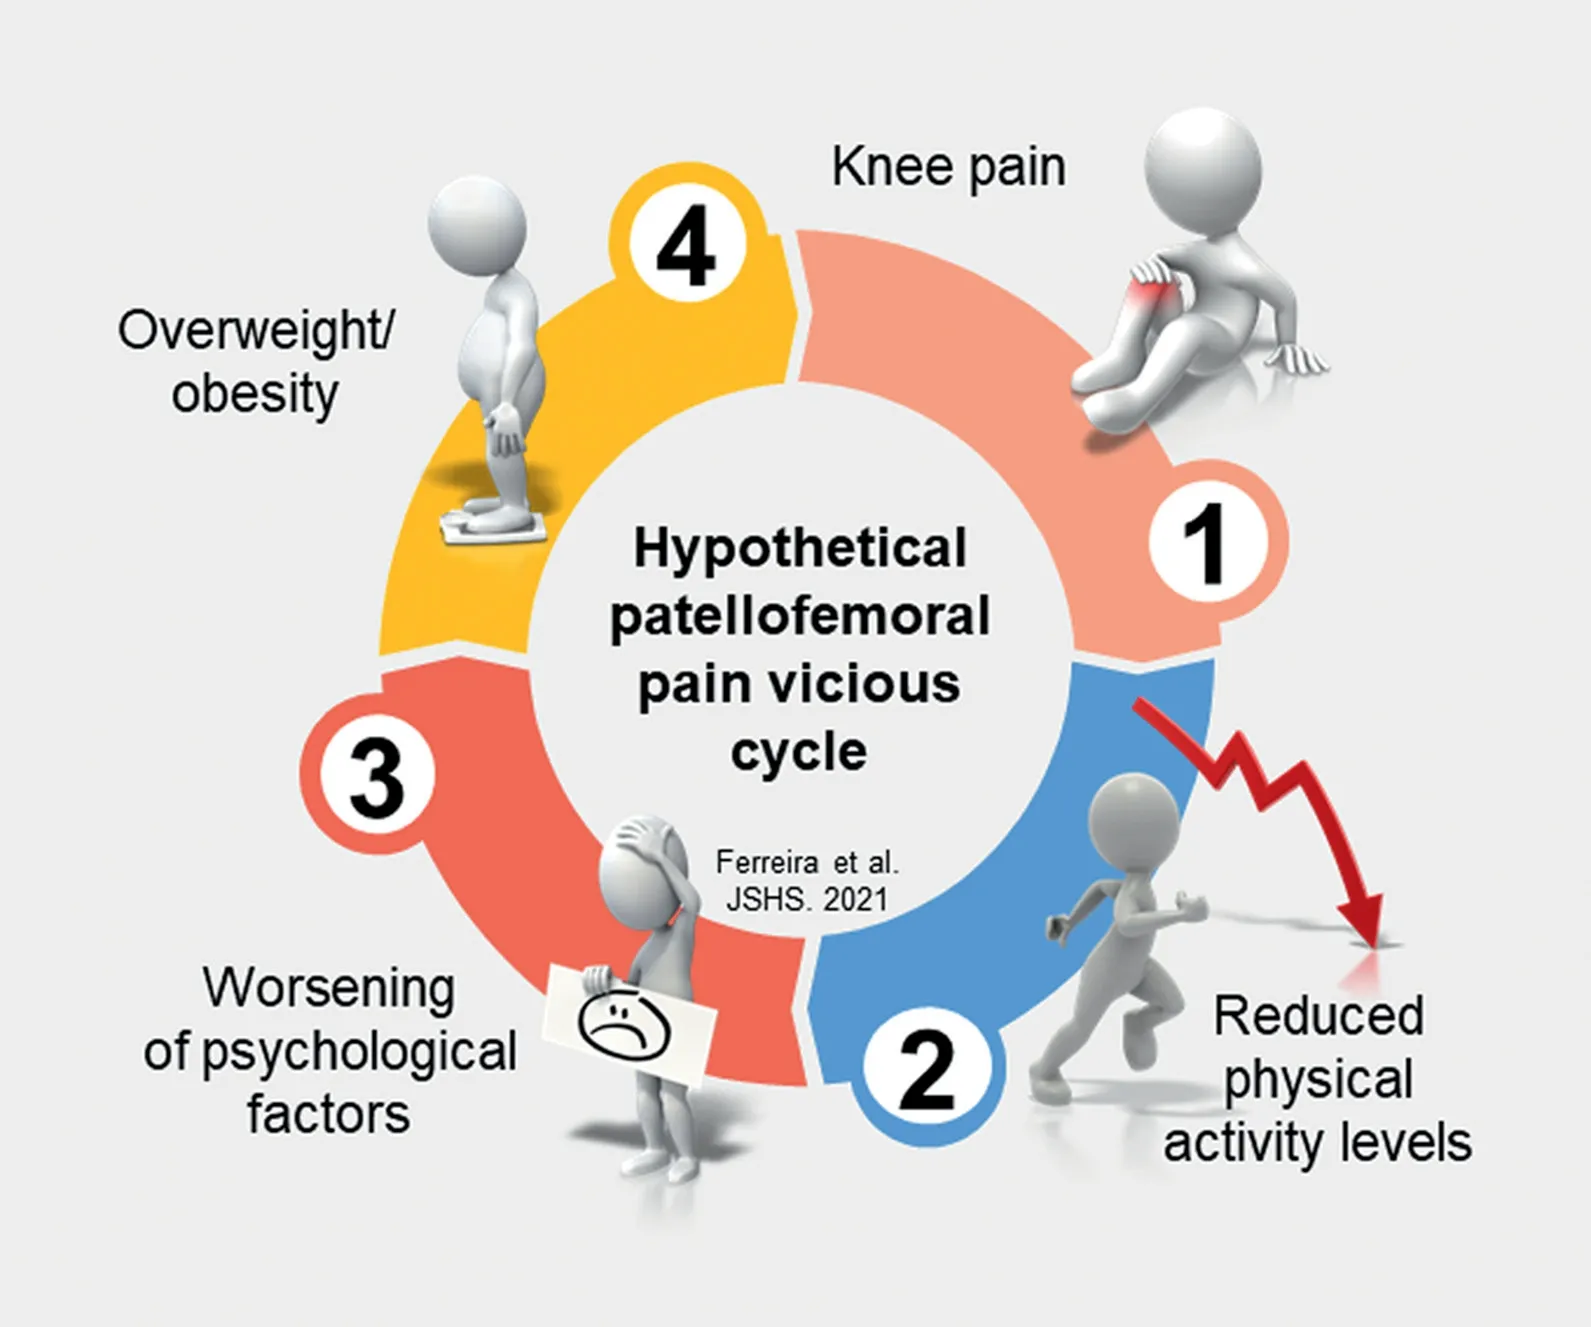
Fig.2.Proposed hypothetical vicious cycle of pain leading to reduced physical activity levels,leading to worsening of psychological factors,leading to obesity in nonathletic people with patellofemoral pain.
Overweight and obesity have risen markedly over the past decades1and are associated with impaired functional capacity and knee and hip strength in people with PFP.33Considering that overweight and obesity are modifiable,our findings suggest that health professionals should consider BMI and body composition measures as part of the evaluation and management of people with PFP,especially for women,who have demonstrated higher body fat and lower skeletal muscle mass compared to pain-free controls.Although a previous systematic review reported that patients with knee osteoarthritis may benefit from weight-loss programs (including diet and exercise) to improve pain and function,85nothing is known about the effect of weight-loss interventions in people with PFP.Future clinical trials are needed to investigate the effect of including weight loss interventions in the current evidence-based treatment for PFP,34,35considering that there are sex differences regarding BMI and body composition measures.
This study presents some limitations that should be acknowledged.We used bioelectrical impedance and skinfold caliper analysis to measure body-composition data.Despite both being previously reported as valid,reliable,and clinically applicable in the assessment of body composition,57,86other methods are considered more accurate,such as dual-energy X-ray absorptiometry or magnetic resonance imaging.43Although we have attempted to consider sex differences in PFP by subgrouping our sample by sex,caution should be taken when interpreting our findings because we included an unequal number of participants within groups.Although this disparity depicts the sex prevalence of the condition (our whole cohort was recruited from the same setting and used the same recruitment strategy),the inclusion of an equal number of men and women in our sample could have led to different results.Also,because only young adults with PFP (aged 18-35 years) were included in our study,further research using a similar methodology with adolescents and older adults with PFP is required before our findings can be generalizable to these populations.Finally,the cross-sectional design of our study does not imply causality or allow for direct recommendations regarding interventions.
5.Conclusion
Our findings indicate that women with PFP have higher BMIs,higher body fat levels,and lower skeletal muscle mass compared to pain-free women.Men with PFP and both sexes combined presented no difference in BMI,body fat,or skeletal muscle mass compared to their respective pain-free control groups.Despite our findings,there were no significant differences in physical activity levels between people with PFP compared to their respective pain-free groups.
Acknowledgments
Amanda Schenatto Ferreira is supported by a Ph.D.scholarship from Sao Paulo Research Foundation-FAPESP(scholarship No.2018/17106-0).The financial sponsors played no role in the design,execution,analysis and interpretation of data,or writing of the study.
Authors’contributions
ASF and DOS conceived the study’s design and carried out data collection,data analysis and interpretation of results,and drafted the manuscript;BFM contributed to the statistical analysis and interpretation of the results and revised the manuscript;BT contributed to data collection;MFP participated in the design of the study,contributed to data collection,and revised the manuscript;FMA provided the structure for data collection.All authors have read and approved the final version of the manuscript,and agree with the order of presentation of the authors.
Competing interests
The authors declare that they have no competing interests.
Supplementary materials
Supplementary materials associated with this article can be found in the online version at doi:10.1016/j.jshs.2021.06.003.
 Journal of Sport and Health Science2023年5期
- Journal of Sport and Health Science的其它文章
- Skeletal muscle atrophy,regeneration,and dysfunction in heart failure:Impact of exercise training
- Look into my eyes:What can eye-based measures tell us about the relationship between physical activity and cognitive performance?
- Ecological correlates of sport and exercise participation among Thai adolescents:A hierarchical examination of a cross-sectional population survey
- Risk factors for chronic ankle instability after first episode of lateral ankle sprain:A retrospective analysis of 362 cases
- The management of the long head of the biceps in rotator cuff repair:A comparative study of high vs.subpectoral tenodesis
- Machine-learning-based head impact subtyping based on the spectral densities of the measurable head kinematics