
Machine-learning-based head impact subtyping based on the spectral densities of the measurable head kinematics
2023-09-26 09:00:38XinghoZhnYihngLiYuzhLiuNiholsChiSmulRymonZhouZhouHossinVhiAlizhJssRunBrtStphnTirnnOlivirGvrtMihlZinhGrlGrntDviCmrillo
Xingho Zhn ,Yihng Li ,Yuzh Liu,Nihols J.Chi ,Smul J.Rymon ,Zhou Zhou ,Hossin Vhi Alizh,Jss Run,S Brt,Stphn Tirnn,Olivir Gvrt,Mihl M.Zinh,Grl A.Grnt,Dvi B.Cmrillo
a Department of Bioengineering,Stanford University,Stanford,CA 94305,USA
b Department of Biomedical Data Science,Stanford University,Stanford,CA 94305,USA
c Ford Motor Company,3001 Miller Rd,Dearborn,MI 48120,USA
d Technological University Dublin,Dublin,D07 EWV4,Ireland
e Department of Radiology,Stanford University,Stanford,CA 94305,USA
f Department of Neurosurgery,Stanford University,Stanford,CA 94305,USA
Abstract Background:Traumatic brain injury can be caused by head impacts,but many brain injury risk estimation models are not equally accurate across the variety of impacts that patients may undergo,and the characteristics of different types of impacts are not well studied.We investigated the spectral characteristics of different head impact types with kinematics classification.Methods:Data were analyzed from 3262 head impacts from lab reconstruction,American football,mixed martial arts,and publicly available car crash data.A random forest classifier with spectral densities of linear acceleration and angular velocity was built to classify head impact types(e.g.,football,car crash,mixed martial arts).To test the classifier robustness,another 271 lab-reconstructed impacts were obtained from 5 other instrumented mouthguards.Finally,with the classifier,type-specific,nearest-neighbor regression models were built for brain strain.Results:The classifier reached a median accuracy of 96%over 1000 random partitions of training and test sets.The most important features in the classification included both low-and high-frequency features,both linear acceleration features and angular velocity features.Different head impact types had different distributions of spectral densities in low-and high-frequency ranges(e.g.,the spectral densities of mixed martial arts impacts were higher in the high-frequency range than in the low-frequency range).The type-specific regression showed a generally higher R2 value than baseline models without classification.Conclusion: The machine-learning-based classifier enables a better understanding of the impact kinematics spectral density in different sports,and it can be applied to evaluate the quality of impact-simulation systems and on-field data augmentation.
Keywords: Classification;Contact sports;Head impacts;Impact kinematics;Traumatic brain injury
1.Introduction
Traumatic brain injury (TBI) is a growing public health hazard,with high mortality and morbidity;it is also a socioeconomic issue because it is enormously expensive to diagnose and treat.1The situation is particularly urgent for mild TBI(mTBI),given that mTBI is notoriously underreported,difficult to diagnose,and is a predisposing factor to long-term neurodegenerative processes.2-4TBI/mTBI can be caused by various types of head impacts from accidental falls,bike accidents,car crashes,American football,mixed martial arts(MMA),water polo,ice hockey,and car crashes.5-10Here,the types of head impacts are defined as the different sources of impact(e.g.,different contact sports).
Considering the consequences and prevalence of TBI/mTBI,various biomechanical studies have focused on the estimation of brain injury risk.11-16Physiologically,the damage is thought to be caused by the inertial movement of the brain after the head sustains a physical impact,or after rapid acceleration or deceleration.Therefore,metrics of brain deformation are effective biomechanical predictors for predicting TBI/mTBI.As a quantifier of brain deformation,brain strain is generally recognized as a TBI/mTBI injury risk metric.12-15To calculate brain strain,head kinematics,which can be measured with wearable accelerometers and gyroscopes,are the necessary input variables.However,this state-of-the-art approach to computing brain strain (the finite element modeling based on brain physics)is computationally costly in terms of time and complex computational software.It typically takes hours to model the brain strain for a single impact,which makes it hard to use for real-time monitoring of brain injury risks.12-14Therefore,researchers have developed many mathematical models (often referred to as the brain injury criteria)by reduced-order brain physics approximation and statistical fitting to rapidly estimate the brain injury risk from head kinematics.9,11,17
A recent study18found that different head impact types tend to have variable biomechanical characteristics,indicating that the impact types should not be ignored when estimating the risk of TBI/mTBI.However,the brain injury criteria were developed based on certain types of head impacts,11,17and since the different kinematic features these brain injury criteria use can weigh differently across head impact types,they should not be used generally.18,19Thus,it is worthwhile to investigate the differences in the kinematics of various types of head impacts in order to develop better risk evaluation models adaptable to various head impact types for the detection and monitoring of TBI/mTBI.Sports-specific monitoring and protection strategies can be developed if we understand the differences among types of head impacts.
To study these differences,we used the kinematics of 3262 head impacts from head model (HM) simulations (2130 impacts),American football (302 college football (CF)impacts and 53 professional football impacts),MMA (457 impacts),automobile crashworthiness tests (48 impacts),and car racing (272 impacts).We extracted the spectral densities of linear acceleration and angular velocity,classified these impacts with machine learning models,and then analyzed the most important features for classification.Finally,we used the classification model to build type-specific regression models of 95%maximum principal strain(MPS95),MPS95 in corpus callosum(MPSCC95),and cumulative strain damage(CSDM)15%,indicating the volume fraction of the brain with MPS exceeding the threshold of 0.15)20and compared these with a baseline model developed from a mixture of different types of head impacts.These metrics were chosen because previous studies have found correlation between these tissue-level biomechanical metrics and TBI.21-24
2.Materials and methods
2.1.Data description
To study a broad range of head impact types,we collected kinematics from a total of 3262 head impacts from various sources: 2130 laboratory head impacts (HM) simulated from a validated finite element model of the Hybrid III anthropomorphic test dummy headform,14,25302 CF head impacts measured by the Stanford instrumented mouthguard(CF),15,26457 MMA head impacts (MMA) measured by the Stanford instrumented mouthguard,10,2753 reconstructed head impacts with helmet from the National Football League(NFL),2848 head impacts in automobile crashworthiness tests from the National Highway Traffic Safety Administration (NHTSA),29and 272 reconstructed head impacts from the National Association for Stock Car Auto Racing(NASCAR).13
2.2.Feature extraction
We believe different head impact types have different spectral characteristics,so to classify these types of head impacts,we extracted their spectral density features.The features were extracted from the linear acceleration and angular velocity (4 channels: 3 spatial components and the magnitude (the timevarying resultant of the 3 spatial components);x:posterior-toanterior,y: left-to-right,z: superior-to-inferior) which are directly measured by accelerometers.(Example impact kinematics are shown in Fig.1).
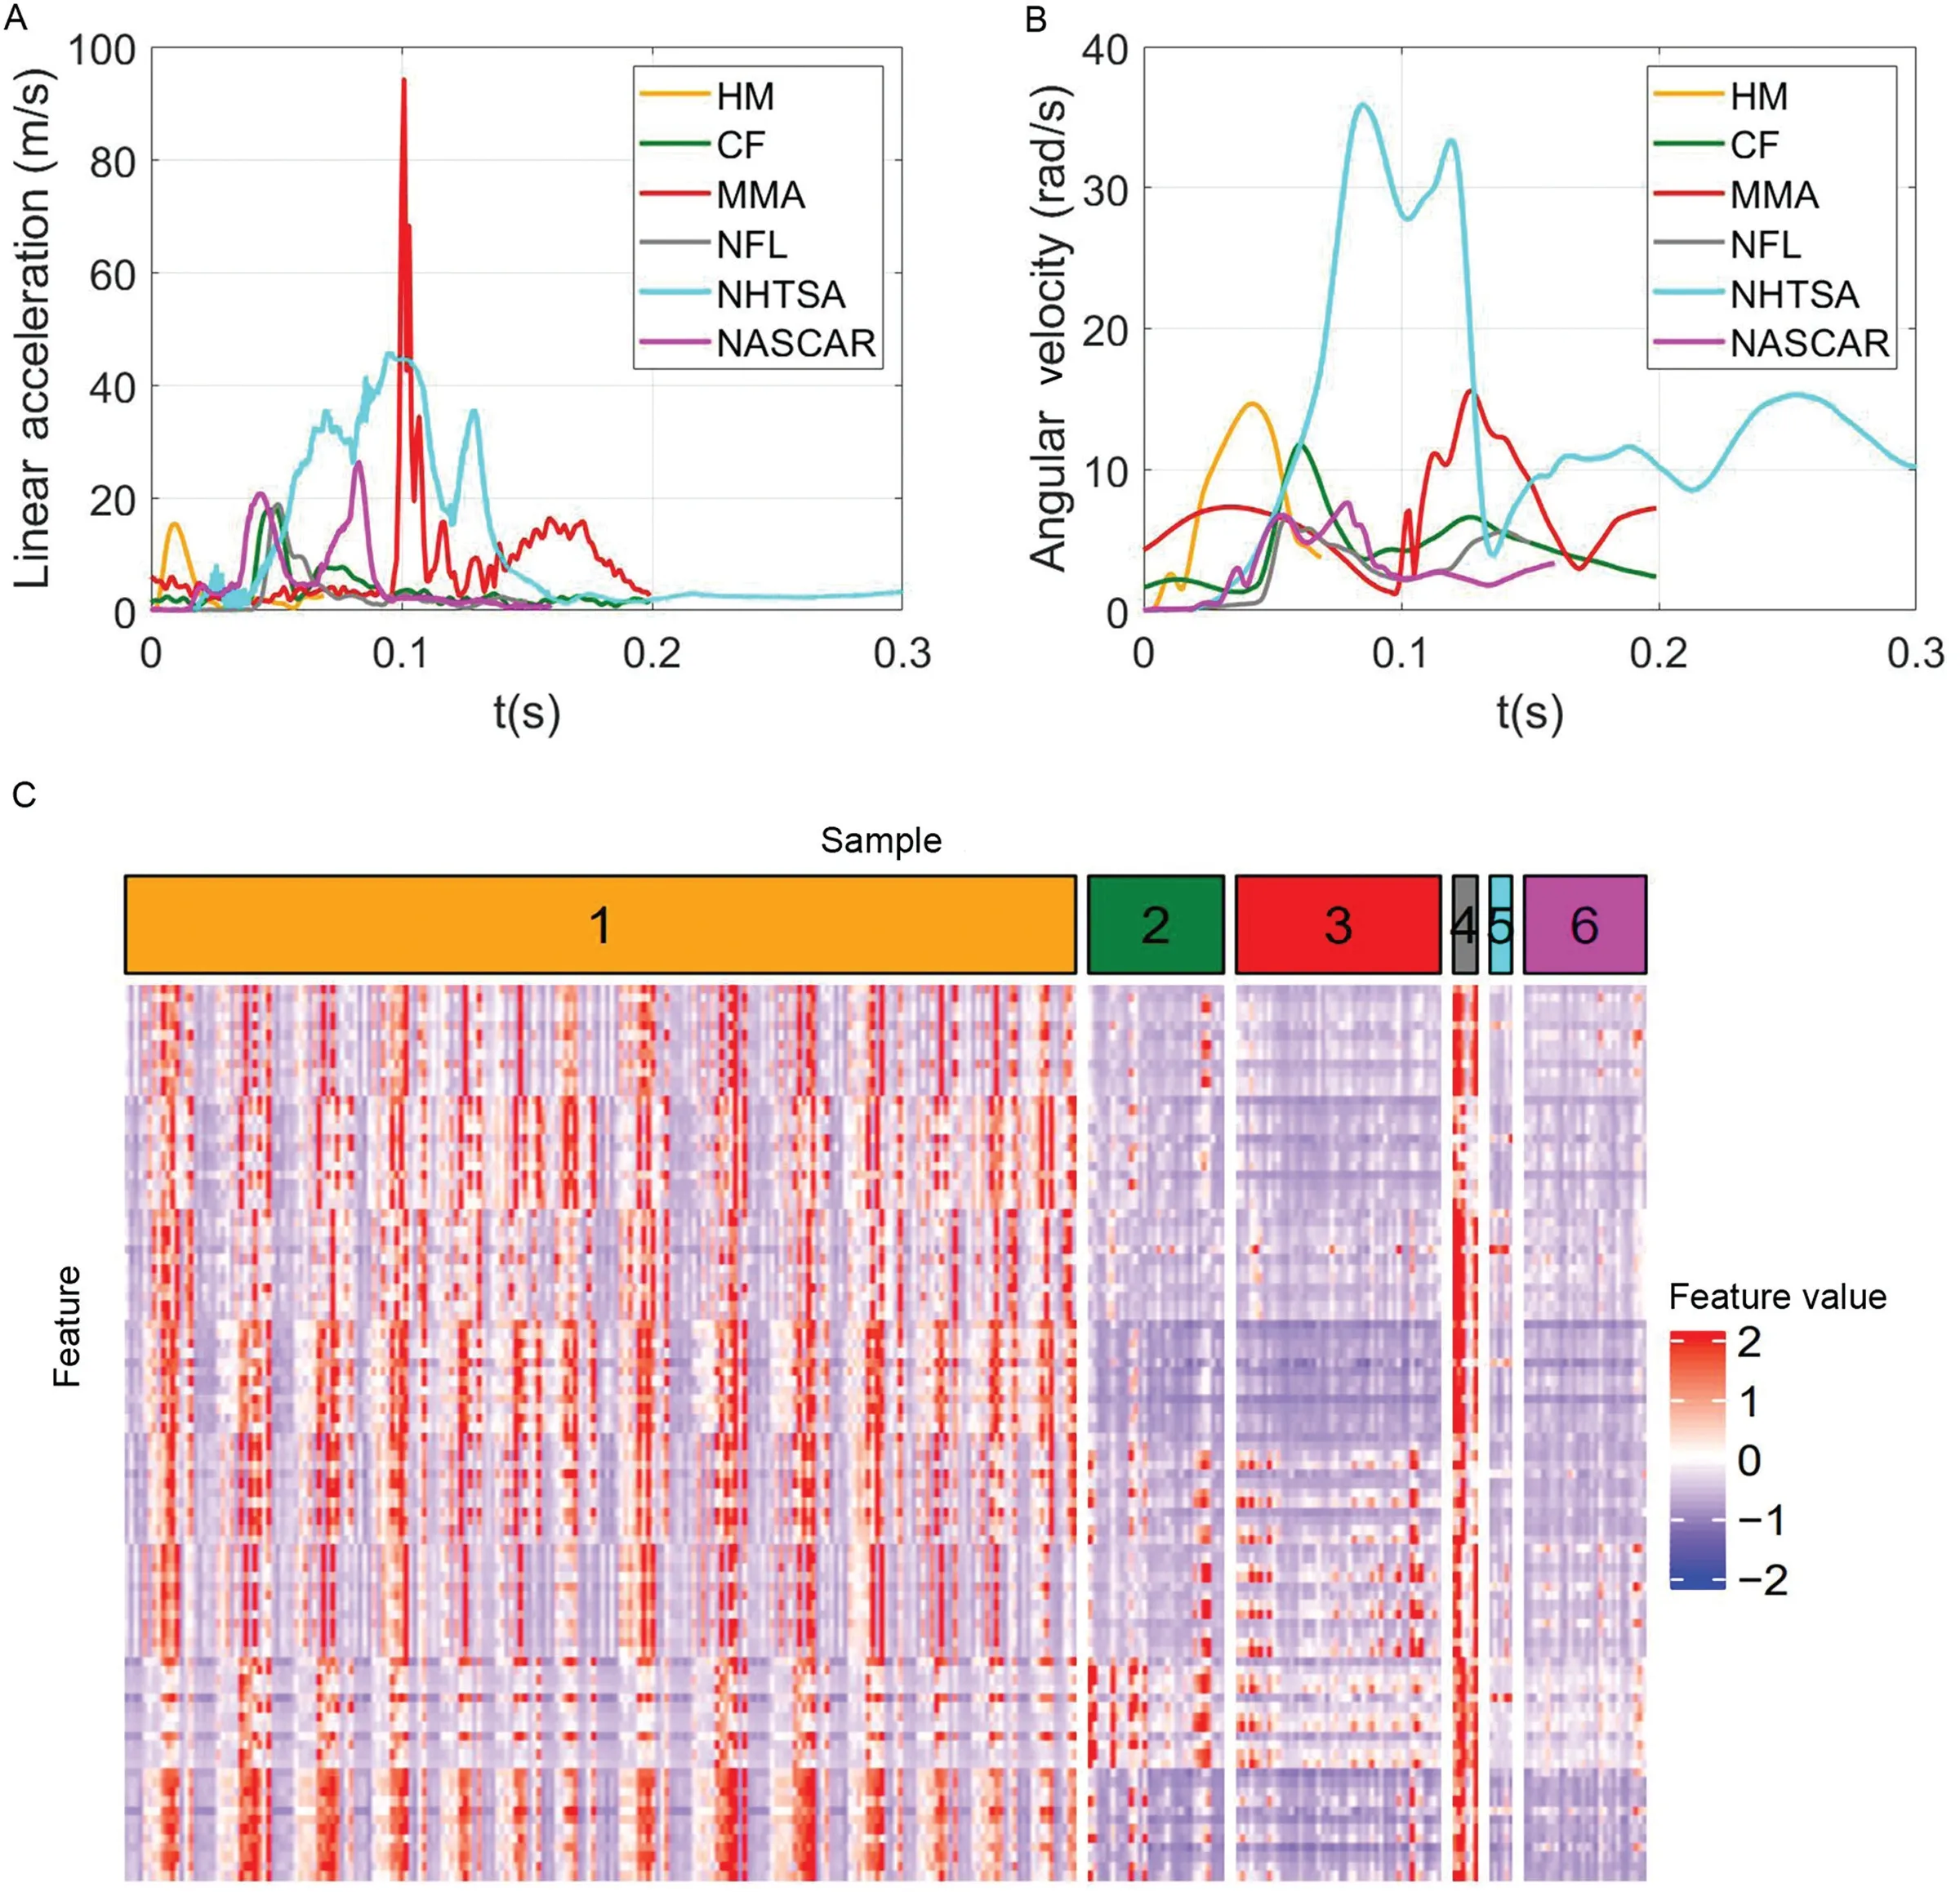
Fig.1.Example kinematics of the 6 types of head impacts and visualization of the 6 datasets used in this study with heatmap.(A)The magnitude of linear acceleration at the brain center of gravity,(B) the magnitude of angular velocity,and (C) the heatmap of features of all samples.CF=college football;HM=head model;MMA=mixed martial arts;NASCAR=National Association for Stock Car Auto Racing car crash impacts;NFL=National Football League;NHTSA=National Highway Traffic Safety Administration car crash impacts.
Fast Fourier Transform was applied to each channel of the kinematics,and the spectrum was split into windows,each with a width of 50 Hz.We kept the first 4 windows because the 4 windows show high classification accuracy,and frequency higher than 200 Hz is viewed as noises in previous studies.14,15In each frequency window,the mean,maximum,and median of the spectral density were extracted as the features.A total of 96 features (2 kinematics,4 channels,4 spectrum windows,and 3 statistics) were extracted for each impact.(Feature heatmap was shown in Fig.1C).It should be mentioned that the window width was chosen to be 50 Hz to enable at least 3 frequency points within each time window.The spectral feature extraction was performed with MATLAB R2021a(MathWorks,Natick,MA,USA).
2.3.Classification algorithm and evaluation
Over the past several decades,there has been a rapid development of machine learning technology.Machine learning technology has been used in the management of sport injury,the comprehension of sport behavior,and the improvement of athlete performance.12,14,30,31In this study,to investigate the categorization of different types of head impacts,we applied random forest as the machine learning classification algorithm to classify various types of head impacts.Random forest is a treebased ensemble learning algorithm that builds multiple decision trees to classify the samples into different leaves via the minimization of Gini index or entropy.32-34Random forest builds trees with sub-samples of the dataset,adopts bootstrap aggregating(bagging),and performs a majority vote on the output of the trees.We chose to use random forest because it does not suffer from overfitting based on bagging.It can also show feature importance while not suffering from feature collinearity,which makes it harder to interpret the feature importance of otherwise interpretable classifiers (e.g.,logistic regression).The random forest was implemented with the Python package scikit-learn(Version 0.24.1;Fredericksburg,VA,USA).35For classification,the inputs are the 96 spectral features of the head kinematics,and the model outputs are the types of head impacts: HM,CF,MMA,NFL,NHTSA,NASCAR.
To validate the feasibility of classifying different types of head impacts,we randomly partitioned the entire dataset of 3262 impacts into 80% training set and 20% test set with stratified sampling over 1000 repeats (1000 experiments with different random seeds in the training/test set partitions to enable randomness in the modeling process and test model robustness).The hyperparameters of the classifier (the number of decision trees and maximum depth of each tree) were tuned in a 5-fold cross validation on the training set by optimizing the classification accuracy.The test data were used to evaluate the classification model performance after the models were finalized.
The classification problem in this study follows a multi-class classification protocol:an impact is classified into 1 of the 6 categories(HM,CF,MMA,NFL,NHTSA,NASCAR).To assess the classification performance,and to assess whether the classifier was biased toward certain classes,the multi-class classification accuracy(percentage of correct predictions in all test samples,e.g.,an MMA impact is predicted as an MMA impact) and 3 binary classification metrics were used: the mean precision,the mean recall,and the mean area under the receiver operating characteristic curve(AUROC)of the 20%test impacts.Even though this is a multi-class classification problem,these binary classification metrics were investigated and averaged to evaluate the model performance without biasing toward the majority class(the largest dataset,HM).As the precision (e.g.,correct MMA predictions divided by all predicted MMA impacts),recall(e.g.,correct MMA predictions divided by all MMA impacts),and AUROC are binary classification metrics,we averaged the 3 metrics after calculating them on the respective classification of each type of head impact(e.g.,MMAvs.non-MMA,CFvs.non-CF) to reflect the overall binary classification performance across all impact types.
2.4.Important feature analysis
As previous studies found significantly different performance of brain injury risk estimation models across head impact types,with the classification model we can interpret the most important features for kinematics classification to find the different spectral characteristics intrinsic to different types of head impact kinematics.The importance of a feature is calculated by the normalized total reduction of the classification criterion (Gini index or entropy) brought by a feature.32,33To ensure the robustness of the result,we recorded the normalized feature importance in the modeling of random forest classifiers over the 1000 repeats.In each repeat,the feature importance was calculated on the 80% training data.Next,the mean feature importance was calculated and ranked.Finally,we did an additional validation of the features by picking up the top 5,10,and 20 important features and modeling the random forest classifiers with the same 4 metrics calculated.
2.5.Brain strain regression with classification
Upon verifying the feasibility of kinematics classification,we built type-specific brain injury risk evaluation models with the classifier to demonstrate an application of the kinematics classification.Rather than build a risk evaluation model for the mixture of all different head impact types,we chose the typespecific model to address the previously observed hardship of estimating brain injury risks across different head impact types with a single model.18
We used the 4 datasets with the most impacts(HM,CF,MMA,and NASCAR)and performed a k-nearest neighbor(KNN)regression of MPS95,MPSCC95,and CSDM on the kinematics after partitioning the dataset into 80% training data and 20% test data with 20 repeats (20 experiments with different random seeds in the dataset partition process to test the model robustness under randomness).The 20%test data were unseen in both the classification model and regression model training datasets.We used these 3 metrics because strain-based metrics that directly summarize the brain deformation have shown superior injury predictability.21-24KNN was used,as it did not require strong distribution and model assumptions.In the regression,thek-nearest training impacts of a test impact were found based on Euclidean distance.The MPS95/MPSCC95/CSDM prediction for the test impact is the averaged MPS95/MPSCC95/CSDM of thek-nearest training impacts.The hyperparameterkwas tuned via a 5-fold cross-validation on the 80% training data while optimizing the root mean squared error(RMSE).To prevent any data leakage,the testing set was held out until the final evaluation stage of the type-specific regression strategy.Here,besides the spectral densities,we included the timepeaks of the linear acceleration and angular velocity (4 channels for each).We selected kinematics that are directly measurable by sensors,and we used the time-peaks of the angular velocity because they have been shown to correlate well with MPS95 and are incorporated in the designs of many brain injury criteria.36,37The ground-truth MPS95/MPSCC95/CSDM values were given by the Kungliga Tekniska Högskolan(KTH)model,which is a validated finite element model.38
Different from the classification models,the inputs of the regression models are the 104 kinematics features (which include the 96 spectral features used for head impact type classification and the 8 temporal features used for the regression)and the outputs are the MPS95/MPSCC95/CSDM.Classification results are used in the regression to classify a particular impact into a head impact type for type-specific regression models.
The baseline regression accuracy was determined using the 80%training data to build a KNN model and the 20%test data to assess the model coefficient of determination(R2).Different from the baseline model,the classification-regression model first built a classifier on the 80% training data and then built KNN models for each type of head impact.In the testing stage,the impacts were classified into one of the types of head impacts in the training set and then the MPS95/MPSCC95/CSDM associated with the test impact was calculated by the type-specific KNN regression model.Because most impacts were from the dataset HM,directly calculating the RMSE andR2would have led to biased estimates of regression accuracy.Therefore,for the test impacts,we calculated the RMSE andR2based on the ground-truth types of head impacts (HM,CF,MMA,NASCAR) and took an average over the 4 types to avoid the influence exerted by the majority dataset.Finally,Wilcoxon signed-rank tests were done to test statistical significance onR2and RMSE as the Shapiro-Wilk test rejected the data normality assumption.
2.6.Validation of the classifier on different instrumented mouthguards
To estimate the influence of instrumented mouthguard types on the classifier,we applied the classifier to 271 head impacts collected by 5 different mouthguards in the lab:39Stanford Instrumented Customized/Boiling-and-Bite,Prevent Customized/Boiling-and-Bite,Sports &Wellbeing Analytics (SWA) Customized.We analyzed 54 impacts for each mouthguard (55 for SWA Customized mouthguards).
3.Results
First,we performed kinematics classification based on the 96 features with a random forest algorithm(model input:96 spectral features of the kinematics;model output: type of head impact).The accuracy,mean precision,mean recall,and mean AUROC are shown in Fig.2 A-D.The medians of(a)classification accuracy,(b)mean precision,(c)mean recall,and(d)mean AUROC were above 0.95,0.93,0.85,and 0.92,respectively,which demonstrates the feasibility of classifying different types of head impacts.(Example confusion matrices showing correct and incorrect predictions are visualized in Fig.3).
Based on the classifier,we extracted the top 20/10/5 most important features over the 1000 repeats of random dataset partitions.The features and their definitions are listed in Table 1.The 20 most important features included both angular velocity features and linear acceleration features.The different frequency ranges were determined to be important in the classification:6 of the 10 most important features were in the lowfrequency range (0-50 Hz),including the mean and median spectral density of the resultant angular velocity,they-axis angular velocity,and the resultant linear acceleration.Among the other top 10 most important features,there were 3 in the high-frequency range (150-200 Hz) from they-axis andz-axis linear acceleration.Among the top 20 features,there were 9 angular velocity features(7 from the magnitude and 2 from the spatial components) and 11 linear acceleration features (2 from the magnitude and 9 from the spatial components),which showed that for both measured kinematics,the magnitudes and the kinematic were informative components in the classification.
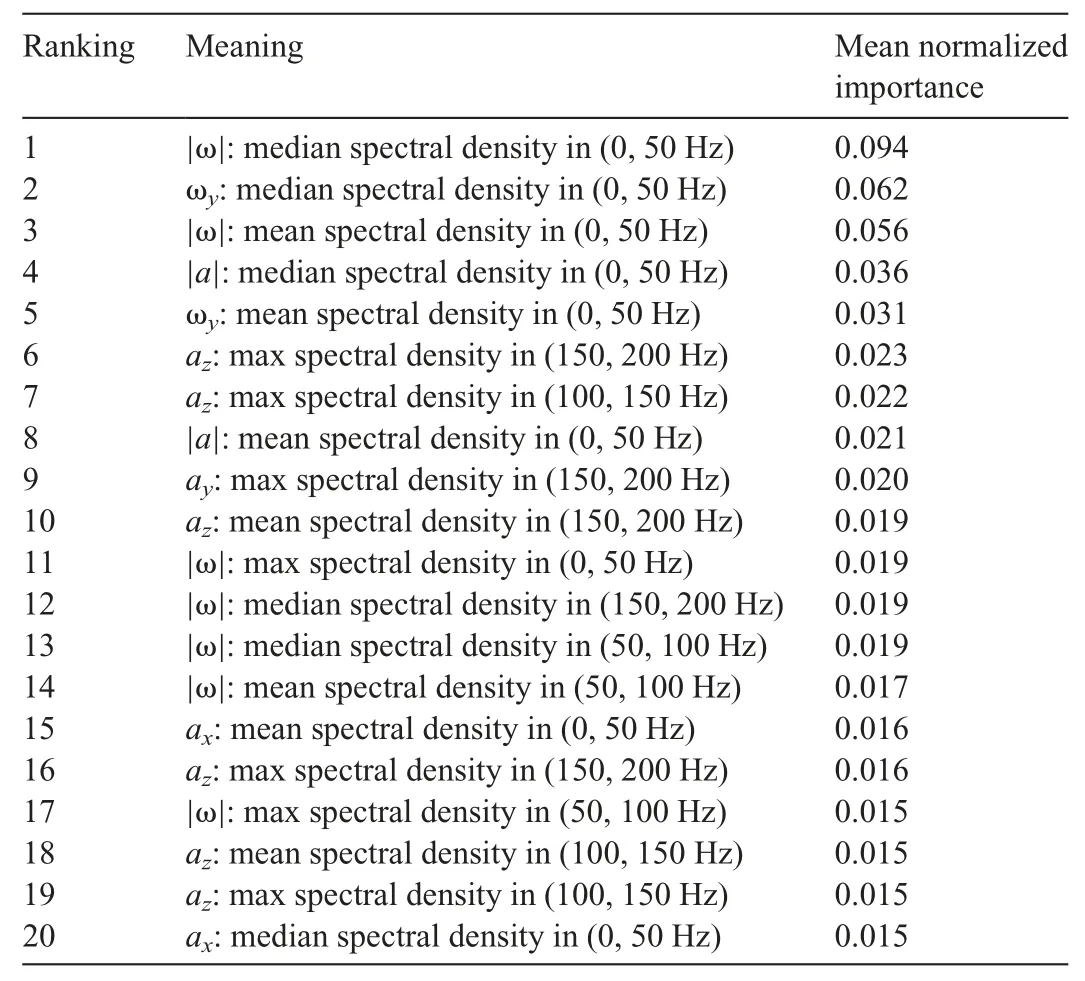
Table 1The ranking and definitions of the top 20 most important features in kinematics classification and the mean normalized importance values over 1000 random dataset partitions.
The distribution of the 6 datasets on the top 5 features is shown in Fig.4 and the distribution on the other 5 of the top 10 features is shown in Fig.5.For the top 5 features from the low-frequency range (0-50 Hz),the MMA impacts had the lowest spectral densities,while NHTSA/HM/NFL impacts had higher spectral densities in this range;the CF/NASCAR impacts generally had spectral densities higher than MMA impacts and lower than NHTSA/HM/NFL impacts.On the contrary,in the highfrequency range (100-200 Hz) (Fig.5),the MMA impacts had higher spectral densities,while NHTSA/HM impacts had lower spectral densities (Fig.4).
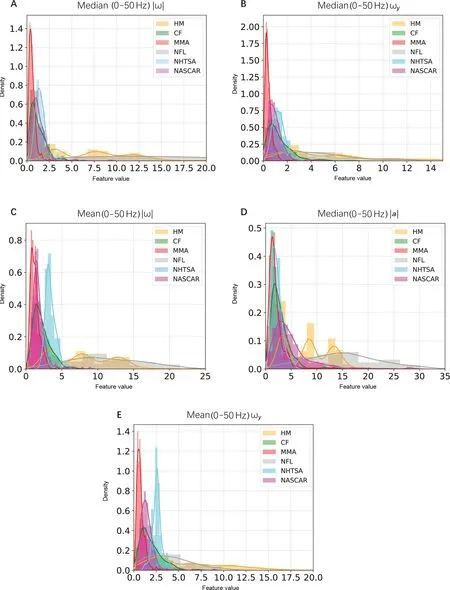
Fig.4.The distribution of the 6 datasets on the top 5 most important features for classification.The data distribution in(A)the median spectral density in(0,50 Hz)of the resultant angular velocity,(B) the median spectral density in (0,50 Hz) of the y-axis angular velocity,(C) the mean spectral density in (0,50 Hz) of the resultant angular velocity,(D)the median spectral density in(0,50 Hz)of the resultant linear acceleration,and(E)the mean spectral density in(0,50 Hz)of the y-axis angular velocity.CF=on-field college football impacts;HM=head model simulated impacts without helmet;MMA=on-field mixed martial arts impacts;NASCAR=National Association for Stock Car Auto Racing car crash impacts;NFL=lab-reconstructed National Football League impacts with helmet;NHTSA=National Highway Traffic Safety Administration car crash impacts.
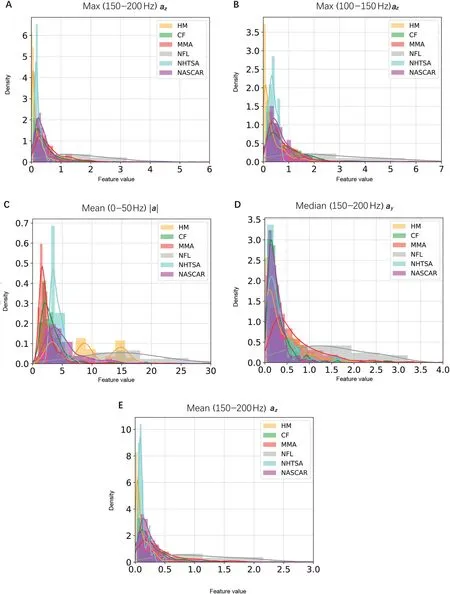
Fig.5.The distribution of 6 datasets on the sixth-to-tenth most important features for classification.The data distribution in(A)the max spectral density in(150,200 Hz)of the z-axis linear acceleration,(B)the max spectral density in(100,150 Hz)of the z-axis linear acceleration,(C)the mean spectral density in(0,50 Hz)of the resultant linear acceleration,(D) the max spectral density in (150,200 Hz) of the y-axis linear acceleration,and (E) the mean spectral density in (150,200 Hz) of the z-axis linear acceleration.CF=on-field college football impacts;HM=head model simulated impacts without helmet;MMA=on-field mixed martial arts impacts;NASCAR=National Association for Stock Car Auto Racing car crash impacts;NFL=lab-reconstructed National Football League impacts with helmet;NHTSA=National Highway Traffic Safety Administration car crash impacts.
The classification performance on the 20,10,and 5 most important features is shown in Fig.2 A-D:there was a general performance decline as the feature number decreased,while the classifier based on the top 10 features still showed high classification performance with medians of (a) classification accuracy,(b) mean precision,(c) mean recall,and (d) mean AUROC above 0.94,0.88,0.80,and 0.90,respectively.These results demonstrate the feasibility of the kinematics classification with the subsets of most important features.
To further validate that the classifier’s performance did not rely heavily on the type of instrumented mouthguard and did not overfit the specific mouthguards we used to collect the impact kinematics,we performed the classification of 271 lab impacts collected by different mouthguards.Results are shown in Fig.2E.All the impacts were classified into football-like types,and most of them were HM/NFL impacts,which used the same methodology to generate head impacts as these 271 impacts.
Finally,to test whether classification could improve brain injury risk estimation,we built the KNN regression models for MPS95/MPSCC95/CSDM with and without classification.Fig.2F-H show the testR2averaged over 4 datasets (model input: 104 kinematics features;model output: MPS95/MPSCC95/CSDM).The regression models with classification were significantly more accurate in the MPSCC95 and CSDM regressions (p<0.05) and similarly accurate in the MPS95 regression (p>0.1).The results,in terms of RMSE,are reported in Table 2,where similar findings are shown:averaged across the 4 types of head impacts,the regression models with classification were significantly more accurate in terms of MPSCC95 regression (p<0.01) and CSDM regression (p<0.05) while there was no statistical significance in terms of MPS95 regression(p>0.1).
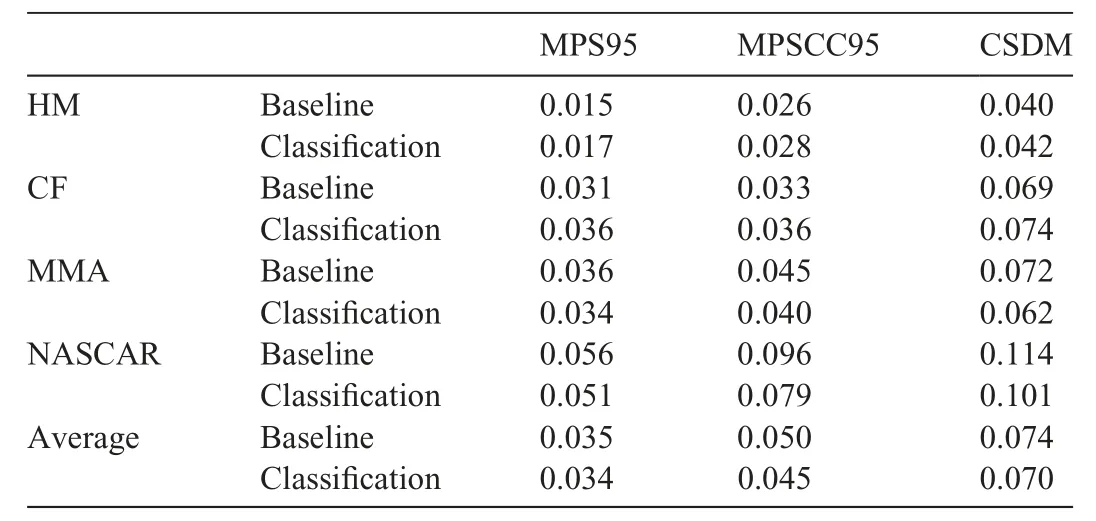
Table 2The root mean square error (RMSE) of the k-nearest neighbor regression of MPS95,MPSCC95,and CSDM across different types of head impacts.
4.Discussion
4.1.Contribution
In this study,we demonstrated that the machine learning classification model based on the spectral densities of head impact kinematics showed high classification performance in categorizing different types of head impacts.With the classification,brain strain metrics regression accuracy was shown to be non-inferior to building a single model across impact types.In this study,the MMA and CF impacts were measured by the Stanford instrumented mouthguard,while the HM-simulated impacts and NHTSA impacts were both simulated with the Hybrid III anthropomorphic test dummy headform.Our additional validation on 271 lab-reconstructed impacts measured by 5 other mouthguards also showed that most predictions were HM/NFL impacts(football-like impacts simulated/reconstructed with dummy heads).The results showed that the model was generally successful is classifying different types of head impacts.For the football-like impacts,the classifier can categorize them according to measurement by different types of instrumented mouthguards.
As for the research contributions,first,the analysis of the most important features in the classification enables better understanding of the differences among head impact types.For instance,the NHTSA impacts have higher spectral densities in low-frequencies and lower spectral densities in high-frequencies,while the MMA impacts have lower spectral densities in lowfrequencies and higher spectral densities in high-frequencies.Via the classification algorithm,we can investigate the key features that may determine the impact types and the sports and visualize the distribution of spectral densities.In our previous study,we found that different kinematic factors (e.g.,angular velocity,angular acceleration)have different predictive power with respect to brain strain across the variety of head impacts.19For example,angular velocity features tend to be more predictive in MMA impacts,while angular acceleration tends to be more predictive in football impacts.Other researchers have shown that for shortduration impacts,the peak resultant angular velocity is better correlated with brain strain,while for long-duration impacts,the peak resultant angular acceleration is better correlated with brain strain.40Even though the definition of long/short duration for an impact is not defined for on-field impacts,in this study,after analyzing the frequency components of different types of features,the MMA impacts show more high-frequency components and,thus,are closer to being considered short-duration impacts.This fact may be able to explain our previous observation that the angular velocity features better predict brain strain for MMA impacts.19
Second,we built a classifier for different types of head impacts and trained the model on the entire publicly available dataset.As previous studies revealed issues of generalizability of brain strain estimation models across different head impact types,18this study has shown that the classifier can aid in the development of typespecific brain injury risk estimation models capable of higher accuracy with respect to brain strain regression.As classification is based on noisy patterns defined by humans (i.e.,sports),the categorizations may not capture the intrinsic dynamics characteristics for different types of sports.However,this noisy categorization of patterns works in the improvement of risk estimation accuracy.For example,a new impact from American football event needs to be evaluated;the classification-regression may classify it as NASCAR based on its spectral density fingerprint.This reflects an overall improvement in the accuracy and performance of risk estimation models.
Third,as data from laboratory impacts are relatively easier to obtain than on-field data,in the future,researchers can use deep learning technique models,such as generative adversarial networks,to augment data and conduct domain adaptation to generate more simulated on-field impacts.The kinematics classifier can be used as a discriminator for the evaluation of simulated impacts.
Furthermore,as our validation experiments across different mouthguards have shown,the classifier successfully distinguishes between lab-reconstructed football-like impacts and on-field CF impacts,which indicates that the football-like impacts generated on the dummy head by a pneumatic impactor still cannot fully capture the characteristics of on-field CF impacts.Therefore,this classifier can be applied to evaluate the quality of dummy head impact reconstruction/simulation systems.
Another potential application of this study is that the kinematics-classification-based type-specific regression of the strainbased metrics(MPS95/MPSCC95/CSDM) may help researchers rapidly estimate strain-based metrics.Previous studies have shown that these strain-based metrics are good predictors of mTBI and associated pathologies(a summary of the research can be found in the review41).For example,Wu et al.24found 50%concussion thresholds of 0.270 for MPS95 and 0.477 for CSDM with human data,and Hajiaghamemar et al.23found a 50%axonal injury threshold of 0.286 for MPS95 in a large animal model.To obtain these strain-based metrics,conventional state-of-the-art finite element models can take 7-8 h to simulate a single impact14(e.g.,using a 16 GB RAM,Intel Core i7-6800 K CPU).However,with the rapid estimator discussed in this study,the computational time per impact can be dramatically reduced to within 10 s (e.g.,using an 8 GB RAM,Intel Core i5-6300 U CPU).Therefore,the classification-based strain-metrics regression models can be further applied in the field of TBI research.
4.2.Limitations
As for the study’s limitations,first,to test that our classifier does not rely heavily on the types of instrumented mouthguards,we used only football-like impacts measured by 5 mouthguards.In the future,more MMA impacts and NHTSA impacts measured by different devices can be collected and used to test the model’s sensitivity to measurement devices on impacts other than football impacts.Second,to enable the classifier to be more accurate and broader in its applications,more data from diverse types of head impacts should be collected and modeled.Additionally,we used the KTH model as the validated model for calculating brain strain,which is limited when compared to the recently developed state-of-the-art finite element HMs.42-44For example,the KTH model does not model the gyri or sulci,which have been shown to have significant influences on FEHM behavior.In the future,FEHMs can be applied to validate the results.
Another limitation of this study is that due to the difficulties of collecting head impact data in real-world scenarios,the quantity and diversity of the datasets used in this study are limited.Among the 3262 impacts observed in this study,2130 were collected by laboratory simulation.Additionally,we only considered American football impacts (355),MMA impacts(457),car crashworthiness test impacts (48),and racing car impacts (272).While American football and MMA bear high concussion-incidence rates,the worldwide participation rate in these sports is low compared to soccer,for example.In the future,more data will be collected to classify the head impact kinematics of other sports where players bear a moderate to high risk of concussion,including soccer,rugby,water polo,and ice hockey.8,45,46The current impact datasets will also be enlarged to be more representative of the distribution for each type of head impact with respect to different player positions within a single sport (e.g.,linevs.skill positions in American football).47
Finally,this study obeys the definitions of the classes according to human definitions of impact types,which are based on the sources of impacts (e.g.,CF impacts,MMA impacts,car crash impacts,etc.).In future research,alternative classifications could be used to"soft label” head impacts.That is,an unknown impact could be described in terms of the probability of each head impact type.For example,an impact could be labeled as 10%MMA,40%HM,and 50%CF.The weights would then be used to investigate the characteristics of the unknown head impact.One potential approach for the regression between head kinematics and brain strain is to weight the regression output given by the type-specific regression models according to the probability of soft-labeling classification.The difficulty of this regression is that the conditional probabilities of head impact types given the kinematics should not be directly transferred to brain strain because of the high nonlinearity of the brain-skull system.Based on previous exploration of the brain-skull system,11,19we believe that the conditional probabilities of head impact type given the kinematics should be amended to the weights on brain strain.Additionally,kinematics clustering,48which finds the impact clusters by breaking from human-defined impact types,may also be able to determine impact partitions according to characteristics intrinsic to the kinematics features.These impact partitions may better fit the data,potentially leading to the further improvement of type-specific modeling of brain strain.
5.Conclusion
In this study,we performed the classification of different types of head impacts and demonstrated the feasibility of classification with high accuracy based on the spectral density of measurable head kinematics (i.e.,linear acceleration and angular velocity).The important features for head impact classification included both low-frequency and high-frequency ranges of both linear acceleration and angular velocity.The classifier was also validated on 5 instrumented mouthguards to test the model performance across different types of mouthguard measurement devices.Finally,this study exhibited noninferior accuracy in the regression of brain strain with classification of different types of head impact as opposed to a single model for the mixture of all types of impacts together.The classification also reveals the difference between types of head impacts in the frequency domain.The classifier is publicly available for researchers to build better type-specific estimation models for brain injury risk.
Data availability
The datasets,classification model,feature extraction code,example kinematics file,and a user introduction are posted at https://github.com/xzhan96-stf/kinematics_classifier.
Acknowledgments
This research was supported by the Pac-12 Conference’s Student-Athlete Health and Well-Being Initiative,the National Institutes of Health(R24NS098518)and Stanford Department of Bioengineering.
Authors’contributions
XZ and YiL conceived this study,did the experiment and analyzed the data,and drafted the manuscript;YuL conceived and supervised this study,did the experiment and analyzed the data,and drafted the manuscript;DBC supervised this study and provided funding for this study;SJR,HVA,and ZZ provided constructive feedback during the progress of the experiments;HVA,ST,SB,and JR provided the data used in this study;NJC,OG,MMZ,and GAG revised the manuscript.All authors have read and approved the final version of the manuscript,and agree with the order of presentation of the authors.
Competing interests
The authors declare that they have no competing interests.
 Journal of Sport and Health Science2023年5期
- Journal of Sport and Health Science的其它文章
- How to make the “jump” on understanding the importance of the intrinsic foot muscles for propulsion
- Public health research on physical activity and COVID-19:Progress and updated priorities
- Examining the intrinsic foot muscles’capacity to modulate plantar flexor gearing and ankle joint contributions to propulsion in vertical jumping
- Exploring overweight and obesity beyond body mass index:A body composition analysis in people with and without patellofemoral pain
- The management of the long head of the biceps in rotator cuff repair:A comparative study of high vs.subpectoral tenodesis
- Risk factors for chronic ankle instability after first episode of lateral ankle sprain:A retrospective analysis of 362 cases