Reperfusion after hypoxia-ischemia exacerbates brain injury with compensatory activation of the anti-ferroptosis system: based on a novel rat model
Tian-Lei Zhang, Zhi-Wei Zhang, Wei Lin, Xin-Ru Lin, Ke-Xin Lin, Ming-Chu Fang, Jiang-Hu Zhu,3,*, Xiao-Ling Guo,4,5,*,Zhen-Lang Lin,,3,4,*
AbstractHypoxic-ischemic encephalopathy, which predisposes to neonatal death and neurological sequelae, has a high morbidity, but there is still a lack of effective prevention and treatment in clinical practice.To better understand the pathophysiological mechanism underlying hypoxic-ischemic encephalopathy, in this study we compared hypoxic-ischemic reperfusion brain injury and simple hypoxic-ischemic brain injury in neonatal rats.First, based on the conventional Rice-Vannucci model of hypoxic-ischemic encephalopathy, we established a rat model of hypoxic-ischemic reperfusion brain injury by creating a common carotid artery muscle bridge.Then we performed tandem mass tag-based proteomic analysis to identify differentially expressed proteins between the hypoxic-ischemic reperfusion brain injury model and the conventional Rice-Vannucci model and found that the majority were mitochondrial proteins.We also performed transmission electron microscopy and found typical characteristics of ferroptosis, including mitochondrial shrinkage, ruptured mitochondrial membranes, and reduced or absent mitochondrial cristae.Further, both rat models showed high levels of glial fibrillary acidic protein and low levels of myelin basic protein,which are biological indicators of hypoxic-ischemic brain injury and indicate similar degrees of damage.Finally, we found that ferroptosis-related Ferritin (Fth1)and glutathione peroxidase 4 were expressed at higher levels in the brain tissue of rats with hypoxic-ischemic reperfusion brain injury than in rats with simple hypoxic-ischemic brain injury.Based on these results, it appears that the rat model of hypoxic-ischemic reperfusion brain injury is more closely related to the pathophysiology of clinical reperfusion.Reperfusion not only aggravates hypoxic-ischemic brain injury but also activates the anti-ferroptosis system.
Key Words:ferroptosis; hypoxic-ischemic brain injury; hypoxic-ischemic encephalopathy; hypoxic-ischemic reperfusion brain injury; mitochondria; model;proteomic analysis; reperfusion; Rice-Vannucci; transmission electron microscopy
Introduction
Hypoxic-ischemic encephalopathy (HIE) caused by hypoxia and ischemia can cause death in newborns, and the survivors are at risk of developing sequelae such as cerebral palsy and epilepsy (Nevalainen et al., 2020; Kitai et al., 2021).Around 0.75 million babies worldwide suffer from moderate or severe HIE each year, resulting in around 400,000 babies with neurodevelopmental impairments (Victor et al., 2022).HIE can be treated with mild hypothermia therapy and with drugs.However, these treatments have some drawbacks,so it is essential to comprehend how HIE occurs to create new therapeutic choices (Azzopardi et al., 2009; Douglas-Escobar and Weiss, 2015; Zalewska et al., 2015).
Reperfusion injury secondary to hypoxic-ischemic injury plays an important role in the pathophysiological mechanism of HIE.We searched PubMed and found a few studies that explored reperfusion in HIE.Previous studies have focused on the establishment of ischemia/reperfusion brain damage in neonatal rats by various methods such as temporary clamping of the common carotid artery (CCA), middle cerebral artery occlusion, and placental ischemia/reperfusion models (Sparnaaij et al., 2016; Larpthaveesarp and Gonzalez,2017).However, these procedures have not been widely used for a variety of reasons, including as the difficulty of the surgery and the high mortality rates among the experimental animals, resulting in a lack of study addressing the mechanism of ischemia/reperfusion brain damage.Therefore, based on the Rice-Vannucci model, also known as the hypoxic-ischemic brain injury model(Rice et al., 1981), we developed a hypoxic-ischemic reperfusion brain injury model using the CCA muscle bridge and verified its reliability and stability.The Rice-Vannucci model simulates hypoxic-ischemic injury, and the hypoxicischemic reperfusion brain injury (HIRBI) model simulates hypoxic ischemia/reperfusion brain damage (HIRBD).Comparing these two models was expected to yield new insight into the pathophysiological process of an injury caused by these conditions.
It is possible to investigate the links between gene expression and metabolism by using proteomics analysis (Huang et al., 2022).Tandem mass tag (TMT) is a peptide-labeling technique that is used to identify proteins by tandem mass spectrometry.It can quickly and accurately detect a wide range of proteins,and proteomics and bioinformatics analysis of animal models can indicate promising directions for follow-up research (Shao et al., 2017).Therefore, we conducted a bioinformatics analysis of protein expression in the rat cerebral cortex to identify changes that occur during the two pathological stages of HIE.Transmission electron microscopy (TEM) is an important tool that can be used to study biological structure at the nanometer scale (Trépout et al.,2017).Accordingly, we used proteomic analysis and TEM to investigate the effects of HIRBI in rats.
Methods
Animals
All animal experiments were performed in strict accordance with the National Institutes of Health Guide for the Care and Use of Laboratory Animals (8thed, National Research Council, 2011) and were approved by the Animal Experimentation Ethics Committee of Wenzhou Medical University (ethical protocol No.2021-0347) on September 30, 2021.Sprague-Dawley rats (10 male, 20 female, 15 weeks old, weighing 200–250 g) were purchased from the Weitong Lihua Experimental Animal Center (Beijing, China; license No.SYXK (Jing) 2020-0014) and breed to produce animals for experimental use.
Rats were kept under specific pathogen-free conditions.Humidity was maintained between 40% and 70%, and temperature was maintained between 20°C and 25°C.All rats were housed in cages with a 12/12-hour light/dark cycle and free access to food and drink.Each cage contained one male rat and two female rats that were allowed to freely mate to produce offspring for subsequent studies.After giving birth, the mother rat and pups were moved to a separate cage.As clinical and animal studies have shown that sex can affect the prognosis of HIE (Mirza et al., 2015), male rats (n= 60)were utilized in the trials to eliminate any gender-based influence.
Neonatal rats were randomly assigned to three different groups: Sham,Rice-Vannucci, and HIRBI (n= 20 rats/group).Animals were put to sleep by breathing in 5–6% isoflurane (Yien Chemical Technology Co., Ltd., Shanghai,China), and the animals stayed asleep during surgery by breathing in 1–2%isoflurane.After surgery, the animals were allowed to recover in a warm chamber for 10 minutes.At the end of the experiment, the pups were returned to their mothers.
Sham group: The right CCA was exposed, and no other operations were performed.Rice-Vannucci group: The proximal and telecentric ends of the right CCA were ligated, and the artery between the ligation knots was cut carefully.After surgery, the rats were allowed to rest in a 37°C chamber for 10 minutes, and then they were subjected to hypoxia (8% oxygen and 92% nitrogen) in a hypoxia chamber for 120 minutes.HIRBI group: Briefly,the blood flow of the right CCA was blocked for 150 minutes (including 120 minutes of exposure to hypoxic circumstances), and then the right CCA muscle bridge was relieved by muscle bridge relief operation (Figure 1).The rats in each group were returned to their mothers after the operations.
HIRBI modeling
Based on the Rice-Vannucci model (Rice et al., 1981), we developed a HIRBI model using the CCA muscle bridge technique.
CCA muscle bridge operation
The right mastoid muscle (MM), stemohyoideus muscle (SHM), and right CCA were exposed during surgery.The SHM was then divided into two fascicles(left and right).A 5-cm-long 8-0 suture thread was slipped beneath the right MM, right CCA, and right fascicle of the SHM.The opposite end of the suture thread was crossed over the right MM before being passed through the bottom of the right CCA.The two ends of the suture thread were then tied above the right fascicle of SHM so that the right MM and the right fascicle of SHM were bound together to form the first muscle bridge, which compressed the right CCA.The second muscle bridge was constructed 3 mm from the telecentric end of the first muscle bridge of the CCA.One end of another 5 cm-long suture thread was passed over the right CCA, then crossed below the right MM and the right fascicle of the SHM.The two ends of this suture thread were tied together so that the right MM and the right fascicle of SHM were bound together to clamp the right CCA.
Muscle bridge relief operation
After inducing ischemia for the allotted time, the bridges’knots were removed with microsurgical scissors to alleviate pressure on the CCA.After blood flow was restored, the incision was sutured.
Duration of hypoxia and ischemia
According to the results of our preliminary experiment, there was no evidence of injury if the ischemic time was less than 150 minutes, and the mortality rate increased as the ischemic time increased; and thus, we set the hypoxicischemic time to 150 minutes and the hypoxia exposure time to 120 minutes.The duration of hypoxia exposure was defined as beginning when the oxygen concentration in the hypoxia chamber reached 8% and ending when the animals were removed from the hypoxia chamber.The hypoxia exposure time for the HIRBI and Rice-Vannucci groups was 120 minutes.The duration of ischemia in the HIRBI group was defined as beginning when the muscle bridge surgery was completed and ending when the muscle bridges were released.Differential gene expression is most pronounced 24 hours after reperfusion,and imaging investigations have found that 24 hours after reperfusion is when the most significant structural differences are apparent (Büttner et al., 2009;Gang et al., 2013).Therefore, we chose 24 hours after modeling as the time point for assessment.
Laser speckle imaging
Laser speckle imaging (LSI) was used to detect the perfusion units (PU)of cerebral blood flow (CBF).The left and right CBF were recorded and compared.All LSI tests were performed after removing the animals from the hypoxic chamber.In the Sham group, LSI was performed after the sham operation.In the Rice-Vannucci group, LSI was performed after exposure to hypoxic conditions.In the HIRBI group, the first LSI test was performed after exposure to hypoxic conditions, and the second LSI test was performed after the muscle bridge release operation.The rats were anesthetized by inhalation of 5–6% isoflurane, and the skulls were exposed by making an arc-shaped incision in the scalp.The left and right PU values were recorded using LSI.The scalp was sutured after the LSI test, and the rats were returned to their mothers.LWCI software (RFLSI 3.0, RWD Life Science, Shenzhen, Guangdong,China) was used to analyze the data.
Proteomics analysis
Protein extraction and purification
Brain tissue was extracted from rats sedated with 5–6% isoflurane, and total protein was separated from the brain tissue and delivered to LC-BIO Technologies Co., Ltd.(Hangzhou, Zhejiang, China) for proteomics analysis.
To separate total protein from brain tissue, lysis buffer was applied to samples of brain tissue, which were then incubated in a water bath for 10 minutes,centrifuged at 25,000 ×gfor 15 minutes, and the supernatant was collected.The protein content was quantified using the bicinchoninic acid method(Wiśniewski et al., 2009).Protein sample which weights 200 μg was filtered and combined with a final concentration of 100 mM dithiothreitol, and the solution was boiled in a water bath for 5 minutes.After cooling to room temperature, 200 μL of 8 M urea buffer was added to the protein solution.The mixture was centrifuged at 25,000 ×gfor 25 minutes, the supernatant was discarded, and the pellet was washed twice with uric acid.Then, 100 μL of iodoacetamide buffer (100 mM iodoacetamide in 8 M urea) was added.The mixture was shaken at 50 ×gfor 1 minute at room temperature and then centrifuged at 25,000 ×gfor 25 minutes.The supernatant was discarded, and the cells were washed with 8 M urea buffer for 2 days.Then the final filtrate was collected (Wiśniewski et al., 2009).
Peptide tagging and reverse-phase chromatography
TMT quantitative proteomic analysis was performed using an AQ Exactive Plus(Thermo Fisher Scientific, Waltham, MA, USA) high-resolution Orbitrap mass spectrometer (Savitski et al., 2018).One hundred micrograms of each peptide were labeled using a Thermo TMT Labeling Kit (Thermo Fisher Scientific)according to the manufacturer’s instructions.The labeled peptides were mixed and fractionated using an Agilent 1260 Infinity II HPLC system (Agilent Technology Co., Ltd., Beijing, China).The sample was eluted from the column using a 1 mL/min flow syringe, the absorbance at 214 nm was monitored during elution, each minute, roughly 40 elution fractions were collected.After lyophilization, the samples were dissolved and mixed with 0.1% formic acid.
Mass spectrometry
Samples were separated using a nanoliter flow rate EasynLC system (Thermo Fisher Scientific).Buffer A (AmyJet Scientific Inc., Wuhan, Hubei Province,China) was 0.1% formic acid in water, and buffer B (AmyJet Scientific Inc.) was 0.1% formic acid in acetonitrile (80% acetonitrile).The 100% A-equilibrated samples were auto-injected into 50 μm × 15 cm columns (nanoViper, P/N164943, Thermo Fisher) using an auto-injector at a flow rate of 300 nL/min,for chromatographic separation and mass spectrometric analysis (Wu et al.,2020).In order to gather the mass-to-charge ratio of peptides and peptide fragments, the positive ion detection mode in the parent ion scanning range was set to 350–1800 MHz and the first-order maximum was set to 50 ms.Occlusion solution mode was used to obtain MS2 spectra from 10 fragment profiles (MS2 scans) taken after each full scan.
Proteomics data analysis and protein quantification
The levels of protein expression in three cerebral cortex samples from each group were compared by proteomics sequencing and analysis.The raw files generated by AQ Exactive Plus were converted using Proteome Discoverer 2.1 (Thermo Fisher Scientific), and the files were sent to OmicStudio tools(Lc-bio Technologies Co., Ltd.) for analysis (Huang et al., 2022).Differentially expressed proteins were defined as those with a fold change (FC) greater than 1.2 and aP-value less than 0.05.The differentially expressed proteins were functionally classified by Gene Ontology secondary annotation analysis,subcellular structure annotation classification, and functional enrichment analysis.Bioinformatics analysis was performed using OmicStudio tools(https://www.omicstudio.cn/tool).We used Wolf Psort (https://wolfpsort.hgc.jp/) to predict the subcellular localizations of the proteins (8F General Research Bldg., Tokyo, Japan).
Transmission electron microscopy
TEM was performed on three rats in each group.Brain tissue samples(hippocampal CA1 region) were harvested and fixed with ice-cold 2.5%glutaraldehyde in phosphate buffer saline (PBS) for 2 hours, post-fixed in 1%osmium tetroxide, and dehydrated in a graded series of ethanol (50–100%)and acetone.Ultrathin sections (Leica, Wetzlar, Germany) were taken from hippocampal CA1 region and observed using a JEM-2100 TEM transmission electron microscope (JEOL, Tokyo, Japan) at 200 kV.
Immunofluorescence staining
Immunofluorescence staining was performed on sections of whole brain from three rats in each group.The brain tissues were preserved in a 4%paraformaldehyde solution at 4°C, then dehydrated and embedded in paraffin.Next, 4 μm-thick coronal sections were obtained.The sections were then deparaffinized, subjected to antigen retrieval, permeabilized with Triton X-100, washed with PBS, and blocked with 10% goat serum (Wolcavi Biotechnology Co., Ltd, Beijing, China).The sections were incubated overnight at 4°C with polyclonal rabbit antibodies to glial fibrillary acidic protein (GFAP;1:200, Wanleibio, Shenyang, China, Cat# WL0836, RRID: AB2893014) or myelin basic protein (MBP; 1:200, ABclonal, Wuhan, Hubei Province, China,Cat# A1664, RRID: AB2763719).The sections were rinsed with PBS again and then incubated for 90 minutes at 37°C with Cy3 goat anti-rabbit IgG (1:500,ABclonal, Cat# AS007, RRID: AB2769089) or FITC Goat Anti-Rabbit IgG (1:500,ABclonal, Cat# AS011, RRID: AB2769476).The sections were then washed with PBS, stained with 4, 6-diamidino-2′-phenylindole (Sigma, St.Louis,MO, USA) for 15 minutes, sealed, washed with PBS, and viewed under a fluorescence microscope (Leica, Wetzlar, Germany).
Western blotting
Western blotting (WB) was performed for protein isolated from four rats in each group.After 24 hours of reperfusion, the three groups of rats were anaesthetized and then sacrificed by isoflurane inhalation.The cerebral cortex was rapidly removed, then radio-immunoprecipitation assay lysis buffer(Beyotime, Nanjing, China) and protease inhibitors were added.The protein concentration was estimated using an enhanced bicinchoninic acid protein assay kit (Proteintech, Wuhan, China).After that, the proteins were separated on an 8–12% sodium dodecyl sulfate-polyacrylamide gel (Thermo Fisher Scientific) and transferred to polyvinylidene fluoride membranes (Millipore,Boston, MA, USA).Subsequently, the polyvinylidene fluoride membranes were blocked with 5% skim milk at 22°C with shaking.After washing with Tris-buffered saline (Sigma) and Tris-buffered saline-Tween (Thermo Fisher Scientific), the polyvinylidene fluoride membranes were incubated with primary antibodies to β-actin (mouse, 1:3000, Affinity, Liyang, Jiangsu Province, China, Cat# T0022, RRID: AB2839417), glutathione peroxidase 4 (GPX4; rabbit, 1:1000, ABclonal, Wuhan, China, Cat# A11243, RRID:AB2861533), MBP (rabbit, 1:1000, Biorbyt, Shanghai, China, Cat# orb27400,RRID: AB10755393), GFAP (rabbit, 1:1000, Wanleibio, Shenyang, China, Cat#WL0836, RRID: AB2893014), transferrin receptor (TFRC; rabbit, 1:1000,ABclonal, Cat# A5865, RRID: AB2766615), and Fth1 (1:1000, rabbit, Biorbyt,Cat# orb26148, RRID AB10924500) at 4°C for 10 hours.After washing threetimes with TBST, the membranes were incubated for 1 hour at 22°C with HRP donkey anti-rabbit IgG (1:5000, ABclonal, Cat# AS038, RRID AB2769848) or HRP goat anti-mouse IgG (1:5000, ABclonal, Cat# AS003, RRID AB2769851).The bands were detected using a ChemiDoc-XRS imaging system (Bio-Rad,Heracles, CA, USA), and the optical density of each band was determined using Image Lab 6.1 software (Bio-Rad) and ImageJ 1.53 software (NIH,Bethesda, MD, USA) (Schneider et al., 2012).Each experiment was carried out at least three times.
Statistical analysis
The sample size was calculated using the following formula: (Zα + Zβ)2× 2σ2/δ2(Hulley et al., 2013).The values Zα = 1.96, Zβ = 1.28, σ = 82, and δ = 119 were derived from the preliminary LSI experiment results.To account for the expected mortality rate, 20 rats were included in each group.At the end of the experiment, 20 rats from the Sham group and 18 rats from the Rice-Vannucci and HIRBI groups survived.Two evaluators blinded to the group assignments performed the assessment and analyzed the data.A minimum of three independent experiments were performed and analyzed to generate the quantitative data.Normality was tested by Q-Q plots.Levene’s test was performed to assess homogeneity of variance, and nonparametric tests were performed if the data did not exhibit normal distribution or homogeneity in variance.Between-group comparisons were conducted using the Student’st-test.Differences between more than two groups were analyzed using oneway analysis of variance and Tukey’s honestly significant difference (post hoctest).All statistical analyses were performed using GraphPad Prism version 8.0.0 (GraphPad Software, San Diego, CA, USA, www.graphpad.com).The level of significance was set atP< 0.05.
Results
The CCA muscle bridge technique can be used to construct a HIRBI model
CBF status was assessed by examining physical images (Figure 1B), speckle images (Figure 1C), and pseudo-color images (Figure 1D) obtained by LSI.The LSI results showed that the left and right CBF were normal in the Sham group,whereas the right CBF was significantly decreased in the Rice-Vannucci and HIRBI groups.After the muscle bridge was removed, right CBF was restored.Therefore, we concluded that a CCA muscle bridge can be used to induce HIRBI, and that release of the muscle bridge restores CBF without damaging the CCA.This model could therefore be used to compare brain tissue proteomics with those from the Rice-Vannucci model.Mortality rate can be used as a criterion to evaluate degree of brain injury.The mortality rates in the HIRBI and Rice-Vannucci groups were not significantly different, as both were 10% (2/20).Since HIRBI is a simple operation with low mortality, it is likely to be useful for future HIE studies.
Differentially expressed proteins in brain tissue from HIRBI and Rice-Vannucci model
Rice-Vannucci group versus Sham group
Compared with the Sham group, the brain tissues of the Rice-Vannucci group showed 29 differentially expressed proteins (Figure 2A).11 proteins were significantly up-regulated, such as Ras interacting protein (RASIP1),dodecenoyl-coenzyme A delta isomerase (ECI1), and DNA topoisomerase IIbinding protein 1 (TOPBP1 (Table 1), and 18 proteins were significantly downregulated, such as microtubule-associated protein tau (MAPT), leucine-rich repeat-containing protein 4B (LRRC4B), and Pogo transposable element with ZNF domain (POGZ) (Figure 2B).
In addition, subcellular structure annotation classification revealed that 50% of the significantly up-regulated differentially expressed proteins were cytoplasmic (Figure 2C), whereas out of the significantly down-regulated differentially expressed proteins, 43.75% were cytoplasmic, 18.75% were associated with the plasma membrane, and 18.75% were cytoskeletal(Figure 2D).
HIRBI group versus Sham group
Compared with the Sham group, there were 143 distinct differentially expressed proteins in the HIRBI group (Figure 3A).In total, 62 proteins were significantly up-regulated, such as GFAP, GPX4, Fth1, and DNA topoisomerase II-binding protein 1 (TOPBP1), and 81 proteins were significantly downregulated, such as MBP, Sorting nexin 25 (SNX25), and MAP2 (Figure 3B).
Furthermore, out of the significantly up-regulated differentially expressed proteins, 42.11% were cytoplasmic, 10.53% were in the plasma membrane and 10.53% were cytoskeletal (Figure 3C).Out of the significant downregulated differentially expressed proteins, 46.48% were cytoplasmic, 19.72%were associated with the plasma membrane, and 15.49% were cytoskeletal(Figure 3D).
HIRBI group versus Rice-Vannucci group
Compared with the Rice-Vannucci group, there were 43 differentially expressed proteins in the HIRBI group (Figure 4A).In total, 22 proteins were significantly up-regulated, such as Rho GTPase-activating protein 33(ARHGAP33), sequestosome-1 (SQSTM1), leucine-rich PPR motif-containing protein (LRPPRC), and nischarin (NISCH), and 21 proteins were significantly down-regulated, such as Ras interacting protein 1 (RASIP1), Dodecenoyl-Coenzyme A delta isomerase (ECI1), and Sorting Nexin 25 (SNX25)(Figure 4B).
Moreover, among the significantly up-regulated differentially expressed proteins, 47.83% were cytoplasmic, 13.34% were cytoskeletal, 8.7% were mitochondrial (Figure 4C), and 55% of the significantly down-regulated differentially expressed proteins were cytoplasmic (Figure 4D).
We used a Venn diagram based on the differential gene cluster analysis, Gene Ontology analysis, and Kyoto Encyclopedia of Genes and Genomes analysis to identify overlap between the differentially expressed proteins among the three groups.There were four co-upregulated proteins in HIRBI group compared with the Sham group and in the HIRBI group compared with the Rice-Vannucci group (Figure 5A), including interferon regulatory factor 2 binding protein 1 (IRF2BP1), multiple myeloma tumor-associated protein 2 homolog (MMTAG2), hypothetical protein LOC499219 (LOC499219), and 60S ribosomal protein L21 (60SRP21l) (Figure 5C).There were four co-upregulated proteins in the HIRBI group compared with the Sham group and in the Rice-Vannucci group compared with the Sham group, including coiled-coil domaincontaining 9 (CCDC9), integrin beta (ITGB2), DNA topoisomerase II-binding protein 1 (TOPBP1), and GTP-binding protein 1 (GTPBP1) (Figure 5D).
Moreover, there were four co-downregulated proteins in the HIRBI group compared with the Sham group and in the HIRBI group compared with the Rice-Vannucci group (Figure 5B), including protein-serine/threonine kinase(BCKDK), two pore calcium channel protein 1 (TPCN1), sorting nexin 25(SNX25), and ADP-ribosylation factor-like 10 (ARL10) (Figure 5E).There were three co-downregulated proteins in the HIRBI group compared with the Sham group and in the Rice-Vannucci group compared with the Sham group,including coiled-coil domain-containing 177 (CCDC177), RAB22A, a member of the RAS oncogene family (RAB22A), and RAB39, a member of the RAS oncogene family (RAB39A) (Figure 5F).
Mitochondrial ultrastructure in the hippocampal CA1 region in HIRBI and Rice-Vannucci model
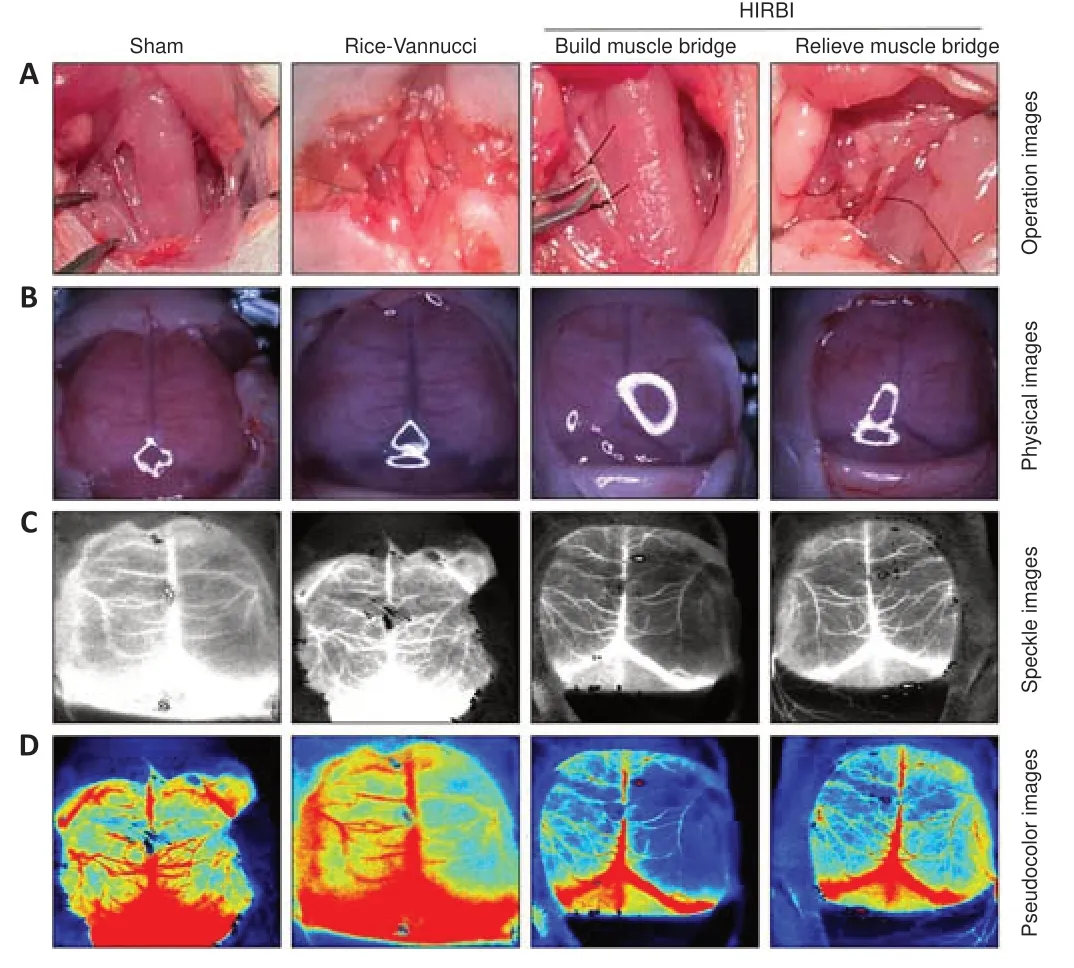
Figure 1|Animal model establishment and laser speckle imaging of the brain.
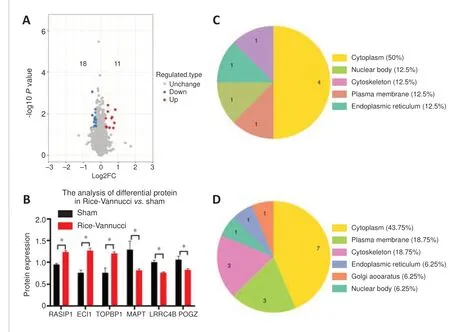
Figure 2|Proteomics analysis of brain tissue from the Rice-Vannucci vs.Sham groups, performed using OmicStudio tools.
Due to the fact that most of the differentially expressed proteins were located in the mitochondria, we observed the mitochondria by TEM.In the Sham group, the mitochondrial membrane was intact, and the mitochondrial size and mitochondrial cristae apparatus were relatively normal (Figure 6A).Mitochondrial shrinkage was found in both the Rice-Vannucci and HIRBI groups.In addition, the mitochondrial membrane was ruptured, and the mitochondrial cristae were reduced or absent (Figure 6BandC); these features are consistent with ferroptosis (Chen et al., 2021; Lin et al., 2022).There was no discernible difference in degree of damage between the HIRBI and Rice-Vannucci models.
Verification of technical bioinformatics analysis and ferroptosis results
Immunofluorescence assays
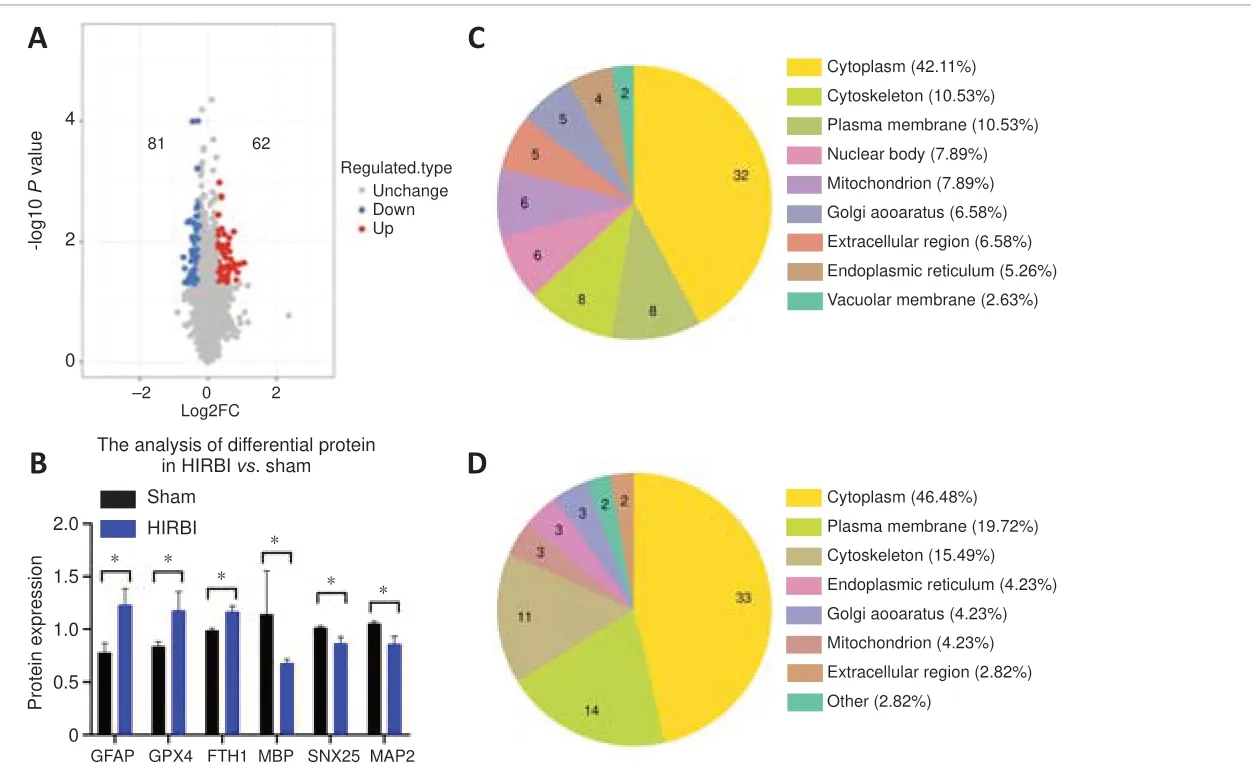
Figure 3|Proteomic analysis of brain tissue from the HIRBI vs.Sham groups,performed using OmicStudio tools.

Figure 4|Proteomics analysis of brain tissue from the HIRBI vs.Rice-Vannucci groups, performed using OmicStudio tools.
Based on the proteomic bioinformatics analysis results, we analyzed GFAP and MBP expression in the brain.GFAP and MBP are the most reliable and potential biomarkers for early assessment of hypoxic-ischemic brain injury and prediction of long-term neurological dysfunction in HIE neonates (Garcia-Alix et al., 1994; Lv et al., 2015).The level of GFAP expression in both the HIRBI and Rice-Vannucci groups was higher than that in the Sham group (P<0.05;Figure 7A).However, the highest level of MBP expression was seen in the Sham group (P< 0.05;Figure 7B).
Western blot assay
In the following steps, we selected five proteins (GFAP, MBP, GPX4, MAP2,and Fth1) from the proteomic bioinformatic analysis and confirmed their expression changes by western blot analysis (Figure 7CandD).The trends in GFAP and MBP expression detected by western blot were consistent with those identified by proteomics analysis (P< 0.05).MAP2 expression was significantly lower in the HIRBI group than in the Rice-Vannucci group (P<0.05).The expression levels of Fth1 and GPX4 were significantly higher in the HIRBI group than in the Rice-Vannucci group (P< 0.05).

Figure 5|Venn diagram analysis of co-upregulated or co-downregulated proteins among the proteins that were significantly differentially expressed between the Rice-Vannucci vs.HIRBI groups.
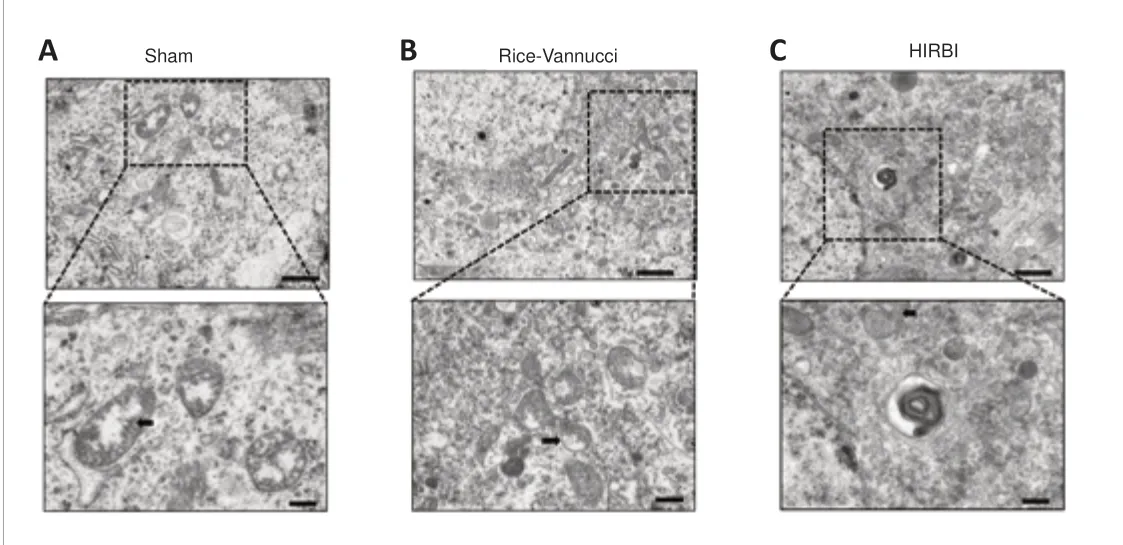
Figure 6|Transmission electron microscopy (TEM) analysis of mitochondrial structures in the hippocampal CA1 region.
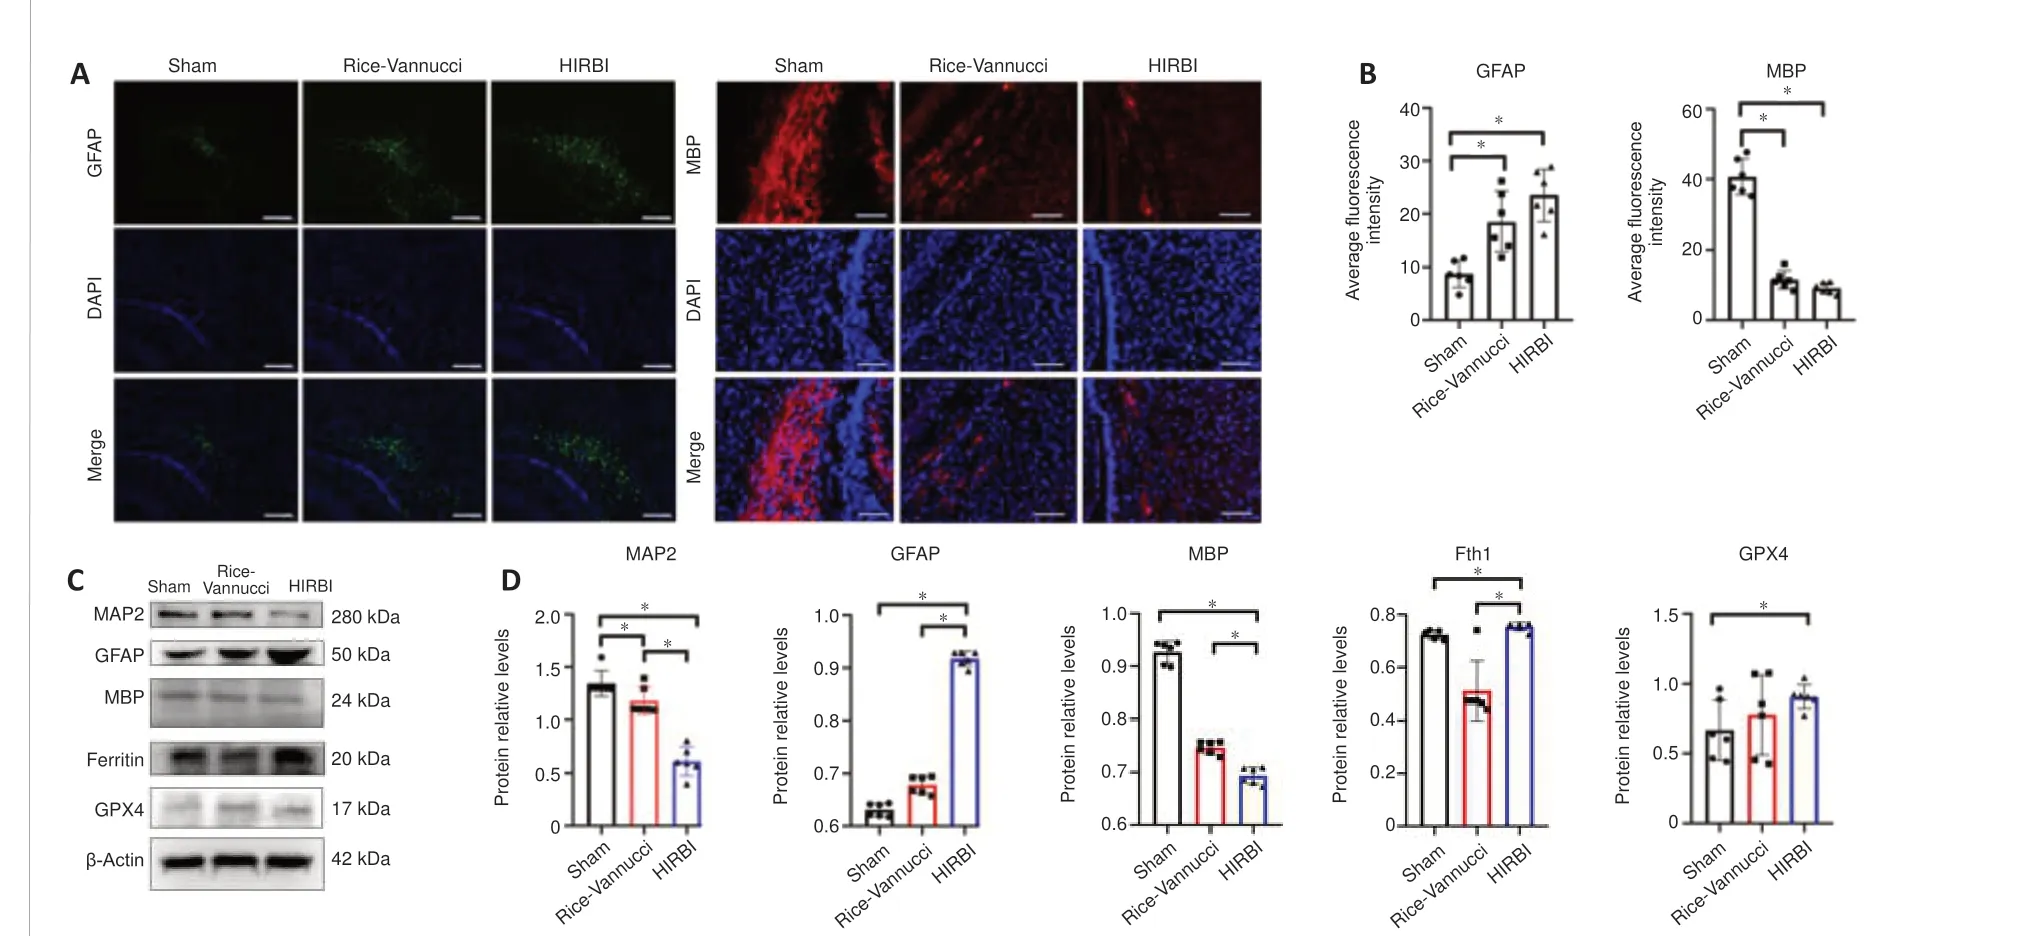
Figure 7|Immunofluorescence staining and Western blot analysis of the different groups.
Discussion
Reperfusion, as an important part of HIE pathology, is not only the continuation of primary injury but can also produce a large number of free radicals and cytokines, which leads to further circulation failure, and it can also induce expression of proinflammatory factors and activation of the caspase pathway (Kulik et al., 2008).Additionally, reperfusion can aggravate damage to the blood-brain barrier as a result of hypoxic-ischemic injury(Warach and Latour, 2004).The degree of reperfusion injury also differs with the duration of ischemia (Heo et al., 2005; Zhu et al., 2016).However, the mechanism of reperfusion injury has not been fully elucidated.It is therefore necessary to carry out relevant studies on reperfusion in HIE.
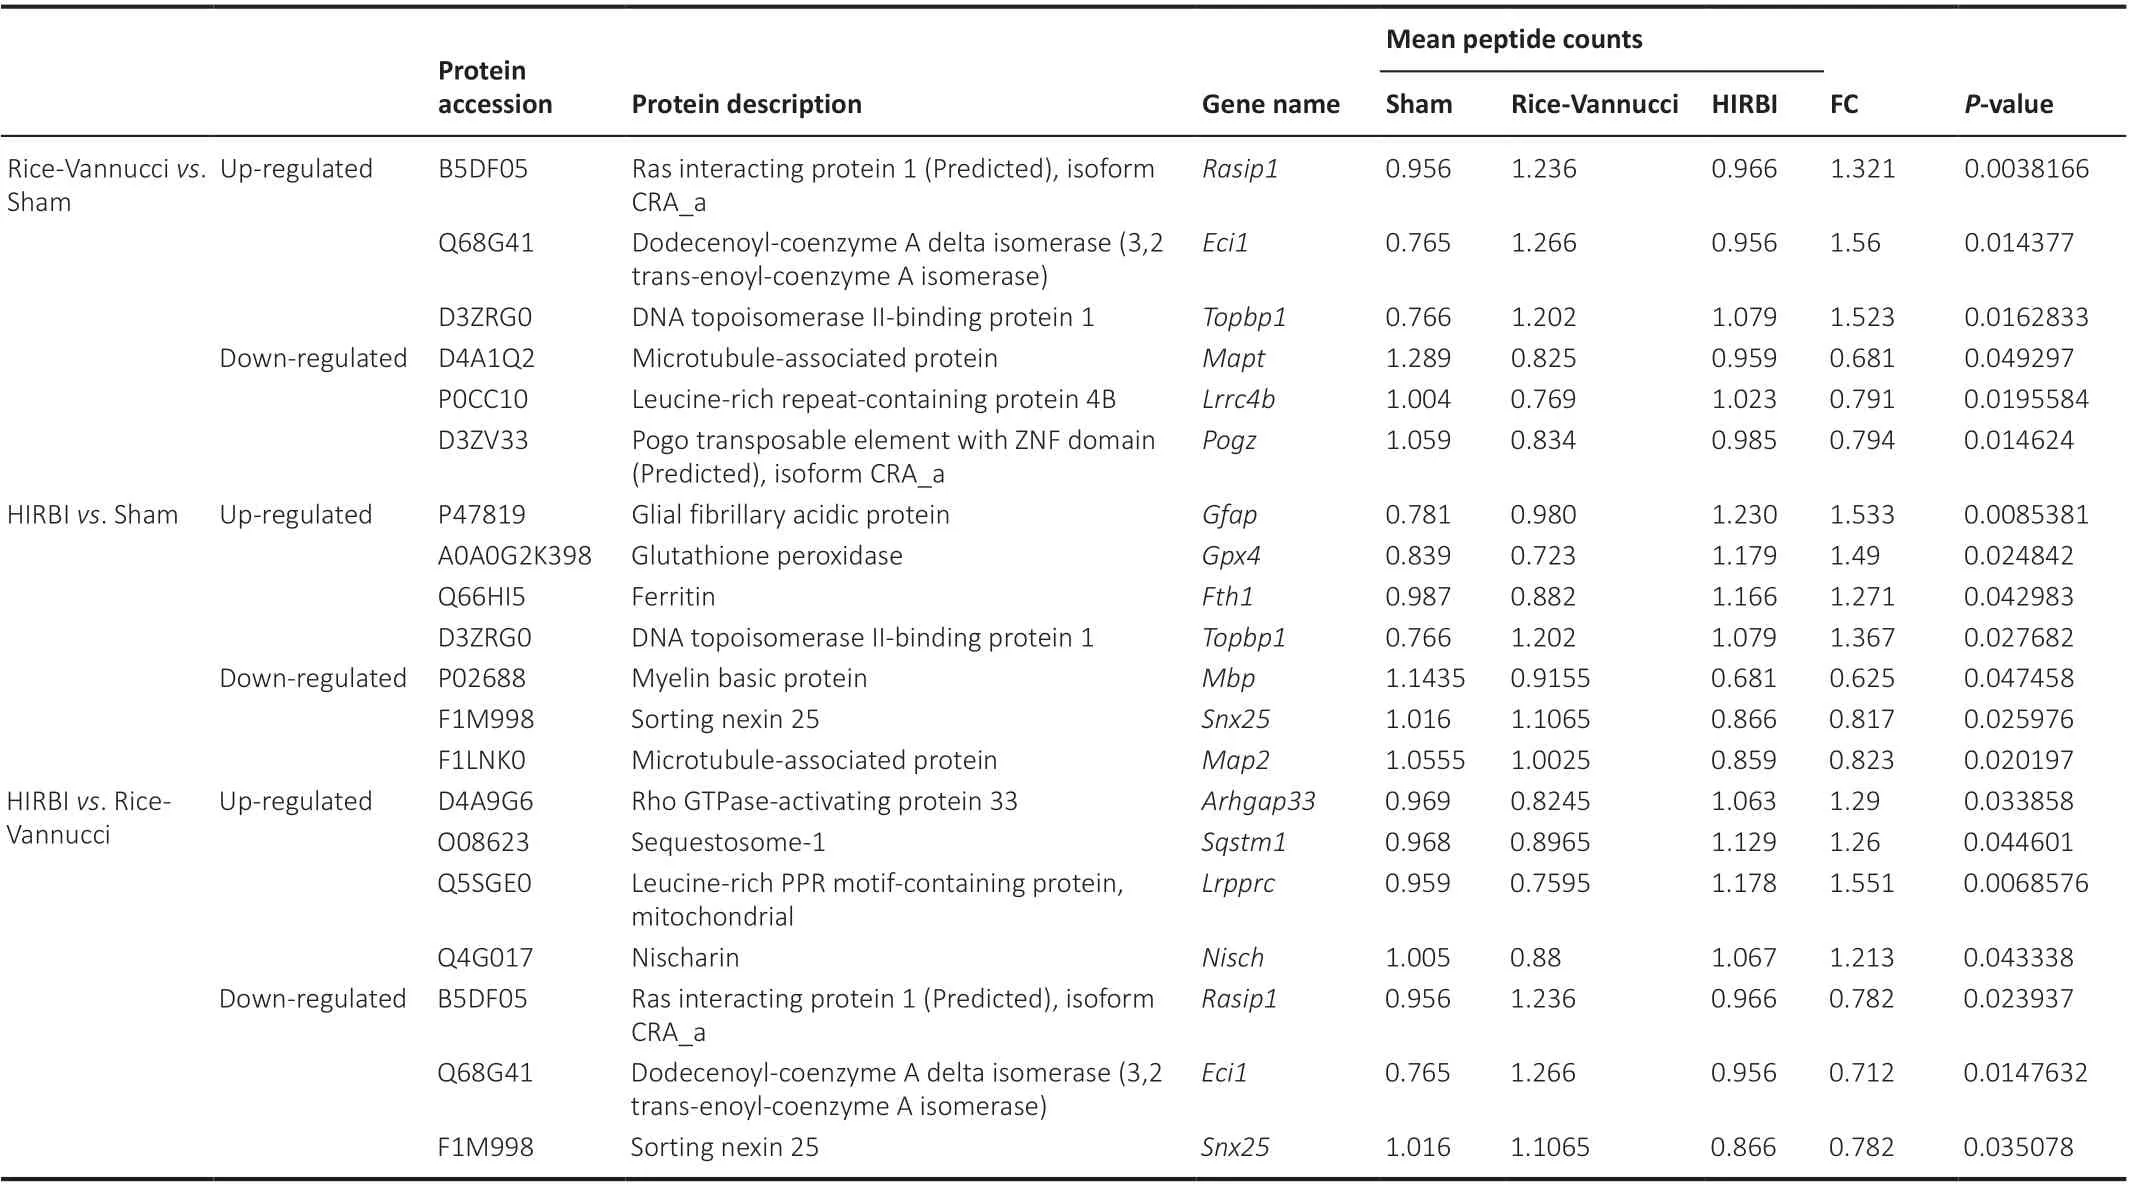
Table 1 |Differentially expressed proteins in different groups
As a classical hypoxic-ischemic brain injury model, the Rice-Vannucci model is recognized as accurately simulating the pathological processes of hypoxia and ischemia in HIE (Vannucci, 2000).The HIRBI model additionally replicates the pathological process of reperfusion in HIE.To investigate the pathophysiological processes of reperfusion in HIE, we evaluated differentially expressed proteins between the Sham, Rice-Vannucci, and HIRBI groups.
RASIP1 plays an important role in embryonic and postnatal blood vessel formation, remodeling, and Rho GTPase activity modulation (Koo et al.,2016).The interaction of RASIP1 with a series of GTPases including Ras and Rap1 can also stimulate the activity of Cdc42 and Rac1 (both are Rho GTPase family members) to stimulate vascular lumen formation while inhibiting RhoA activity to prevent vascular collapse and degeneration (Barry et al., 2016).Increased RhoA expression or activity increases the risk of cerebrovascular malformations, especially cerebral cavernous malformation and arteriovenous malformation (Scimone et al., 2019, 2020a, b).The high level of RASIP1 expression observed in the Rice-Vannucci group may be related to promoting new blood vessel formation and preventing vascular problems from developing.ECIL, a key mitochondrial enzyme, catalyzes the gradual degradation of cis monounsaturated and polyunsaturated fatty acids into 2-trans enol-CoA intermediates.During this process, 3-cis and 3-trans enol-CoA esters are produced, which are involved in the β-oxidation of unsaturated fatty acids (Bramhecha et al., 2022).The high level of ECIL expression observed in the Rice-Vannucci group may be involved in energy metabolism in ischemia.DNA TOPBP1 plays a crucial role in DNA replication,DNA repair, DNA damage checkpoint activation, and chromosome segregation(Bramhecha et al., 2022).The high level of DNA TOPBP1 expression observed in the Rice-Vannucci group may contribute to repair and prevention of the DNA damage caused by hypoxia and ischemia.MAPT, also known as tau protein, is expressed in nerve cell axons and can promote microtubule assembly, regulate axonal transport, and promote axonal growth and development, as well as interact with the mitochondrial outer membrane protein Miro1 to regulate mitochondrial homeostasis (Bharat et al., 2021).Tau dysfunction is involved in a wide range of degenerative diseases of the central nervous system, such as Alzheimer’s disease, cortical basal degeneration,Parkinson’s disease, and chronic traumatic encephalopathy (Strang et al.,2019; Ju and Tam, 2022; Roda et al., 2022; Torres et al., 2022).The decreased MAPT expression found in the Rice-Vannucci group results from neuronal axon and mitochondrial injury.LRRC4B, a member of the LRR protein family,is mainly expressed in neurons, where it plays a protective role, regulating the formation of excitatory synapses and promoting axonal differentiation.Mutations in human LRRC4B have been linked to autism spectrum disorders and intellectual disability, and LRRC4B also acts as a tumor suppressor gene to inhibit glioma cell proliferation (Kwon et al., 2010).There may be a link between the low levels of LRRC4B expression observed in the Rice-Vannucci group and neuronal synapse damage.POGZ is highly expressed in the cortex and hippocampus, where it participates in the regulation of neurogenesis in embryonic and adult brains and maintains normal mitosis and chromosome segregation.The low level of POGZ expression observed in the Rice-Vannucci group may disrupt mitosis and cause an increase of heteromorphic differentiated cells, ultimately resulting in cell death or genomic instability.
GFAP, a type III intermediate filamentous protein, is a marker of astrocyte activation in the central nervous system; it supports cytoskeletal structure and maintains its tension strength.Furthermore, GFAP plays a role in migration,signal transduction, neuron-glial interaction, and blood-brain barrier construction in astrocytes (Middeldorp and Hol, 2011).The high level of GFAP expression observed in the HIRBI group indicates severe damage and astrocyte activation.GPX4, one of the most important antioxidants, is an inhibitor of ferroptosis.GPX4 is synthesized in the brain, where it directly neutralizes reactive oxygen species (ROS) and reactive nitrogen species (Cardoso et al.,2017).The high level of GPX4 expression observed in the HIRBI group may be responsible for the removal of free radicals after reperfusion.Fth1, also known as Ferritin, is a major storage nanocage that stores redox-inactive iron and can prevent iron-mediated ROS production, thereby inhibiting ferroptosis (Hu et al., 2021).The high level of Fth1 expression observed in the HIRBI group may reflect increased storage and sequestration of the massive influx of iron that occurs during reperfusion to prevent iron overload.MBP is the only structural protein critical for myelination in central nervous system that interacts with cytoplasm in a way that assures the speed of information transmission and the possibility of action potential transmission along the axons.In addition,MBP interacts with the cytoskeleton to regulate signal transduction and also has functions related to cell cycle regulation, gene expression, and alternative splicing of primary mRNA (Boggs, 2006).The low level of MBP expression that we observed may be due to the severe destruction of the myelin sheath caused by reperfusion.SNX25 is involved in regulating the transmembrane transport of macromolecular proteins, intracellular protein sorting, signal transduction, and organelle movement (Hao et al., 2011; Su et al., 2017).The low level of SNX25 expression observed in the HIRBI group may be related to the disruption in protein transport and translocation caused by reperfusion.MAP2 belongs to the family of structural microtubule-associated proteins that are mainly expressed in neuron cell bodies and dendrites and are involved in neuronal development, maturation, and stability, as well as dendritic extension and plasticity (Dehmelt and Halpain, 2005).MAP2 is found mainly in neurons and can be used as a marker of neuronal injury (Hashemi et al.,2017; Bae et al., 2020).Likely, the low level of MAP2 expression observed in the HIRBI group is related to injury caused by reperfusion.The HIRBI group showed GFAP expression levels that were significantly higher, while MBP and MAP2 expression levels were significantly lower than those of the Rice-Vannucci group.This suggests that the HIRBI group was more severely damaged than that of the Rice-Vannucci group.ARHGAP33, also known as SNX26, is expressed in the Golgi body and in neuronal endosomes, and regulates the efflux and sorting of membrane proteins, which plays a crucial role in neuronal development, synaptic establishment and maintenance,synaptic transmission, plasticity regulation, and memory formation (Nakazawa et al., 2016).The high level of ARHGAP33 expression observed in the HIRBI group may be related to partial functional recovery after reperfusion.SQSTM1 is an important selective adaptor protein of autophagy that plays an important role in the clearance of ubiquitinated proteins.It also regulates the Nrf2-, NF-κB-, and Caspase-8-mediated apoptosis signaling pathways (Jin et al., 2009; Ichimura et al., 2013; Chang et al., 2014).The high level of SQSTM1 expression observed in the HIRBI group may be related to autophagy after reperfusion.LRPPRC, a member of the PPR family, plays an important role in RNA stability, regulation, processing, splicing, translation, and editing.In addition, it can regulate mitochondrial DNA-encoded mtRNAs and increase oxidative phosphorylation activity to promote fatty acid uptake and oxidation.The high level of LRPPRC expression observed in the HIRBI group may be related to mitochondrial damage after reperfusion.As previously mentioned,RASIP1 plays an important role in postnatal vascular formation.The low level of RASIP1 expression observed in the HIRBI group may be the result of partial restoration of blood flow to the ischemic area after reperfusion.In the Rice-Vannucci model, damage caused by the Rice-Vannucci model must be compensated by neovascularization, so RASIP1 expression was highest in the Rice-Vannucci model.ECI1, a key mitochondrial enzyme, participates in β-oxidation by catalyzing unsaturated fatty acids, as previously mentioned.The low level of ECI1 expression observed in the HIRBI group may be caused by partial mitochondrial functional recovery after reperfusion.As previously mentioned, SNX25 is involved in the regulation of macromolecular protein transmembrane transport.The low level of SNX25 expression observed in the HIRBI group may be caused by reperfusion.
By comparing GFAP and MBP expression levels by western blotting and immunofluorescence staining, we found that the brain damage sustained by the rats in the HIRBI group was equivalent to that seen in the Rice-Vannucci group.We also observed a decrease in MAP2 expression in the HIRBI group and verified this marked decrease by WB, which again confirmed that the brain injury caused by reperfusion was equivalent to that caused by hypoxicischemic injury.Given that several of the differential expression proteins identified in this study, such as ECI1, LRPPRC, MAPT, and MAP2, are related to mitochondria, we observed the mitochondria by TEM.The mitochondria in the HIRBI and Rice-Vannucci models were damaged, as indicated by mitochondrial shrinkage and mitochondrial membrane disruption, as well as reduced or absent mitochondrial cristae, which is consistent with ferroptosis.In addition, Fth1 and GPX4 expression levels were increased in the HIRBI group compared to the expression level in the Sham group.GPX4 prevents ferroptosis by inhibiting lipid peroxidation, and Fth1 prevents ferroptosis by inhibiting iron overload (Liu et al., 2020; Xu et al., 2021).It appears that HIRBI induces an increase in GPX4 and FTH1 expression to protect against ferroptosis (Peng et al., 2022).Taken together with our observation of increased GFAP expression and decreased MBP expression, we hypothesize that, although reperfusion causes damage to the brain, it also activated the antioxidant system through factors such as GPX4 and Fth1.Limitations of this study include the use of male rats only, without in-depth study of the effect of sex on the two models, as well as the evaluation of only five indicators to determine the extent of injury.We will assess the indicators of apoptosis,pyroptosis, and ferroptosis in future studies.In conclusion, our findings suggest that HIRBI activates the anti-ferroptosis system.
Author contributions:JHZ, XLG, and ZLL conceived and supervised the study.TLZ, XLG, and ZWZ designed experiments.TLZ and WL performed the experiments.MCF provided new tools and reagents.KXL and XRL analyzed the data.TLZ, XLG, and ZWZ wrote the manuscript.All authors read and approved the final manuscript.
Conflicts of interest:The authors declare that the research was conducted in the absence of any commercial or financial relationships that could be construed as a potential conflict of interest.
Data availability statement:All relevant data are within the paper.
Open access statement:This is an open access journal, and articles are distributed under the terms of the Creative Commons AttributionNonCommercial-ShareAlike 4.0 License, which allows others to remix, tweak, and build upon the work non-commercially, as long as appropriate credit is given and the new creations are licensed under the identical terms.
- 中国神经再生研究(英文版)的其它文章
- From static to dynamic: live observation of the support system after ischemic stroke by two photon-excited fluorescence laser-scanning microscopy
- MicroRNAs in mouse and rat models of experimental epilepsy and potential therapeutic targets
- The generation and properties of human cortical organoids as a disease model for malformations of cortical development
- Nanotechnology-based gene therapy as a credible tool in the treatment of Alzheimer’s disease
- Detection of Alzheimer’s disease onset using MRI and PET neuroimaging: longitudinal data analysis and machine learning
- A pancreatic player in dementia: pathological role for islet amyloid polypeptide accumulation in the brain

