Calibration of an elastoplastic model of sand liquefaction using the swarm intelligence with a multi-objective function
Qiutong Li, Zhehao Zhu
a Shanghai Research Institute of Materials, Shanghai, 200437, China
b Shanghai Engineering Research Center of Earthquake Energy Dissipation, Shanghai, 200437, China
c Laboratoire Navier/Cermes, École des Ponts ParisTech, Champs-sur-Marne, 77455, France
Keywords:Particle swarm optimization (PSO)Sand liquefaction Elastoplastic constitutive model Triaxial test
ABSTRACT According to post-seismic observations, spectacular examples of engineering failures can be ascribed to the occurrence of sand liquefaction, where a sandy soil stratum could undergo a transient loss of shear strength and even behave as a“liquid”.Therefore,correct simulation of liquefaction response has become a challenging issue in geotechnical engineering field.In advanced elastoplastic models of sand liquefaction, certain fitting parameters have a remarkable effect on the computed results.However, the identification of these parameters,based on the experimental data,is usually intractable and sometimes follows a subjective trial-and-error procedure.For this, this paper presented a novel calibration methodology based on an optimization algorithm (particle swarm optimization (PSO)) for an advanced elastoplastic constitutive model.A multi-objective function was designed to adjust the global quality for both monotonic and cyclic triaxial simulations.To overcome computational problem probably appearing in simulation of the cyclic triaxial test,two interrupt mechanisms were designed to prevent the particles from wasting time in searching the unreasonable space of candidate solutions.The Dafalias model has been used as an example to demonstrate the main programme.With the calibrated parameters for the HN31 sand, the computed results were highly consistent with the laboratory experiments (including monotonic triaxial tests under different confining pressures and cyclic triaxial tests in two loading modes).Finally, an extension example is given for Ottawa sand F65, suggesting that the proposed platform is versatile and can be easily customized to meet different practical needs.
1.Introduction
The mechanical characteristics of sand attract much interest from engineering and industrial communities since the responses to external loading are an important indicator to assess the integrated safety of various constructions.In particular, the shallow sandy soil can develop the flow-type behavior due to the rapid accumulation of excess pore water pressure under seismic loading.In the case of total liquefaction failure, the foundation soil can experience a complete loss of shear strength and even behave as a“liquid”.As a result, major engineering failures can take place.For instance,the 1964 Niigata earthquake with a magnitude of 7.5 is an example of soil liquefaction,during which approximately 310 local buildings constructed of reinforced concrete were damaged.Liquefaction-induced transient deformation was reported to be the most likely reason explaining the collapse of the Showa Bridge(Yoshida et al., 2007) that was constructed shortly before the Niigata earthquake.More recently, Christchurch in New Zealand has been severely hit by a series of seismic events in 2010 and 2011.A variety of damage was observed, including residential buildings associated with large permanent ground deformation (Bray et al.,2014), infrastructure failures (Cubrinovski et al., 2014), and other underground lifelines (Van Ballegooy et al., 2014).Over the last sixty years,various efforts have been devoted to this field(Ishihara and Yoshimine,1992;Ishihara,1995;Zhang and Wang,2012;Wang et al.,2015;Ni et al.,2022a,b).In the laboratory test,triaxial test is widely adopted as an effective approach for examining sand liquefaction.Although the understanding based on triaxial tests is only for elementary size far from representing a real semi-infinite half space, it can still provide a valuable insight into theconstitutive modelling, which is preferred for large-scale analysis and regarded as an effective tool since it is steadily flexible and lowcost to simulate various engineering conditions.For this, many constitutive models (e.g.Elgamal et al., 2002; Beaty and Byrne,2011; Wang et al., 2014; Boulanger and Ziotopoulou, 2015) have been developed to mimic the behaviors of sand liquefaction subjected to different types of loadings.Many cases have been presented in the literature,e.g.the dynamic response of a central clay core dam in Japan using the École Centrale Paris (ECP) model reported by Zhu et al.(2020).
The predictive abilities of constitutive models decisively depend on the precise calibration of model parameters.Usually,researchers develop their own methodologies to find the model parameters based on laboratory elementary experiments:involving(i)drained/undrained monotonic/cyclic triaxial tests and (ii) oedometer tests.However, some fitting parameters in the advanced constitutive models might not be, with ease,calibrated with real experimental measurements and often a trial-and-error procedure has to be followed where human visual inspection is commonly adopted.With the quick development of information technology in the 21st century, artificial intelligence (AI) has become very helpful in shaping the future of material science (Armaghani et al., 2019;Hosseini et al., 2020; Tang and Na, 2021).For instance, while assessing the security of geotechnical structures such as earth dam slopes,the traditional reliability analysis is usually challenging as it perhaps suffers from extensive computational requirements and poor efficiency.With the aid of AI, the failure probability can be efficiently evaluated using extreme gradient boosting XGBoost method (Wang et al., 2020a; Zhang et al., 2022) and multivariate adaptive regression splines MARS algorithm(Wang et al.,2020b)to consider the spatial variability of soil properties and the influence of transient seepage, respectively.To establish the relationship between undrained shear strength of soft sensitive clays and other basic soil parameters,Bayesian optimization was applied to define the model hyper-parameters of XGBoost and random forest (RF)methods.The 5-fold cross-validation reveals that these two optimized approaches outperform the other ML-based approaches in terms of prediction accuracy and robustness(Zhang et al.,2021).In the AI, heuristic algorithms are used in the process of model calibration with the purpose of avoiding manual subjective errors.The principle of the method is to interact with a given measure of error so as to search for the associated parameters.The key feature as a metaheuristic is that it can search a very large space of candidate solutions without making additional assumptions about the problem itself being optimized.As a result, the partial gradient with respect to each fitting parameter is not required when the combined influence of fitting parameters needs to be fully considered.This is quite different from the classic optimization methods such as the gradient descent and quasi-newton methods.In the pioneering work of Pal et al.(1996), the genetic algorithm (GA) is selected to fit the hierarchical single surface model.The main advantage of the GA is the ability to take care of the overall quality of the simulated results instead of sequentially finding one or more parameters in the first place to later search for the others.To calibrate a sand hypoplasticity model involving eight model parameters, the GA has been employed to fit these parameters from the experimental results of an oedometer and a triaxial drained compression test (Mendez et al., 2021).With these parameters identified by the GA, the numerical model could perfectly match the experimental measurements.In a comparative study, several optimization techniques (GA, particle swarm optimization (PSO),simulated annealing,differential evolution algorithm,artificial bee colony,etc.)in identifying soil parameters have been examined(Yin et al.,2018)with two synthetic cases using the Mohr-Coulomb(MC)model: (i) a pressure meter test and (ii) an excavation test.It has been proved that all the chosen techniques could derive almost the same input parameters with relatively small values of objective function.
From an engineering viewpoint, the cyclic triaxial test plays a more important role in liquefaction analysis since it is capable of reproducing a sequence of cyclic deviatoric stresses on the test specimen,very similar to the alternative loading for sand elements in the level ground.In mathematics,the precise description of such a complex phenomenon needs more advanced ingredients,e.g.the concept of bounding surface to take into account the effect of cyclic loading and loading.However,the aforementioned references with different optimization techniques are limited to (i) laboratory elementary tests only containing monotonic loading (i.e.oedometer or triaxial compression test) without the occurrence of loading reversal (Pal et al., 1996; Yeh et al., 2020; Mendez et al.,2021), or (ii) the case studies only containing relatively simple constitutive models (i.e.the MC model in Yin et al., 2018).As a result, for complicated sand liquefaction models considering both monotonic and cyclic loadings,these successful applications might not be immediately suitable due to the lack of the following considerations: (i) it is readily complicated to evaluate the relative error between measurement and simulated results since a strain value in a cyclic triaxial test could map various stress values; and(ii) with the incorrect model parameters, especially during the initial few iterations,the simulation of a cyclic triaxial test is much more prone to divergence,making the calculation extremely timeconsuming and even sometimes impossible.In order to overcome these problems, this paper presents a novel calibration methodology based on the PSO algorithm.Compared with the common GA method, the PSO method is relatively simple since no extra code mimicking the evolution of natural selection is needed, and the method could directly hunt for the optimized values in the proposed search space.In the geotechnical literature, the PSO algorithm has been proved to be a versatile tool for different engineering problems.In the context of seismic slope stability,the PSO algorithm was combined with an artificial neural network to get a high prediction performance(Gordan et al.,2016).To consider the combined impact of monotonic and cyclic triaxial simulations,a special multi-objective measure of error interacting with the PSO method was designed by giving each the same importance.The clear benefit of such a definition is to guarantee a better global quality.Besides, two additional interrupt mechanisms were fully designed for the cyclic triaxial simulation so that the PSO method can be prevented from wasting time in searching the unreasonable space of candidate solutions.
In this paper,the Dafalias model(Dafalias and Manzari,2004)is first introduced by the key ingredients for sand liquefaction.Then,the calibration methodology based on the PSO method is detailed by highlighting the proposed multi-objective function and two interrupt mechanisms.With the model parameters calibrated for Hostun 31 sand(termed HN31 sand hereafter),the effectiveness of the PSO method is evidenced and further discussed with a series of verification data.Finally,an extension example for Ottawa sand F65 is demonstrated to explore the versatility of the proposed programme and an in-depth analysis of optimization ability is given with the elastoplastic theory.
2.The Dafalias model
In literature, numerous constitutive models based on distinct plastic theories have been proposed for sand liquefaction.For instance, the Pressure Depend Multi Yield (PDMY02) model(Elgamal et al.,2002),the UBCSAND model(Beaty and Byrne,2011),the Dafalias-Manzari model (Dafalias and Manzari, 2004) and the PM4Sand model (Boulanger and Ziotopoulou, 2015).Dafalias firstintroduced the well-known bounding surface plasticity model as an efficient tool for capturing the rate-independent mechanical behavior of granular sand.This feature was later adequately verified and widely adopted in other constitutive models, e.g.Tsinghua model by Wang et al.(2014).Another feature of the Dafalias model is the consideration of the critical state to unify the description of the same sand at various densities with the same set of model parameters.This flexibility could be viewed as beneficial especially for large-scale engineering simulations since the precise control of the density index (ID) could only hardly be achieved during the preparation stage.Besides, the Dafalias model has been maturely implanted on the OpenSees platform, and the user could easily invoke the model for finite element analysis.Therefore,this model is here taken as an example to illustrate the manner how the PSO method deals with the calibration process.
In the following section,a brief description of the Dafalias model is given in triaxial condition,with mean effective stress p'= (σ'1+2σ'3)/3, deviatoric stress q = σ'1+2σ'3and stress ratio η = q/p',where σ'1and σ'3represent the major and minor principal stresses,respectively.In terms of elastic strain component (denoted by superscript“e”)and irreversible plastic strain component(denoted by superscript “p”), the incremental stress-strain relationships(subscript“q”and“v”represent shear strain and volumetric strain,respectively)are determined through the following equations:
where G and K are the elastic shear and bulk moduli,respectively;H stands for the plastic hardening modulus and d denotes the dilatancy of sand.According to Richart et al.(1970)and Li et al.(1999),G and K can be determined by
where G0is a model constant, e is the current void ratio, υ is the Poisson’s ratio and patis the atmospheric pressure of 100 kPa.
Generally speaking, the sand deformation leading to ultimate rupture is caused by grain sliding and grain crushing.However,the grain crushing only occurs when an extremely high confining pressure is employed so as to represent a very deep soil element.Under this assumption, the yield surface in the Dafalias model follows the equation below to appear as an open wedge by supposing that grain crushing is only of secondary importance:
where f represents a stress ratio defined yield surface,α and m are the two stress-ratio quantities.In order to meet the stress-ratio dependency, a simple linear relationship can be considered to quantify the plastic hardening modulus (H) for simplicity:
where h is a function of the state variables with an internal variable b0, Mbis the image stress ratio on the bounding surface, ηinis the value of stress ratio η at initiation of a loading process,h0and chare two model plastic parameters,respectively.
The critical state in the Dafalias model is computed through the state parameter ψ proposed by Been and Jefferies(1985)to consider the dependency of sand behavior on the current state:
where ecis the critical void ratio.The power equation proposed by Li and Wang(1998)is employed to depict the relationship between the critical void ratio ecand mean effective stress p'p':
where e0is the void ratio at p'= 0, λcand ξ are two model constants.Then, the bounding and dilatancy stress ratios could be related to the critical state in order to unify the model input parameters by
where Mdis the image stress ratio on the dilatancy surface,nband ndare two model positive constants (bounding/dilatancy parameters).Finally,the sand dilatancy is written to respect the essence of Rowe’s dilatancy law as follows:
where Adis a function of the state containing a model parameter A0(Dafalias and Manzari, 2004).
The HN31 sand is characterized by uniform sub-angular grains(mean size D50=0.35 mm and uniformity coefficient cu=1.57,Zhu et al.(2021a))and widely used in many laboratories in Europe.The maximum and minimum void ratios, i.e.emaxand emin, were reported to be 1 and 0.656, respectively, and the specific gravity Gsequals 2.65 (Zhu et al., 2021a).The Dafalias model involves 15 model parameters in total.For the HN31 sand, the shear modulus constant G0can be supposed to be 176(Zhu and Cheng,2020),and the Poisson’s ratio υ=0.05 is widely adopted by many researchers for different sands (e.g.Toyoura, Monterey and Ottawa sands in Dafalias and Manzari (2004) and Ramirez et al.(2018), respectively).The model parameters concerning the critical state can be calibrated with the monotonic triaxial results presented by Benahmed(2001)by performing the optimum fitting procedure(as shown in Fig.1): λc= 0.065, e0= 1 and ξ = 0.4.In terms of the effective stress path on the q-p'plane, the critical stress ratio Mccan be found to be 1.37 (Benahmed, 2001).
Papadimitriou et al.(2001) suggested that the value of yield surface constant m of the Dafalias model could be considered to be of the order of Mc/100,i.e.m=0.014 in the present work.The ratio of critical state stress ratio c between compression and extensionhas been experimentally found to be 0.712(Benahmed,2001).The bounding/dilatancy parameters nb/ndwere computed following the empirical equations proposed by Li and Dafalias (2000), which were estimated to be 0.6 and 2.5, respectively.It should be mentioned that different experimental data might probably give different values for nband nd;thus,a large number of the real tests were averaged to obtain the authentic values.

Fig.1.Calibration of the critical state line (from Benahmed, 2001).
All the above model constants (see Table 1) can be determined using well-documented experimental data.However,the other five parameters are suggested using a trial-and-error procedure(Dafalias and Manzari, 2004), whilst these parameters certainly play a vital role in controlling the computed liquefaction response,especially the two plastic moduli (h0and ch) and the dilatancy parameter(A0)directly linking to the contraction tendency and the generation of the excess pore water pressure.As a consequence,determination of the above five fitting parameters was subjected to the PSO procedure with no need for manual adjustments (see Section 3).
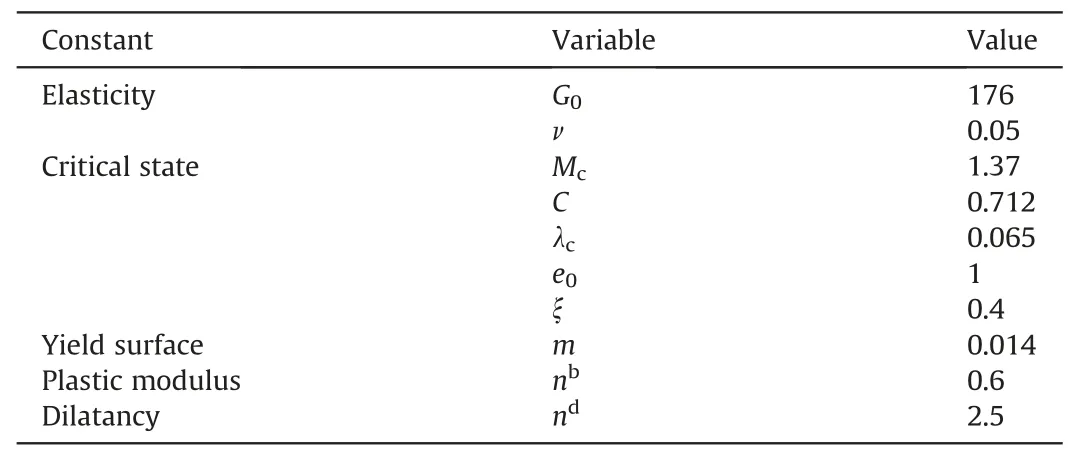
Table 1Model constants for the HN31 sand.
3.Calibration methodology based on the PSO method
Originated from Kennedy and Eberhart (1995), PSO in computational science intended to stylize the social behavior of birds in the foraging process by having a population of candidate solutions,here dubbed particles.Each particle is treated as a single point in the user-defined space.With regard to a given measure of error,each individual could adjust its flying tendency as a function of its own flying experience and its companions’flying experience.In theiterative number of k+1,the velocity vidk+1and position xidk+1vectors of the particle i are updated:
where ω denotes a positive inertia weight;thus,the first part in Eq.(14) represents the ability of each particle to maintain its previous velocity(i.e.the“inertia effect”in the physical world).The cpin the second part is termed as a cognitive parameter and r1is a random number ∈[0,1]to involve randomness in the calculation.The Pbestrepresents the optimal position searched by an individual particle till the iteration number equals to k so that the second part in Eq.(14)can automatically consider the impact of local optimal solution while updating the velocity vector.Similarly,the cgin the third part is termed as a social parameter and Gbestdenotes the optimal position searched by the particle swarm so that the impact of global optimal solution is fully considered with a second random number r2∈[0,1] while updating the velocity vector.
For a given problem, the choice of PSO parameters can have a significant effect on the subsequent performance; thus, the selection of these parameters has become the primary objective of much research (e.g.Shi and Eberhart, 1998; Eberhart and Shi, 2000;Trelea, 2003; Bratton and Blackwell, 2008).Generally, an inertia weight ω=0.8 is convictive when lacking the knowledge regarding the treated problem (Shi and Eberhart,1998).In order to balance the local and global solutions,cpand cgwere set to be the same in the present work, both equal to 0.5.
The key issue for the PSO method is the proper definition of the objective function accounting for the error between the numerical and experimental results, and the straightforward goal of the PSO method is to minimize the objective function value to bring the computed results as close to the real data as possible.In this study,two standard experimental results of HN31 sand were employed to calibrate these five fitting parameters:
(i) A drained monotonic triaxial test under confining pressure σ'c=200 kPa with the purpose of well capturing the internal friction angle of granular materials, and
(ii) An undrained cyclic triaxial test (cyclic stress ratio Tcc= τ/σ'c=0.22,loading frequency fre=0.1 Hz and σ'c=200 kPa)to consider the cyclic behavior of granular materials.
The employed cyclic triaxial result was seriously doublechecked by a repeatability test (Zhu et al., 2021b).For further assessment, another two monotonic triaxial tests (under 100 kPa and 400 kPa)and another one cyclic triaxial test(strain-controlled with εa=±0.4%)were used to blindly examine the effectiveness of the proposed PSO method.All experimental data adopted for HN31 sand are summarized in Table 2.As is known, the evolution of volumetric strain during shearing in the case of drainage is also an important characteristic associated with the inherent dilatancy of granular materials.Nevertheless, when using the finite element method, the predictive value is most likely an underestimation(Howell et al., 2015).For instance, in a numerical simulation of centrifuge testing reported by Ramirez et al.(2018), two constitutive models on two platforms(i.e.SANIDAND/PDMY02 in OpenSees and SANISAND in FLAC, respectively) were cautiously calibrated using the experimental data directly recorded during the centrifuge test.With respect to volumetric settlement at various depths, all three models performed poorly because the predictive values were much smaller as observed experimentally.This defect became increasingly remarkable while approaching the top free surface(depth D = 0).This problem has been attributed to different possible arguments by different researchers:

Table 2Experimental data for PSO calibration and for further verification.
(i) Shahir et al.(2012) suggested that the use of initial permeability was the prime suspect to explain such an underestimation since the significant change in soil properties over time (i.e.porosity and permeability) was unfortunately ignored;
(ii) Zhang and Wang(2012)argued that the current formulation for the solid-fluid coupled element in the finite element analysis was the most likely reason that the dynamic velocity effect of pore water was totally neglected; and
(iii) Boulanger and Ziotopoulou (2013) thought that the current constitutive formulas were incapable of appropriately reflecting the large post-liquefaction deformation.The effectiveness of the finite element method itself towards liquefaction analysis is out of the scope of the present work.Therefore, the volumetric deformation during shearing was not considered in the identification process of the five fitting parameters.
Based on the above discussion, the multi-objective function(obj)in this article is defined as the sum of errors with respect to the above two experiments (Table 2):
where Part1 is the normalized residual sum of square(RSSmono) of stress-strain curve with respect to the drained monotonic triaxial test,multiplied by a weight factor (Wmono).The RSSmonois defined as the sum of differences in terms of the deviatoric stress(q) for a given set of axial strains between the computed results and the real data.In statistics,a small value of RSSmonoindicates a tight fit of the computed results to the real data.Similarly,Part2 is defined as the relative error REcycwith respect to the number of cycles Ncycto sand liquefaction (subscript “com” and “data” represent computed and experimental result, respectively) multiplied by a weight factor(Wcyc).Under undrained triaxial condition, the excess pore water pressure(Δu)ratio(ru=Δu/σ'c)is considered to be a fairly suitable indicator to estimate the cyclic behavior of sand liquefaction.A typical triaxial test associated with sand liquefaction response using the HN31 sand (Zhu et al., 2021b) is displayed in Fig.2.Two phenomena could be observed after attaining ruof 0.8 during the number of cycles Ncycbetween 13.5 and 14.5:(i)the transient axial deformation began to occur in Fig.2a and(ii)a“reversed-z”stressstrain curve became increasingly obvious in Fig.2b.Both the facts referred to the outset of sand liquefaction (Xie, 2011); hence, the value of 0.8 was thought to judge the trigger point in the present work.Besides, this parameter is naturally dimensionless.It is of critical importance that the conventional residual sum of square in Part1 is intentionally normalized by the confining pressure σ'cand the number of points(N) so that it would be unit-independent for the suitable scaling with the addition of Part2 in the equation.
From an engineering viewpoint, the monotonic and cyclic triaxial tests are of the same importance for characterizing granular materials.The internal friction angle derived from the monotonic test stands for the soil fabric arrangement at the microscale.The number of cycles attaining liquefaction in the cyclic test is equally a pivotal ingredient in constructing the macroscopic cyclic shear resistance curve.However,Part1 and Part2 are naturally of different orders of magnitude.The weighted sum method was then used to eliminate the scaling difference with Wmono=10 and Wcyc=1(Yeh et al., 2020).With this design, two types of tests could contribute equally to the multi-objective function for a better global quality.
In order to efficiently reproduce the computed results of the Dafalias model,two independent solvers were respectively built in the Python to simulate the mechanical responses of a unit element subjected to the monotonic and cyclic loading, using the Numpy(http://numpy.org) and the OpenSeesPy library (https://openseespydoc.readthedocs.io/en/latest/).Two scripts were also built to first import the experimental data(in text format)and then evaluate the errors between the computed results and the real data according to Eq.(16).After choosing the fitting parameters,the PSO programme was initiated by randomly placing a population of particles in the provided search space.During each iteration loop,two Python solvers produced the computed results of the Dafalias model and subsequently communicated with two scripts in order to calculate the final value of objective function one particle after another (see Fig.3a).As mentioned above,the simulation of cyclic triaxial test is more prone to the divergence problem, especially during the initial iterations,making the calculation time extremely long and even sometimes impossible.Thus, two interrupt algorithms were fully designed for each calculation step.Firstly, once the nodal response of accumulated excess pore water pressure reaches the value of ru=0.8,the current simulation is automatically stopped in order to escape the time-consuming post-liquefaction phase since the obtained numerical result is already sufficient to deduce the value of Part2.Secondly, for each calculation step, the time step (t) was programmed to be adaptive and possibly reducible by half in the case of divergence.A huge value of 9999 (see Fig.3a) will be directly assigned to the Part2 of the objective function if the current step diverges after three reductions in a row.During iteration, as long as the particles search the unreasonable space of candidate solution leading to the convergence problem(see Fig.3b),they certainly have no chance of becoming the optimal position of the swarm (Gbestin Eq.(14)) with the intentional punishment value of 9999.The goal of this mechanism is to speed up the calibration programme by punishing the particles within the unreasonable search space and to force them to quickly leave thewrong area.The above functions were written in a small Python script,which is accessible in Appendix with detailed comments.For the same reason,if there is no liquefaction initiation characterized by the computed ruall time lower than 0.8 throughout the numerical simulation, the value of Part2 will directly be supposed to be 99 (see Fig.3c).Finally, the velocity and position vectors of particles can be updated for the next iteration, according to Eqs.(14) and (15).
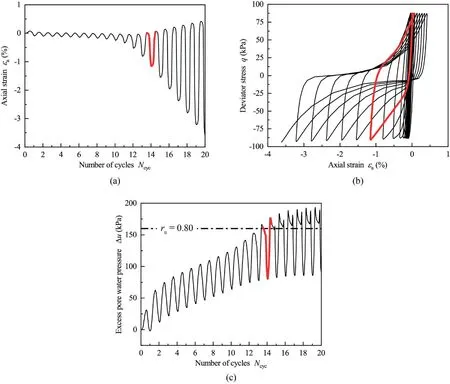
Fig.2.Typical triaxial test involving sand liquefaction in terms of(a)Axial strain-number of cycle curve;(b)Stress-strain curve;and(c)Excess pore water pressure-number of cycles curve (red cycle: Ncyc between 13.5 and 14.5 while attaining ru = 0.8; after Zhu et al., 2021a).
Although the calibration procedure can be totally entrusted to the PSO procedure, the search space is still artificial and thus is subjective.The proper definition of such a space is very important and, sometimes, requires some experience.Generally speaking,enlarging the space might multiply the iteration number and decrease the convergence rate in most cases.In contrast,decreasing such a space certainly reduces the opportunity that the optimum set of parameters could be included(Mendez et al.,2021).Thus,the volume of the search space needs to be seriously examined after the calibration procedure: (i) when it is too small, all particles are highly tended to cluster on the boundary of the employed search space; and (ii) when it is too large, a huge difference in computed results might be found.Thus, different particles might probably cluster on various points in the provided search space.In either case, the PSO programme needs to be repeated with an improved search space modified from the previous one until all particles can finally cluster on a single point without touching the boundary.
4.Calibration methodology based on the PSO method
4.1.Assessment of optimization ability using HN31 sand
As the target HN31 sand(D50= 0.35 mm and Cu=1.57)is very similar to the Monterey 0/30 sand (D50= 0.4 mm and Cu= 1.3)(Dashti et al.,2010)in terms of grain size,the search space for HN31 sand is then roughly imagined based on the model parameters calibrated for the Monterey 0/30 sand (Ramirez et al., 2018).Unfortunately, during the first trial, two fabric-dilatancy parameters(zmaxand cz) steadily touched the upper boundaries.Thereby, the extents for these two parameters were sharply amplified and the PSO method was launched one more time with the improved search space tabulated in Table 3.It can be seen that all five fitting parameters fell well within the proposed range, indicating that such a space was correctly imagined for the HN31 sand.Fig.4 depicts the initial positions of all particles with a population of 10 and maximum iteration number of 200.Before the first iteration in Figs.4a and 10 particles were randomly placed in the proposed search space.Near the final stage of iteration number equal to 195,they were highly tended to cluster at a single point.The coordinates of this point could be believed to be the optimized model parameters.In addition, the best value of objective function till the current step was normalized by its peak value in Fig.4 to distinctively display its intrinsic evolution.During the progression of iteration,the initial high value steadily decreased to be much smaller.After the iteration number of about 50, no clear benefit could be furthermore gained, indicating that the employed maximum iteration number of 200 was sufficient for the calibration purpose.

Table 3Search space and the calibrated values for HN31 sand.
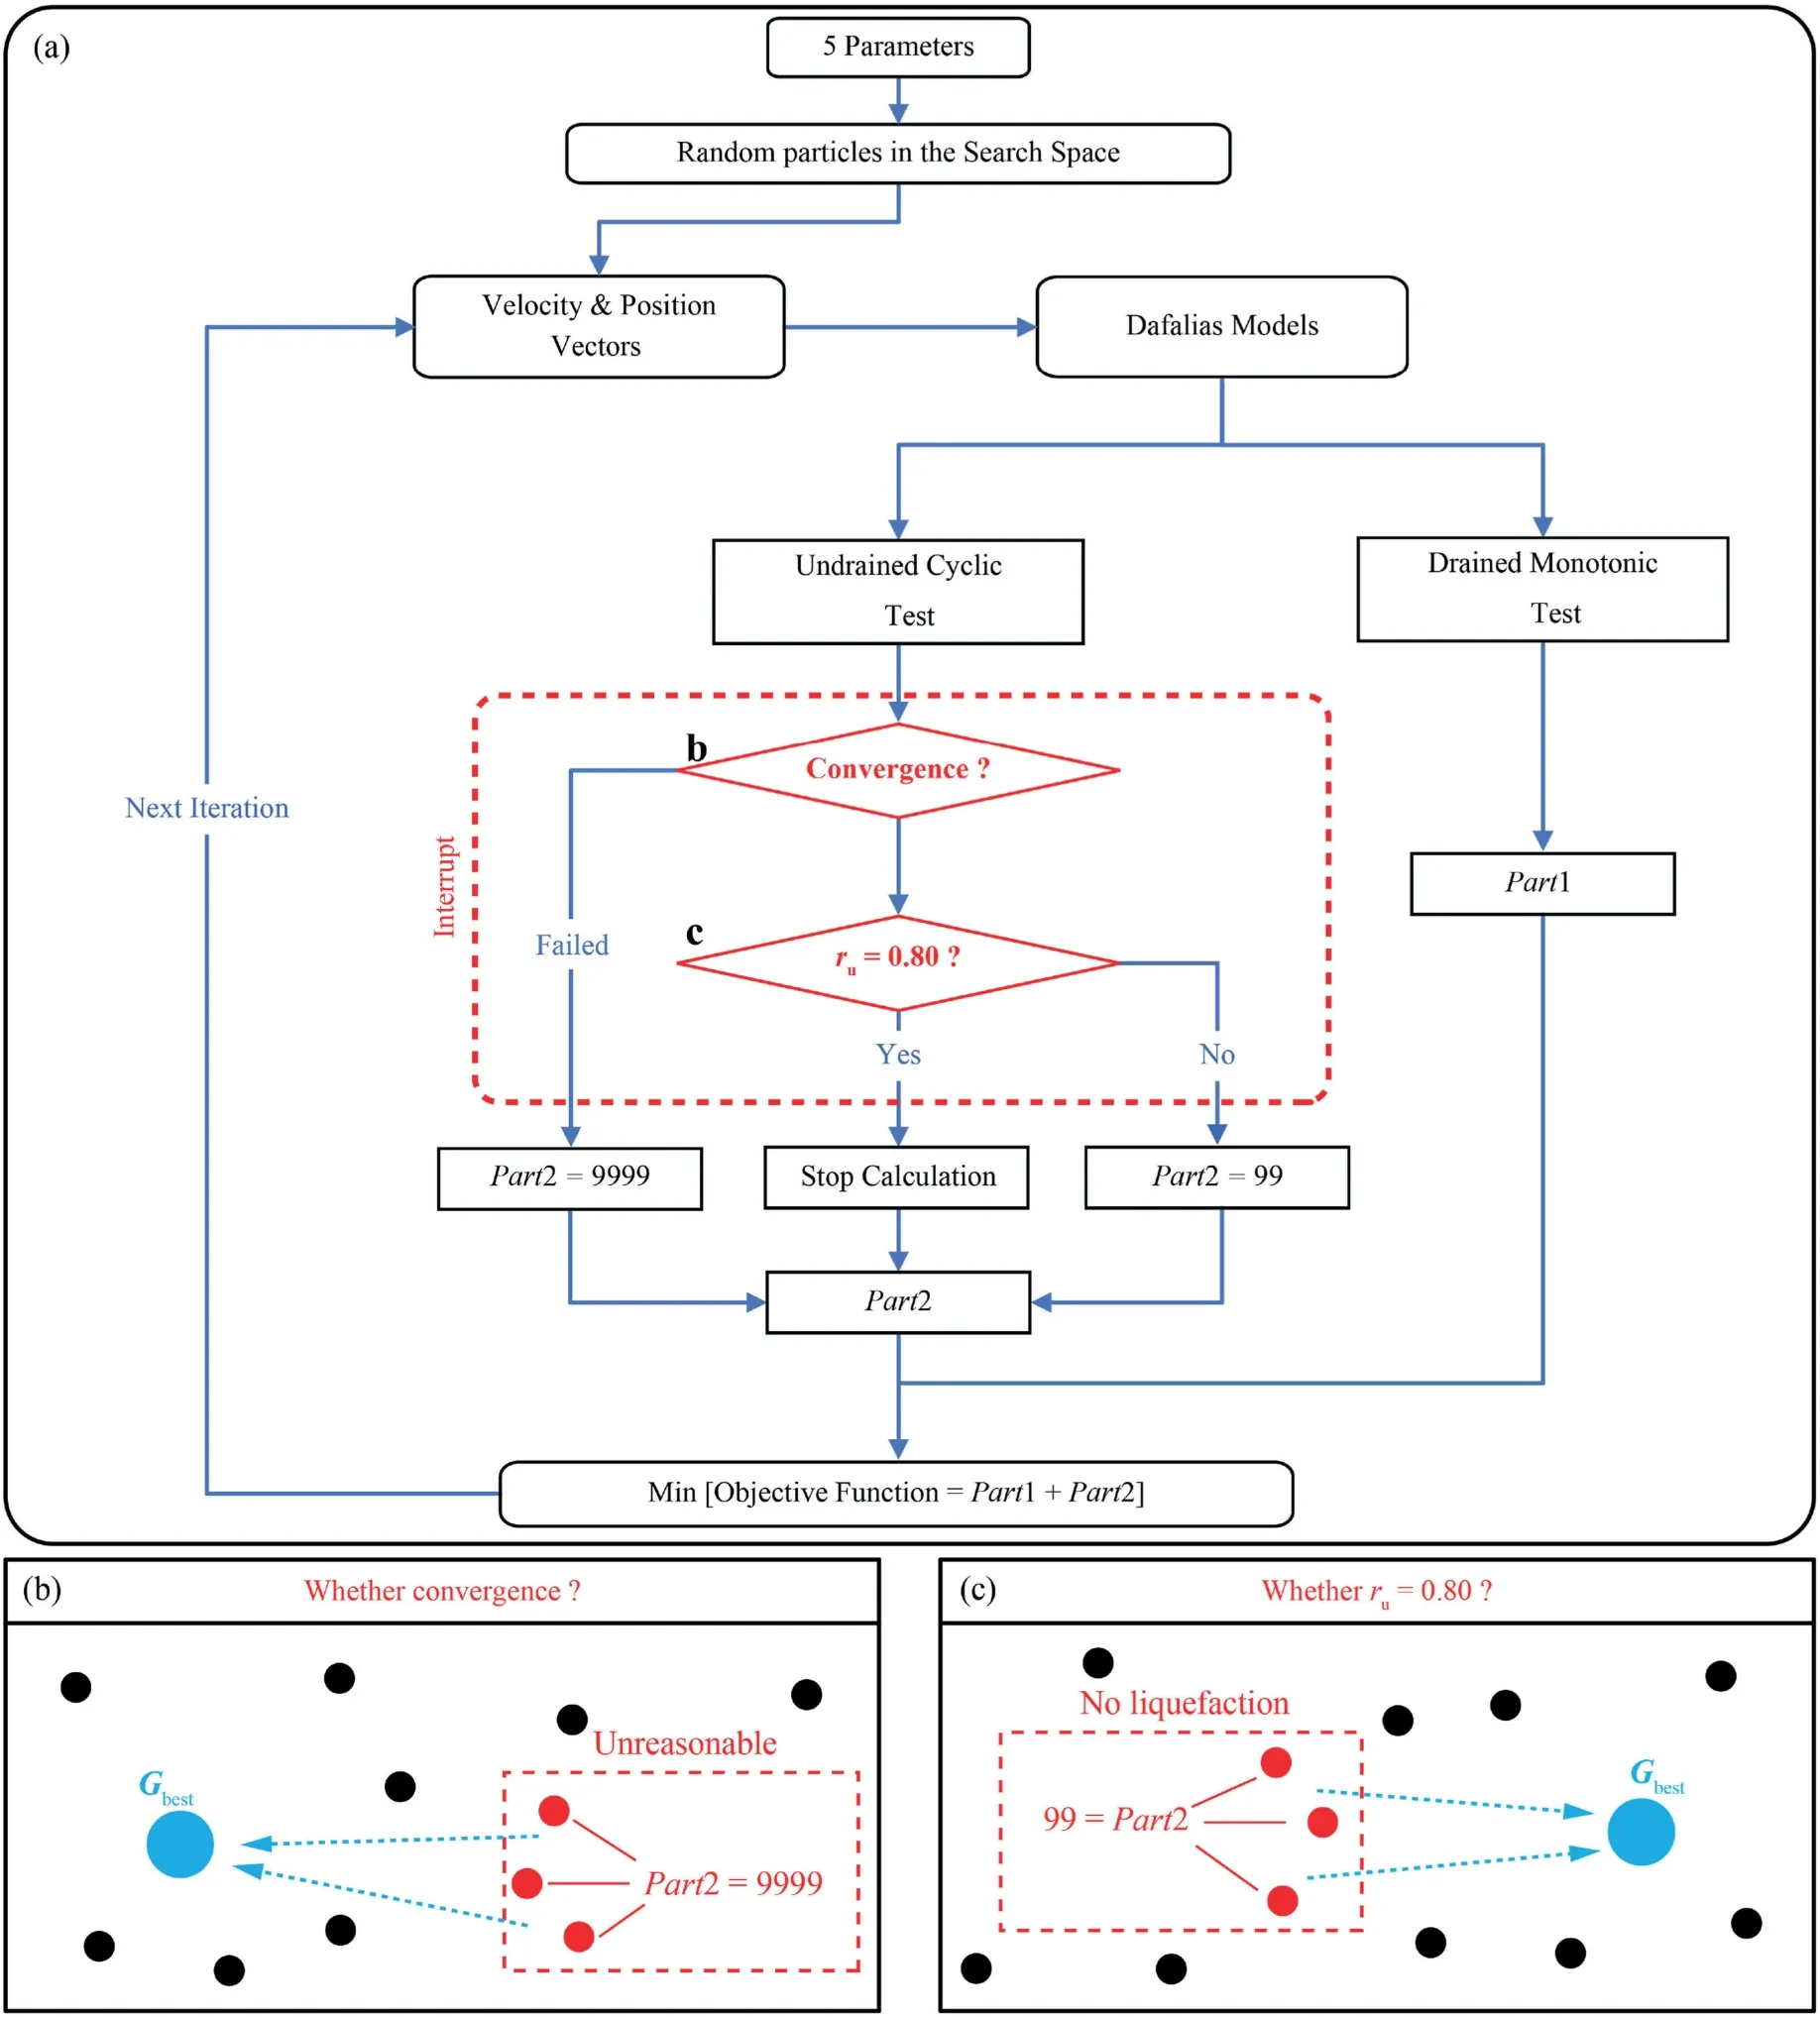
Fig.3.(a) Flow chart for computing the value of the objective function; (b) Interrupt mechanism for convergence; and (c) Interrupt mechanism for liquefaction judgment.
By combining all the above phenomena,the obtained parameter values after the PSO procedure should be deemed to be meaningful to reproduce the mechanical behaviors upon shearing of the HN31 sand using the Dafalias model.Fig.5 presents the relationship between the computation time against the iteration number,in which an exponential pattern can be observed.This phenomenon could be taken as reasonable since the initial few computations for cyclic triaxial test were frequently interrupted with the two designed interrupt mechanisms.On the contrary,while particles were flying towards the more correct search space, these mechanisms would be much less triggered, making the computation time last much longer.
Fig.6 presents the comparison between the computed and experimental results for the HN31 sand in a monotonic loadingcondition.The stress-strain curves described in Fig.6a demonstrate that not only the reference test under 200 kPa but also another two verification tests under 100 kPa and 400 kPa could be successfully reproduced with the calibrated model parameters using the PSO method.Besides, the effective stress paths drawn in Fig.6b were capable of deriving the correct angles of internal friction at different shearing stages(i.e.maximum state φ'maxand critical state φ'cri),as compared with the real experiments.Fig.7 presents the comparison between the computed and experimental results for the HN31 sand in a cyclic loading condition.The excess pore water pressure(Δu) against the number of cycles (Ncyc) curves drawn in Fig.7a proves that the computed result conforms well to the given criterion of ru= 0.8 since only a minor variation in Ncyccould be observed for the achievement of this criterion.After the outset of sand liquefaction, a clear decrease in Δu could be found for the computed result, different from the experimental reference.This shortcoming could be taken as logical since the test specimen passed from the solid phase to the liquid phase at this experimental stage; and this effect is not numerically considered in the Dafalias model.The effective stress paths drawn in Fig.7b show that the two curves were almost identical.Provided that the objective function(Part2) accounting for the relative error in between for such a test was on the comparison basis of Ncyc,the PSO method indeed made a comprise by destroying, to some extent, the initial contraction tendency(as outlined in Fig.7b),allowing a pertinent value of this indicator to be successfully reproduced for the computed result.
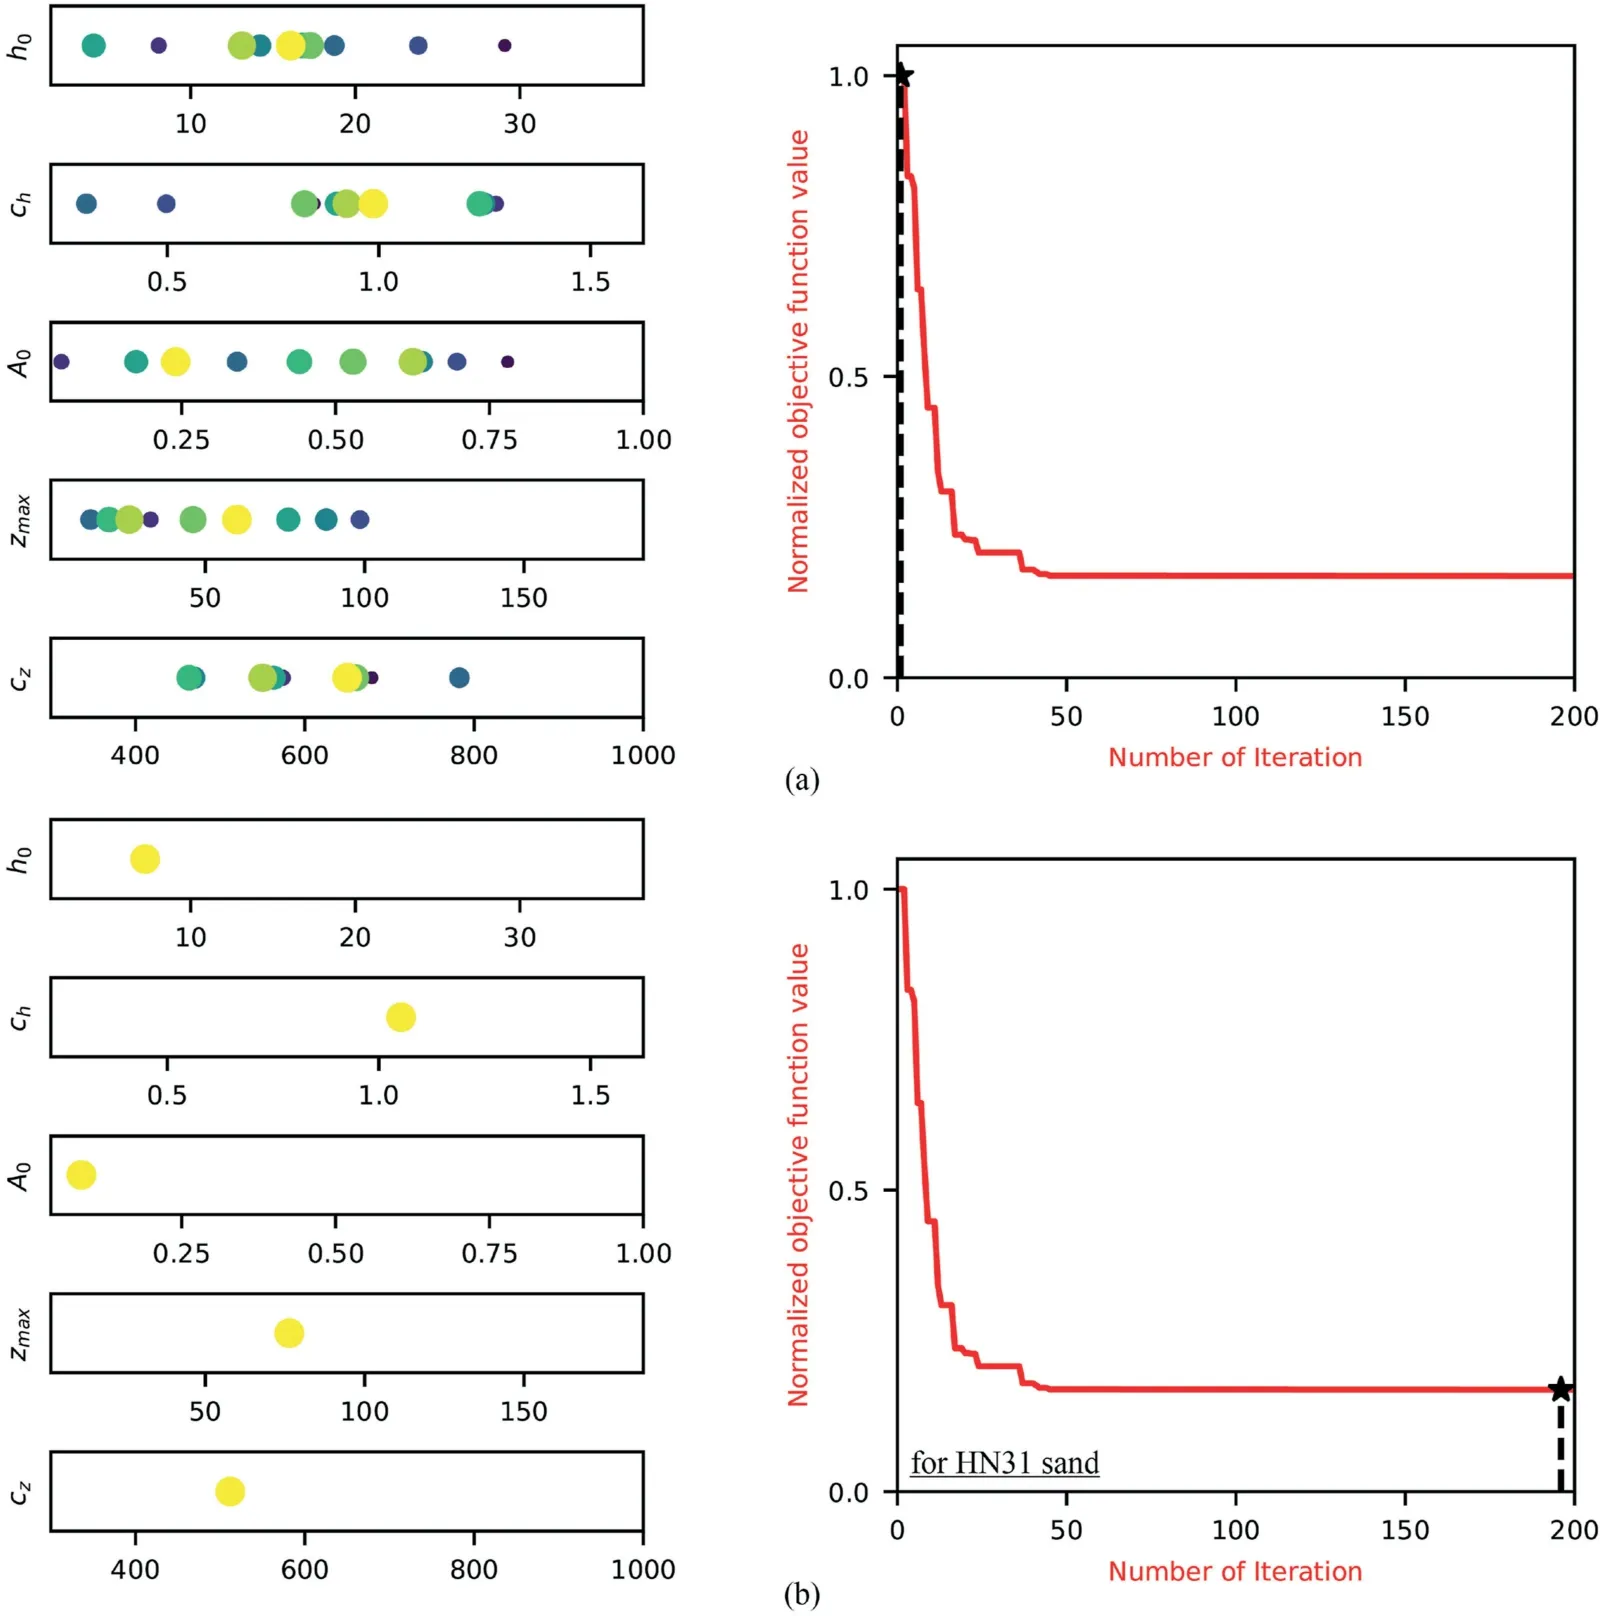
Fig.4.Particle iterative positions and the normalized objective function (a) At the first iteration and (b) Near the last iteration.
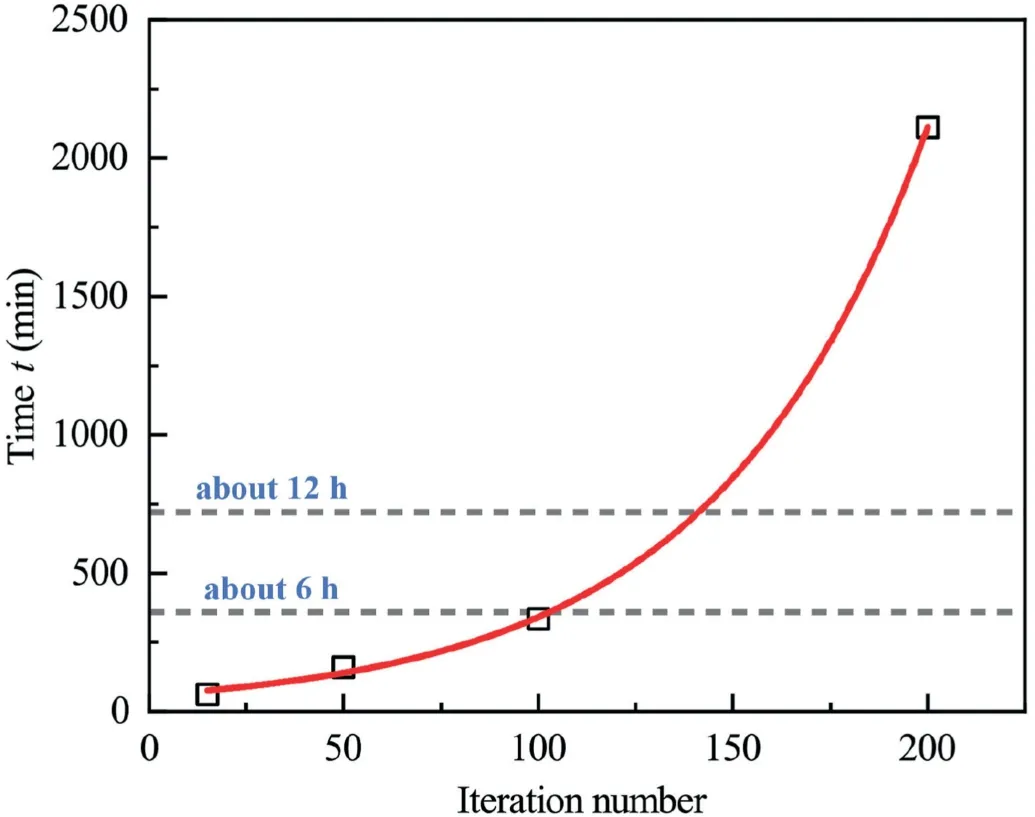
Fig.5.Relationship between the computation time and the iteration number.

Fig.6.Comparison between the computed (in red) and experimental results (scatter points from Benahmed (2001)) in monotonic triaxial test: (a) Stress-strain curves and (b)Effective stress paths.
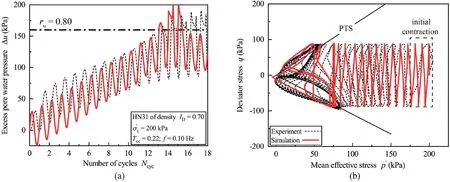
Fig.7.Comparison between the computed(in red)and experimental results(in black from Zhu et al.,2021a)in cyclic triaxial test:(a)Excess pore water pressure-number of cycle curves and (b) Effective stress paths (PTS: phase transformation state).
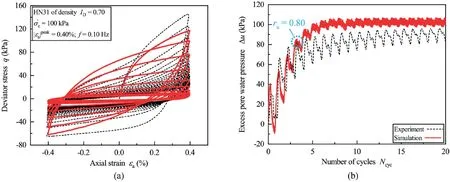
Fig.8.Comparison between the computed(in red)and experimental results(in black from Zhu et al.,2021b)in cyclic triaxial test(displacement-controlled mode):(a)Stress-strain curves and (b) Excess pore pressure-number of cycle curves.
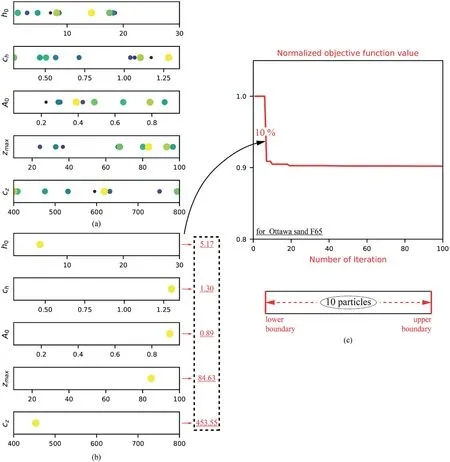
Fig.9.Particle iterative positions at: (a) First iteration; (b) Last iteration and (c) The normalized objective function.
In order to further explore the performance of the proposed calibration procedure, another undrained cyclic test with a different loading mode (displacement-controlled mode with peak axial strain value εaequal to±0.4%in Zhu et al.(2021b))was used to blindly examine the calibrated model parameters.Fig.8a presents the comparison with respect to the stress-strain curves between the computed and experimental results.The computed curve was globally in good agreement with the experiment despite some small errors could be found in the compression half cycles.Specially, the computed stress-strain curve developed in a correct asymmetric manner, conforming to the mechanical characteristics of granular material; i.e.the resistance to compressive shearing should be much more prevailing than that to extensional shearing.This mechanical characteristic could be well reproduced since the evolution of fabric change is fully considered for granular material in the employed Dafalias model.In terms of the evolution of Δu during shearing, the predictive Ncycattaining the liquefaction triggering point of ru= 0.8 was almost the same as the experimental observation, as shown in Fig.8b.For a given measure of error, this issue appears to be important since the proposed calibration method continued to work satisfactorily without violating its previous premise despite under an otherwise loading condition.
4.2.Assessment of versatility of the proposed programme using Ottawa sand F65
One of the main features of the proposed optimization platform is the adoption of modular programming thought that motivates the users to construct their own programme regarding the encountered problems, only by changing (i) the objective function and (ii) the relevant experimental data.The use of the platform is versatile and should not only be limited to the case discussed above:optimization based on a monotonic test and a cyclic test.To explore more,an extension example is given and the effectiveness of the PSO method will be assessed with the elastoplastic theory.
As mentioned previously, the Dafalias SANISAND model was intensively applied to a study of site response in a layered liquefiable deposit (Ramirez et al., 2018).With due care and diligence, a series of model parameters was calibrated.Based on these parameters,the idea now appears to be attractive,if the proposed PSO programme can be launched to explore whether these parameters could still be improved.In order to make the difference, the optimization,this time,relied on three monotonic tests under different confining pressures (Ottwa sand F65 of ID= 0.4 or e = 0.7 under confining pressures of 100 kPa,200 kPa and 300 kPa,respectively).The first part of objective function was then defined as the sum of three normalized RSS of stress-strain curve whilst the second part was removed.The same five fitting parameters entered in the PSO iteration and the other 10 experiment-determinable parameters maintained constant.It is worth noticing that the normalization of RSS remained necessary to ensure the equilibrium of the objective function since the shear strength of sand increases sharply with the confining pressure.The initial positions of all particles with a population of 10 and the applied search space are displayed in Fig.9.It can be seen that the particles finally stay at a single point away from the boundaries that specifies a proper consideration of such a space for this sand.The experimental and computed stressstrain curves are presented in Fig.10 with a local enlarged version below where two different phenomena can be recorded.Firstly,both the computed curves were in good agreement with the experimental results while approaching or attaining the critical state (εa> 17%).Secondly, as compared with the curves presented by Ramirez et al.(2018) in the initial phase of loading as zoomed below (0% <εa<8%), the fitting parameters further optimized by the PSO method, in general, yielded more crooked curves whose responses matched better the nonlinear characteristic of sandy specimen.The evolution of normalized objective function is displayed in Fig.9b and it is gratifying that the model parameters initially arrived by Ramirez et al.(2018) were already persuasive and of quality.However, a limited improvement (approximately 10%) could still be gained.In statistics, the coefficient of determination, denoted r2, is a common measure to quantify how well observed outcomes are replicated by the model.
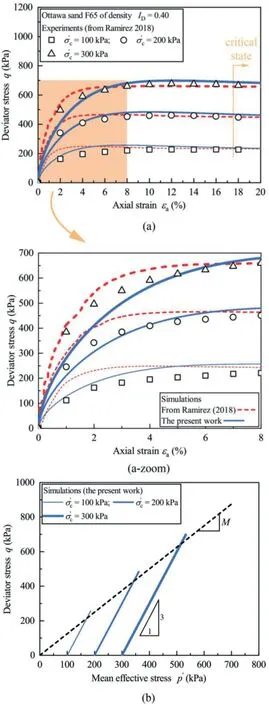
Fig.10.Comparison between the computed and experimental results in monotonic triaxial test: (a) Stress-strain curves and (b) Mean effective stress paths.
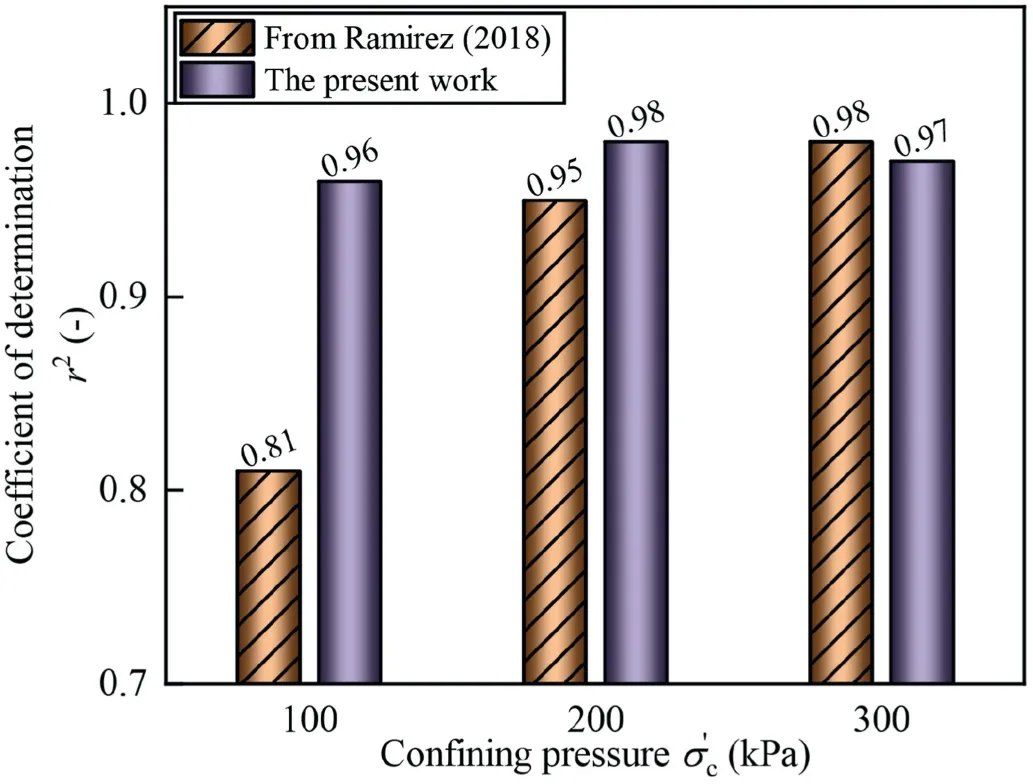
Fig.11.Comparison of two series of model parameters in terms of coefficient of determination r2.
Therefore, this indicator was taken to inspect the fitting parameters further subjected to the PSO method.For two lower confining pressures of 100 and 200 kPa,the r2presented in Fig.11 reconfirms that the PSO method made a supplementary contribution to the computed results, especially for 100 kPa.However, for the confining pressure equal to 300 kPa, a minor loss of r2(from 0.98 to 0.97) is seen in the graph since a compromised choice is necessary for the PSO method in order that a better global quality with respect to the given objective function is achieved.The above compromise arrived by the PSO method can be explained by the underlying rationale of the elastoplastic theory.Although the algebraic value of plastic modulus H (Eq.(6) to Eq.(8)) mainly depends on two fitting parameters h0and ch, this modulus manifests an explicit physical meaning, even if its quantitative characterization is impossible directly from real experiments.Analogy toelastic modulus, the plastic modulus, defined as the normal component of stress increment divided by the plastic strain increment (see Fig.12a), serves as an index to describe the extent to which the plastic deformation can be generated while yielding occurs.In other words, there is no plastic deformation when H approaches infinity and only elastic behavior is exhibited by the model.An example of profiting the above mechanism in the Dafalias model is its ability to mimic the pure elastic response of sandy specimen (as outlined in red in Fig.12b) when loading reversal takes places.While passing through the reversal,the value of ηinis set being the same as the current stress ratio η,leading H to be infinite(see Eq.(7)).Fig.13 displays the three dimensional(3D)wireframe of the plastic modulus H from different isometric views using two series of model parameters, respectively.In the graph,the modulus of the present work was always lower than the reference, especially for the target density range (e = 0.7 in Fig.13b).Now, it should be convenient to understand the choice that the PSO method made as a black box.At the very beginning loading stage,the PSO method attempted to turn down the plastic modulus H; as a result, the development of plastic strain got boosted.This effect inhibited the rapid growth of elastic strain part,which was the key ingredient to yield the stress build-up.Then,more curved results were numerically generated, as shown in Fig.10.However,the above reasoning cannot logically explain what has been observed for the critical state in Fig.10.As the calculation reached the critical state(namely e=ec),the state parameter ψ was set to be 0.From Eq.(6) and Eq.(11), it can be deduced that the plastic modulus H was automatically zeroed out,irrespective of the algebraic value of h0and ch.Thus,as for the large strain range(i.e.εa>17%in Fig.10)prevailed by the critical state,the manipulation of fitting parameters through the PSO method provided no longer beneficial contribution since the parameters governing this state(Mc, c, λc, e0and ξ) had been already determined in an explicit manner (the optimum-fitting method in Ramirez et al., 2018).
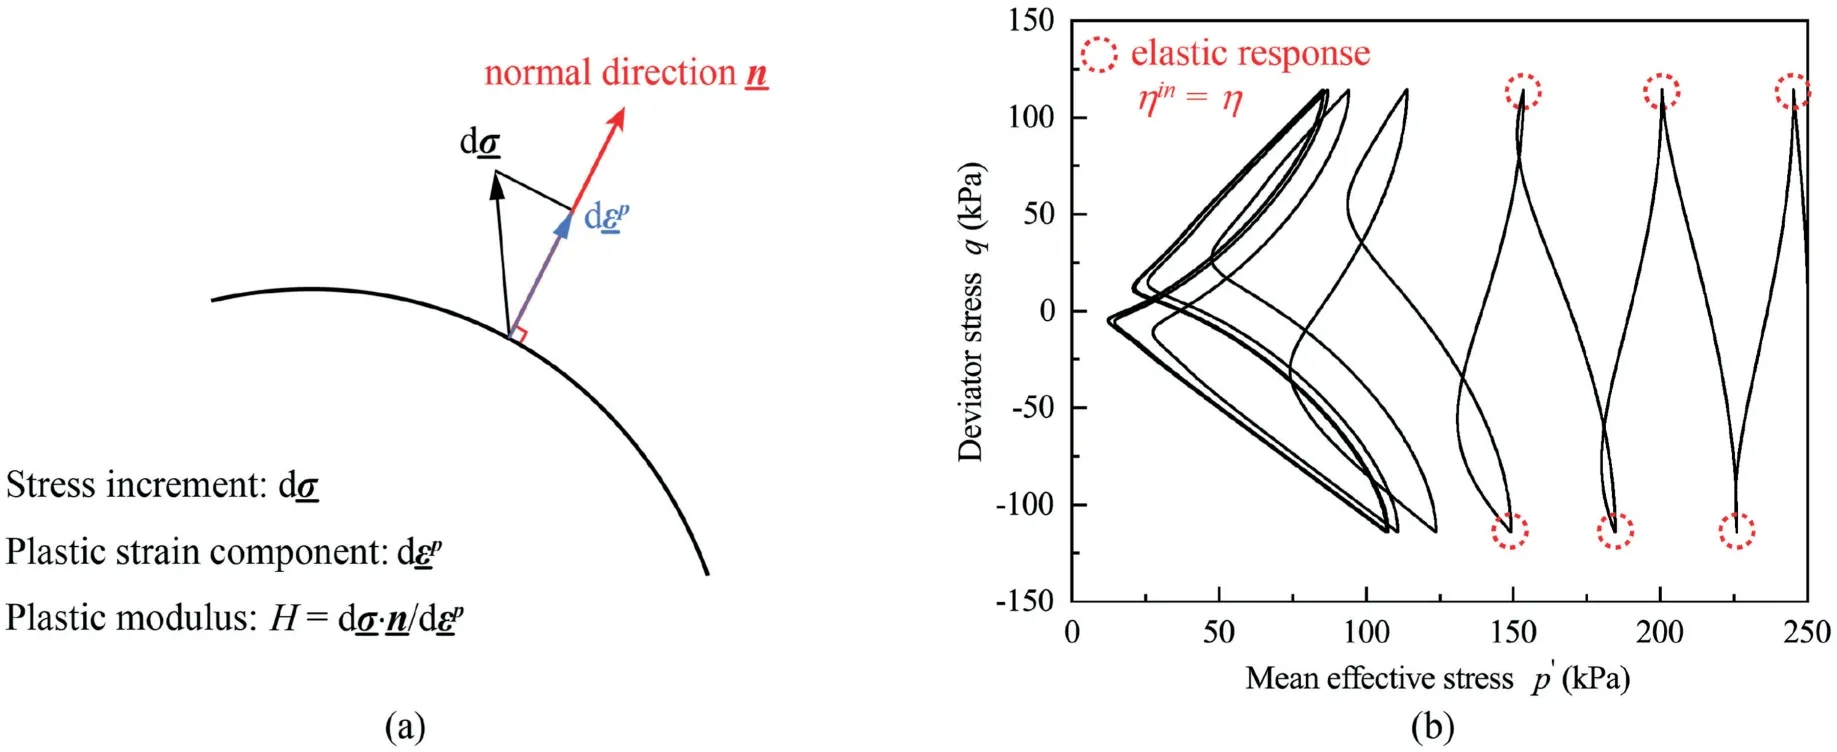
Fig.12.Schematic of (a) The plastic modulus definition and (b) Pure elastic responses (after Dafalias and Manzari, 2004).
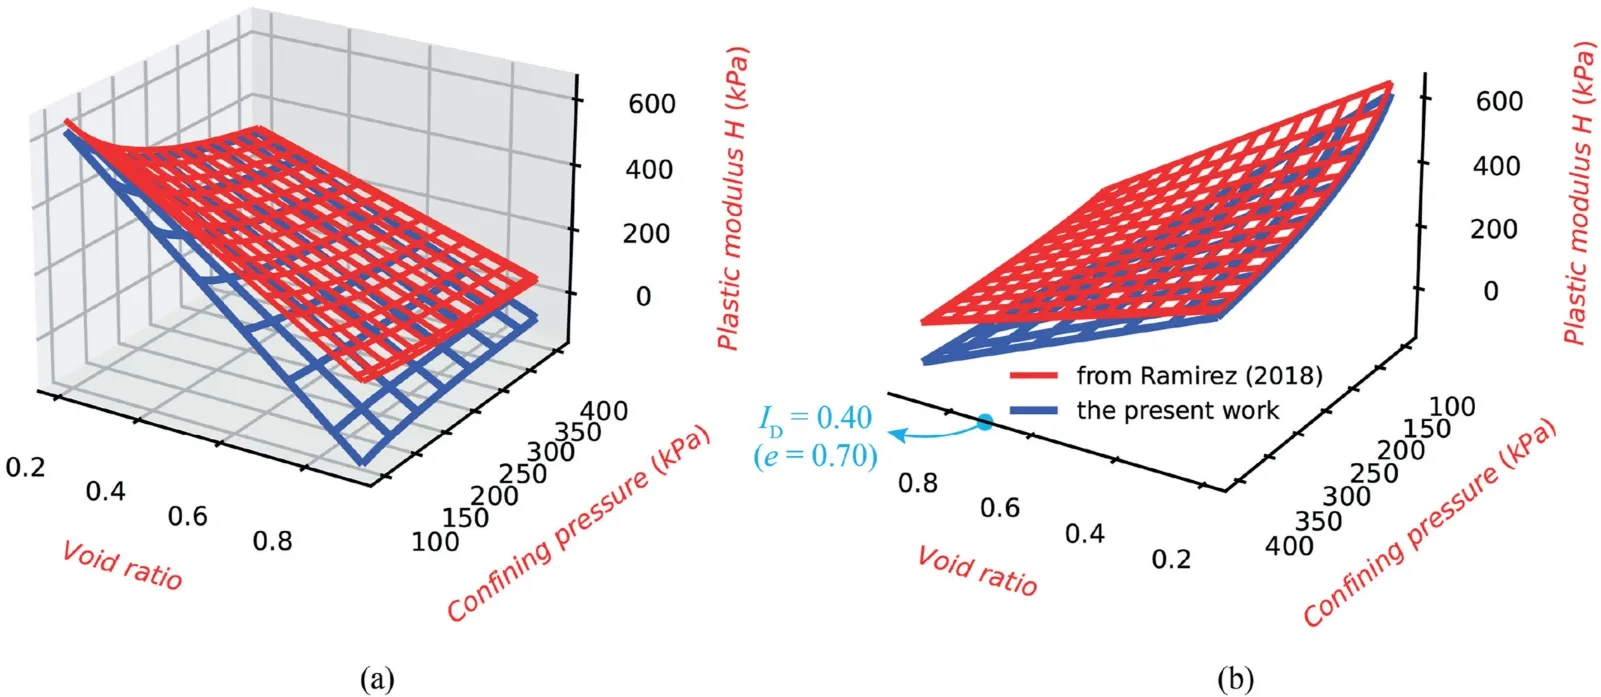
Fig.13.3D wireframe of plastic modulus H from different isometric views: (a) From front angle and (b) From back angle.
5.Conclusions
In this paper,a novel calibration methodology based on the PSO is proposed for an advanced constitutive model and the Dafalias model has been taken as an example to illustrate the manner.The procedure is based on a multi-objective measure of error so that the particles in the PSO method could logically adjust their positions, making the computed results match the real experiments as much as possible.In order to simultaneously ensure the global quality of computed monotonic/cyclic triaxial results, the objective function interacting with the PSO method was designed as the sum of errors with respect to the above two kinds of tests.As for simulation of cyclic triaxial test,two interrupt mechanisms were built,allowing the total computation time to be controlled within an acceptable range.
In the present work,standard PSO parameters(including inertia weight,cognitive/social parameters)were used in the programme.As for HN31 sand,the obtained calibrated values fell well within the proposed search range and all particles were finally converged on a single point.Then, the performance of the PSO method was carefully examined.With respect to monotonic triaxial test under confining pressure of 200 kPa,both the stress-strain curve and the effective stress path matched well with the real experiments.Two parallel tests under confining pressures of 100 kPa and 400 kPa could derive the same conclusion.With respect to cyclic triaxial test, the build-up of excess pore water pressure and the cyclic effective stress path were in high accordance with the experimental results.Another blind cyclic triaxial test in displacement-controlled mode was used to further validate the proposed calibration methodology.At last, an extension example was given for Ottawa sand F65 in order to demonstrate the versatility of the proposed programme.It is evident that the proposed PSO method could still provide a supplementary contribution to the well-documented fitting parameters in the published literature.In addition, the compromise made by the PSO method can be logically explained in the framework of elastoplastic theory.
Declaration of competing interest
The authors declare that they have no known competing financial interests or personal relationships that could have appeared to influence the work reported in this paper.
Acknowledgments
The financial support provided by the research sponsors through Shanghai Pujiang Program (Grant No.20PJ1417300) and ANR (Agence Nationale de la Recherche) ISOLATE is gratefully acknowledged.The authors acknowledge the scikit-opt library available at https://github.com/guofei9987/scikit-opt/ for the PSO method.The complete Python code developed in this article is available upon requesting.
Appendix A.Supplementary data
Supplementary data to this article can be found online at https://doi.org/10.1016/j.jrmge.2022.05.008.
 Journal of Rock Mechanics and Geotechnical Engineering2023年3期
- Journal of Rock Mechanics and Geotechnical Engineering的其它文章
- Predicting and validating the load-settlement behavior of large-scale geosynthetic-reinforced soil abutments using hybrid intelligent modeling
- Effects of biochar-amended alkali-activated slag on the stabilization of coral sand in coastal areas
- Development of mathematically motivated hybrid soft computing models for improved predictions of ultimate bearing capacity of shallow foundations
- Long-term decay of the water pressure in the osmotic tensiometer
- Combined load bearing capacity of rigid piles embedded in a crossanisotropic clay deposit using 3D finite element lower bound
- Numerical simulation of fatigue crack propagation in heterogeneous geomaterials under varied loads using displacement discontinuity method
