Effects of biochar-amended alkali-activated slag on the stabilization of coral sand in coastal areas
Xiol Hn, Ningjun Jing, Fi Jin, Krishn R.Ry, Yiji Wng, Kiwi Liu,Ynjun Du
a Department of Civil and Environmental Engineering, University of Hawaii at Manoa, Honolulu, USA
b Institute of Geotechnical Engineering, Southeast University, Nanjing, 210096, China
c School of Engineering, Cardiff University, Cardiff, UK
d Department of Civil, Materials, and Environmental Engineering, University of Illinois at Chicago, Chicago, USA
e College of Materials and Chemical Engineering, Anhui Jianzhu University, Hefei, 230601, China
Keywords:Coral sand Soil stabilization Biochar Alkali activation
ABSTRACT Coral sand is widely encountered in coastal areas of tropical and subtropical regions.Compared with silica sand, it usually exhibits weaker performance from the perspective of engineering geology.To improve the geomechanical performance of coral sand and meet the requirement of foundation construction in coastal areas, a novel alkali activation-based sustainable binder was developed.The alkaliactivated slag (AAS) binder material was composed of ground granulated blast-furnace slag (GGBS)and hydrated lime with the amendment of biochar, an agricultural waste-derived material.The biocharamended AAS stabilized coral sand was subjected to a series of laboratory tests to determine its mechanical, physicochemical, and microstructural characteristics.Results show that adding a moderate amount of biochar in AAS could improve soil strength,elastic modulus,and water holding capacity by up to 20%,70%,and 30%,respectively.Moreover,the addition of biochar in AAS had a marginal effect on the sulfate resistance of the stabilized sand,especially at high biochar content.However,the resistance of the AAS stabilized sand to wet-dry cycles slightly deteriorated with the addition of biochar.Based on these observations, a conceptual model showing biochar-AAS-sand interactions was proposed, in which biochar served as an internal curing agent, micro-reinforcer, and mechanically weak point.
1.Introduction
Coral sands typically originate from coral reefs and encrusting coralline algae near the shoreline (Lv et al., 2017).The coral sand grains are generally angular or sub-angular and have small cavities on their surfaces, resulting in a relatively loose geological deposit(Coop,1990).Compared with silica sand,coral sand with a high void ratio possesses different and usually weaker mechanical and geotechnical properties.Morioka and Nicholson (2000) found that silica sand had 1.5-2 times greater tip resistance than coral sand from the cone penetration test.Dijkstra et al.(2013) reported that footings constructed on coral sand resulted in a significant reduction in bearing capacity compared with silica sand at identical relative density.Lv et al.(2017) reported that the shear creep of coral sand was 10 times greater than that of silica sand.The inferior engineering performance of coral sand is attributed to its high compressibility and particle crushability (He et al., 2020).With continuing development and exploitation activities onshore and offshore,it is expected that more infrastructure will be built on coral sand, signifying the urgency and importance of understanding the mechanical behavior of coral sand and identifying suitable ground improvement methods when deemed necessary(Wang et al.,2011).
Chemical stabilization is one of the most commonly used methods to improve the mechanical performance of the sand.Among various types of binders, alkali-activated slag (AAS) has become increasingly popular owing to its high early strength, superior durability in an acidic environment, stronger cementaggregate interface, and ability to maintain stability in extremely high temperatures (Bakharev et al., 2003).AAS utilizes a metallurgical slag as the main precursor, typically ground granulatedblast-furnace slag (GGBS) and an alkaline solution to trigger the hydration and polymerization process, which produce cementitious products such as calcium(aluminum)silicate hydrate(C-(A)-S-H), sodium aluminum silicate hydrates (N-A-S-H), and Mg-Al layered double hydroxides (LDH) (Myers et al., 2017).
AAS has been proposed as a sustainable alternative to ordinary Portland cement (OPC) owning to its simple manufacturing procedures, low CO2emissions, and superior durability performance(Behfarnia and Rostami, 2017).Therefore, it is envisaged that AAS could serve as a promising replacement for OPC for soil chemical stabilization, particularly under aggressive chemical environment,such as soils subject to acid and sulfate exposures (Beltrame et al.,2020; Ramagiri et al., 2020).In the past decade, AAS has been increasingly investigated as a binder to stabilize various soil types.For instance, Higgins (2005) summarized the research related to GGBS and lime for cohesive soil stabilization in the UK and pointed out that GGBS with lime showed promising long-term strength compared with OPC.Oti et al.(2009) utilized GGBS, lime and the Lower Oxford Clay to manufacture unfired masonry bricks.The environmental impact and cost were reduced significantly.These bricks had higher strength and volume stability than those manufactured with OPC.Du et al.(2017) utilized GGBS activated by sodium silicate and calcium carbide residue to stabilize low plasticity clay and found that the stabilized clay had higher permeability,water absorption capacity, and compressive strength than those treated by OPC.Rabbani et al.(2012) adopted GGBS and lime to stabilize desert sand containing abundant sulfate ions and observed significant improvement in unconfined compressive strength(UCS)and California bearing ratio (CBR).Yi et al.(2015) selected MgO as the activator for GGBS to stabilize silty sand and found that the hydration products,such as hydrotalcite and C-S-H,could fill voids between sand particles and increase soil strength.In addition, Gu et al.(2015) showed that hydration reactions, pozzolanic processes, cation exchange, and particle agglomeration were the main mechanisms of soil stabilization by AAS.Zhang et al.(2018) found that when stabilizing marine clay, GGBS mixes improved the water holding and contaminant-encapsulating properties compared to OPC-only mixes.As a novel binder, its long-term in-service performance still needs to be verified.The high dry shrinkage level and brittle failure are two major known drawbacks of AAS.To overcome these drawbacks and make AAS adoptable to various engineering applications, researchers have added fibers, chemicals, and nanoparticles as additives to increase the flexibility and ductility of AAS,which helped to restrain and control its crack development (Song et al., 2019).However, limited research has been found in coral sand stabilization utilizing AAS material.
Biochar is produced from the pyrolysis of waste biomass such as agricultural (e.g.waste wood, rice husk, and corn cobs) and other organic wastes(e.g.manure/animal waste,and wastewater sludge)under oxygen-deficient conditions (Xie et al., 2015).Therefore,biochar normally has a low cost of about 2.5 US dollars per kilogram(Jin et al.,2021).Biochar properties can vary widely,depending on the feedstock and pyrolysis conditions (temperature, residence time, and post-treatment).Upon pyrolysis, a highly porous inner structure is formed and thus biochar possesses a high specific surface area and large cation exchange capacity(CEC)(Batista et al.,2018).The carbon accumulated in the biomass is sequestered into the biochar in a stable state and will not degrade in hundreds or even thousands of years, making it promising for carbon sequestration(Xie et al.,2016).Biochar has been widely applied in various agricultural and environmental engineering, especially soil and water quality improvement,due to its excellent adsorption capacity towards various contaminants (Xie et al., 2015; Kua et al., 2019).More recently,biochar has been used as an additive in cementitious construction materials to improve their engineering performances.Choi et al.(2012)reported that high water absorption and retention capacity of biochar reduced the local water/cement ratio, thus accelerating the curing process of OPC and minimizing the generation of capillary pores due to water evaporation.Gupta and Kua(2018, 2019) amended OPC with biochar as a lightweight additive to increase its air content and reduce the fresh density.In the meantime, the compressive strength and ductility were improved by 10%-20% with 1%-2% (weight/weight) biochar.Restuccia et al.(2017) analyzed the fracture development in cementitious composite mixed with biochar and concluded that biochar could arrest crack expansion and reroute crack path, serving as a local reinforcement.Mo et al.(2019)reported that the internal curing effect from biochar could mitigate the autogenous shrinkage of cement without compromising the compressive strength.These studies have proved that biochar has a high adsorption capacity for ions and superior water holding capacity, which could improve the binder strength and mitigate crack development.
While biochar has been studied as an additive in OPC-based construction materials, there has been no work regarding its effects on the properties of AAS.Considering the characteristics of both biochar and AAS,it is hypothesized that biochar could act as an internal curing agent to reduce the shrinkage of AAS and improve its cracking resistance.It may also further enhance the durability of AAS against chemical attacks, such as sulfate.In this study, a comprehensive experimental program was devised to study and validate the synergy between biochar and AAS,which were used to stabilize coral sand, and this has not been reported by other researchers.The strength, water holding capacity, durability, physicochemical properties, and microstructural characteristics of the stabilized coral sand were thoroughly investigated.
2.Materials and methodologies
2.1.Materials
2.1.1.Coral sand
The coral sand used in this study was purchased from the company PRO-PAK(Honolulu,Hawaii,USA).It contained more than 99.95% calcium carbonate and had a specific gravity of 2.81.The grain size distribution curve is shown in Fig.1, with coefficient of curvature Cc= 0.88 and coefficient of uniformity Cu= 2.73.It was classified as the poorly graded sand (SP) according to ASTMD2487-17 (2017).The sand was initially adjusted to an initial 5%moisture content to simulate the typical moist condition of natural coral sand in coastal areas (Han et al., 2020).
2.1.2.GGBS and lime
The chemical composition of GGBS is shown in Table 1.The mass ratio between CaO + MgO and SiO2+ Al2O3is 0.81 and that between CaO + MgO +Al2O3and SiO2+ TiO2is 1.55.The GGBS was classified as a neutral slag.Commercial hydrated lime produced by Graymont Western (Richmond, British Columbia, Canada) was selected as the alkaline activator for GGBS,which contained 71 wt%calcium oxide (CaO).
2.1.3.Biochar
The biochar manufactured by Pacific Biochar (Santa Rosa, California, USA) was selected in this study.It was smoldered at a temperature of 760°C from the raw residue of pine and cedar collected in North California,USA.It had a density of 156 kg/m3,an initial pH of 10.3, and a CEC value of 21.5 meq/(100g).Its major constituent elements were calcium, potassium, phosphorus, and magnesium.All biochar particles were pre-sieved to only keep those retained between 1.19 mm and 0.841 mm sieves.Before mixing with AAS,the biochar was soaked in de-aired distilled water until a fully saturated status was reached.The weight of water fully saturated biochar was 8.34 times of its dry weight, due to the vast volume of internal pores (Batista et al., 2018).
2.2.Methodologies
A total of six biochar-amended AAS mixes were prepared, as shown in Table 2.The binder was composed of three components:GGBS,hydration lime,and biochar.The binder content,which was defined as the mass ratio between the binder and dry sand, was fixed at 15%.The biochar contents, defined as the mass ratio between biochar and sand, were 0%, 0.075%, 0.149%, 0.222%, 0.294%,and 0.366%, respectively.When converted into the biochar-binder ratio, they were 0%, 0.5%, 1%, 1.5%, 2%, and 2.5%, respectively.However, as an additive, the upper limit of the biochar was set as 0.8%to the weight of sand during the pilot experiment.The waterbinder ratio was set as 0.733 to ensure a uniform mixture state.It should be noted that the water-binder ratio was calculated based on the water initially in the moist sand, pre-saturated by biochar,and that added separately during mixing.

Table 1Chemical compositions (%) of GGBS determined by X-ray fluorescence (XRF).

Table 2Mix proportions of the AAS-biochar stabilized coral sand.
2.3.Sample preparation
GGBS and hydrated lime were mixed thoroughly with the moist sand.Then,water together with saturated biochar was added to the AAS-sand mixture and agitated until a uniform state was reached.This uniform paste was then cast in three layers into polyvinyl chloride (PVC) molds with an internal diameter of 51 mm and a height of 102 mm.Upon completion, the top and bottom surfaces were sealed with three layers of polyvinyl films to minimize moisture evaporation.All samples were cured at 20°C ± 2°C and 60%relative humidity to designated curing periods(i.e.1 d,3 d,7 d,14 d,28 d,60 d,and 90 d).The long curing periods of 60 d and 90 d were selected based on previous study(Gu et al.,2015).The relative humidity was set to simulate the local climate condition in Hawaii,USA, where the humidity is approximately 60%in the dry season.
2.4.Testing methods
The experimental programs included unconfined compression test (UCT), moisture content test, pH test, sulfate resistance test,wet-dry cycle test, X-ray diffraction (XRD) analysis, optical microscope observation, and scanning electron microscopy-energy dispersive X-ray spectroscopy analysis (SEM-EDS).The detailed test methods conducted on the samples are listed in Table 3.
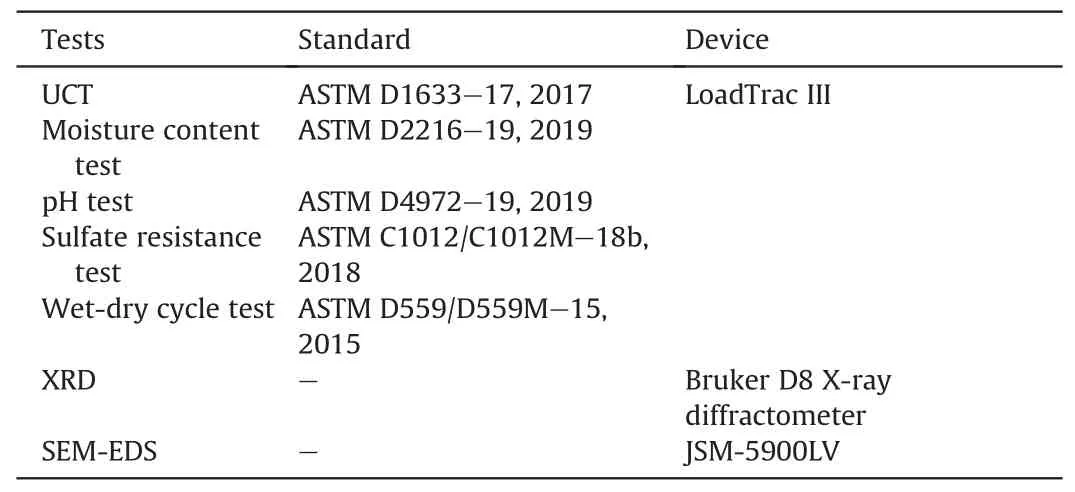
Table 3Details about test methods conducted on the samples.
The UCT was performed using the LoadTrac III frame system built and calibrated by Geocomp(Acton,MA,USA).The loading rate was 1.3 mm/min based on ASTM D1633-17 (2017).Samples were tested in triplicate.UCS,secant modulus,and strain at failure were obtained based on UCT results.
Moisture content and soil pH were measured based on ASTM D2216-19 (2019) and ASTM D4972-19 (2019), respectively.Additional samples prepared and cured under the same condition as those for UCT were used for moisture content and soil pH measurement.Specifically,the soil was passed through the 2 mm sieve before pH measurement.
The sulfate resistance of stabilized sand was quantified according to ASTM C1012/C1012M-18b (2018).The samples, which were prepared in the same way as those for UCT, were cured at 20±2°C and 60%relative humidity for 1 d and then demolded for the sulfate resistance tests to adapt to quick construction in coastal infrastructure.The demolded soil samples were submerged in 5%Na2SO4solution for 3 d, 7 d and 14 d.The Na2SO4solution was replaced periodically to maintain its concentration (Jiang et al.,2018).Upon completion of soaking, samples were flushed with distilled water to get rid of residue Na2SO4solution and then dried with a paper towel for 30 min.Finally, the volume and UCS of the soaked samples were measured.
The wet-dry tests were conducted according to ASTM D559/D559M-15 (2015).Samples were prepared and cured in the sameway as those in the sulfate resistance test.Upon completion of curing, the samples were subjected to 3, 7, and 14 wet-dry cycles.Each cycle included submersion in distilled water at 22°C for 6 h and then drying in an oven at 70°C for 42 h.It should be noted here that 14 cycles were selected so that the test results could be compared with continuous curing for 28 d under normal curing conditions.After completion of each cycle,the mass and size of the samples were measured.Finally, after all wet-dry cycles were completed, the samples were subjected to UCT.
The XRD tests on selected samples were performed using a Bruker D8 X-ray diffractometer.The samples were ground into powders using a micro-mill.The scanning range was 10°-70°(2θ)and the scanning rate was set as 2°per minute with a resolution of 0.02°per step.
The SEM-EDS was conducted using the JSM-5900LV SEM with an EDS detector.After UCT, the stabilized sand sample of 3 cm×3 cm×3 cm was taken and preserved in ethanol followed by drying at 40°C to terminate hydration reactions.Before the SEM observation, samples were further broken into 5 mm × 5 mm × 5 mm pieces and ready to be loaded into the machine.No sputtering regime was applied to these samples.Since the samples were collected after UCTs,the rough surface along the crack area would be effortless to spot under the SEM.The SEM-EDS was conducted under an acceleration voltage of 15 kV.
Upon the completion of these experiments, the testing data were analyzed using SPSS software to obtain the repeatability of the experiments and how biochar content and curing time affected soil engineering properties.In this study, the biochar content and the curing time were listed as the independent variables, whereas the dependent variables were UCS, secant modulus (E50, which is the secant modulus at the 50% stress level), strain at failure,moisture content, pH value, strength reduction under sulfate attack, and UCS under wet-dry cycles.Firstly, the coefficient of variation(CoV)was adopted to evaluate the repeatability of testing results, as shown in Table 4.In general, the repeatability of most testing data is great, though E50, strain at failure, and the strength reduction under sulfate attack showed slightly lower repeatability.It should be noted that E50and strain at failure normally have larger variations than UCS in most reported studies.
Then,the one-way analysis of variance(ANOVA)was carried out at 5%level of significance for statistical analysis.When p <0.05,the independent variables were considered statistically significant.When p <0.001, the independent variables were considered statistically highly significant.The results are shown in Table 5.It can be clearly seen that both biochar content and curing time could influence soil engineering properties at a statistically high significance.
3.Results
3.1.Mechanical performance
3.1.1.UCS
UCS,secant modulus(E50),and strain at failure of the stabilized coral sand were obtained from UCT,which are shown in Figs.2-5.From the statistical results shown in Table 5, the biochar content and curing time had a highly significant influence on the UCS since the p-value was less than 0.001.In Fig.2, it is shown that the UCS values ranged between 0.4 MPa and 3 MPa in most cases.Particularly,after 7 d of curing,all samples yielded UCS values larger than 1 MPa, meeting the minimum strength requirement for pavement foundation (Christopher et al., 2006).For comparison, OPCstabilized sand with a similar binder content was reported to have UCS values between 0.5 MPa and 2.5 MPa (Choobbasti and Kutanaei, 2017).The effect of biochar content on the UCS varied for short-term(1-28 d)and long-term(60 d and 90 d)samples.Forshort-term samples, biochar showed little enhancement on the UCS.Instead,UCS values dropped slightly in most cases,indicating that the introduction of biochar weakened the sand-binder matrix.However, for samples cured for 60 d and 90 d, adding a small amount (0.075% and 0.149%) of biochar resulted in a remarkable increase in the UCS by more than 20%.Further increase in biochar dosage cured for long periods resulted in UCS values equivalent to or slightly lower than those of samples without biochar.

Table 4The CoV of all dependent variables.
3.1.2.Secant modulus
The results of E50under different experimental conditions are shown in Fig.3.From the ANOVA results shown in Table 5, the pvalue demonstrated that the biochar content and curing time had a highly significant influence on E50.The E50ranged between 50 MPa and 400 MPa for most cases in this study.For comparison,Marzano et al.(2009) applied 4%-13% OPC to stabilized granular soil and found the secant modulus ranged from 70 MPa to 210 MPa.Similar to the UCS results, E50was not improved with the addition of biochar in samples cured for less than 28 d.In particular, more than 0.294%biochar dosage resulted in a dramatic loss of soil stiffness by at least 40%.Nevertheless, when samples were cured for longer than 60 d,a more than 70%increase in E50was observed at 0.075%and 0.149% biochar contents.At higher biochar contents (0.294%and 0.366%),soil stiffness was about 20%smaller than soil without biochar at 60 d.However,as the curing time extended to 90 d,soil stiffness bounced back to 40% more than those without biochar.
In Fig.4,UCS and E50data from this study were correlated using the following equation:
where η is a dimensionless coefficient.The value of η varied from 60 to 300 for the biochar-amended AAS stabilized coral sand in this study and Han et al.(2020).The result was higher than the value of 25-130,as reported by Marzano et al.(2009),who applied similar OPC content to stabilize gravelly sand.
3.1.3.Strain at failure
Strain at failure is an indicator of soil ductility (Park, 2011) and the results are shown in Fig.5.With the p-value less than 0.05, a significant correlation between the biochar content, curing timeand strain at failure can be proved from the statistical results in Table 5.The values were between 0.5%and 2%for all samples tested in this study.Choobbasti et al.(2018)reported a similar range(1%-2.5%)of sand stabilized by a 14%binder containing OPC and nanosilica.For samples cured for short periods(1-28 d),adding biochar resulted in a larger strain at failure in most cases (22 out of 25).Particularly, for the case of 1 d, the stabilized sand was still fresh and immature.Water served as a lubricant to increase the ductility of the sample (Wang et al., 2020).However, after a longer period(60 d and 90 d), samples with 0.075%-0.294% biochar displayed a reduced strain at failure compared with those without biochar.The strain at failure only increased at the highest biochar dosage(0.366%).

Fig.2.UCS of biochar-amended AAS stabilized coral sand.
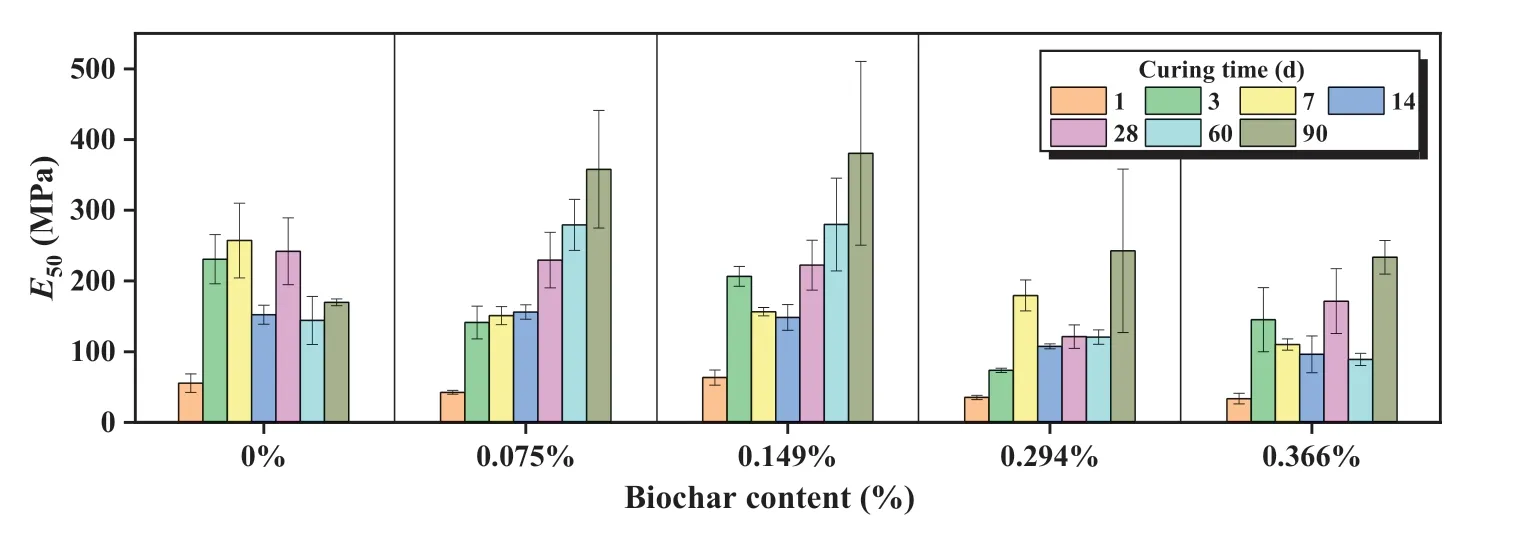
Fig.3.E50 of biochar-amended AAS stabilized coral sand.
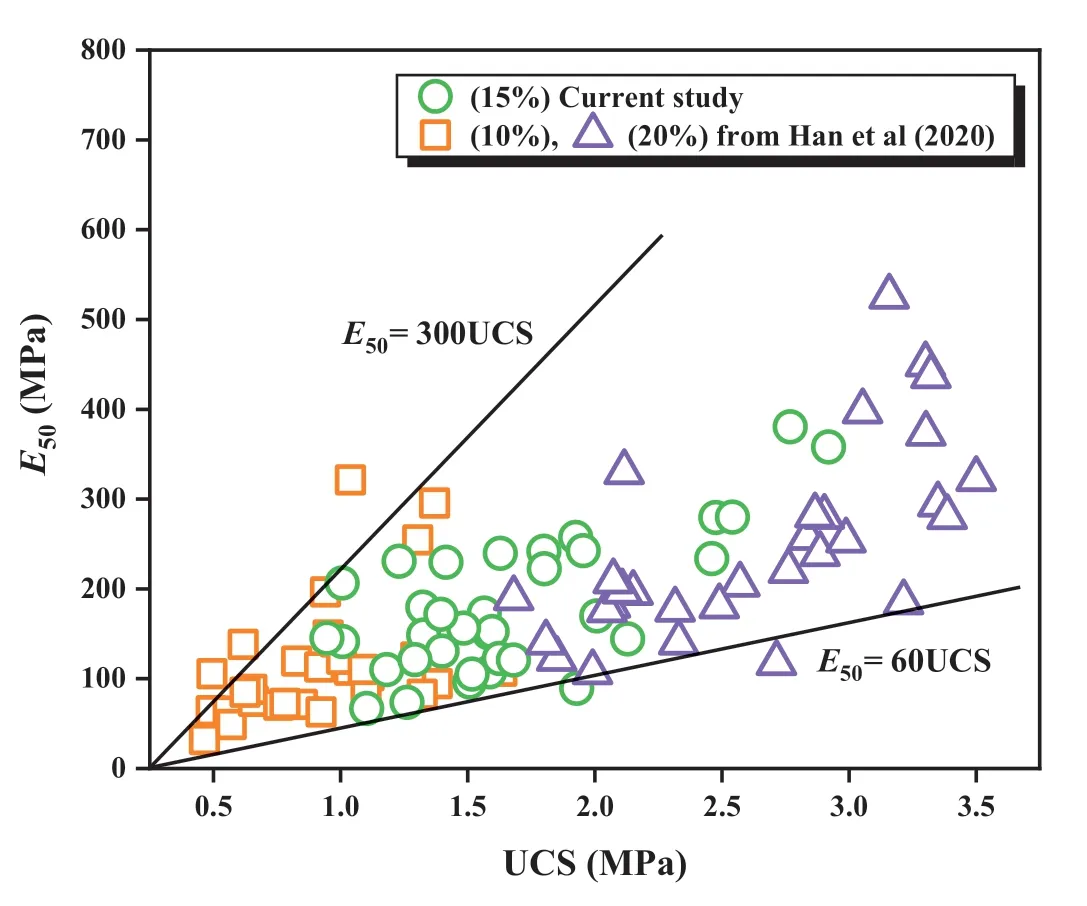
Fig.4.The relationship between UCS and E50.
From the UCT results,it can be concluded that the addition of a moderate amount of biochar was beneficial for strength and stiffness development in the long term.On the other hand, a high biochar content can be detrimental to soil strength and stiffness,particularly for those cured for a short period.Moreover, adding biochar to AAS stabilized coral sand can improve its ductility in general, particularly at an early age and/or with a high biochar dosage.The observed engineering properties were due to the three-fold functions of biochar in the stabilized soil matrix:internal curing agent, mechanically weak point, and micro-reinforcer.The mechanisms will be discussed in detail in the Discussion section.
3.2.Physicochemical properties
3.2.1.Moisture content
The moisture contents of the coral sand mixtures at different curing times are shown in Fig.6.The statistical results from Table 5 showed that both biochar content and curing time had a significant influence on the moisture content during the designed experiment.Based on the mixing design (see Table 2), all samples had an identical initial moisture content, which was 11% based on the dry weight of coral sand.As the biochar was initially fully saturated before mixing, part of the water in the stabilized soil was present freely in soil pores and the rest was absorbed by the biochar.During the curing period, gradual water loss was observed in all cases,which was primarily dictated by two factors:(1) AAS hydration reactions and(2)water evaporation.For samples cured for 3 d,7 d and 14 d,the moisture content was between 5.8%and 7.5%.There was a slight increase (0.3%-1.3%) in moisture content for samples with higher biochar dosages.Within the initial 14 d of curing, AAS hydration reactions were still actively undergoing and water evaporation was not significant in the short term,attributed to the 3-layerpolyvinyl film sealing.Thus, the water loss was mostly due to hydration reactions (Hoyos-Montilla et al., 2021).Based on moisture content variations,it can be inferred that hydration reaction developed faster in lower biochar content or no biochar samples, which was thought to be attributed to more free water in soil pore spaces that was immediately available for hydration reactions.For longer curing periods (28-90 d), the moisture content increased more substantially with increasing biochar content.The sample with the highest biochar content (0.366%) had 22%-36% more water than those without biochar.In the long term,hydration reactions slowed down and thus the dominance of water loss due to hydration reaction was overtaken by water evaporation.The long-term moisture content results clearly showed that the superior water holding capacity of biochar contributed to the higher moisture content at the curing end,which was also reported by Sun and Lu(2014).
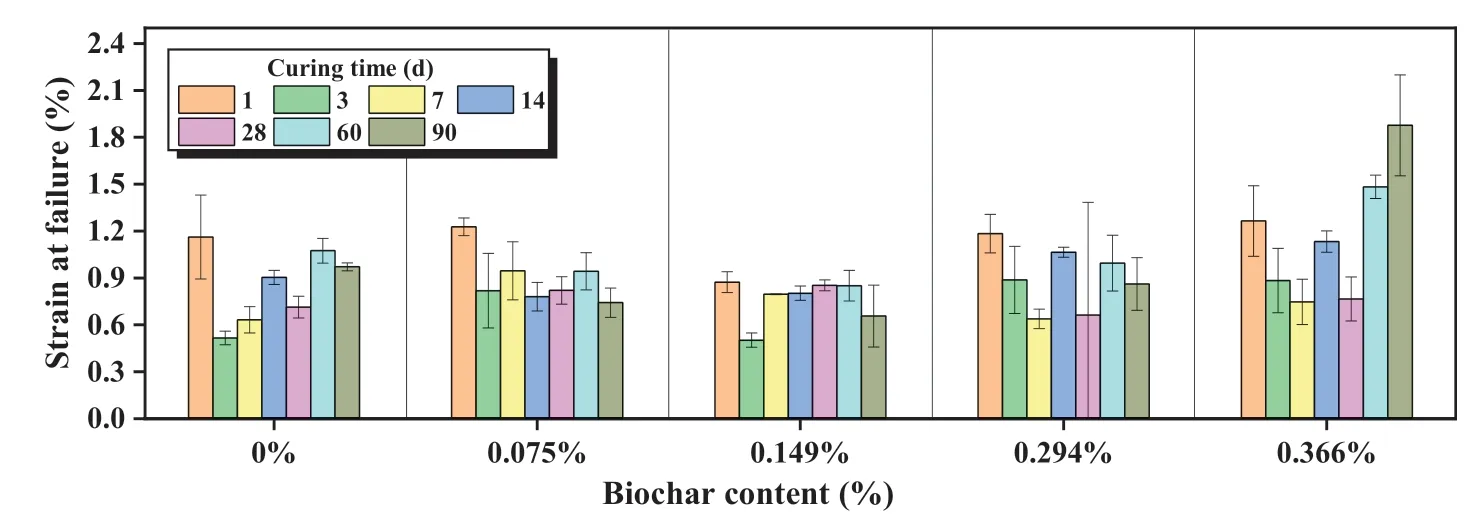
Fig.5.Strain at failure of biochar-amended AAS stabilized coral sand.
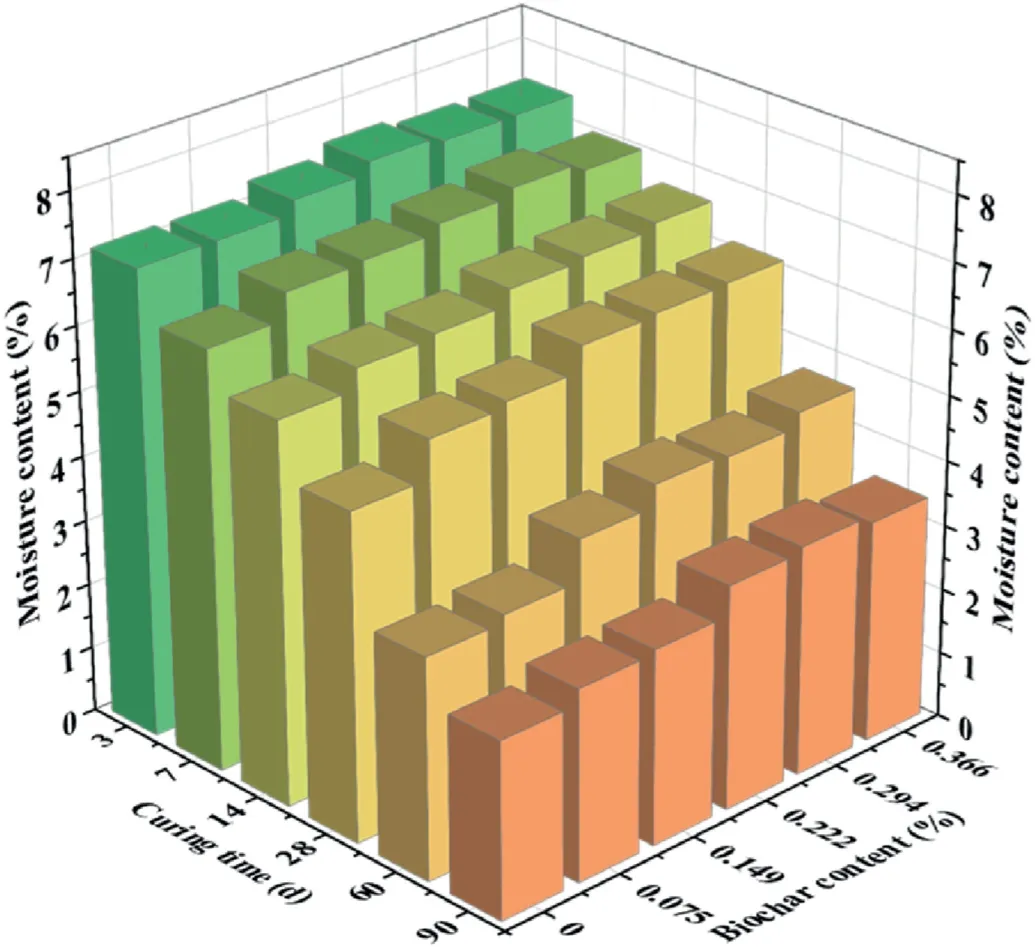
Fig.6.Moisture content of biochar-amended AAS stabilized coral sand.
3.2.2.Soil pH
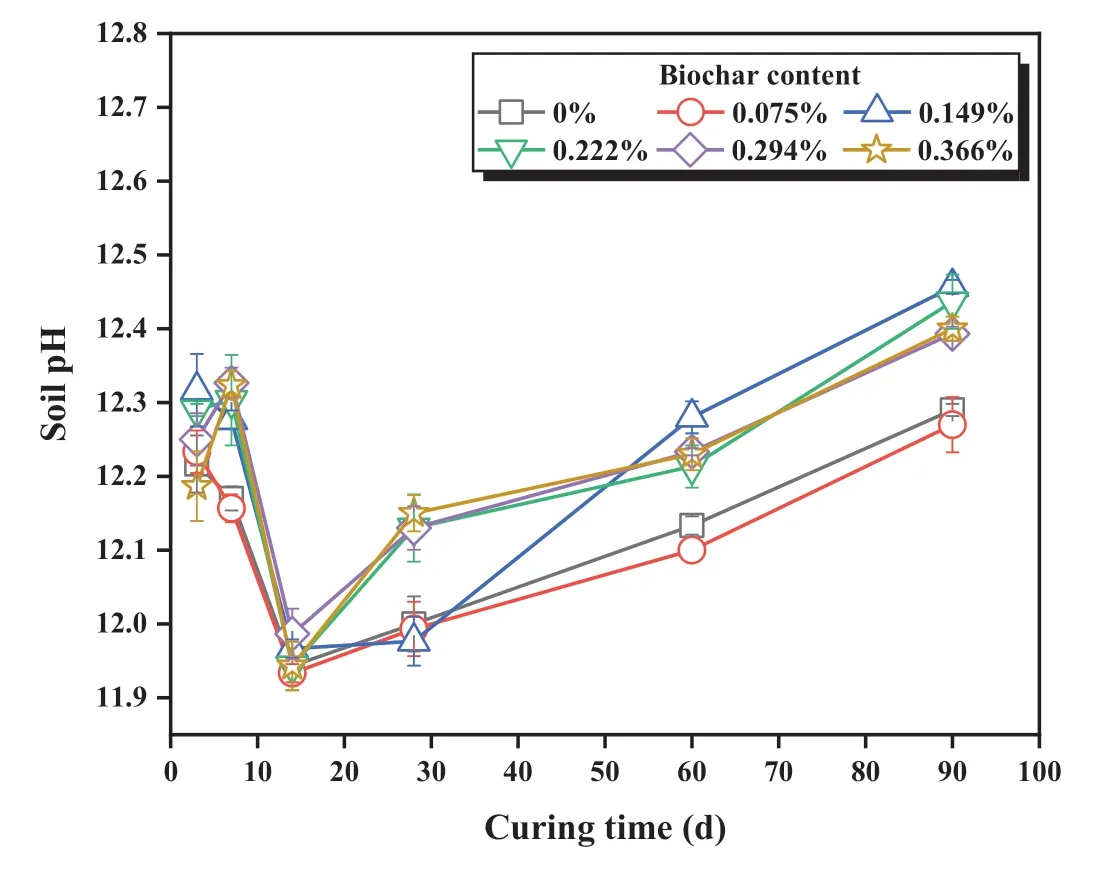
Fig.7.The relationship between the soil pH of stabilized coral sand and curing time.
Soil pH was predominantly determined by the soil pore solution chemistry (Du et al., 2014, 2020).In this study, pore solution chemistry was controlled by two competing processes:dissolution of hydrated lime/GGBS in an alkaline environment and AAS hydration reactions.The former led to pH rise to the equilibrium value of 12.5.The latter brought down alkalinity due to the utilization of hydrated lime as a reactant for AAS hydration reactions (Du et al.,2017; Jiang et al., 2018).From Table 5, the ANOVA statistical results showed that the pH was significantly related to biochar content and curing time since their p-values were both less than 0.001.Fig.7 shows the evolution of soil pH with time at different biochar contents.For all cases tested in this study,the soil pH dropped from above 12.2 to below 12 during the initial 14 d.Then,the stabilized sand gradually regained alkalinity with time and the ultimate pH value after 90 d of curing reached 12.2-12.5.During the first 14 d of curing,as hydrated lime provided free calcium and hydroxide ions in the AAS system,the chemical bonds like Ca-O,Si-O, and Al-O in GGBS were broken under the alkaline environment.The resulting calcium-rich environment suppressed the further dissolution of lime due to solubility equilibrium.Meanwhile, the calcium-rich environment increased the tendency of aluminum hydrolysis, and therefore more hydroxide ions in the solution were bonded with aluminum to form tetrahydroxoaluminate ions(Li et al.,2010).The pH declined during the aluminum hydrolysis process.After 14 d of curing, with the alkali-activated reaction going on, more calcium and aluminum ions were bonded into the C-(A)-S-H network.Hence, the unreacted lime started to dissolve gradually and raised the soil pH value.
Furthermore, the addition of biochar was found to elevate soil pH in most cases.This can help to maintain the stability of hydration products (e.g.C-S-H) in AAS stabilized sand and improve its acid resistance (Du et al., 2014, 2020).While the pH elevation was insignificant at low biochar content (i.e.0.075%), an increase of more than 0.1 in pH value was observed in cases with high biocharcontents (i.e.0.222%, 0.294% and 0.366%) during the entire curing period.It was likely attributed to the carboxyl group on the biochar surface that increased the soil pH (Zhu et al., 2017).
3.3.Durability assessment
3.3.1.Sulfate attack
One of the advantages of AAS compared with OPC is its superior resistance to sulfate attack, which is due to the absence of free portlandite (i.e.Ca(OH)2) in typical AAS and its excellent impermeability(Komljenovi´c et al.,2013).However,previous studies also reported the detrimental effect of sulfate ions on the strength of AAS paste or concrete(Bakharev et al.,2003).In the current study,the strength reduction percentage (SRP)of stabilized coral sand in the sulfate resistance tests is shown in Fig.8a.From the ANOVA statistical results in Table 5, the biochar content and curing time have been proved to be significant on the influence of SRP,which is calculated as

Fig.8.Strength reduction of stabilized coral sand under the sulfate attack:(a)Strength reduction percentage variation with biochar content and (b) Strength reduction percentage variation with volume increase.
where SN represents the strength under normal curing, and SS is the strength under sulfate attack.
It can be seen that the strength reduction due to deleterious sulfate ions occurred in samples both with and without biochar.More specifically, after 3 d and 7 d of soaking, the strength was reduced by at least 40%and 85%,respectively.After 14 d of soaking,strength was almost completely lost.The observations seemed to contradict with the reported excellent sulfate resistance of AAS by other researchers(Bakharev et al.,2003;Komljenovi´c et al.,2013).
The contradiction was mainly due to three reasons.Firstly, all samples were only cured for 1 d before being subjected to the sulfate attack tests.This was to simulate the rapid exposure to seawater after the stabilization of coral sand in coastal areas.However, in most previous studies on sulfate resistance of stabilized soil, the curing time was 28 d.This difference accounted for the inferior sulfate resistance observed in the current study(Bakharev et al., 2003; Komljenovi´c et al., 2013).Secondly, instead of using caustic alkali(sodium and potassium)hydroxides/silicates as the activator, hydrated lime was used in this study in the anticipation that many industrial byproducts (e.g.calcium carbide residue)were high in lime content and could be recycled in the AAS formulation (Jiang et al., 2018).The excessive hydrated lime could readily react with sulfate ions to generate expansive gypsum(Bakharev et al., 2003).Ettringite was another major expansive product due to sulfate attack, though it was not likely to prevail if aluminum was not readily available.The volume increase shown in Fig.8b can partially demonstrate the detrimental effect of expansive gypsum (and ettringite if any) on the volume stability of AAS stabilized coral sand.Thirdly, the stabilized sand samples,compared with concrete or clay,had much higher porosity and thus permeability.Since impermeability was the major contributor to the durability of cementitious materials,the more porous stabilized coral sand would exhibit poorer sulfate resistance.
It was also found that the samples with low biochar content and soaked for a short period were more vulnerable to sulfate attack and thus displayed more deterioration in strength.This was likely because,in biochar-containing samples cured for a short period,the alkali-activated reaction occurred slower and more unreacted hydrated lime was presented,which was available for being attacked by sulfate.The moisture content results analyzed before could partially support this explanation.Nevertheless, adding more biochar would mitigate its detrimental effect on strength development.This was mainly because biochar was negatively charged on the surface and therefore, it could repel sulfate ions in the surrounding area (Zhu et al., 2017).Besides, the porous structure of biochar could accommodate the formed expansive gypsum.Even so, when samples were exposed to a prolonged soaking period,almost complete loss of strength was observed regardless of whether biochar was added or not.
In summary, the addition of biochar only had a marginal effect on the strength development of AAS stabilized sand under sulfate attack, especially at high biochar dosages.While a low dosage of biochar was added to the AAS system, the samples showed better resistance to sulfate attack at short period soaking experiments.
3.3.2.Wet-dry cycles
Wet-dry cycle tests were performed on the biochar-amended AAS stabilized coral sand to determine its mass and strength change during the repeated wet-dry process.The changes of biochar content and curing time have a statistically significant influence on the UCS of samples during wet-dry cycles: the p-values from Table 5 were both less than 0.001.Fig.9 shows the strength and mass change with respect to biochar content.For all samples with or without biochar, UCS values increased from <0.5 MPa initially to 1.7-2 MPa after 3 wet-dry cycles.Similar results werepreviously reported in studies on wet-dry cycles of OPC stabilized fine-grained soils, in which slightly enhanced UCS was ascribed to extended curing during wet-dry cycles(Aldaood et al.,2014).After subjecting to more wet-dry cycles, strength reduction occurred,and the UCS was finally reduced to below 1.3 MPa after 14 cycles.Moreover,adding biochar into the AAS stabilized sand was found to exacerbate strength reduction by 10%-35%.The more the biochar added,the lower the UCS value observed during the wet-dry cycles.
The strength loss of soil stabilized by cementitious materials was traditionally attributed to both physical and chemical weathering processes(Kampala et al.,2014).Physical weathering was due to alternating thermal expansion and contraction that resulted in the formation of internal cracks.Chemical weathering was due to the dissolution and/or diffusion of hydration products that lead to the loss of strength.In the current study, the mass change for all samples was well below 1%even after 14 wet-dry cycles,indicating that chemical weathering was not likely to be significant.Therefore,the strength reduction from 3 wet-dry cycles onwards was mainly attributed to the formation of internal cracks from thermal expansion and contraction.If the samples contain biochar, its different thermal expansion coefficients compared with AAS hydration products could lead to differential volume changes under repetitive water gain and loss, which consequently resulted in the formation of internal cracks.With more biochar, the differential volume change tended to be more significant and thus more extensive internal cracks were generated, leading to lower strength.Thus, it is necessary to control the biochar content at a moderate dosage to maintain a higher strength in both 3 and 14 wet-dry cycles.

Fig.9.(a)Strength reduction and(b)Mass change of stabilized coral sand subjected to wet-dry cycles.
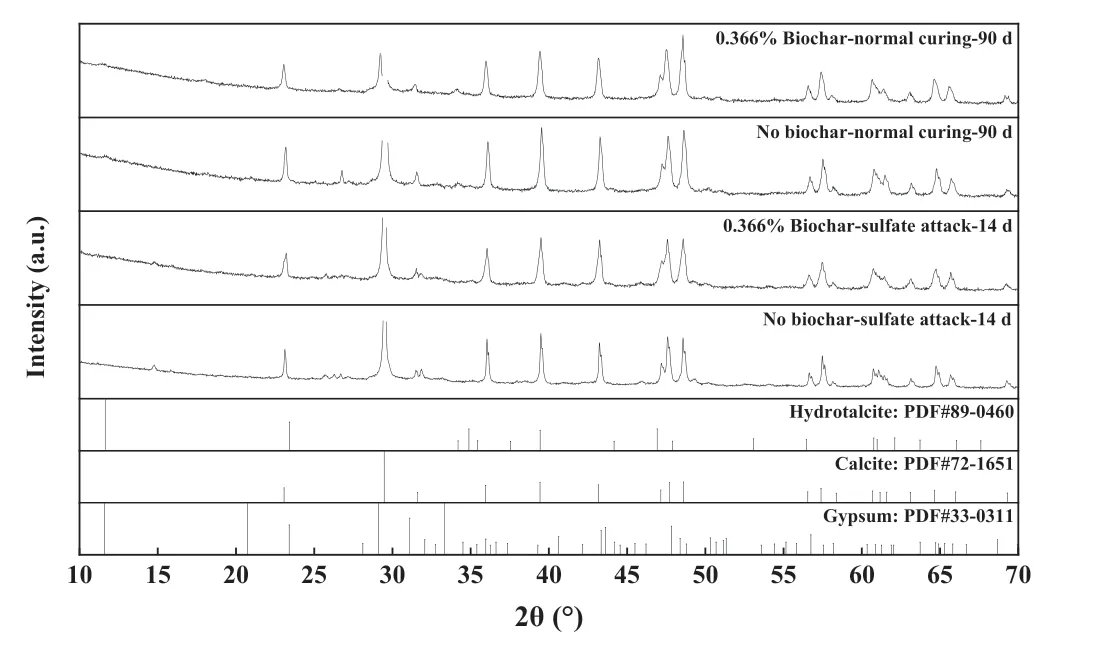
Fig.10.XRD spectra of AAS stabilized coral sand with and without biochar amendment under normal curing and sulfate attack conditions.
3.4.Microstructural characteristics
3.4.1.XRD
The XRD results are shown in Fig.10.The top two diffractograms of the samples under the normal curing condition were dominated by the peaks of calcite.This was obviously due to the nature of coral sand.In addition,a peak of hydrotalcite(Mg6Al2CO3(OH)16·4(H2O))was also observed,which is a common hydration product in AAS(Yi et al., 2014).It should be noted that no peaks of C-S-H or C-A-H were identified,which was attributed to the following two reasons.First, the sample collected for XRD tests had a low binder content(15%), while the rest was coral sand.The C-S-H or C-A-H peaks could be covered by other phases.Second,the amorphous nature of these hydration products makes them difficult to be identified by XRD.
For the samples subjected to sulfate attack, several representative peaks of gypsum could be identified,for example,at 29.1°and 33.4°.This confirmed the formation of massive gypsum during sulfate attack, which significantly deteriorated the mechanical performance of stabilized coral sand.On the other hand,ettringite was not observed by XRD, which was likely due to its smaller amount compared with gypsum.
3.4.2.SEM-EDS
To further explore the underlying mechanisms for the effect of biochar on the AAS stabilized coral sand, SEM-EDS tests were conducted for microstructural and elemental analyses.The SEM images of AAS stabilized sand samples with various biochar contents (0%, 0.149% and 0.366%) subjected to 90 d normal curing are shown in Fig.11.In the samples without biochar (Fig.11a),numerous needle-like products can be observed.According to Yazici et al.(2008), these were likely to be C-S-H, which were common hydration products of AAS reactions.It can be also seen that sand grains were glued by the hydration products,though the overall structure seemed quite porous.In the sample with 0.149%biochar, a very dense structure could be observed, as shown in Fig.11b.The interface between biochar and sand grains contained densely formed hydration products.Moreover, the interior of biochar was also found to be partially filled with hydration products.Similar microstructures were reported by Mo et al.(2019) and Gupta et al.(2018).With a further increase in biochar content,more biochar was observed in the pore space, as shown in Fig.11c.Itseemed that there were more weak bonding points between biochar and sand grains, making it less resistant to external load compared with that in Fig.11b.
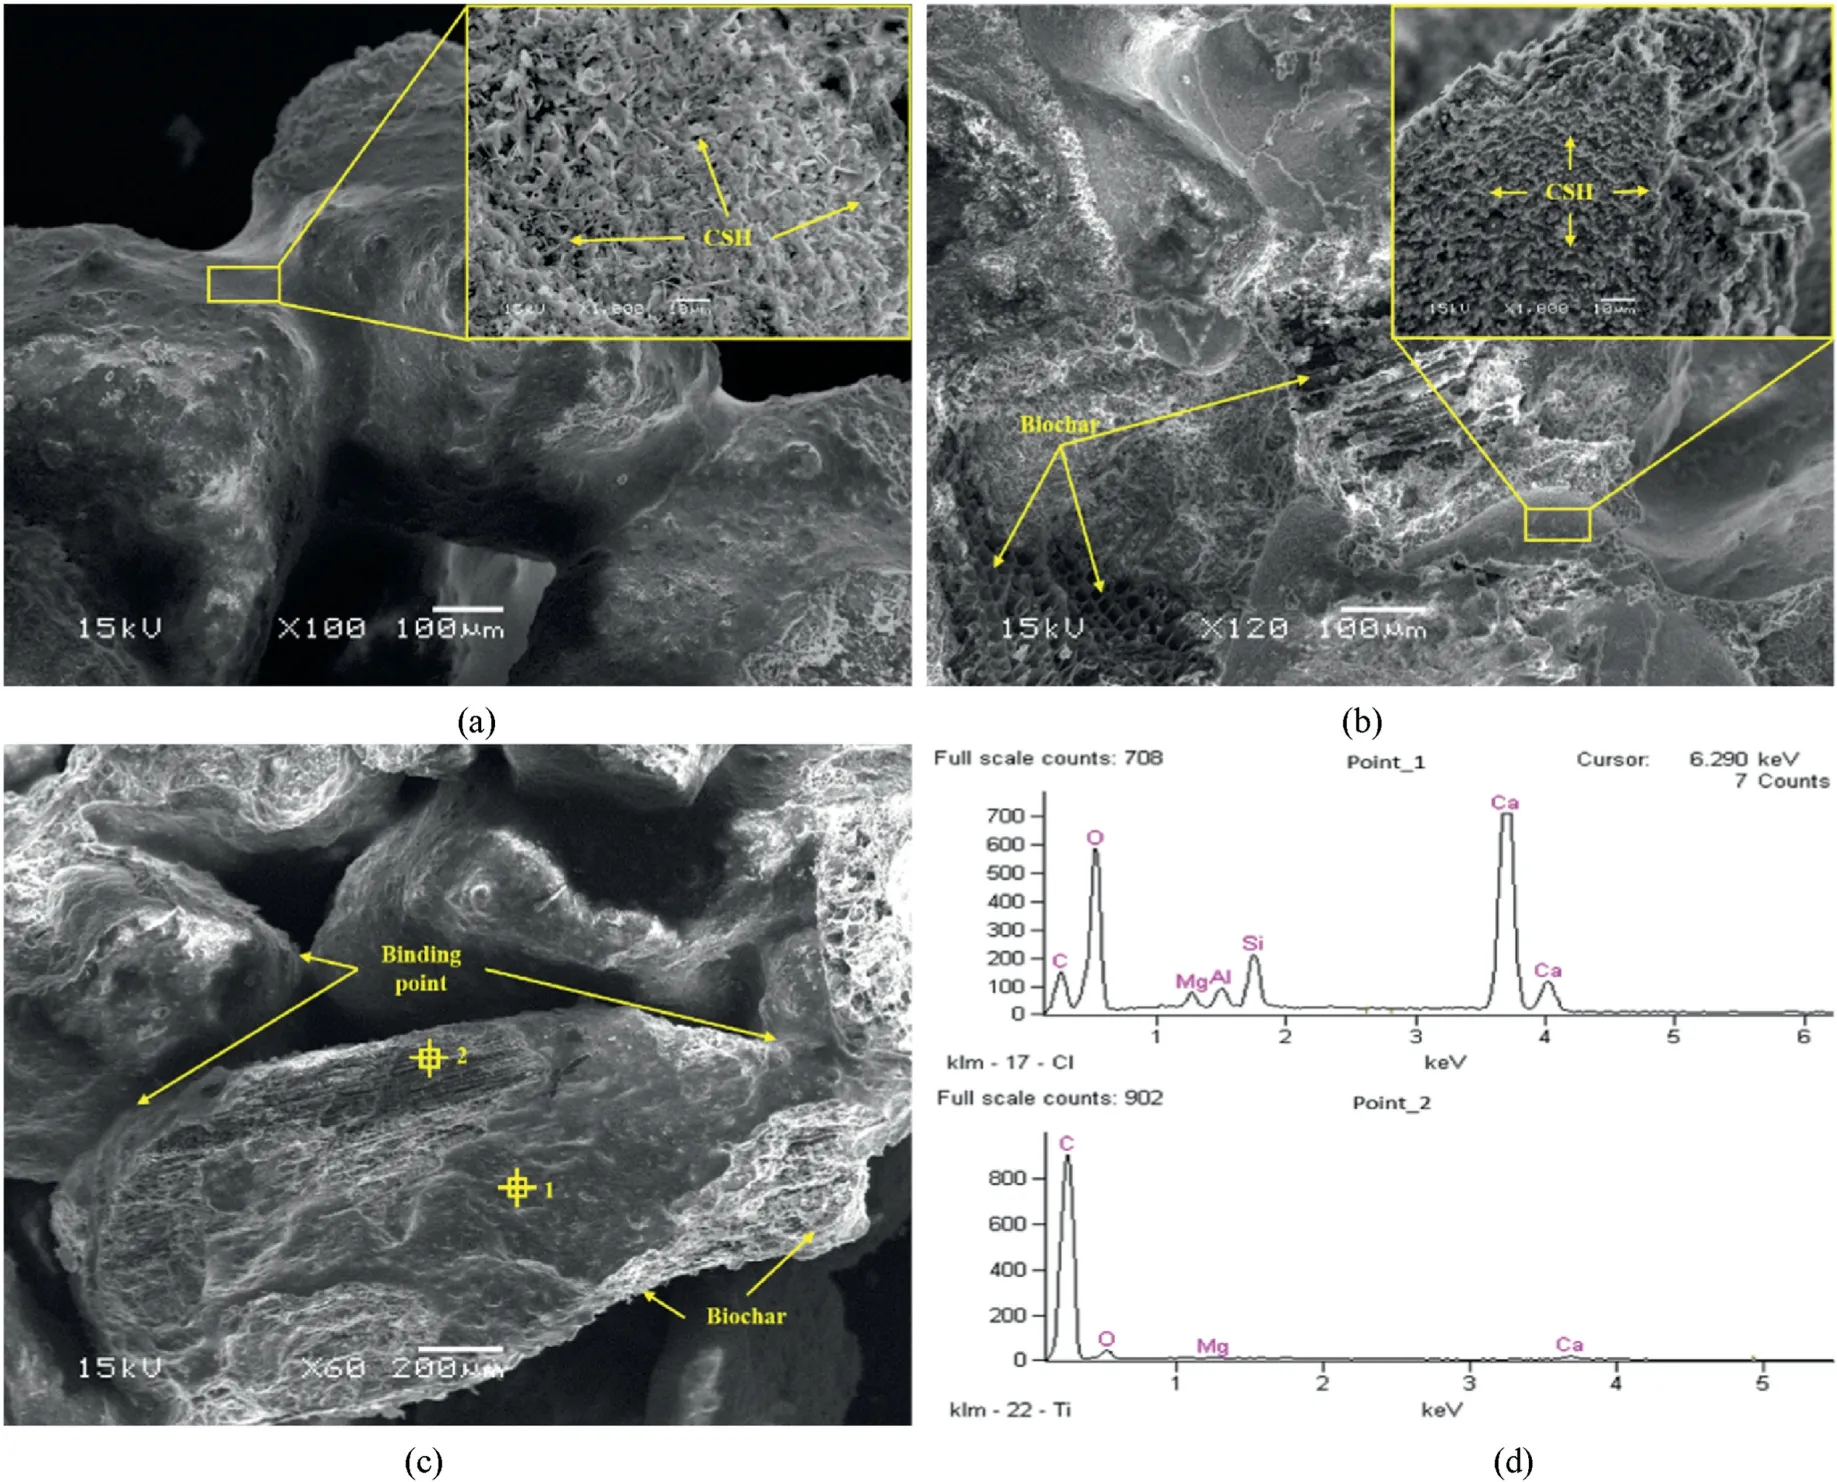
Fig.11.SEM images and EDS data of samples under the normal curing condition: (a) Sample without biochar cured for 90 d; (b) Sample with 0.149% biochar cured for 90 d; (c)Sample with 0.366% biochar cured for 90 d; and (d) EDS results of Points 1 and 2 as marked in (c).
Fig.12 shows the SEM images of samples subjected to sulfate attack.For both samples with and without biochar,the formation of gypsum could be identified.In addition, micro-cracks could be found along biochar-sand and biochar-biochar interfaces in both samples.Finally,EDS tests on two different erosion products(Points 1 and 2 in Fig.12c) confirmed that they were gypsum mixed with C-S-H, as shown in Fig.12.
Fig.13 shows the SEM images of samples subjected to 14 wetdry cycles.Micro-cracks could be observed in both samples with and without biochar.However,it seemed that more cracks existed in the biochar-amended sample, especially along the interfaces of biochar-hydration products (Fig.13b).Correspondingly, cracks could also be spotted with naked eyes in the samples after 14 wetdry cycles.In addition,the spalling of hydration products from sand grain surfaces was observed in both samples,which was attributed to the different thermal expansion coefficients between biochar and stabilized sand.Due to the high-temperature pyrolysis process,biochar is less sensitive to temperature change during wet-dry cycles (Cheng et al., 2018).
4.Discussion
The testing results reported in the current study demonstrated that the addition of a moderate amount of biochar in AAS could improve soil strength, stiffness, and water holding capacity in the long term.While adding an excessive amount of biochar was likely to be detrimental to strength and stiffness development, the ductility of the stabilized soil could be improved.Moreover,it was found that the addition of biochar in AAS,in general,had a marginal effect on soil resistance to sulfate attack,especially at high biochar contents.However, the resistance to wet-dry cycles slightly deteriorated with the biochar amendment.
The above-mentioned engineering and durability performance of biochar-amended AAS stabilized coral sand was associated with three-fold functions of biochar in the soil matrix, namely internal curing agent, micro-reinforcer, and mechanically weak point.The conceptual representation of these mechanisms is shown in Fig.14.The details of the three functions are explained below.
4.1.Internal curing agent
Biochar has a large internal pore volume and specific surface area.Thus,it has a superior water holding capacity(Gupta and Kua,2018; Mo et al., 2019).In the current study, the biochar was presaturated with water 8.34 times of its weight.When the presaturated biochar is mixed with AAS, this part of water reserved in biochar is not immediately available for hydration reactions.Therefore, the hydration degree and consequently strength and stiffness of biochar-AAS stabilized sand are lower during short term curing (Figs.2, 3 and 6).Nevertheless, as hydration continues, the water reserved in biochar is gradually released under the humiditygradient and contributes to the hydration product formation within the interior of biochar and densely packed around biochar-sand interfaces (Fig.11b).Moreover, the water reserved by biochar reduces the water evaporation,especially in the long run(Fig.6).Thus overall,there is more water available for AAS hydration reactions in biochar-amended samples than those without biochar.This contributes to higher strength and stiffness of AAS stabilized sand with moderate amounts of biochar in the long term(Figs.2 and 3).The similar concept of internal curing for biochar-concrete was reported by Gupta and Kua (2018) and Mo et al.(2019).
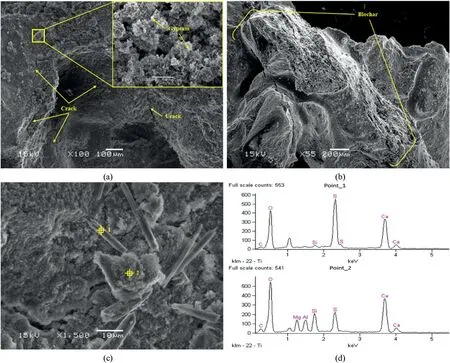
Fig.12.SEM images and EDS data of stabilized sand subjected to sulfate attack: (a) Sample without biochar soaked for 7 d; (b) Sample with 0.366% biochar soaked for 7 d; (c)Sample with 0.366% biochar soaked for 3 d; and (d) EDS results of Points 1 and 2 as marked in (c).
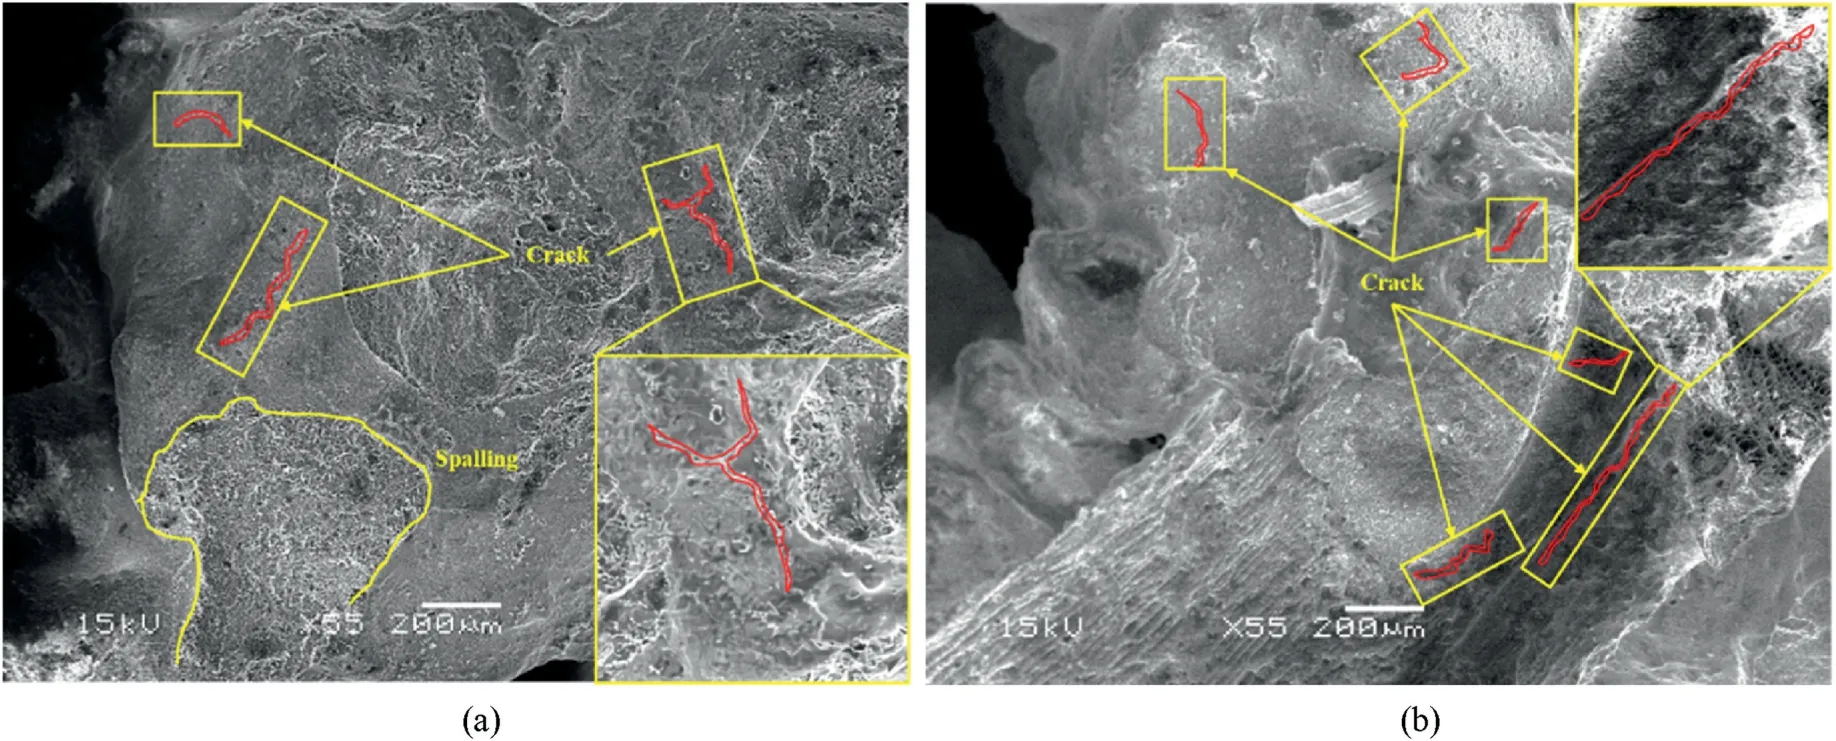
Fig.13.SEM images of stabilized coral sand samples subjected to wet and dry cycles: (a) Sample without biochar under 14 wet-dry cycles; and (b) Sample with 0.366% biochar under 14 wet-dry cycles.

Fig.14.Conceptual representation of biochar-AAS-sand matrix and its microscopic characteristics.
4.2.Micro-reinforcer
Biochar particles, especially the large ones, can span over the interfacial transition zone of AAS stabilized sand.As biochar particles are much more flexible when mixed with AAS, water, and sand, they can be twisted and fill small voids between the sand matrix.Biochar particles will gain strength and become stiffer,which can provide extra bonding points to strengthen the sample.From Fig.15a in the supplemental material,the twisted biochar can be found embedded into the pores between sand particles and the biochar surface is covered with AAS.Besides, from the SEM image in Fig.15b, the biochar was bonded to sand particles tightly and biochar can fill the voids between sand particles.They can contribute to the stress redistribution under external load and thus mitigate the brittle failure of the sample(Gupta et al.,2018).From the strain at failure obtained in UCTs,it is apparent that the addition of a substantial amount of biochar noticeably improved ductility(i.e.larger strain at failure)of AAS stabilized sand (Fig.5).
4.3.Mechanically weak point
While biochar could benefit the AAS stabilized sand as an internal curing agent and micro-reinforcer, its presence also introduces mechanically weak points into the soil matrix owning to its much lower strength compared with hydration products and sand grains.Under external loads, biochar particles will fracture and break much more easily while hydration products and sand grains remain intact, which can be observed in Fig.16a and b.The clear section of biochar particles indicates that the failure points are around the biochar surface.It should be noted, however, that whether the “mechanically weak point” mechanism dominates depends on the biochar content in soil matrix.When biochar content is low, the chance of biochar being part of a strong force network to transmit external loads,is also low.In that case,biochar fracturing and breakage will not significantly influence the initiation and development of soil failure and other mechanisms,namely internal curing agent and micro-reinforcer, are likely to dominate.This can explain why soil strength and stiffness could still be improved at moderate amounts of biochar (Figs.2 and 3).On the other hand, if a substantial amount of biochar is added to the system,biochar particles are more likely to be part of the strong force network and transmit external loads.Therefore, their fracturing and breakage will alter soil stress-strain behavior and reduce soil strength and stiffness (Figs.2 and 3).
In addition, the slightly deteriorated resistance over wet-dry cycles can also be explained by the “mechanically weak point”mechanism.Biochar and AAS hydration products have very different thermal expansion coefficients (Ma and Dehn, 2017).When subjected to wet-dry cycles, the volume changes of biochar and hydration products vary.The repeated differential expansion and shrinkage between biochar and hydration products will initiate micro-cracks along their interfaces, which ultimately leads to the failure of soil samples.The more the biochar presented in the soil matrix, the more the micro-cracks expected to be generated.Fig.13b can partially support this hypothesis.Therefore, the amendment of biochar in AAS stabilized sand weakens its resistance to wet-dry cycles.
4.4.Implications for practice
As waste-based cementitious materials have been increasingly used as alternatives to OPC, they will also find their potential markets in the soil chemical stabilization applications.It is imperative to develop appropriate additives that can further improve their engineering performance and/or durability, making them more durable, resilient, and sustainable.Based on the results obtained in this study, biochar as a by-product of waste biomass pyrolysis, is a promising additive that can improve the strength,stiffness,ductility,and water holding capacity of AAS stabilized soil while not noticeably compromising its durability.However, to maximize the benefits of biochar, its content has to be carefullycontrolled and proper curing is recommended in practice.Biochar properties can vary depending on the feedstock and pyrolysis conditions;hence the suitability of locally available biochar should be tested to confirm its beneficial improvement of soil stabilization.

Fig.15.Biochar serves as micro reinforcer under (a) Microscope and (b) SEM.
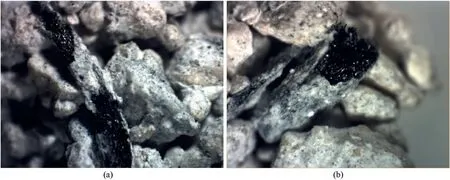
Fig.16.Biochar serves as a mechanically weak point: (a) Breakage of biochar along the axial direction; and (b) Breakage of biochar along cross radial direction.
5.Conclusions
In this study, the mechanical, physicochemical, durability, and microstructural characteristics of the biochar-amended AAS stabilized coral sand were investigated.The following conclusions can be drawn:
(1) The addition of moderate amounts of biochar was beneficial for strength and stiffness development in the long term.On the other hand,a high biochar content reduced soil strength and stiffness, particularly for those cured for a short period.Moreover,adding biochar in AAS stabilized coral sand could generally improve its ductility at the early age and/or with a high biochar dosage.
(2) Biochar amendment improved the water holding capacity of the stabilized sand.For samples cured for 3 d, 7 d and 14 d,there was a slight increase (0.3%-1.3%) in moisture content for samples with a high biochar dosage.For longer curing periods (28-90 d), the moisture content increased more notably with increasing biochar content.Samples with the highest biochar content(0.366%) exhibited 22%-36% higher moisture content than those without biochar.
(3) The addition of biochar only had a marginal effect on the strength development of AAS stabilized sand under sulfate attack, especially at a high biochar content.However, the resistance to wet-dry cycles slightly deteriorated with the biochar amendment.
(4) The observed engineering and durability performance of biochar-amended AAS stabilized coral sand was associated with three-fold functions of biochar in the soil matrix,namely internal curing agent, micro-reinforcer, and mechanically weak point.
Declaration of competing interest
The authors declare that they have no known competing financial interests or personal relationships that could have appeared to influence the work reported in this paper.
Acknowledgments
This study was financially supported by the Hawaii Department of Transportation (Grant No.2020-4R-SUPP), National Natural Science Foundation of China (Grant No.42007246) and Fundamental Research Funds for the Central Universities.
 Journal of Rock Mechanics and Geotechnical Engineering2023年3期
- Journal of Rock Mechanics and Geotechnical Engineering的其它文章
- Calibration of an elastoplastic model of sand liquefaction using the swarm intelligence with a multi-objective function
- Predicting and validating the load-settlement behavior of large-scale geosynthetic-reinforced soil abutments using hybrid intelligent modeling
- Development of mathematically motivated hybrid soft computing models for improved predictions of ultimate bearing capacity of shallow foundations
- Long-term decay of the water pressure in the osmotic tensiometer
- Combined load bearing capacity of rigid piles embedded in a crossanisotropic clay deposit using 3D finite element lower bound
- Numerical simulation of fatigue crack propagation in heterogeneous geomaterials under varied loads using displacement discontinuity method
