Long-term decay of the water pressure in the osmotic tensiometer
Hengshuo Liu, Harianto Raharjo, Hejun Du, Abul Halim Hamany
a Environmental Process Modelling Centre, Nanyang Environment and Water Research Institute, Nanyang Technological University,1 Cleantech Loop, 637141,Singapore
b Interdisciplinary Graduate School, Nanyang Technological University, 50 Nanyang Avenue, 639798, Singapore
c School of Civil and Environmental Engineering, Nanyang Technological University, 50 Nanyang Avenue, 639798, Singapore
d School of Mechanical and Aerospace Engineering, Nanyang Technological University, 50 Nanyang Avenue, 639798, Singapore
Keywords:High suction measurement Osmotic tensiometers Long-term pressure decay Polymer leakage Viscoelasticity of polymers
ABSTRACT Matric suction is an important state variable required for the assessment of unsaturated soil properties.Tensiometers are commonly used for direct matric suction measurement but have a limited measuring range up to 90 kPa due to the cavitation problem.Osmotic tensiometer(OT)can improve the measuring range of tensiometers by increasing the osmotic pressure of water to avoid the cavitation.However, the long-term water pressure decay that appeared in OTs caused a gradual decrease in their measuring range.In this study, crosslinked poly(acrylamide-co-acrylic acid) potassium salt (PAM-co-PAAK) was used for the preparation of OTs (five in total) to explore the mechanism of water pressure decay of OTs.The maximum water pressure in the OT versus the volume fraction of polymer filled in the OT was described based on the Flory-Huggins polymer theories and validated using WP4C dewpoint hygrometer.The long-term pressure decay of OT-1, OT-2, and OT-3 was observed for 130 d and constant pressures were found for OT-1 and OT-2, indicating that the pressure decay of OT was mainly caused by the stress relaxation of the polymer hydrogels,and standard linear solid(SLS)rheological model was appropriate to fit the decay data.For OT-1,OT-2 and OT-3,the theoretical osmotic pressure that was calculated based on the mass of retrieved polymer from OTs after 130-d pressure observation was higher than the actual osmotic pressure as observed, indicating that polymer leakage cannot explain the pressure decay of the OT.The ultraviolet-visible (UV-visible) spectrophotometry examined the change in polymer concentrations in the water containers of OT-4 and OT-5 and demonstrated that there was no increase in polymer leakage during the period of pressure decay of OT-4 and OT-5.As a result,the pressure decay of OT was not caused by polymer leakage.The results of this research suggested that the viscoelastic properties of polymers should be taken into consideration in further OT development.
1.Introduction
Soil suction is a state variable associated with unsaturated soils and it mainly comprises two parts(i.e.matric suction and osmotic suction).Matric suction results from the capillarity of soil particles on pore water,while osmotic suction depends on the dissolved salts that exist in the soil-water(Leong et al.,2003;Fredlund et al.,2012).Matric suction is important to analyze the behaviors and engineering properties of unsaturated soils and to solve various geotechnical problems related to unsaturated soils.Matric suction is defined as the difference between the pore-air and the porewater pressures (Fredlund et al., 2012).
Tensiometers consisting of a ceramic disk,a water chamber,and a pressure transducer are widely used for direct matric suction measurement (Guan and Fredlund,1997; Fredlund et al., 2012).In the measurement,the ceramic disk of the tensiometer is in contact with the soil, causing the water in the tensiometer to tend to flow into the soil and thus exhibiting a negative water pressure.Once the equilibrium of matric suction between the soil and the tensiometer is reached, the negative water pressure in the tensiometer can be read from the pressure transducer and this value is the matric suction of the soil.However, the measuring range of conventional tensiometers is limited to 90 kPa due to the possibility of cavitation of the water inside the tensiometer (Ridley and Burland, 1993;Guan and Fredlund,1997; Fredlund et al., 2012).
To overcome the cavitation problem existing in tensiometers,high-capacity tensiometer (HCT) is developed by pressurizing the water in the chamber with high pressure to dissolve the air bubbles or nuclei (Ridley and Burland, 1993; Guan and Fredlund, 1997;Ridley et al.,2003;Mendes et al.,2019).This method helps to avoid the appearance of air bubbles when the water is under high tension.A higher measuring range (>1500 kPa) can thus be achieved without the interference of air bubbles (Ridley and Burland,1993;Guan and Fredlund,1997; Mendes et al., 2019).However, both the preparation and the maintenance are tedious for HCT, and it was reported that the cavitation may still appear during the measurement(Guan and Fredlund,1997;Gong et al.,2018;Meghdad et al.,2018).Thus, it is recommended to post-check the cavitation problem for the application of HCT (Gong et al., 2018; Dainese and Tarantino, 2021).
Another method to overcome the cavitation problem is to develop the osmotic tensiometer(OT)that replaces the water in the tensiometer with polymer solutions or dry polymers to increase the osmotic pressure of water (Bocking and Fredlund, 1979; Bakker et al., 2007; van der Ploeg et al., 2010).The term “osmotic” was used to indicate the principle of this method.Water with a highly positive pressure can be used to measure high matric suction without causing the cavitation problem (Bakker et al., 2007).The measuring range of OT equals the value of the maximum water pressure during the pressure observation of OT.When placing OT in contact with the soil for matric suction measurement,a decrease in the water pressure of the OT will be induced until a new equilibrium is reached.This pressure decrease is the value of matric suction of the soil (Liu et al., 2021).Generally, high water-absorbent polymers (e.g.polyacrylamide, polyvinylpyrrolidone, polyethylene glycol, and sodium polyacrylate) are suitable for OT development(Bakker et al., 2007; Zohuriaan-Mehr and Kabiri, 2008; Liu et al.,2021).It was reported that the measuring range of OTs can be higher than 1500 kPa (Bakker et al., 2007; Rahardjo et al., 2021).However, the biggest problem in OT development is the pressure decay (i.e.the gradual drop of the observed pressure) during the pressure observation of OTs,which causes a gradual decrease in the measuring range of OTs.It was believed by previous researchers that the pressure decay was mainly caused by polymer leakage from OT; therefore, a high air-entry ceramic disk was combined with a semi-permeable membrane in the preparation of OT to prevent polymer leakage(Bocking and Fredlund,1979;Bakker et al.,2007; van der Ploeg et al., 2010).However, this solution cannot overcome the pressure decay and the problem of pressure decay still exists up to now.
In this study, the long-term decay of the water pressure in the OT and polymer leakage during the period of pressure decay were investigated experimentally.Related polymer theories were presented and used to analyze the behaviors of OTs.A 5-bar ceramic disk without semi-permeable membrane was applied for all OTs.The crosslinked poly(acrylamide-co-acrylic acid) potassium salt(PAM-co-PAAK) was used for the preparation of OTs.The pressure of water versus the volume fraction of polymer filled in the OT was established and validated by the Flory-Huggins polymer theories.The pressure variations of some OTs were observed for 130 d and the pressure decay data of these OTs were analyzed based on the rheological properties of polymer hydrogels.After the pressure observations, the polymers were retrieved from OTs and their masses were weighed and used to calculate the theoretical pressures for comparison with the actual pressures at the end of the observations.The polymer leakage of some OTs during their pressure observations was monitored using an ultraviolet-visible(UVvisible) spectrophotometer to analyze its effect on the pressure decay of OT.
2.Material and methods
2.1.Preparation and pressure observation of OT
Fig.1 shows the prototype of the OT used in this study.The pressure transducers were purchased from Keller,Switzerland,and have a measuring range up to 2500 kPa.The crosslinked PAM-co-PAAK was used for the preparation of the OT.This polymer belongs to super water-absorbent polymers and was selected due to the existence of ion component in the polymer network,which will be helpful to study the contributions of different components of polymer hydrogels to the water pressure of OT by correlating polymer theories (Horkay et al., 2000; Wack and Ulbricht, 2009;Ganji et al., 2010).
When preparing OTs, a 5-bar ceramic disk cap was firstly saturated with distilled water before use.Then, a certain mass of polymer powders was filled into the chamber of the OT (detailed masses of dry polymer filled in each OT can be found in Table 1).Finally, the pressure transducer was encapsulated using the ceramic disk cap and connected to the data acquisition system through a cable.
In this study, five OTs were prepared and basic information about these five OTs is listed in Table 1.Different masses of polymer were filled into the chamber of the OT to study the relationship between polymer mass and the maximum water pressure in the OT(i.e.the initial measuring range of the OT).Besides,the true density of the polymer was measured by the gas pycnometer.Considering a defined volume of the polymer chamber of the OT, the volume fraction of the polymer filled in the OT can be calculated as
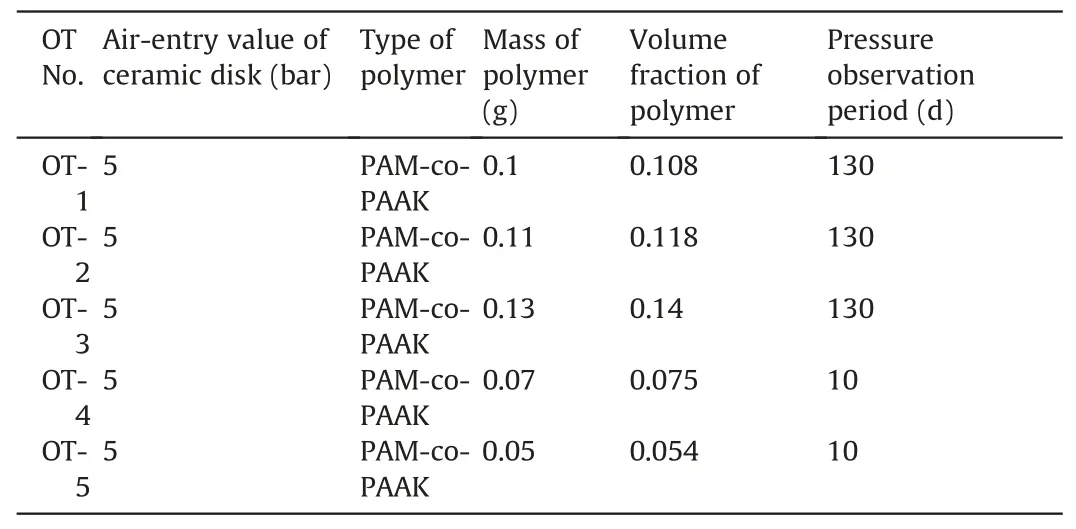
Table 1Basic information of prepared OTs.
where φPis the volume fraction of the polymer,VPis the volume of the polymer, V is the volume of the polymer chamber of OT(0.628 cm3),mPis the mass of polymer,and ρPis the true density of the polymer (1.48 g/cm3).
After the preparation of the OT,it was placed in a container filled with distilled water for pressure observation,as shown in Fig.2.The container was covered with a lid to avoid the evaporation of water during the observation of pressure variation.Once the OT was placed in water,water began to flow into OT to wet the dry polymer.The dry polymer absorbed water to form hydrogels and gradually filled up the whole chamber.Meanwhile,the water pressure of the OT started to build up during this water absorption process and finally reached a maximum pressure when all the hydrogels had the same degree of swelling and uniformly filled up the polymerchamber of the OT (Wack and Ulbricht, 2007).The pressure variation of each OT and the change in the ambient temperature were observed and recorded for further analyses.
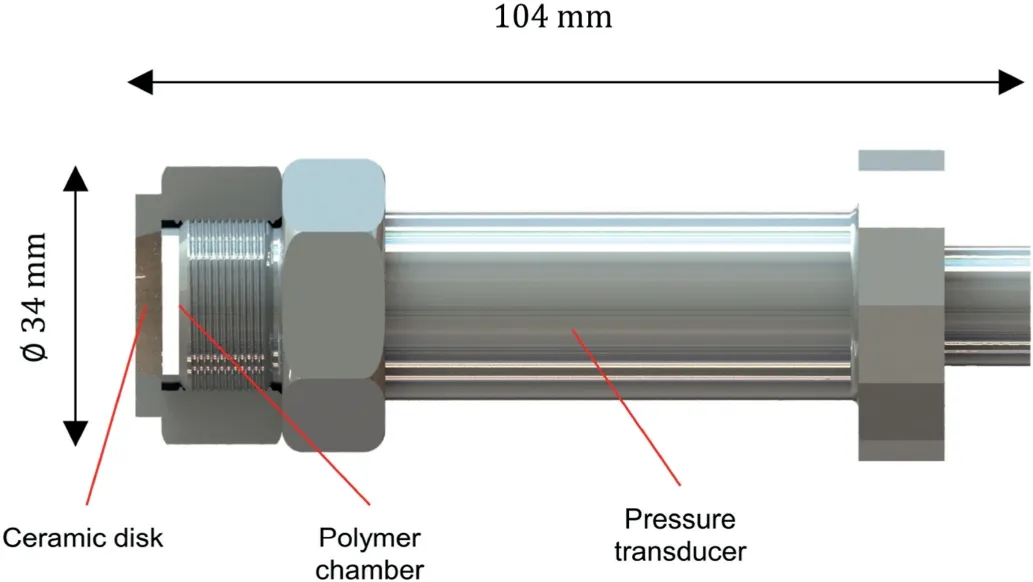
Fig.1.Prototype of the OT.
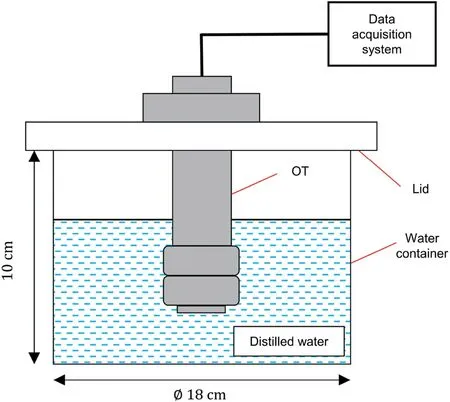
Fig.2.Setup used to observe the pressure variations of OTs.
The pressure variations of OT-1,OT-2,and OT-3 were monitored for more than 130 d and their long-term pressure decay behaviors were studied.In contrast, OT-4 and OT-5 were monitored for only 10 d with the main purpose of studying the influence of polymer leakage on the pressure decay of OTs.For OT-4 and OT-5, the polymer concentration of the water in the container will be monitored to investigate the presence of polymer leakage from OTs.
2.2.Retrieval of polymers from OTs after pressure observation
The polymers in OT-1, OT-2, and OT-3 were retrieved from the polymer chamber of the OT after the long-term pressure observation.These OTs were firstly removed from the water container and wiped with tissue paper.Then, the polymer hydrogels in the polymer chamber were retrieved by unscrewing the ceramic disk cap from the pressure transducer.The retrieved polymer hydrogels were dried in an oven at 105°C for 12 h to remove the water completely.Finally,the masses of the dried polymers were weighed and compared with the masses of polymers filled in the polymer chamber of OTs during the preparation.
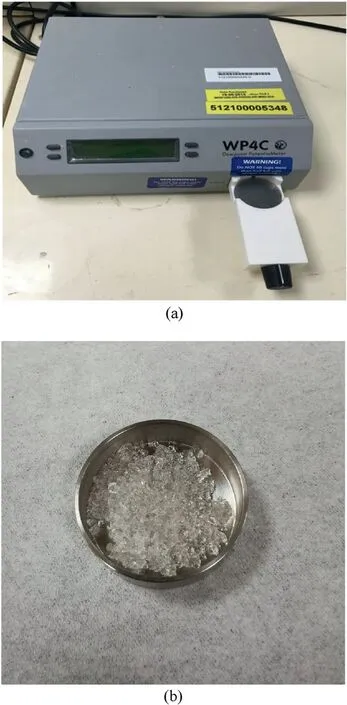
Fig.3.(a) WP4C dewpoint hygrometer and (b) Prepared polymer hydrogel by mixing the dry polymer with distilled water at a certain ratio.
2.3.Measurement of the water pressure in the polymer hydrogel by the WP4C dewpoint hygrometer
The water pressure in the polymer hydrogel as a function of the volume fraction of polymer was established using the WP4C dewpoint hygrometer (Meter Group, USA).It is noted that the osmotic suction of the water in the polymer hydrogel as measured by the WP4C dewpoint hygrometer was regarded as the water pressure in the polymer hydrogel because both of them represent the negative water potential.As shown in Fig.3, the dry polymer was mixed with distilled water uniformly at certain ratios to prepare polymer hydrogels.Then,the hydrogel was placed in the sampling container and kept in the WP4C dewpoint hygrometer to obtain the water pressure (i.e.the negative water potential) in the polymer hydrogel (Rahardjo et al., 2019).The masses of dry polymer and distilled water as well as the measured water pressure were recorded accordingly.Different from Eq.(1) that was used for the calculation of the volume fraction of the polymer inside the OT,the volume fraction of the polymer in the hydrogel is calculated based on Eq.(2)that considers the volume of the swelling hydrogel to be unconfined.Finally, the water pressure in the polymer hydrogel versus the volume fraction of the polymer can be plotted.where VWis the volume of the distilled water,mWis the mass of the distilled water, and ρWis the density of the distilled water (1 g/cm3).
2.4.Measurement of polymer concentration by UV-visible spectrophotometry
When observing the pressure variations of OT-4 and OT-5 using the setup shown in Fig.2, the volume of water in the container of OT-4 and OT-5 was controlled as 2 L exactly to quantify the polymer concentration in the water due to polymer leakage from OTs.The water samples (4 mL every time) were collected from the water containers of OT-4 and OT-5 at certain intervals and scanned using a UV-visible spectrophotometer (Shimadzu UV-1800 UV-visible scanning spectrophotometer).A 2 L volume of water in the container ensured that the polymer concentration can be measured many times(2 L»4 mL).The absorbency spectra were established in the wavelength range of 190-300 nm to quantify the polymer concentration in the water samples(Al Momani and Örmeci,2014).
To build a reference absorbency spectrum, the same type of polymer was mixed with distilled water in different ratios to prepare polymer solutions.The absorbency spectra of these polymer solutions were established to analyze the magnitude and the variation of polymer concentration in the water samples collected from the containers of OT-4 and OT-5.
3.Polymer theories related to OT
3.1.Osmotic pressure of water in the polymer hydrogel
The osmotic pressure of water increases when it enters the crosslinked polymer network to form the hydrogel.The osmotic pressure of water in the polymer network can be appropriately explained by the Flory-Huggins polymer theories considering the different contributions of polymer-water mixing, elasticity caused by crosslinking,and mobile ions in the polymer network.The total osmotic pressure of water can be described by the following equation(Flory,1953;Horkay et al.,2000;Wack and Ulbricht,2009;Chanda, 2013):
where ptotalis the total osmotic pressure, pmixis the mixing contribution to the total osmotic pressure, pelis the elasticity contribution to the total osmotic pressure, and pionis the ions contribution to the total osmotic pressure.
The contribution of polymer-water mixing can be expressed as(Flory,1953; Chanda, 2013):
where R is the universal gas constant(i.e.8.31432 J/(mol K)),T is the absolute temperature,V1is the molar volume of water,and χ is the interaction parameter.
The contribution of elasticity can be expressed as (Chanda,2013):
where v2is the specifci volume of polymer (the reciprocal of polymer density,ρP),is the average molecular weight of chains between crosslinks, andis the number-averaged molecular weight of polymer.
It is noted that pelis always negative and reduces the ptotalof water.Specifically, the higher the degree of crosslinking (i.e.the smaller the)is,the smaller the ptotalwill become.Eq.(5)can be simplified as follows considering→∞for a crosslinked polymer network(Caccavo et al., 2018):
The contribution of mobile ions in the polymer network can be expressed as (Horkay et al., 2000):
where csolis the ion concentration in the solution,i is the degree of ionization, and Vmis the molar volume of the monomer unit of polymer.
If the polymer was mixed simply with the distilled water, the csolin Eq.(7)can be regarded as 0 and thus pioncan be simplified as follows, indicating a linear relationship between pionand φP.
Combining Eqs.(4)-(8), the ptotalof water in the polymer hydrogel can be described by Eq.(9):
Since the polymer used for the preparation of OTs is crosslinked PAM-co-PAAK,the ptotalof water in the polymer hydrogel should be studied based on Eq.(9).In this study,Eq.(9)will be used to fit the experimental data obtained from the WP4C dewpoint hygrometer to study the osmotic pressure of water as a function of the volume fraction of polymer in the polymer hydrogel.
3.2.Stress relaxation behavior of polymer hydrogels
As a type of viscoelastic material, the stress of polymer hydrogels will decrease as a function of time when a constant strain is applied on them (i.e.stress relaxation behavior).The real physics behind the relaxation may be the movement of the polymer network as well as the breaking and reformation of cross-links in the polymer network in response to the strain applied to the polymer hydrogel(Caccavo et al.,2018).The energy of the polymer hydrogel dissipates in this process and thus a decrease in the stress(i.e.stress relaxation) can be observed.The generalized Maxwell model combining a spring in parallel with“n”Maxwell elements is appropriate to predict the stress relaxation behavior of polymer hydrogels(Caccavo et al.,2018).Especially,the standard linear solid(SLS) rheological model is a generalized Maxwell model with only 1 Mx element in parallel with a spring.The relaxation modulus G(t)of the SLS model can be represented as
where G(t) is the relaxation modulus, G1is the elastic modulus of the relaxed polymer hydrogel, G2is the viscous modulus of the relaxed polymer hydrogel,τRis the relaxation rate constant,and t is the relaxation time.
It is noted that G1and G2are different from the storage modulus G'and loss modulus G''that can be obtained from the oscillatory shear test by using the rheometer (Caccavo et al., 2018).Eq.(10)shows that the viscosity energy of the polymer hydrogel continues to decrease with time while only the elasticity energy remains in the end.
The formation of polymer hydrogel when water enters the chamber of the OT can be regarded as a compression state of a swelling polymer hydrogel.Thus, the confined volume of the polymer chamber of OT will cause the stress relaxation of polymer hydrogel and thus the decrease in the observed pressure.In this study, the SLS model will be used to fit the experimental pressure decay data of OTs.
4.Results and discussion
4.1.Water pressure as a function of the volume fraction of polymer
Fig.4 shows a typical water pressure variation in OT-3 after placing it in distilled water for long-term pressure observation.Phase I represents the development of the water pressure in the OT as the polymer hydrogels gradually filled up the chamber of the OT.The maximum water pressure was reached when all the hydrogels had the same degree of swelling and uniformly filled up the whole chamber of the OT (Wack and Ulbricht, 2007).Phase II represents the pressure decay of the OT after the water pressure development process.The slight fluctuation of the observed pressure shown in Fig.4 was due to the variation of ambient temperature.
The maximum water pressures of OTs were plotted against their corresponding volume fraction of the polymer filled in OTs in Fig.5 for comparison with the result of WP4C measurement.The water pressure in the polymer hydrogel as measured by the WP4C versus the volume fraction of the polymer was firstly fitted using Eq.(9)based on the following parameters: R = 8.31432 J/(mol K), T =298.15 K,V1= 18 cm3/mol,χ = 0.58,ρP= 1.48 g/cm3,and Vm=
103.62 cm3/moland i were the variable parameters, and the fitting result shows that= 1500 g/mol and i = 0.61 with R2=0.98.It shows that the water pressure (ptotal) in the polymer hydrogel was mainly dependent on the contribution of mobile ions in the polymer network(pion)in comparison to the contributions of polymer-water mixing (pmix) and elasticity (pel) when the volume fraction of the polymer (φP) ranged from 0 to 0.2, which is in agreement with the result from Wack and Ulbricht (2009).
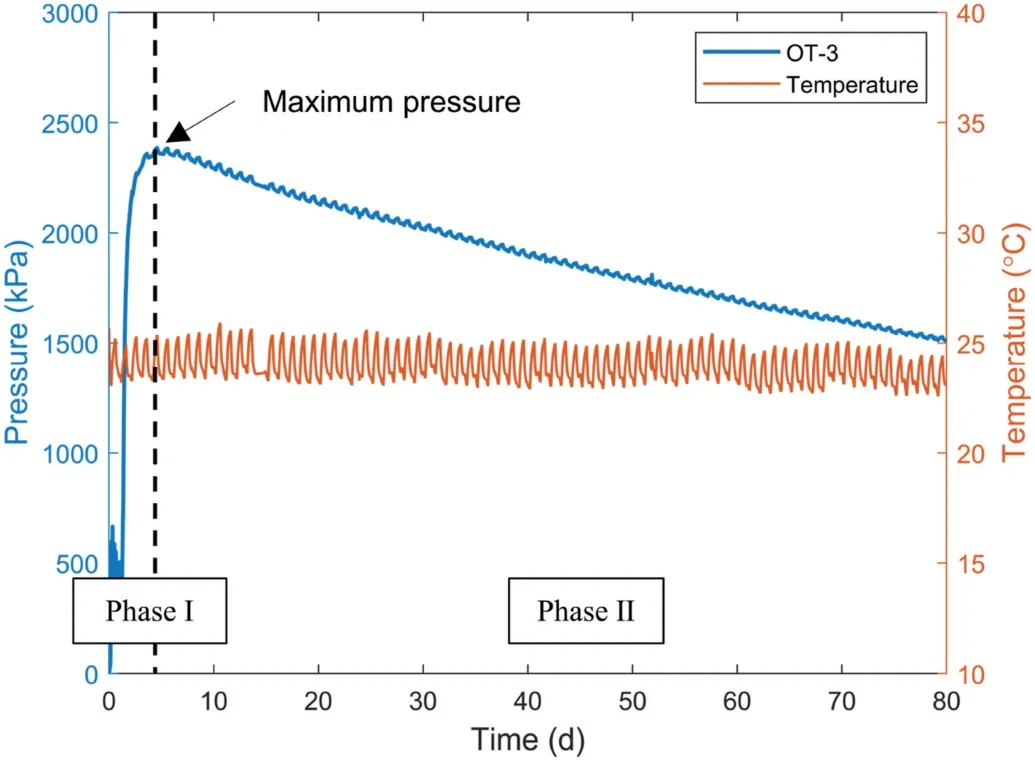
Fig.4.Water pressure variation in OT-3.Phase I indicates the development of the water pressure in the OT, and Phase II denotes the decay of the water pressure in the OT.
Fig.5 also shows that the maximum water pressure in the OT versus the volume fraction of polymer that filled in the OTcomplied with the Flory-Huggins polymer theories.The maximum water pressure in the OT increased nonlinearly with the increase in the mass of polymer filled in the OT.It shows that the WP4C dewpoint hygrometer can provide a reference when preparing OT, and a desired measuring range of OT can be realized by following the reference to fill a certain mass of polymer in OT.However, the continuous pressure decay of OTs that occurred once the maximum pressure was reached as shown in Fig.4 cannot be explained by the Flory-Huggins polymer theories.
4.2.Pressure decay of OT
Figs.6 and 7 show the pressure decay of all OTs once the maximum pressure was reached (i.e.Phase II of the pressure variations in OT).The initial pressure at 0 d is the maximum water pressure in the OT.
The same pressure decay occurred in the development of OTs by other researchers(Bocking and Fredlund,1979;Bakker et al.,2007;Rahardjo et al.,2021).These researchers believed that the pressure decay was caused by the leakage of small-size polymer molecules,thus they tried to use a high air-entry ceramic disk with an air-entry value (AEV) of 15 bar together with a membrane to avoid the leakage of polymers.However, this method cannot avoid the pressure decay problem completely.As a comparison,only a 5-bar ceramic disk without a membrane was used for all OTs in this study,which has larger pore sizes than the combination of the ceramic disk with a semi-permeable membrane employed by other researchers.The difference in the result of this study and the previous works is that constant pressures were observed after 100 d during the pressure observations of OT-1 and OT-2,as shown in Fig.6.The osmotic pressure of OT-3 kept decreasing but displayed a tendency to reach a constant value.
The SLS rheological model introduced in Section 3.2 was used to fit the long-term pressure decay data of OT-1, OT-2, and OT-3 shown in Fig.6.Based on the SLS model, the fitting parameters were modified:
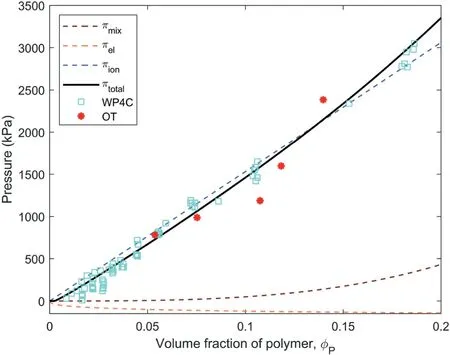
Fig.5.Water pressure as a function of volume fraction of polymer.
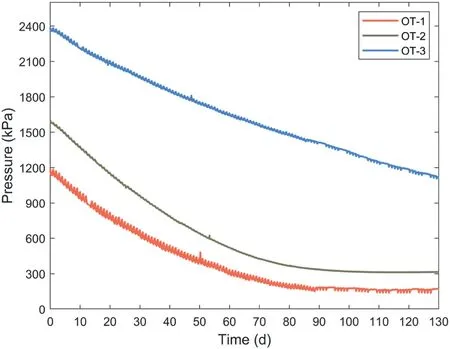
Fig.6.Pressure decay of OT-1, OT-2, and OT-3.
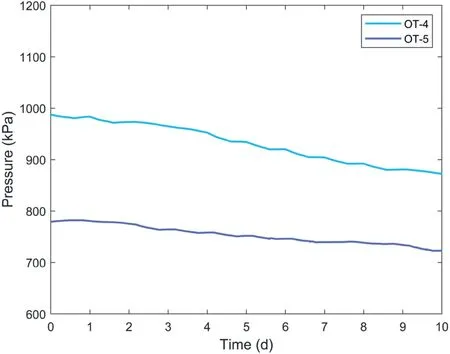
Fig.7.Pressure decay of OT-4 and OT-5.
where p(t) is the osmotic pressure at time t, p1is the osmotic pressure at infinite time,p2is the total osmotic pressure decay,and τ is the rate constant.
The results of curve fitting and the fitting parameters are shown in Fig.8 and Table 2,respectively.The coefficient of determination R2and the root mean square error (RMSE) were presented to evaluate the fitting performance.

Table 2Parameters of fitting curves in Fig.8.
The high R2(>0.99) of the fitting curves shows that the SLS rheological model can fit the pressure decay of OTs properly,which demonstrates that the pressure decay of OTs was related to the stress relaxation of polymer hydrogels.Compared with the fitting equation proposed by Bakker et al.(2007) which indicated that a zero water pressure of OT was reached after the long-term decay,Eq.(11) provides a more reasonable explanation for the long-term decay of the water pressure of OT.Eq.(11)shows that the polymer hydrogel inside the OT will undergo a stress relaxation process and c onstant water pressure will be reached when the stress relaxation was completed (the pressures of OT-1 and OT-2 became constant after around 100 d, as shown in Fig.6).Thus, polymers with fast stress relaxation process (e.g.crosslinked non-ionic polyacrylamide) may be a better candidate for new OT development because the measuring range of OTs will remain constant for a long time once the stress relaxation was completed(Liu et al., 2021).

Fig.8.Curve fitting of pressure decay data of OT-1, OT-2, and OT-3.
4.3.Retrieval of polymers from OT-1, OT-2, and OT-3
The polymers were retrieved from OT-1,OT-2,and OT-3 after the 130-d pressure decay observation.The retrieved polymers were weighed and the results are listed in Table 3.The remaining percentage of the polymer was calculated as
where Re is the polymer remaining percentage, mfis the mass of polymer filled in the OT at the preparation stage,and mris the mass of polymer retrieved from the OT after long-term pressure observation.
Based on the masses of the remaining polymers retrieved from OT-1, OT-2, and OT-3, the corresponding theoretical water pressures generated by these remaining polymers were calculated using the fitting curve (i.e.ptotal) shown in Fig.5.These theoreticalwater pressures were compared with the actual water pressures of OT-1,OT-2,and OT-3 after the 130-d pressure decay observation,as presented in Fig.9.Fig.9 shows that the theoretical water pressures are much higher than the actual water pressures, indicating that the long-term water pressure decay of OTs cannot be attributed to polymer leakage from the chamber of OTs as believed by previous researchers.Besides, Table 3 shows that the masses of polymers retrieved from OT-1,OT-2,and OT-3 are still higher than the masses of polymer filled in OT-4 and OT-5(0.07 g and 0.05 g,respectively).However,the observed pressures of OT-1 and OT-2 appeared to be lower than the maximum water pressures in OT-4 and OT-5, as shown in Figs.6 and 7.This also demonstrates that the pressure decay of OTs was not caused by polymer leakage.

Table 3Retrieval of polymers from OT-1, OT-2 and OT-3.
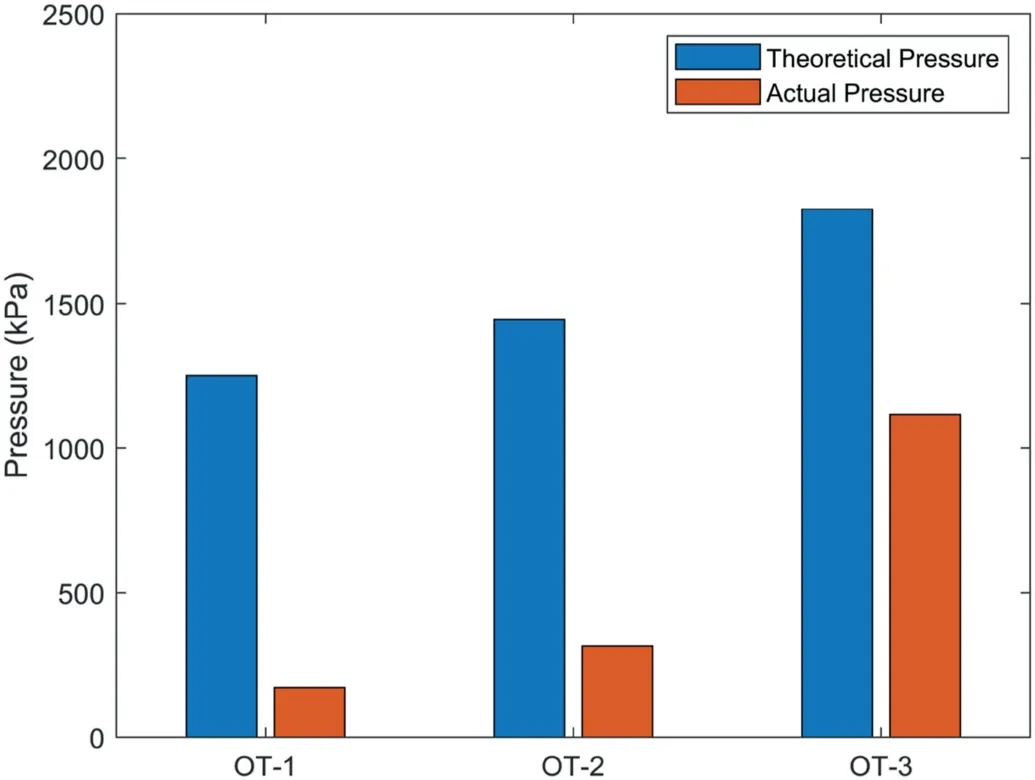
Fig.9.Comparison of theoretical water pressures calculated from the masses of retrieval polymers and actual water pressures of OTs after the 130-d pressure observation.
4.4.Polymer concentrations of water samples collected from the containers of OT-4 and OT-5
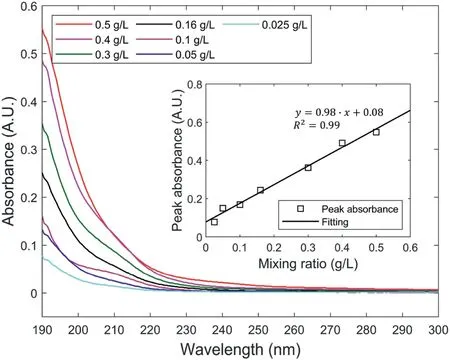
Fig.10.Absorbance spectra of polymer solutions by mixing the polymer with distilled water at different ratios.Peak absorbance at the wavelength of 190 nm of polymer solutions versus mixing ratio is plotted in the sub-figure.
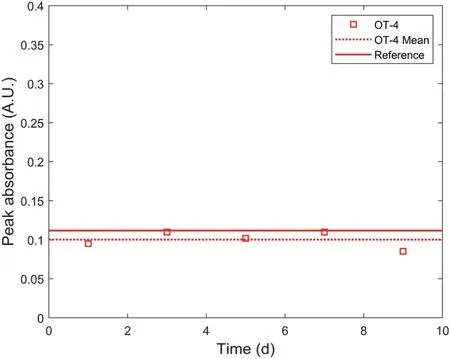
Fig.11.Peak absorbance variations of water samples collected from the water container of OT-4 at certain intervals.
To verify the effect of polymer leakage on the water pressure decay of OTs,the polymer concentration of water samples collected from the containers of OT-4 and OT-5 were tested by a UV-visible spectrophotometer.The polymer concentrations of these water samples were quantified by a reference shown in Fig.10, in which the dry polymer was mixed with distilled water at different ratios and the mixed solutions were tested by the UV-visible spectrophotometer.The absorbency spectra in Fig.10 show that there was only one peak absorbance at the wavelength of 190 nm.These peak absorbances were plotted against the mixing ratio in the sub-figure.The linear relationship between the peak absorbance at the wavelength of 190 nm and the mixing ratio demonstrates that the polymer concentration of water samples can be represented by the peak absorbance at 190 nm.Because the crosslinked polymer cannot dissolve in water but forms hydrogel when mixed with distilled water, the reference absorbency spectra reflected the concentration of small soluble polymer molecules that previously existed in the crosslinked polymer network.The ratio of these soluble polymer molecules to the raw polymer was supposed to be a constant resulting from the synthesis methods adopted to produce the polymer(Zohuriaan-Mehr and Kabiri,2008).Accordingly,the peak absorbance of the reference polymer solutions was expected to show a linear relationship with the polymer/water mixing ratios.
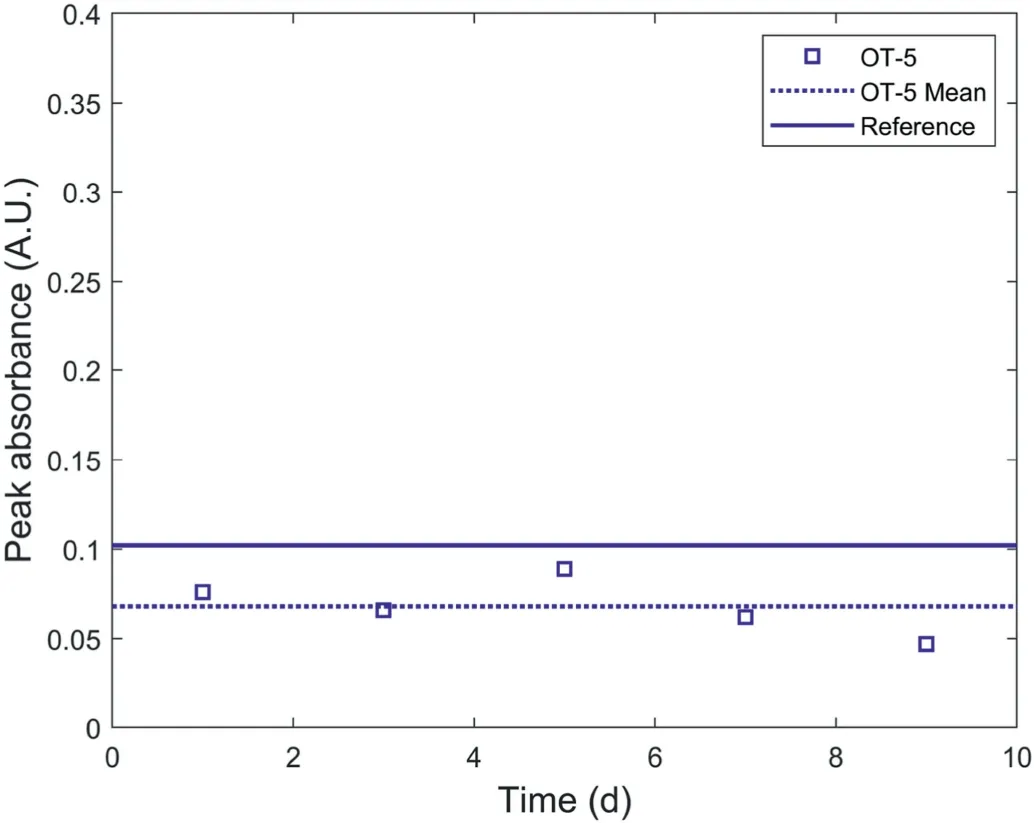
Fig.12.Peak absorbance variations of water samples collected from the water container of OT-5 at certain intervals.

Fig.13.Schematic description of polymer molecules distribution during the observation of polymer concentrations: (a) When the OT was initially placed in distilled water; (b)When the OT was under polymer concentration observation; and (c) When the ceramic disk was replaced by a molecule-selective membrane.
The values of peak absorbance at 190 nm of water samples collected from the container of OT-4 and OT-5 are shown in Figs.11 and 12,respectively for comparison with the reference absorbency spectra.As the water in the containers of OT-4 and OT-5 was controlled as 2 L(see Fig.2)and the masses of the polymer filled in OT-4 and OT-5 are 0.07 g and 0.05 g, respectively, the peak absorbance values of the water samples collected from the containers of OT-4 and OT-5 were compared with the reference peak absorbance values at the mixing ratio of 0.035 g/L and 0.025 g/L in the subfigure of Fig.10.Figs.11 and 12 show that the values of peak absorbance almost remained constant during the observation,indicating that the polymer concentration in the water containers of OT-4 and OT-5 remained constant during the period of water pressure decay of OT-4 and OT-5 as shown in Fig.7.As a result, it can be concluded that the pressure decay of OT was not caused by polymer leakage because there was no increase in polymer leakage during the period of water pressure decay of OT.
The monitoring of polymer concentration variations using UVvisible spectrophotometry also helps to understand the movement of polymer molecules due to polymer leakage under different conditions.As shown in Fig.13a, the OT was initially placed in the water container and both large and small polymer molecules were confined in the chamber of OT.When water filled up the chamber of OT gradually, small polymer molecules flowed out of OT and distributed uniformly in and outside the chamber of OT while only large polymer molecules were confined in the chamber of OT as shown in Fig.13b.The same concentration of small molecules in and outside the chamber of OT was validated in Figs.11 and 12 as the polymer concentration in the water container remained constant.The same concentration of the small polymer molecules in and outside the OT would not cause the osmotic pressure difference between the OT and the water in the container while only the large molecules confined in the OT caused the osmotic pressure difference.As a comparison, if the ceramic disk was replaced by a molecule-selective membrane that only allows water to flow freely as shown in Fig.13c, the small polymer molecules would be confined in the OT and thus cause the osmotic pressure difference,resulting in the maximum water pressure of OT in Fig.13c being higher than the maximum water pressure of OT in Fig.13b.It is thus concluded that the mass of polymer inside the OT became less due to the leakage of small polymer molecules and resulted in the reduced maximum water pressure in the OT.
By combining the results of UV-visible spectrophotometry and the measurement of polymer remaining percentage(Section 4.3),it strengthens the conclusion that the long-term water pressure decay that occurred in OTs was mainly due to the viscoelastic nature of polymer materials instead of polymer leakage.Accordingly,further development of OTs should be focused on the selection of polymers instead of on the design of OTs (e.g.the addition of the semi-permeable membrane when preparing OTs is not necessary).
5.Conclusions
Compared with conventional tensiometers, polymer-filled OTs are able to realize a higher measuring range of matric suction.The measuring range of OT equals the value of the maximum water pressure during the pressure observation of OT,but this measuring range keeps decreasing with time due to the pressure decay problem.This study explored the mechanism of long-term pressure decay of OTs from the perspective of polymer properties.The following conclusions can be drawn based on the obtained results:
(1) The osmotic pressure of water in the polymer hydrogel as a function of the volume fraction of the polymer can be established using WP4C dewpoint hygrometer.The maximum water pressure in OTs versus the volume fraction of polymer filled in OTs showed an agreement with the WP4C measurement, indicating that the WP4C measurement can provide a reference when preparing the OT for a desired measuring range by filling a certain mass of polymer.
(2) A constant water pressure after the pressure decay was observed for OT-1 and OT-2, indicating that the long-term pressure decay of OTs was mainly caused by the stress relaxation of polymer hydrogels confined in the chamber of OT.The pressure decay of the OT can be fitted by the SLS rheological model appropriately.
(3) For OT-1, OT-2, and OT-3, the theoretical osmotic pressure that was calculated based on the mass of retrieved polymer from OTs after long-term pressure observation (130 d) was higher than the actual osmotic pressure as observed,indicating that polymer leakage cannot explain the pressure decay of OT.
(4) The UV-visible spectrophotometry examined the change in polymer concentrations in the water containers of OT-4 and OT-5 and demonstrated that there was no increase in polymer leakage during the period of pressure decay of OT-4 and OT-5.As a result, the pressure decay of OT was proved not caused by polymer leakage.
The results suggest that there is no need to employ a semipermeable membrane in OT to prevent polymer leakage as previously adopted by researchers because the pressure decay of the OT is not caused by polymer leakage.Instead, since the long-term water pressure decay is mainly due to the stress relaxation of polymer hydrogels inside the OT, the viscoelastic properties of polymers should be taken into consideration for further development of new OTs.The polymer with a fast stress relaxation process and having a high constant pressure after the completion of the stress relaxation (e.g.crosslinked non-ionic polyacrylamide) is expected to be a promising candidate for the new generation of OTs.
Declaration of competing interest
The authors declare that they have no known competing financial interests or personal relationships that could have appeared to influence the work reported in this paper.
Acknowledgments
The first author would like to express thanks to the scholarship provided by Nanyang Environment and Water Research Institute(NEWRI),Interdisciplinary Graduate School,Nanyang Technological University, Singapore.
 Journal of Rock Mechanics and Geotechnical Engineering2023年3期
- Journal of Rock Mechanics and Geotechnical Engineering的其它文章
- Development of mathematically motivated hybrid soft computing models for improved predictions of ultimate bearing capacity of shallow foundations
- Effects of intermediate stress on deep rock strainbursts under true triaxial stresses
- A post-peak dilatancy model for soft rock and its application in deep tunnel excavation
- Numerical simulation of fatigue crack propagation in heterogeneous geomaterials under varied loads using displacement discontinuity method
- Combined load bearing capacity of rigid piles embedded in a crossanisotropic clay deposit using 3D finite element lower bound
- Predicting and validating the load-settlement behavior of large-scale geosynthetic-reinforced soil abutments using hybrid intelligent modeling
